Embed Size (px)
Citation preview
January 31, 2014
Overview of Earnings for 3Q FY2013
Japan Exchange Group, Inc.

I. Overview of Earnings for 3Q FY2013
(April 1 – December 31, 2013)
2
[Regarding JPX Earnings for previous Fiscal Year] - The consolidated financial statements of Japan Exchange Group, Inc. (JPX) is created based on this combination succeed the consolidated financial statements of former
TSEG in accordance with accounting standards pertaining to corporate combination. - Since an establishment of JPX was on January 1, 2013, figures for 4Q FY2012 or later are figures of the combined company, which is comprised of former TSEG and
former OSE. Also, As a result of a tender offer for shares of the former OSE by former TSEG, former OSE became its consolidated subsidiary (the deemed acquisition date is September 30, 2012), and the profits and losses of the former OSE for 3 quarter (from October 1, 2012 to December 31, 2012) are included in the consolidated cumulative financial results of JPX. On the other hand, the profits and losses of the former OSE for the1st half (from April 1, 2012 to September 30, 2012) are not included.
- Therefore, combined figures, which include the profits and losses of former OSE for the 1st half (from April 1, 2012 to September 30, 2012), are shown as references in this material. Regarding these combination calculations, the profits and losses for former OSE are converted into JPX’s accounting items, therefore, the combined figures may differ from that obtained by aggregating the figures in the financial statements of former TSEG and former OSE. In addition, due to elaboration, etc. of account items, there may be differences in figures and values as compared to those announced on April 30, 2013 and July 30, 2013.

3Q (Apr.-Dec.)
FY2012
3Q (Apr.-Dec.) FY2013 FY2012
FY2013 (Assumptions for forecasts)
y/y y/y
Equities (trading value) *1 JPY 1,249.9 bil JPY 2,968.2 bil +138% JPY 1,561.2 bil JPY 2,800.0 bil +79%
TOPIX futures (trading volume) 61,572contracts 93,680contracts +52% 68,204contracts 92,000contracts +35%
Nikkei 225 Futures *2 (trading volume) 131,441contracts 221,214contracts +68% 153,087contracts 213,000contracts +39%
10-year JGB futures (trading volume) 36,326contracts 34,506contracts (5%) 38,700contracts 32,000contracts (17%)
Nikkei 225 Options (trading value) JPY 18.6 bil JPY 41.8 bil +124% JPY 23.5 bil JPY 38.0 bil +62%
3Q (Apr.-Dec.) Full Year
3Q FY2012 (Total of former TSEG
& former OSE’s 1H)
3Q FY2013 FY2012 (Total of JPX & former
OSE’s 1H)
FY2013 (Forecast) (Revised on January 27)
y/y y/y
Operating Revenue 56,731 89,102 +57.1% 82,504 111,500 +35.1%
Operating Expenses 42,764 48,975 +14.5% 59,633 66,500 +11.5%
Operating Income 13,967 40,127 +187.3% 22,871 45,000 +96.8%
Ordinary Income 16,333 42,082 +157.7% 25,259 47,000 +86.1%
Net Income 9,325 24,396 +161.6% 12,953 27,000 +108.4%
EBITDA 24,563 53,702 +118.6% 36,994 - -
3
Highlights and FY2013 Forecast
*1 Total of trading value in TSE 1st /2nd Sections (incl. former OSE 1st /2nd Sections), Mothers, JASDAQ, and TOKYO PRO Market *2 Incl. Nikkei 225 mini (calculated using factor of 1/10)
(JPY mil.)
Average Daily Trading Volume/Value of Major Products
Both cash equity trading value and derivatives trading volume continue to surpass the previous
figures on a year-on-year basis.
Accompanying the expansion of growth both in revenue and income, the earnings forecast for
FY2013 was revised upward.

56,731
89,102
Operating Revenue
Trading
Participant
Fees
+18,284
Listing Fees
+1,787 Income from
Information
Services
+770
Others
+3,653
4
Income from
Securities
Settlement
+7,876 Increase in
system
development
and operation
revenues
from Tosho
System
Service in Q1
contributes
greatly.
(JPY mil.)
3Q (Apr.-Dec.) FY2012 (Total of former TSEG &
former OSE)
3Q (Apr.-Dec.)
FY2013
With active trading, trading participant fees and income from securities settlement greatly
increased. Increases in clearing of yen-denominated interest rate swaps, etc. also
contributed to an increase in income from securities settlement
Listing fees increased due to increased new listings and public offerings by listed
companies and REITs

System
Development
Costs
+3,046
Operating Expenses
Other
+1,790
Rent
Expenses on
Real Estate
(383)
Personnel
Expenses
+522
42,764
48,975
System
Maintenance/
Operation
Costs
(127)
5
Depreciation
+1,362 Scheduled to
decrease by
JPY 500 mil.
annually from
April due to a
revision of the
TSE building
rental contract
(JPY mil.)
This is the cost for system
dev./op. by Tosho System
Service. Following an
increase in Q1, it remained
at the previous year’s level
in Q2/Q3.
Including
increase in
goodwill
amortization
(JPY 1,968 mil.)
Increase in depreciation expenses is due to accelerated depreciation
accompanying the system integration
Increase in other operating expenses is owed to goodwill amortization
3Q (Apr.-Dec.)
FY2012 (Total of former TSEG &
former OSE)
3Q (Apr.-Dec.)
FY2013

II. Business Developments
6

FY 2013 FY 2012
Derivatives Market
Integration
Consolidate derivatives
markets under OSE
Consolidate trading systems to J-
GATE (using NASDAQ OMX Click
XT)
Facilitate trading of a wide-range
of derivatives products on a single
platform, including Nikkei 225
products, TOPIX products, and
JGB products
Facilitate extension of evening
trading hours to 3 am for TOPIX
futures and options, JGB futures
and options, etc.
Generating Synergy Effect
7
FY 2014
Completed Cash Equity Market
Integration, etc.
Consolidated cash equities markets
under TSE
Composed of TSE of 1st/2nd Sections,
Mothers, JASDAQ, and TOKYO PRO Market
Consolidated trading systems to arrowhead
(off-auction: ToSTNeT)
Consolidated self-regulatory functions
under TSE Regulation
Consolidated clearing functions under
JSCC
Further improve risk management functions
Improve liquidity and participant capital
efficiency via unified margin system
July 16, 2013 March 24, 2014 January 1, 2013
Business Combination
With the success of functional integration of cash equity markets, etc., progress is being
made toward the derivatives market integration.

0
50
100
150
200
250
300
FY2012Apr.-Jun. Jul.-Sep. Oct.-Dec. Jan.-Mar.
FY2013Apr.-Jun. Jul.-Sep. Oct.-Dec.
TSE
Chi-X
SBIJ
OTC
Other stock exchanges
Cash Equities
8
TSE
89%
(issues)
ETFs/ETNs and J-REITs Trading Value of Stocks in Japan
(JPY tril.) (JPY tril.)
Chi-X 2%
SBIJ 4%
OTC 5%
Other stock exchanges 0%
TSE: Total trading value in TSE 1st /2nd Sections(incl. former OSE 1st/2nd Sections),
Mothers, JASDAQ and TOKYO PRO Market
Source: TSE, Chi-X, SBIJ and JSDA
Trading value and the number of ETFs, ETNs and REITs prior to July 16, 2013
are the total of those on TSE markets and former OSE markets
Source: TSE and OSE
0
20
40
60
80
100
120
140
160
180
0
4
8
12
FY2012Apr.-Jun. Jul.-Sep. Oct.-Dec. Jan.-Mar.
FY2013Apr.-Jun. Jul.-Sep. Oct.-Dec.
Trading Value of ETFs/ETNs
Trading Value of REITs
Number of ETFs/ETNs
Number of REITs
With active market conditions, the daily average trading value for stocks is
nearing JPY 3 trillion.
Trading value of ETFs and REITs is hovering around new record levels.
In particular, ETF trading value increased 6 times year-on-year to become
the 4th largest in the world* and the largest in Asia*. * Source: WFE, 2013 (annual)

99
34
19 23
37
54
0
20
40
60
80
100
120
FY2007 FY2008 FY2009 FY2010 FY2011 FY2012 FY2013Apr.-Dec.
TSE 1st/2nd Mothers
JASDAQ TOKYO PRO Market
Others
Cash Equities
9
Major Fund Raising
New Products tracking JPX-Nikkei Index 400
IPOs in Japan
(companies)
Source: TSE and each securities exchange
Listed Companies • Sharp: ¥142,560 mil.
• Ashikaga Holdings: ¥ 23,100 mil.
• Leopalace21: ¥ 22,533 mil.
REITs
• AEON REIT Investment Corporation: ¥ 96,243 mil.
• Japan Retail Fund Investment Corporation: ¥ 44,861 mil.
• Activia Properties Inc.: ¥ 33,744 mil.
New ETFs • Nomura AM: NEXT FUNDS JPX-Nikkei Index 400 Exchange
Traded Fund (Jan. 28)
• Nikko AM: Listed Index Fund JPX-Nikkei Index 400 (Jan. 28)
• Mitsubishi UFJ AM: MAXIS JPX-Nikkei Index 400 ETF (Feb. 6)
45
In addition to fund raising by listed companies, fund raising by REITs was also active.
Calculation of the new index “JPX-Nikkei Index 400” began on January 6, and ETFs tracking the index have been listed.
A revision to tick sizes (Phase 1: tick sizes for TOPIX 100 constituents with prices over JPY 3,000) was implemented on January 14.
*Not including secondary offerings *REIT IPOs indicate net assets at the time of listing.

0
5
10
15
20
25
30
FY2012Apr.-Jun. Jul.-Sep. Oct.-Dec. Jan.-Mar.
FY2013Apr.-Jun. Jul.-Sep. Oct.-Dec.
OSE
SGX
CME
Derivatives
10
JPX’s Derivatives Trading Volume and
Ratio of Night Session Trading Volume of Nikkei 225 Futures
OSE’s mini calculation factor is 1/10, SGX’s large (incl. USD denominated) is 1/2,
mini is 1/10, and CME’s USD denominated and JPY denominated contracts are1/2.
(mil. contracts)
OSE 67%
SGX 22%
CME 11%
Source: Each exchange
Derivatives trading volume increased by approx. 20% year-on-year and
maintained record levels on a fiscal year basis.
Scheduled to launch trading of CNX Nifty Futures on March 24 and re-
launch trading of 20-year JGB Futures on April 7.
(mil. contracts)
24%
0%
5%
10%
15%
20%
25%
30%
35%
0
20
40
60
80
100
120
140
FY2012Apr.-Jun. Jul.-Sep. Oct.-Dec. Jan.-Mar.
FY2013Apr.-Jun. Jul.-Sep. Oct.-Dec.
JGB Futures
TOPIX Futures
Nikkei 225 Futures
Nikkei 225 mini
Nikkei 225 Options
Others
Ratio of Night Session

70
182
333
442
585
0
100
200
300
400
500
600
700
Dec.-12 Mar.-13 Jun.-13 Sep.-13 Dec-13
Total Amount of ObligationAssumption
Clearing Business
Outstanding balance of cleared yen-denominated interest rate swaps (IRS) has steadily increased. Client clearing for IRS is scheduled to begin in February 2014.
Japan Securities Clearing Corporation (JSCC) was awarded Asia Risk’s “Clearing House of the Year”
– Awarded for its achievements in the clearing service for yen-denominated IRS transactions, which has expanded rapidly since its launch on October 2012, and for future prospects expected from the merger with Japan Government Bond Clearing Corporation (JGBCC).
11
Listed Products
- Cash trading
- Derivatives trading
Business fields of JSCC IRS Clearing (Cleared Open Interest) (JPY tril.)
Source: JSCC
OTC Products
- CDS (Launched in Jul. 2011)
- Yen-denominated IRS (Launched in Oct. 2012)
- JGBs (JGBCC merged with JSCC to become a JPX
subsidiary in Oct. 2013)
0
5
10
15
20
25
30
35
40
0
500
1,000
1,500
2,000
2,500
3,000
3,500Trading Volume
Stock Price
Nikkei 225
TOPIX
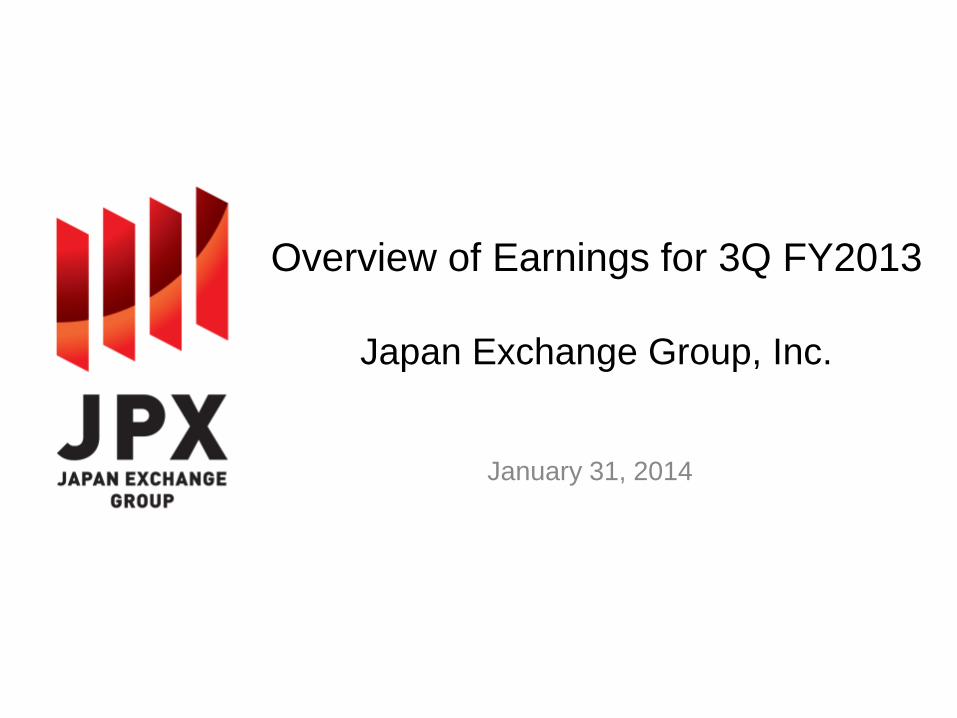
JPX Stock Price
2012/10/29
Board of Directors approved business
combination agreement and combination
agreement was concluded
TOB Period for OSE Stock
(2012/7/11-2012/8/22)
2013/1/1
Effective date of combination, launch of
Japan Exchange Group
2013/1/30
Notice of Revision to Earnings/Dividend Forecast
and Earnings for 3Q announced
2013/2/26
Notice regarding Cancellation of
Treasury Shares announced
2013/3/18
Notice of Revision to Earnings/Dividend
Forecast announced
2013/4/30
Earnings for FY2012 announced
2013/6/3 Notice regarding Stock Split (5-for-1)
12
2013/7/19 Revision to Earnings Forecast and Dividend Forecast
2013/7/30 Consolidated financial results for three months ended June 30, 2013 2013/7/16
Cash Equity Market, self-regulatory functions, clearing functions Integration
Price (JPY) Nikkei 225 (JPY 10)
TOPIX (points) (mil. shares)
Listed on both the TSE1st Section and JASDAQ from January 1 to July 15, 2013. Prices above are prices on the TSE1st Section. Trading volumes above are the total of
those on TSE1st Section and JASDAQ. Due to the 100-for-1 stock split effective on January 1, 2013, and the subsequent 5-for-1 stock split effective on October 1, 2013,
the stock prices until December 2012 is calculated as 1/500, and from January to September 2013 as 1/5.
2013/10/23 Consolidated financial results for Six months ended September 30, 2013 Revision to Earnings Forecast
2014/1/27 Notice of Revision to Earnings Forecast and Dividend Forecast

III. Reference Material
13

FY2012 FY2013
1Q (*) (Apr. 1, 2012-
Jun 30, 2012)
2Q (*) (Jul. 1, 2012-
Sep. 30, 2012)
3Q (Oct. 1, 2012-
Dec. 31, 2012)
4Q (Jan 1, 2013-
Mar. 31, 2013)
1Q (Apr. 1, 2013-
Jun 30, 2013
2Q (Jul. 1, 2013-
Sep. 30, 2013)
3Q (Oct. 1, 2013-
Dec. 31, 2013)
Operating Revenue 19,179 17,779 19,772 25,773 36,099 25,623 27,379
Operating Expenses 13,960 13,562 15,241 16,869 18,156 15,364 15,454
Operating Income 5,218 4,217 4,531 8,903 17,943 10,258 11,925
Ordinary Income 5,813 4,726 5,792 8,926 18,655 10,261 13,165
Net Income 3,499 3,072 2,753 3,627 11,209 5,341 7,846
EBITDA 8,555 6,965 9,041 12,431 23,089 13,421 17,191
FY2012 FY2013
1Q (*)
(Apr. 1, 2012-
Jun 30, 2012)
2Q (*)
(Jul. 1, 2012-
Sep. 30, 2012)
3Q (Oct. 1, 2012-
Dec. 31, 2012)
Full Year (Apr.1, 2012-
March 31, 2013)
1Q (Apr. 1, 2013-
Jun 30, 2013
2Q (Jul. 1, 2013-
Sep. 30, 2013)
3Q (Oct. 1, 2013-
Dec. 31, 2013)
Personal Expenses 3,509 3,533 3,551 14,499 3,601 3,752 3,763
Rent Expenses on Real Estates 1,582 1,582 1,592 6,349 1,453 1,450 1,470
System Maintenance & Operation Costs 2,996 2,951 2,904 11,695 2,847 2,909 2,976
Depreciation 2,725 2,903 2,938 12,741 3,537 3,242 3,149
Cost of System Development 1,230 789 1,451 4,666 3,830 1,324 1,361
Other 1,915 1,802 2,803 9,680 2,884 2,685 2,732
Total 13,960 13,562 15,241 59,633 18,156 15,364 15,454
14
Quarterly Business Performance
Referential financial data (combined basis)
Operating Expenses
* Total of former TSEG and former OSE
(JPY mil.)
(JPY mil.)

FY 2012 FY 2013
1Q (Apr. 1, 2012- Jun 30, 2012)
2Q (Jul. 1, 2012-
Sep. 30, 2012)
3Q (Oct. 1, 2012- Dec. 31, 2012)
1Q (Apr. 1, 2013- Jun 30, 2013)
2Q (Jul. 1, 2013-
Sep. 30, 2013)
3Q (Oct. 1, 2013- Dec. 31, 2013)
Amount Amount Amount Amount Amount Amount Ratio y/y
Trading Participant Fees 7,859 7,093 8,211 17,317 11,772 12,358 45.1% 50.5%
Transaction Fees 5,742 5,052 6,110 14,869 9,660 10,266 68.0%
Cash Equities 3,316 2,945 3,649 10,154 7,058 7,367 71.8% * 101.9%
Derivatives 2,426 2,106 2,460 4,714 2,602 2,899 28.2% * 17.9%
TOPIX futures 371 351 350 588 453 444 26.7% Nikkei 225 futures (incl. mini) 760 651 814 1,605 938 1,086 33.5%
Nikkei 225 Options 752 658 825 1,932 819 932 13.0%
10-year JGB futures 459 393 415 502 339 382 (8.1%)
Others 82 50 53 85 51 53 (1.1%)
Basic Fees 371 365 362 353 284 275 (24.0%)
Access Fees 1,099 1,031 1,088 1,430 1,185 1,165 7.0%
Trading System Facilities Usage Fees 617 619 623 628 620 628 0.8%
Others 27 24 27 35 21 22 (18.3%)
Income from Securities Settlement 2,538 2,183 3,046 6,430 4,211 5,003 18.3% 64.2%
Listing Fees 2,156 2,533 2,620 2,517 3,179 3,400 12.4% 29.8%
Initial/Additional Listing Fees 473 858 883 786 1,521 1,566 77.2%
Annual Listing Fees 1,683 1,675 1,736 1,730 1,658 1,834 5.6%
Income from Information Services 3,786 3,725 3,680 4,086 3,885 3,990 14.6% 8.4%
Other 2,837 2,243 2,214 5,747 2,574 2,626 9.6% 18.6%
Total 19,179 17,779 19,772 36,099 25,623 27,379 100% 38.5%
15
Referential financial data (combined basis)
Operating Revenue
Figures for Q1 and Q2 FY2012 are total of former TSEG and former OSE. Figures marked * are indicate percentage of Transaction Fees.
(JPY mil.)

Mar. 31, 2013 Dec. 31, 2013
<Assets>
Current assets 1,095,466 1,462,482
Cash and deposits 120,808 88,699
Operating accounts receivable 8,716 11,422
Securities - 804
Work in Process 2,467 40
Margin funds for derivatives, etc. and when-issued
transactions 789,201 1,143,030
Deposits for clearing funds 161,086 197,881
Deposits as collateral for facilitating settlement 10,000 10,500
Other 3,195 10,117
Allowance for doubtful accounts (9) (14)
Non-current assets 180,919 174,902
Property, plant and equipment 8,673 6,927
Intangible assets 90,744 87,618
Goodwill 67,374 64,792
Other 23,370 22,825
Investments and other assets 81,501 80,357
Investment securities 41,304 39,808
Legal guarantee funds 600 649
Special assets for default compensation reserve
funds 27,948 27,948
Other 11,825 12,091
Allowance for doubtful accounts (177) (140)
Total assets 1,276,386 1,637,385
Mar. 31, 2013 Dec. 31, 2013
<Liabilities>
Current liabilities 1,083,157 1,415,282
Operating accounts payable 3,221 2,766
Short-term loans payable 18,670 32,500
Current portion of long-term loans payable 86,399 -
Income taxes payable 6,312 12,765
Provision for bonuses 1,223 497
Provision for directors’ bonuses 252 20
Margin funds received for derivatives, etc. and when-
issued transactions 789,201 1,143,030
Deposits received for clearing funds 161,086 197,881
Deposits received as collateral for facilitating settlement 10,000 10,500
Deposits received as trading participant security money 3,169 4,846
Other 3,620 10,473
Non-current liabilities 14,151 24,220
Long-term loans payable - 10,000
Provision for retirement benefits 7,580 7,497
Returnable legal guarantee funds 600 649
Other 5,970 6,072
Total liabilities 1,097,308 1,439,502
<Net assets>
Shareholders' equity 167,440 183,046
Capital stock 11,500 11,500
Capital surplus 59,726 59,726
Retained earnings 96,213 111,825
Treasury stock - (5)
Total accumulated other comprehensive
income 9,088 9,195
Valuation difference on available-for-sale securities 9,088 9,195
Minority interests 2,548 5,641
Total net assets 179,077 197,883
Total liabilities and net assets 1,276,386 1,637,385
(JPY mil.)
Referential financial data
Consolidated Balance Sheets
*1
*2
*4
*2
*3
*1
*1 JSCC and OSE receive deposits of money from their clearing participants for the purpose of covering the risk of the clearing participants defaulting on their obligations. These amounts are recorded under both assets and liabilities in the corresponding items indicated for deposits. *2 TSE and OSE receive deposits of money from their trading participants for the purpose of covering the risk of entrustors of securities trading, etc. that arises from the trading participants defaulting on their obligations. These amounts are recorded under both assets and liabilities. *3 TSE receives deposits of money from its trading participants for the purpose of covering the risk of the trading participants defaulting on their obligations. This amount is recorded under assets as cash and deposits and under liabilities as deposits received as trading participant security money. 16
*4 JPX has reserve funds for the purpose of compensating losses incurred in the clearing operations of JSCC and OSE. This amount is recorded under assets as special assets for default compensation reserve funds.

FY2012 FY2013
1Q
(Apr. 1, 2012- Jun 30, 2012)
2Q (Jul. 1, 2012-
Sep. 30, 2012)
3Q (Oct. 1, 2012- Dec. 31, 2012)
4Q (Jan 1, 2013-
Mar. 31, 2013)
1Q (Apr. 1, 2013- Jun 30, 2013)
2Q (Jul. 1, 2013-
Sep. 30, 2013)
3Q (Oct. 1, 2013- Dec. 31, 2013)
Cash Equities 3,316 2,945 3,649 6,193 10,154 7,058 7,367 Derivatives 2,426 2,106 2,460 3,597 4,714 2,602 2,899
TOPIX Futures 371 351 350 451 588 453 444 Nikkei 225 Futures (incl. mini) 760 651 814 1,189 1,605 938 1,086 Nikkei 225 Options 752 658 825 1,384 1,932 819 932 10-year JGB Futures 459 393 415 502 502 339 382 Others 82 50 53 69 85 51 53
17
Quarterly Transaction Fees (out of Trading Participant Fees )
Referential financial data (combined basis)
(JPY mil.)

18
Major Product Data
Trading Volume/Value
Average Daily Trading Volume/Value
*1 Trading value of common stocks
*2 Including trading value in former OSE 1st/2nd Sections
*3 Contracts of Nikkei 225 mini are calculated using a factor of 1/10
*4 Total of trading value in TSE 1st /2nd Sections(former OSE 1st /2nd Sections), Mothers, JASDAQ and TOKYO PRO Market
FY2012 FY2013 1Q
(Apr. 1, 2012- Jun. 30, 2012)
2Q (Jul. 1, 2012-
Sep. 30, 2012)
3Q (Oct. 1, 2012- Dec. 31, 2012)
4Q (Jan 1, 2013-
Mar. 31, 2013)
1Q (Apr. 1, 2013- Jun. 30, 2013)
2Q (Jul. 1, 2013-
Sep. 30, 2013)
3Q (Oct. 1, 2013- Dec. 31, 2013)
Trading Value of Stocks (JPY mil.) (*1)
TSE 1st/2nd Section (*2) 76,567,741 67,269,696 83,683,764 141,743,922 214,059,115 143,333,854 151,527,314
Mothers 659,877 661,086 1,129,330 3,348,301 7,453,258 5,545,080 11,499,388
JASDAQ 1,262,229 957,928 1,551,488 3,674,444 9,207,734 6,233,226 6,203,970
Derivatives Trading Volume (contracts) (Trading Value for Nikkei 225 Options)
TOPIX Futures 4,008,210 3,729,113 3,776,656 5,196,028 7,207,955 5,118,622 5,191,516
Total Nikkei 225 Futures/mini (*3) 8,592,506 7,413,381 8,573,728 12,926,625 18,764,763 11,139,399 11,462,951
Nikkei 225 Futures 5,206,854 4,389,045 5,058,413 7,369,366 10,373,289 6,408,145 6,756,891
Nikkei225mini 33,856,526 30,243,360 35,153,145 55,572,590 83,914,741 47,312,547 47,060,600
Nikkei 225 Options (JPY mil.) 1,213,137 1,029,247 1,253,161 2,271,580 3,968,040 1,895,032 1,970,855
10-year JGB Futures 2,451,382 2,114,685 2,226,941 2,688,395 2,648,616 1,789,770 2,014,239
FY2012 FY2013 1Q
(Apr. 1, 2012- Jun. 30, 2012)
2Q (Jul. 1, 2012-
Sep. 30, 2012)
3Q (Oct. 1, 2012- Dec. 31, 2012)
4Q (Jan 1, 2013-
Mar. 31, 2013)
1Q (Apr. 1, 2013- Jun. 30, 2013)
2Q (Jul. 1, 2013-
Sep. 30, 2013)
3Q (Oct. 1, 2013- Dec. 31, 2013)
Trading Value of Stocks(JPY mil.) (*1) (*4) 1,265,965 1,093,472 1,392,977 2,564,943 3,721,292 2,462,098 2,729,528
Derivatives Trading Volume (contracts) (Trading Value for Nikkei 225 Options)
TOPIX Futures 64,649 59,192 60,914 89,587 116,257 81,248 83,734 Total Nikkei 225 Futures/mini (*3) 138,589 117,673 138,286 222,873 302,657 176,816 184,886 Nikkei 225 Futures 83,982 69,667 81,587 127,058 167,311 101,717 108,982 Nikkei225mini 546,073 480,053 566,986 958,148 1,353,464 750,993 759,042 Nikkei 225 Options (JPY mil.) 19,567 16,337 20,212 39,165 64,001 30,080 31,788 10-year JGB Futures 39,538 33,566 35,918 46,352 42,720 28,409 32,488

Management and Financial Targets for FY2015 (Medium-Term Management Plan)
19
Management and Financial Targets / Financial
Indicators FY2012 FY2015
(Target)
Operating Revenues 82,504 90,500
Operating Expenses (excl. goodwill amortization)
59,633 (58,159)
52,900 (49,500)
Operating Profit (excl. goodwill amortization)
22,871 (24,345)
37,600 (41,000)
Net Income (excl. goodwill amortization)
12,953 (14,427)
22,600 (26,000)
EBITDA 36,994 Approx. 50,000
ROE * 9.7% Approx. 14%
JPY 36 billion
(Main breakdown)
Cash Equities System: ¥ 11.0 B
Derivatives System: ¥ 10.0 B
Clearing System: ¥ 8.0 B
Capital Investment
(3 years)
* Excluding goodwill amortization and special assets
(JPY mil.)
FY2012 FY2015 (Assumptions for the Target)
compared to FY2012
Equities (trading value) *1 JPY 1,561.2 bil JPY 1,700.0 bil +138.8 bil
TOPIX futures (trading volume) 68,204contracts 104,000contracts +35,796
Nikkei 225 Futures *2 (trading volume) 153,087contracts 217,000contracts +63,913
10-year JGB futures (trading volume) 38,700contracts 53,000contracts +14,300
Nikkei 225 Options (trading value) JPY 23.5 bil JPY 47.0 bil +23.5 bil
< Average Daily Trading Volume/Value of Major Products>
*1 Total of trading value in TSE 1st /2nd Sections
(incl. former OSE 1st /2nd Sections), Mothers,
JASDAQ, and TOKYO PRO Market
*2 Including Nikkei 225 mini (calculated using
factor of 1/10)

Generating Cost Synergy
FY 2013 FY 2014 FY 2015
Plan to replace a
cash equity system to
next arrowhead
Sep. 2012 – Jul. 2013 Accelerated amortization of prior OSE’s cash
equity system Jul. 16, 2013
Cash equity system integration Integrating to arrowhead(launched in Jan. 2010)
Dec. 2012 – Mar. 2014 Accelerated amortization of prior TSE
derivatives system Mar. 24, 2014
Derivatives system integration Integrating to J-GATE (launched in Feb. 2011)
20
Increase depreciation due
to accelerated amortization
Non system-related cost reduction (JPY 1.5 bil in FY2015) <Improvement of operational efficiency and revision of business bases, etc.>
(Note) System-related cost: costs related to system maintenance/operation, depreciation, etc.
Target: Cost Reduction of
JPY 8.5 bil. or More
(15% of Overall Costs) (compared to FY2012)
System-related cost reduction
(JPY 7 bil. in FY2015) <Integration of duplicate systems>

0
2,0 00,000
4,0 00,000
379…
380…
380…
380…
380…
380…
380…
380…
380…
380…
380…
380…
380…
381…
381…
381…
381…
381…
381…
381…
381…
381…
381…
381…
382…
382…
382…
382…
382…
382…
382…
382…
382…
382…
382…
383…
383…
383…
383…
383…
383…
383…
383…
383…
383…
383…
384…
384…
384…
384…
384…
384…
384…
384…
384…
384…
384…
384…
385…
385…
385…
385…
385…
385…
385…
385…
385…
385…
385…
386…
386…
386…
386…
386…
386…
386…
386…
386…
386…
386…
387…
387…
387…
387…
387…
387…
387…
387…
387…
387…
387…
388…
388…
388…
388…
388…
388…
388…
388…
388…
388…
388…
388…
389…
389…
389…
389…
389…
389…
389…
389…
389…
389…
389…
390…
390…
390…
390…
390…
390…
390…
390…
390…
390…
390…
391…
391…
391…
391…
391…
391…
391…
391…
391…
391…
391…
391…
392…
392…
392…
392…
392…
392…
392…
392…
392…
392…
392…
393…
393…
393…
393…
393…
393…
393…
393…
393…
393…
393…
394…
394…
394…
394…
394…
394…
394…
394…
394…
394…
394…
395…
395…
395…
395…
395…
395…
395…
395…
395…
395…
395…
396…
396…
396…
396…
396…
396…
396…
396…
396…
396…
396…
396…
397…
397…
397…
397…
397…
397…
397…
397…
397…
397…
397…
398…
398…
398…
398…
398…
398…
398…
398…
398…
398…
398…
399…
399…
399…
399…
399…
399…
399…
399…
399…
399…
399…
400…
400…
400…
400…
400…
400…
400…
400…
400…
400…
400…
401…
401…
401…
401…
401…
401…
401…
401…
401…
401…
401…
402…
402…
402…
402…
402…
402…
402…
402…
402…
402…
402…
403…
403…
403…
403…
403…
403…
403…
403…
403…
403…
403…
404…
404…
404…
404…
404…
404…
404…
404…
404…
404…
404…
404…
405…
405…
405…
405…
405…
405…
405…
405…
405…
405…
405…
406…
406…
406…
406…
406…
406…
406…
406…
406…
406…
406…
407…
407…
407…
407…
407…
407…
407…
407…
407…
407…
407…
408…
408…
408…
408…
408…
408…
408…
408…
408…
408…
408…
408…
409…
409…
409…
409…
409…
409…
409…
409…
409…
409…
409…
410…
410…
410…
410…
410…
410…
410…
410…
410…
410…
410…
411…
411…
411…
411…
411…
411…
411…
411…
411…
411…
411…
412…
412…
412…
412…
412…
412…
412…
412…
412…
412…
412…
413…
413…
413…
413…
413…
413…
413…
413…
413…
413…
413…
414…
414…
414…
414…
414…
414…
414…
414…
414…
414…
414…
414…
415…
415…
415…
415…
415…
415…
415…
415…
415…
415…
415…
416…
416…
416…
416…
416… 50
60
70
80
90
100
110
120
130
0
200
400
600
800
1,000
1,200
1,400
1,600
1,800
2,000
2004 2005 2006 2007 2008 2009 2010 2011 2012 2013
Nikkei 225
TOPIX
JPY/USD Rate
Japanese Stock Market
Nikkei 225 (JPY 10) TOPIX (points) (JPY/USD)
Trading Value
JPY4tril.
JPY2tril.
Trading Value(TSE 1st)
21

Other topics
* Trade/corporate names to be changed
– Osaka Securities Exchange
Osaka Exchange (March 24, 2014)
– Tokyo Stock Exchange Regulation
Japan Exchange Regulation (April 1, 2014)
<Structure of JPX (after April 2014*) >
22
Japan Exchange Group
(Atsushi Saito, Group CEO
Michio Yoneda, Group COO)
Tokyo Stock Exchange Akira Kiyota,
President &CEO
Osaka Exchange Hiromi Yamaji
President &CEO
Japan Exchange Regulation
Takafumi Sato
President
Japan Securities Clearing
Corporation Hironaga Miyama
President & CEO
Cash Equities Trading Derivatives Trading Self -regulation Clearing

Outline of JPX Stock
23
Stock Code 8697
Listed Exchange Tokyo Stock Exchange 1st Section
Fiscal Year From April 1 to March 31
Annual General
Shareholders Meeting In June
Record Date March 31
Number of Shares in
One Trading Unit 100 shares
Number of Shares(*) Total number of shares authorized to be issued: 1,090,000,000 shares
Total number of shares issued: 274,534,550 shares * A 5-for-1 stock split was conducted with an effective date of Oct. 1, 2013.
Basic Policy on Profit
Distribution
Giving due consideration to the importance of internal reserves for the purpose
of development of the system for strengthening competitiveness, etc. as an
exchange, and for the purpose of being prepared for the risks as the clearing
organization, JPX makes it a principle to conduct stable and continuous payment
of dividends. Specifically, JPX aims at a target dividend payout ratio of
around 40%.

24
Disclaimer
These materials are prepared solely for the purpose of providing information regarding
Japan Exchange Group Inc., and as such, they are not intended as any offer or sale of
securities or other similar action whether inside or outside Japan. Our securities have not
been and will not be registered under the United States Securities Act of 1933, as amended
(the “Securities Act”), and may not be offered or sold in the United States absent
registration or an applicable exemption from registration requirements.
These materials contain forward-looking statements. These statements are based on our
assumptions and beliefs in light of the information currently available to us and are subject
to risks and uncertainties. Should one or more of these risks or uncertainties materialize, or
should underlying assumptions prove incorrect, our actual results may vary materially from
those we currently anticipate. Given these risks and uncertainties, you are cautioned not to
place undue reliance on forward-looking statements, which speak only as of the date of
these materials. We disclaim any obligation to update any of the forward-looking
statements contained in these materials to reflect future actual events or developments.