Embed Size (px)
Citation preview

April 28, 2014
Overview of Earnings for FY2013
Japan Exchange Group, Inc.

I. Overview of Earnings for FY2013
(April 1, 2013 – March 31, 2014)
[Regarding JPX Earnings for previous Fiscal Year] - The consolidated financial statements of Japan Exchange Group, Inc. (JPX) is created based on this combination succeed the consolidated financial statements of former
TSEG in accordance with accounting standards pertaining to corporate combination. - Since an establishment of JPX was on January 1, 2013, figures for 4Q FY2012 or later are figures of the combined company, which is comprised of former TSEG and
former OSE. Also, As a result of a tender offer for shares of the former OSE by former TSEG, former OSE became its consolidated subsidiary (the deemed acquisition date is September 30, 2012), and the profits and losses of the former OSE for 3 quarter (from October 1, 2012 to December 31, 2012) are included in the consolidated cumulative financial results of JPX. On the other hand, the profits and losses of the former OSE for the1st half (from April 1, 2012 to September 30, 2012) are not included.
- Therefore, combined figures, which include the profits and losses of former OSE for the 1st half (from April 1, 2012 to September 30, 2012), are shown as references in this material. Regarding these combination calculations, the profits and losses for former OSE are converted into JPX’s accounting items, therefore, the combined figures may differ from that obtained by aggregating the figures in the financial statements of former TSEG and former OSE. In addition, due to elaboration, etc. of account items, there may be differences in figures and values as compared to those announced on April 30, 2013 and July 30, 2013.

FY2012 FY2013 FY2014
(Assumptions for forecasts)
y/y y/y Equities (trading value) JPY 1,561.2 bil JPY 2,947.1bil 88.8% JPY 2,100.0 bil (28.7)%
TOPIX futures (trading volume) 68,204contracts 94,297 contracts 38.3% 104,000 contracts 10.3%
Nikkei 225 Futures * (trading volume) 153,087 contracts 218,619 contracts 42.8% 211,000 contracts (3.5)%
10-year JGB futures (trading volume) 38,700 contracts 34,975 contracts (9.6)% 36,000 contracts 2.9%
Nikkei 225 Options (trading value) JPY 23.5 bil JPY 40.0 bil 69.8% JPY 35.5 bil (11.2)% 3
(JPY mi.)
Average Daily Trading Volume/Value of Major Products
Highlights and FY2014 Forecast
* Incl. Nikkei 225
mini (calculated
using factor of 1/10)
FY 2012 (Totaled with former-OSE’s 1H)
*1
FY 2013 FY 2014 (Forecast) (including impact of IFRS adoption)*2
y/y y/y
Operating Revenues 82,504 116,251 40.9% 93,000 (20.0)%
Operating Expenses 59,633 65,131 9.2% 55,000 (15.6)%
Operating Income 22,871 51,120 123.5% 38,000 (25.7)%
Ordinary Income 25,259 52,801 109.0% 40,000 (24.2)%
Net Income 12,953 29,835 130.3% 24,500 (17.9)%
EBITDA 36,994 68,241 -
Dividend per share*3 16.00 yen 43.00 yen 36.00 yen
Large increases in revenues and incomes were seen in FY2013 mainly due to equities trading value
and derivatives trading volume surpassing figures from the previous fiscal year.
Earnings forecasts for FY2014 include a decrease in operating revenues from FY2013, but also
reductions in operating expenses arising from integration-related synergies.
*1 Totaled with former-OSE’s 1H earnings results.
*2 IFRS is scheduled to be adopted from the year-end earnings results of FY 2014. Figures include the impact of this adoption (JPY 3.5 billion).
*3 Total of 2Q and end-of-year. (figures include stock split conducted in Oct. 2013)
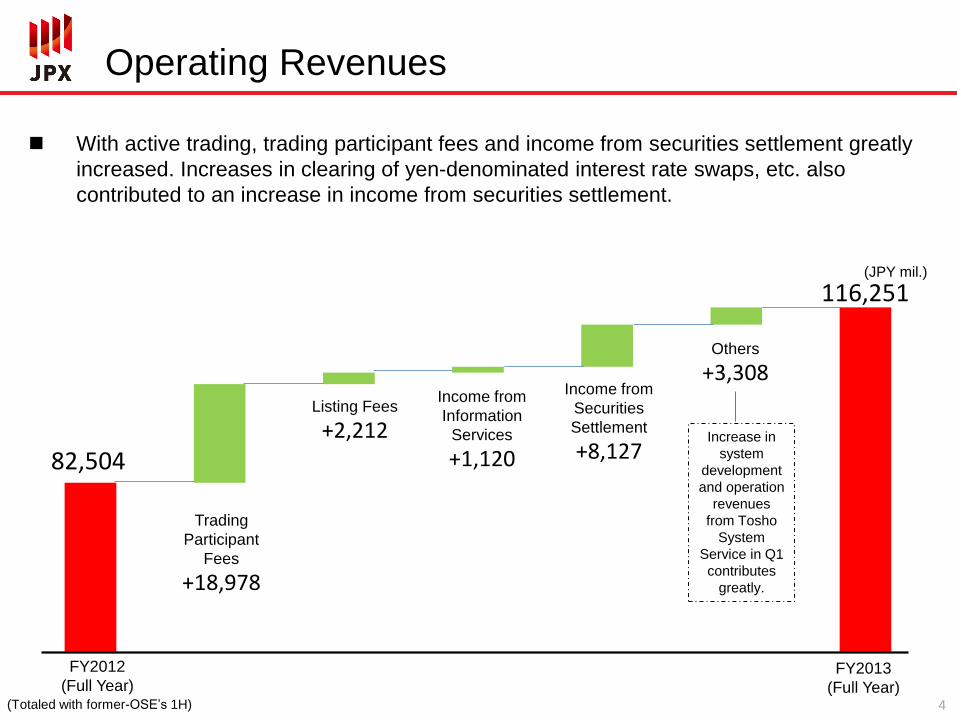
Listing Fees
+2,212
Income from
Information
Services
+1,120
Others
+3,308
4
FY2012
(Full Year) (Totaled with former-OSE’s 1H)
FY2013
(Full Year)
Income from
Securities
Settlement
+8,127 82,504
116,251
Operating Revenues
With active trading, trading participant fees and income from securities settlement greatly
increased. Increases in clearing of yen-denominated interest rate swaps, etc. also
contributed to an increase in income from securities settlement.
Trading
Participant
Fees
+18,978
Increase in
system
development
and operation
revenues
from Tosho
System
Service in Q1
contributes
greatly.
(JPY mil.)

Operating Expenses
Other
+1,744
Rent
Expenses on
Real Estate
(449)
Personnel
Expenses
+641
59,633
65,131 System
Maintenance/
Operation
Costs
(52)
5
Depreciation
+672
Cost of
System
Development
+2,941
Increase in depreciation expenses is due to accelerated depreciation
accompanying the system integration.
Increase in other operating expenses is owed to goodwill amortization.
(JPY mil.)
Decreased by
JPY 500 mil.
due to a
revision of the
TSE building
rental contract
This is the cost for system dev./op.
by Tosho System Service. Despite
of an increase in 1Q, it remained at
the previous year’s level after 2Q.
Including goodwill
amortization (JPY
3.44 bil.), which is
increased by
approx. JPY 2 bil.
FY2012
(Full Year) (Totaled with former-OSE’s 1H)
FY2013
(Full Year)

(DPR 40%)
Japanese
Standards Including IFRS
Adoption Impact
Operating Revenues JPY 93.0 bil JPY 93.0 bil
Operating Expenses JPY 58.5 bil JPY 55.0 bil
Operating Income JPY 34.5 bil JPY 38.0 bil
Net Income JPY 21.0 bil JPY 24.5 bil
Scheduled Adoption of IFRS
* A separate release detailing the differences between use of IFRS and Japanese Standards will be published before the adoption takes place.
1Q 2Q 3Q Full Year (Year-end)
Earnings Results (Earnings report, etc.)
Forecast (Announced in Apr. 2014)
Dividend (Forecast) (Announced in Apr. 2014)
Japanese
Standards IFRS
Japanese
Standards
Net Income
JPY 21.0 bil.
<Reference> Net Income Including IFRS Adoption Impact
JPY 24.5 bil.
Interim Dividend
JPY 18
Year-end Dividend (Annual)
JPY 18 (JPY 36)
Expenses
Decreased by JPY 3.5 bil.
Income
Increased by JPY 3.5 bil.
<FY2014 Forecast>
<Tentative Disclosure Schedule and Dividend Estimates>
IFRS will be adopted starting with the FY2014 earnings results.
The primary impact of IFRS adoption is an expected gain of JPY 3.5 billion in incomes mainly due
to the exclusion of amortization of goodwill (JPY 3.44 billion annually).
Earnings forecasts for FY2014 reflecting both Japanese Standards and the impact of IFRS adoption
are included for reference below. Dividend forecasts were calculated using these figures.
Japanese
Standards
Japanese
Standards
6
II. Reference Material

Cash Equities
8
0
50
100
150
200
250
300
FY2012Apr.-Jun Jul.-Sep. Oct.-Dec. Jan.-Mar.
FY2013Apr.-Jun Jul.-Sep. Oct.-Dec. Jan.-Mar.
TSE
Chi-X
SBIJ
OTC
Other stock exchanges
0
20
40
60
80
100
120
140
160
180
200
0
4
8
12
FY2012Apr.-Jun Jul.-Sep. Oct.-Dec. Jan.-Mar.
FY2013Apr.-Jun Jul.-Sep. Oct.-Dec. Jan.-Mar.
Trading Value of ETFs/ETNs
Trading Value of REITs
Number of ETFs/ETNs
Number of REITs
TSE
89.6%
(issues)
ETFs/ETNs and J-REITs Trading Value of Stocks in Japan
(JPY tril.) (JPY tril.)
Chi-X 1.7%
SBIJ 3.6%
OTC 5.1%
Other stock exchanges 0%
TSE: Total trading value in TSE 1st /2nd Sections(incl. former OSE 1st/2nd Sections),
Mothers, JASDAQ and TOKYO PRO Market
Source: TSE, Chi-X, SBIJ and JSDA
Trading value and the number of ETFs, ETNs and REITs prior to July 16, 2013
are the total of those on TSE markets and former OSE markets
Source: TSE and OSE

Cash Equities
New Products tracking JPX-Nikkei Index 400
ETFs • Nomura AM: NEXT FUNDS JPX-Nikkei Index 400
Exchange Traded Fund
• Nikko AM: Listed Index Fund JPX-Nikkei Index 400
• Mitsubishi UFJ AM: MAXIS JPX-Nikkei Index 400 ETF
• Daiwa AM: Daiwa ETF JPX-Nikkei 400
Futures To be listed by the end of November 2014
99
34
19 23
37
54 57
0
20
40
60
80
100
120
FY2007 FY2008 FY2009 FY2010 FY2011 FY2012 FY2013
TSE 1st/2nd Mothers
JASDAQ TOKYO PRO Market
Others
IPOs in Japan
(companies)
Source: TSE and each securities exchange
9

Derivatives
10
0
5
10
15
20
25
30
FY2012Apr.-Jun Jul.-Sep. Oct.-Dec. Jan.-Mar.
FY2013Apr.-Jun Jul.-Sep. Oct.-Dec. Jan.-Mar.
OSE
SGX
CME
JPX’s Derivatives Trading Volume and
Ratio of Night Session Trading Volume of Nikkei 225 Futures
OSE’s mini calculation factor is 1/10, SGX’s large (incl. USD denominated) is 1/2,
mini is 1/10, and CME’s USD denominated and JPY denominated contracts are1/2.
(mil. contracts)
OSE 67%
SGX 20%
CME 13%
Source: Each exchange
(mil. contracts)
31%
0%
5%
10%
15%
20%
25%
30%
35%
0
20
40
60
80
100
120
140
FY2012Apr.-Jun Jul.-Sep. Oct.-Dec. Jan.-Mar.
FY2013Apr.-Jun Jul.-Sep. Oct.-Dec. Jan.-Mar.
JGB FuturesTOPIX FuturesNikkei 225 FuturesNikkei 225 miniNikkei 225 OptionsOthersRatio of Night Session

FY2012 FY2013
1Q (*) (Apr. 1, 2012-
Jun 30, 2012)
2Q (*) (Jul. 1, 2012-
Sep. 30, 2012)
3Q (Oct. 1, 2012-
Dec. 31, 2012)
4Q (Jan. 1, 2013-
Mar. 31, 2013)
1Q (Apr. 1, 2013-
Jun 30, 2013
2Q (Jul. 1, 2013-
Sep. 30, 2013)
3Q (Oct. 1, 2013-
Dec. 31, 2013)
4Q (Jan. 1, 2014-
Mar. 31, 2014)
Operating Revenues 19,179 17,779 19,772 25,773 36,099 25,623 27,379 27,148
Operating Expenses 13,960 13,562 15,241 16,869 18,156 15,364 15,454 16,156
Operating Income 5,218 4,217 4,531 8,903 17,943 10,258 11,925 10,992
Ordinary Income 5,813 4,726 5,792 8,926 18,655 10,261 13,165 10,718
Net Income 3,499 3,072 2,753 3,627 11,209 5,341 7,846 5,438
EBITDA 8,555 6,965 9,041 12,431 23,089 13,421 17,191 14,538
FY2012 FY2013
1Q (*)
(Apr. 1, 2012-
Jun 30, 2012)
2Q (*)
(Jul. 1, 2012-
Sep. 30, 2012)
3Q (Oct. 1, 2012-
Dec. 31, 2012)
4Q (Jan. 1, 2013-
Mar. 31, 2013)
Full Year (Apr.1, 2012-
Mar. 31, 2013)
1Q (Apr. 1, 2013-
Jun 30, 2013)
2Q (Jul. 1, 2013-
Sep. 30, 2013)
3Q
(Oct. 1, 2013-
Dec. 31, 2013)
4Q (Jan. 1, 2014-
Mar. 31, 2014)
Full Year (Apr. 1, 2013-
Mar. 31, 2014)
Personal Expenses 3,509 3,533 3,551 3,905 14,499 3,601 3,752 3,763 4,024 15,141
Rent Expenses on Real Estates 1,582 1,582 1,592 1,592 6,349 1,453 1,450 1,470 1,526 5,900
System Maintenance & Operation
Costs 2,996 2,951 2,904 2,834 11,695 2,847 2,909 2,976 2,909 11,642
Depreciation 2,725 2,903 2,938 4,174 12,741 3,537 3,242 3,149 3,484 13,413
Cost of System Development 1,230 789 1,451 1,195 4,666 3,830 1,324 1,361 1,091 7,608
Other 1,915 1,802 2,803 3,167 9,680 2,884 2,685 2,732 3,121 11,425
Total 13,960 13,562 15,241 16,869 59,633 18,156 15,364 15,454 16,156 65,131
11
Quarterly Business Performance
Referential financial data (combined basis)
Operating Expenses
* Total of former TSEG and former OSE
(JPY mil.)
(JPY mil.)

FY 2012 FY 2013
1Q (Apr. 1, 2012- Jun 30, 2012)
2Q (Jul. 1, 2012-
Sep. 30, 2012)
3Q (Oct. 1, 2012- Dec. 31, 2012)
4Q (Jan. 1, 2013-
Mar. 31, 2013)
1Q (Apr. 1, 2013- Jun 30, 2013)
2Q (Jul. 1, 2013-
Sep. 30, 2013)
3Q (Oct. 1, 2013- Dec. 31, 2013)
4Q (Jan. 1, 2014-
Mar. 31, 2014)
Amount Amount Amount Amount Amount Amount Amount Amount Ratio y/y
Trading Participant Fees 7,859 7,093 8,211 12,013 17,317 11,772 12,358 12,707 46.8% 5.8%
Transaction Fees 5,742 5,052 6,110 9,791 14,869 9,660 10,266 10,550 7.8%
Cash Equities 3,316 2,945 3,649 6,193 10,154 7,058 7,367 7,477 70.9%* 20.7%
Derivatives 2,426 2,106 2,460 3,597 4,714 2,602 2,899 3,072 29.1%* (14.6%)
TOPIX futures 371 351 350 451 588 453 444 466 3.2%
Nikkei 225 futures (incl. mini) 760 651 814 1,189 1,605 938 1,086 1,165 (2.1%)
Nikkei 225 Options 752 658 825 1,384 1,932 819 932 976 (29.5%)
10-year JGB futures 459 393 415 502 502 339 382 401 (20.1%)
Others 82 50 53 69 85 51 53 62 (9.1%)
Basic Fees 371 365 362 352 353 284 275 270 (23.1%)
Access Fees 1,099 1,031 1,088 1,220 1,430 1,185 1,165 1,197 (1.8%)
Trading System Facilities Usage Fees 617 619 623 620 628 620 628 666 7.4%
Others 27 24 27 28 35 21 22 21 (26.3%)
Income from Securities Settlement 2,538 2,183 3,046 4,437 6,430 4,211 5,003 4,688 17.3% 5.7%
Listing Fees 2,156 2,533 2,620 2,784 2,517 3,179 3,400 3,210 11.8% 15.3%
Initial/Additional Listing Fees 473 858 883 1,050 786 1,521 1,566 1,413 34.6%
Annual Listing Fees 1,683 1,675 1,736 1,734 1,730 1,658 1,834 1,797 3.6%
Income from Information Services 3,786 3,725 3,680 3,803 4,086 3,885 3,990 4,153 15.3% 9.2%
Other 2,837 2,243 2,214 2,733 5,747 2,574 2,626 2,388 8.8% (12.6%)
Total 19,179 17,779 19,772 25,773 36,099 25,623 27,379 27,148 100% 5.3%
12
Referential financial data (combined basis)
Operating Revenues
Figures for Q1 and Q2 FY2012 are total of former TSEG and former OSE. Figures marked * are indicate percentage of Transaction Fees.
(JPY mil.)

Mar. 31, 2013 Mar. 31, 2014
<Assets>
Current assets 1,095,466 1,231,231
Cash and deposits 120,808 103,813
Operating accounts receivable 8,716 8,995
Securities - 802
Work in Process 2,467 61
Deferred tax assets 1,282 2,168
Margin funds for derivatives, etc. and when-issued
transactions 789,201 913,437
Deposits for clearing funds 161,086 188,734
Deposits as collateral for facilitating settlement 10,000 10,500
Other 1,912 2,729
Allowance for doubtful accounts (9) (12)
Non-current assets 180,919 172,482
Property, plant and equipment 8,673 7,066
Intangible assets 90,744 87,810
Goodwill 67,374 63,932
Other 23,370 23,878
Investments and other assets 81,501 77,605
Investment securities 41,304 37,344
Long-term loans receivable 37 29
Deferred tax assets 2,682 3,006
Net defined benefit asset - 2,914
Legal guarantee funds 600 522
Special assets for default compensation reserve
funds 27,948 27,948
Other 9,105 5,977
Allowance for doubtful accounts (177) (138)
Total assets 1,276,386 1,403,713
Mar. 31, 2013 Mar. 31, 2014
<Liabilities>
Current liabilities 1,083,157 1,178,274
Operating accounts payable 3,221 2,994
Short-term loans payable 18,670 32,500
Current portion of long-term loans payable 86,399 -
Income taxes payable 6,312 17,600
Provision for bonuses 1,223 1,420
Provision for directors’ bonuses 252 366
Margin funds received for derivatives, etc. and when-
issued transactions 789,201 913,437
Deposits received for clearing funds 161,086 188,734
Deposits received as collateral for facilitating settlement 10,000 10,500
Deposits received as trading participant security money 3,169 4,783
Other 3,620 5,937
Non-current liabilities 14,151 23,420
Long-term loans payable - 10,000
Deferred tax liabilities 5047 4,448
Provision for retirement benefits 7,580 -
Net defined benefit liability - 7,465
Returnable legal guarantee funds 600 522
Other 922 983
Total liabilities 1,097,308 1,201,694
<Net assets>
Shareholders' equity 167,440 188,485
Capital stock 11,500 11,500
Capital surplus 59,726 59,726
Retained earnings 96,213 117,264
Treasury shares - (5)
Total accumulated other comprehensive
income 9,088 7,857
Valuation difference on available-for-sale securities 9,088 8,006
Remeasurements of defined benefit plans - (149)
Minority interests 2,548 5,675
Total net assets 179,077 202,018
Total liabilities and net assets 1,276,386 1,403,713
(JPY mil.)
Referential financial data Consolidated Balance Sheets
*1
*2
*4
*2
*3
*1
*1 JSCC receives deposits of money from their clearing participants for the purpose of covering the risk of the clearing participants defaulting on their obligations. These amounts are recorded under both assets and liabilities in the corresponding items indicated for deposits. *2 TSE and OSE receive deposits of money from their trading participants for the purpose of covering the risk of entrustors of securities trading, etc. that arises from the trading participants defaulting on their obligations. These amounts are recorded under both assets and liabilities. *3 TSE receives deposits of money from its trading participants for the purpose of covering the risk of the trading participants defaulting on their obligations. This amount is recorded under assets as cash and deposits and under liabilities as deposits received as trading participant security money. 13
*4 JPX has reserve funds for the purpose of compensating losses incurred in the clearing operations of JSCC and OSE. This amount is recorded under assets as special assets for default compensation reserve funds.

14
Major Product Data
Trading Volume/Value
Average Daily Trading Volume/Value
*1 Trading value of common stocks
*2 Including trading value in former OSE 1st/2nd Sections
*3 Contracts of Nikkei 225 mini are calculated using a factor of 1/10
*4 Total of trading value in TSE 1st /2nd Sections(former OSE 1st /2nd Sections), Mothers, JASDAQ and TOKYO PRO Market
FY2012 FY2013 1Q
(Apr. 1, 2012- Jun 30, 2012)
2Q (Jul. 1, 2012-
Sep. 30, 2012)
3Q (Oct. 1, 2012- Dec. 31, 2012)
4Q (Jan. 1, 2013-
Mar. 31, 2013)
1Q (Apr. 1, 2013- Jun 30, 2013)
2Q (Jul. 1, 2013-
Sep. 30, 2013)
3Q (Oct. 1, 2013- Dec. 31, 2013)
4Q (Jan. 1, 2014-
Mar. 31, 2014)
Trading Value of Stocks (JPY mil.) (*1)
TSE 1st/2nd Section (*2) 76,567,741 67,269,696 83,683,764 141,743,922 214,059,115 143,333,854 151,527,314 152,254,413
Mothers 659,877 661,086 1,129,330 3,348,301 7,453,258 5,545,080 11,499,388 8,276,773
JASDAQ 1,262,229 957,928 1,551,488 3,674,444 9,207,734 6,233,226 6,203,970 6,448,238
Derivatives Trading Volume (contracts) (Trading Value for Nikkei 225 Options)
TOPIX Futures 4,008,210 3,729,113 3,776,656 5,196,028 7,207,955 5,118,622 5,191,516 5,584,606
Total Nikkei 225 Futures/mini (*3) 8,592,506 7,413,381 8,573,728 12,926,625 18,764,763 11,139,399 11,462,951 12,194,518
Nikkei 225 Futures 5,206,854 4,389,045 5,058,413 7,369,366 10,373,289 6,408,145 6,756,891 6,980,710
Nikkei225mini 33,856,526 30,243,360 35,153,145 55,572,590 83,914,741 47,312,547 47,060,600 52,138,082
Nikkei 225 Options (JPY mil.) 1,213,137 1,029,247 1,253,161 2,271,580 3,968,040 1,895,032 1,970,855 1,956,052
10-year JGB Futures 2,451,382 2,114,685 2,226,941 2,688,395 2,648,616 1,789,770 2,014,239 2,116,294
FY2012 FY2013 1Q
(Apr. 1, 2012- Jun 30, 2012)
2Q (Jul. 1, 2012-
Sep. 30, 2012)
3Q (Oct. 1, 2012- Dec. 31, 2012)
4Q (Jan. 1, 2013-
Mar. 31, 2013)
1Q (Apr. 1, 2013- Jun 30, 2013)
2Q (Jul. 1, 2013-
Sep. 30, 2013)
3Q (Oct. 1, 2013- Dec. 31, 2013)
4Q (Jan. 1, 2014-
Mar. 31, 2014) Trading Value of Stocks(JPY mil.) (*1) (*4) 1,265,965 1,093,472 1,392,977 2,564,943 3,721,292 2,462,098 2,729,528 2,878,956
Derivatives Trading Volume (contracts) (Trading Value for Nikkei 225 Options)
TOPIX Futures 64,649 59,192 60,914 89,587 116,257 81,248 83,734 96,286 Total Nikkei 225 Futures/mini (*3) 138,589 117,673 138,286 222,873 302,657 176,816 184,886 210,250 Nikkei 225 Futures 83,982 69,667 81,587 127,058 167,311 101,717 108,982 120,357 Nikkei225mini 546,073 480,053 566,986 958,148 1,353,464 750,993 759,042 898,932 Nikkei 225 Options (JPY mil.) 19,567 16,337 20,212 39,165 64,001 30,080 31,788 33,725 10-year JGB Futures 39,538 33,566 35,918 46,352 42,720 28,409 32,488 36,488

0
2,0 00,000
4,0 00,000
50
60
70
80
90
100
110
120
130
0
200
400
600
800
1,000
1,200
1,400
1,600
1,800
2,000
2004 2005 2006 2007 2008 2009 2010 2011 2012 2013 2014
Nikkei 225
TOPIX
JPY/USD Rate
Japanese Stock Market
Nikkei 225 (JPY 10) TOPIX (points) (JPY/USD)
Trading Value
JPY4tril.
JPY2tril.
Trading Value(TSE 1st)
15

* Trade/corporate names were changed:
– Osaka Securities Exchange
Osaka Exchange (since March 24, 2014)
– Tokyo Stock Exchange Regulation
Japan Exchange Regulation (since April 1, 2014)
<Structure of JPX >
Japan Exchange Group
(Atsushi Saito, Group CEO
Michio Yoneda, Group COO)
Tokyo Stock Exchange Akira Kiyota,
President &CEO
Osaka Exchange Hiromi Yamaji
President &CEO
Japan Exchange Regulation
Takafumi Sato
President
Japan Securities Clearing
Corporation Hironaga Miyama
President & CEO
Cash Equities Trading Derivatives Trading Self -regulation Clearing
Structure of Japan Exchange Group
16

Outline of JPX Stock
17
Stock Code 8697
Listed Exchange Tokyo Stock Exchange 1st Section
Fiscal Year From April 1 to March 31
Annual General
Shareholders Meeting In June
Record Date March 31
Number of Shares in
One Trading Unit 100 shares
Number of Shares(*) Total number of shares authorized to be issued: 1,090,000,000 shares
Total number of shares issued: 274,534,550 shares * A 5-for-1 stock split was conducted with an effective date of Oct. 1, 2013.
Basic Policy on Profit
Distribution
Giving due consideration to the importance of internal reserves for the purpose
of development of the system for strengthening competitiveness, etc. as an
exchange, and for the purpose of being prepared for the risks as the clearing
organization, JPX makes it a principle to conduct stable and continuous payment
of dividends. Specifically, JPX aims at a target dividend payout ratio of
around 40%.

18
Disclaimer
These materials are prepared solely for the purpose of providing information regarding
Japan Exchange Group Inc., and as such, they are not intended as any offer or sale of
securities or other similar action whether inside or outside Japan. Our securities have not
been and will not be registered under the United States Securities Act of 1933, as amended
(the “Securities Act”), and may not be offered or sold in the United States absent
registration or an applicable exemption from registration requirements.
These materials contain forward-looking statements. These statements are based on our
assumptions and beliefs in light of the information currently available to us and are subject
to risks and uncertainties. Should one or more of these risks or uncertainties materialize, or
should underlying assumptions prove incorrect, our actual results may vary materially from
those we currently anticipate. Given these risks and uncertainties, you are cautioned not to
place undue reliance on forward-looking statements, which speak only as of the date of
these materials. We disclaim any obligation to update any of the forward-looking
statements contained in these materials to reflect future actual events or developments.