Embed Size (px)
Citation preview
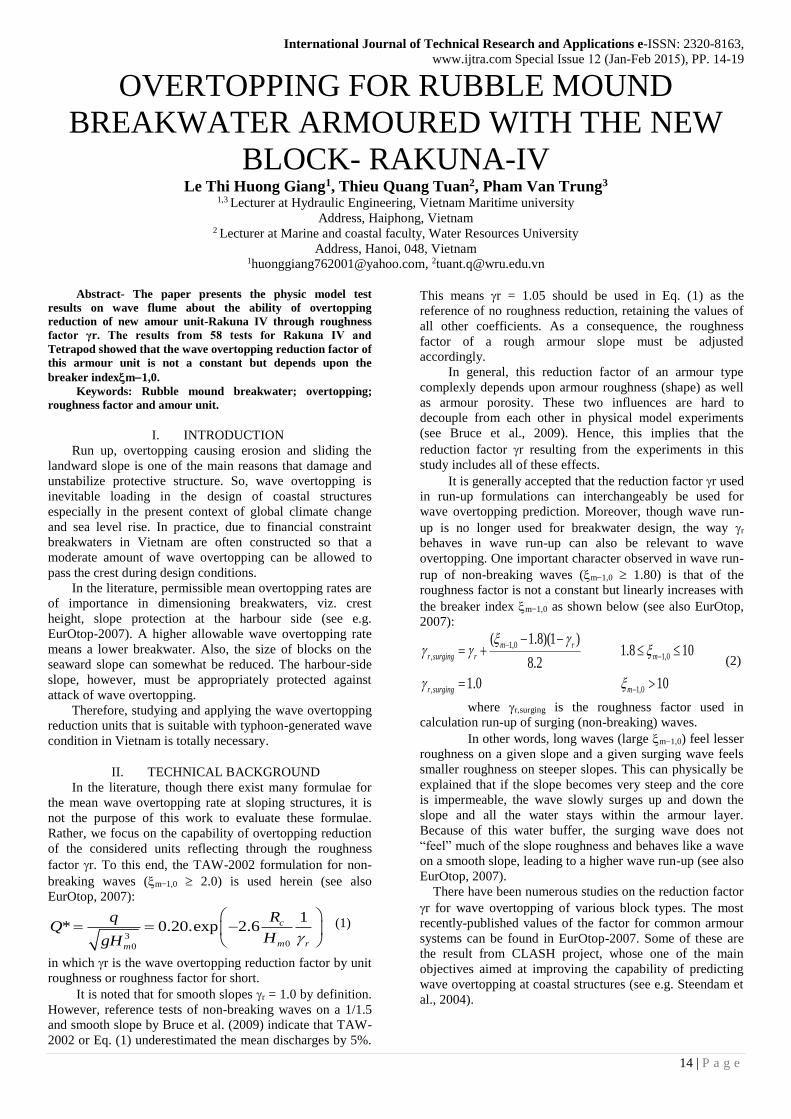
International Journal of Technical Research and Applications e-ISSN: 2320-8163,
www.ijtra.com Special Issue 12 (Jan-Feb 2015), PP. 14-19
14 | P a g e
OVERTOPPING FOR RUBBLE MOUND
BREAKWATER ARMOURED WITH THE NEW
BLOCK- RAKUNA-IV Le Thi Huong Giang1, Thieu Quang Tuan2, Pham Van Trung3
1,3 Lecturer at Hydraulic Engineering, Vietnam Maritime university
Address, Haiphong, Vietnam 2 Lecturer at Marine and coastal faculty, Water Resources University
Address, Hanoi, 048, Vietnam [email protected], [email protected]
Abstract- The paper presents the physic model test
results on wave flume about the ability of overtopping
reduction of new amour unit-Rakuna IV through roughness
factor γr. The results from 58 tests for Rakuna IV and
Tetrapod showed that the wave overtopping reduction factor of
this armour unit is not a constant but depends upon the
breaker indexm1,0.
Keywords: Rubble mound breakwater; overtopping;
roughness factor and amour unit.
I. INTRODUCTION
Run up, overtopping causing erosion and sliding the
landward slope is one of the main reasons that damage and
unstabilize protective structure. So, wave overtopping is
inevitable loading in the design of coastal structures
especially in the present context of global climate change
and sea level rise. In practice, due to financial constraint
breakwaters in Vietnam are often constructed so that a
moderate amount of wave overtopping can be allowed to
pass the crest during design conditions.
In the literature, permissible mean overtopping rates are
of importance in dimensioning breakwaters, viz. crest
height, slope protection at the harbour side (see e.g.
EurOtop-2007). A higher allowable wave overtopping rate
means a lower breakwater. Also, the size of blocks on the
seaward slope can somewhat be reduced. The harbour-side
slope, however, must be appropriately protected against
attack of wave overtopping.
Therefore, studying and applying the wave overtopping
reduction units that is suitable with typhoon-generated wave
condition in Vietnam is totally necessary.
II. TECHNICAL BACKGROUND
In the literature, though there exist many formulae for
the mean wave overtopping rate at sloping structures, it is
not the purpose of this work to evaluate these formulae.
Rather, we focus on the capability of overtopping reduction
of the considered units reflecting through the roughness
factor r. To this end, the TAW-2002 formulation for non-
breaking waves (m1,0 2.0) is used herein (see also
EurOtop, 2007):
300
1* 0.20.exp 2.6 c
m rm
RqQ
HgH
(1)
in which r is the wave overtopping reduction factor by unit
roughness or roughness factor for short.
It is noted that for smooth slopes r = 1.0 by definition.
However, reference tests of non-breaking waves on a 1/1.5
and smooth slope by Bruce et al. (2009) indicate that TAW-
2002 or Eq. (1) underestimated the mean discharges by 5%.
This means r = 1.05 should be used in Eq. (1) as the
reference of no roughness reduction, retaining the values of
all other coefficients. As a consequence, the roughness
factor of a rough armour slope must be adjusted
accordingly.
In general, this reduction factor of an armour type
complexly depends upon armour roughness (shape) as well
as armour porosity. These two influences are hard to
decouple from each other in physical model experiments
(see Bruce et al., 2009). Hence, this implies that the
reduction factor r resulting from the experiments in this
study includes all of these effects.
It is generally accepted that the reduction factor r used
in run-up formulations can interchangeably be used for
wave overtopping prediction. Moreover, though wave run-
up is no longer used for breakwater design, the way r
behaves in wave run-up can also be relevant to wave
overtopping. One important character observed in wave run-
rup of non-breaking waves (m1,0 1.80) is that of the
roughness factor is not a constant but linearly increases with
the breaker index m1,0 as shown below (see also EurOtop,
2007):
1,0
, 1,0
, 1,0
( 1.8)(1 )1.8 10
8.2
1.0 10
m r
r surging r m
r surging m
(2)
where r,surging is the roughness factor used in
calculation run-up of surging (non-breaking) waves.
In other words, long waves (large m1,0) feel lesser
roughness on a given slope and a given surging wave feels
smaller roughness on steeper slopes. This can physically be
explained that if the slope becomes very steep and the core
is impermeable, the wave slowly surges up and down the
slope and all the water stays within the armour layer.
Because of this water buffer, the surging wave does not
“feel” much of the slope roughness and behaves like a wave
on a smooth slope, leading to a higher wave run-up (see also
EurOtop, 2007).
There have been numerous studies on the reduction factor
r for wave overtopping of various block types. The most
recently-published values of the factor for common armour
systems can be found in EurOtop-2007. Some of these are
the result from CLASH project, whose one of the main
objectives aimed at improving the capability of predicting
wave overtopping at coastal structures (see e.g. Steendam et
al., 2004).
International Journal of Technical Research and Applications e-ISSN: 2320-8163, www.ijtra.com Special Issue 12 (Jan-Feb 2015), PP. 14-19
15 | P a g e
III. EXPERIMENTAL SETUP AND PROCEDURE
A. General layout and model cross-section
The 2D experiments were carried out in the wave flume
at the hydraulic laboratory of Water Resource University
(Hanoi, Vietnam). The flume is 45 m long, 1.0 m wide and
1.2 m high, equipped with an advanced automated system of
active reflection compensation (AUKEPC/ARC,
DELTARES) and capable of generating both regular and
irregular waves up to 30cm in height and 3.0s in peak
period. The general experimental layout is illustrated in Fig.
1.
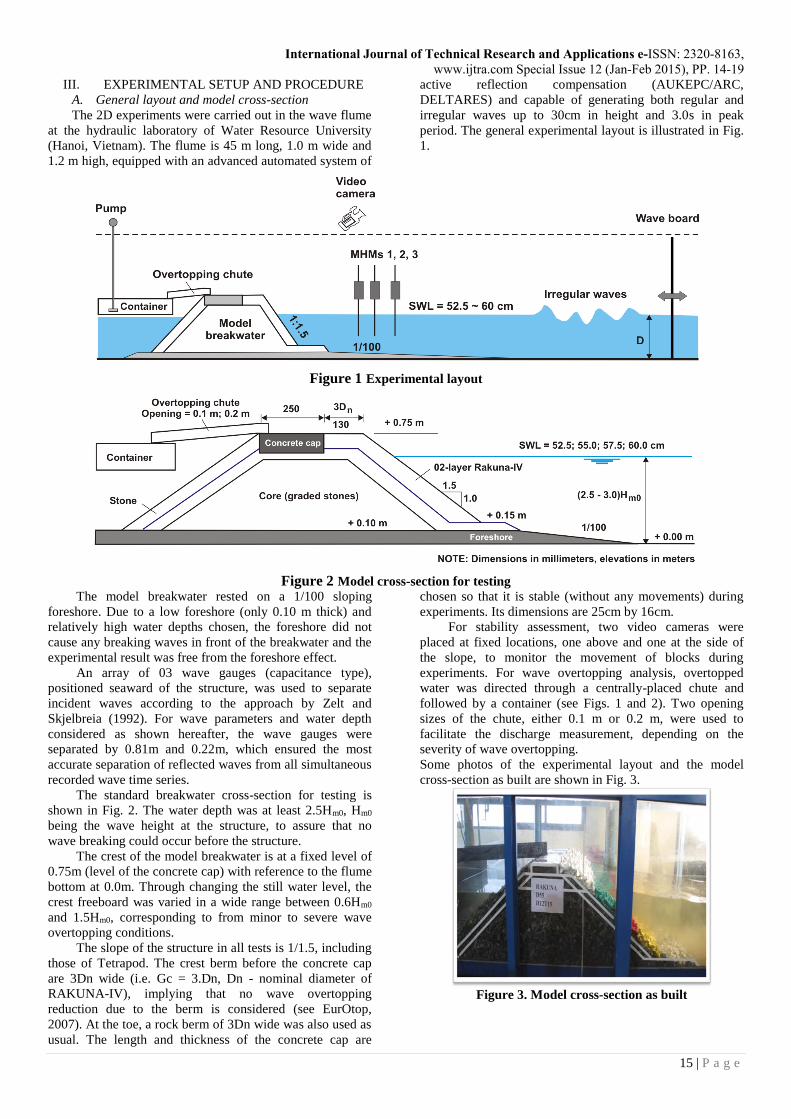
Figure 1 Experimental layout
Figure 2 Model cross-section for testing
The model breakwater rested on a 1/100 sloping
foreshore. Due to a low foreshore (only 0.10 m thick) and
relatively high water depths chosen, the foreshore did not
cause any breaking waves in front of the breakwater and the
experimental result was free from the foreshore effect.
An array of 03 wave gauges (capacitance type),
positioned seaward of the structure, was used to separate
incident waves according to the approach by Zelt and
Skjelbreia (1992). For wave parameters and water depth
considered as shown hereafter, the wave gauges were
separated by 0.81m and 0.22m, which ensured the most
accurate separation of reflected waves from all simultaneous
recorded wave time series.
The standard breakwater cross-section for testing is
shown in Fig. 2. The water depth was at least 2.5Hm0, Hm0
being the wave height at the structure, to assure that no
wave breaking could occur before the structure.
The crest of the model breakwater is at a fixed level of
0.75m (level of the concrete cap) with reference to the flume
bottom at 0.0m. Through changing the still water level, the
crest freeboard was varied in a wide range between 0.6Hm0
and 1.5Hm0, corresponding to from minor to severe wave
overtopping conditions.
The slope of the structure in all tests is 1/1.5, including
those of Tetrapod. The crest berm before the concrete cap
are 3Dn wide (i.e. Gc = 3.Dn, Dn - nominal diameter of
RAKUNA-IV), implying that no wave overtopping
reduction due to the berm is considered (see EurOtop,
2007). At the toe, a rock berm of 3Dn wide was also used as
usual. The length and thickness of the concrete cap are
chosen so that it is stable (without any movements) during
experiments. Its dimensions are 25cm by 16cm.
For stability assessment, two video cameras were
placed at fixed locations, one above and one at the side of
the slope, to monitor the movement of blocks during
experiments. For wave overtopping analysis, overtopped
water was directed through a centrally-placed chute and
followed by a container (see Figs. 1 and 2). Two opening
sizes of the chute, either 0.1 m or 0.2 m, were used to
facilitate the discharge measurement, depending on the
severity of wave overtopping.
Some photos of the experimental layout and the model
cross-section as built are shown in Fig. 3.
Figure 3. Model cross-section as built
International Journal of Technical Research and Applications e-ISSN: 2320-8163, www.ijtra.com Special Issue 12 (Jan-Feb 2015), PP. 14-19
16 | P a g e
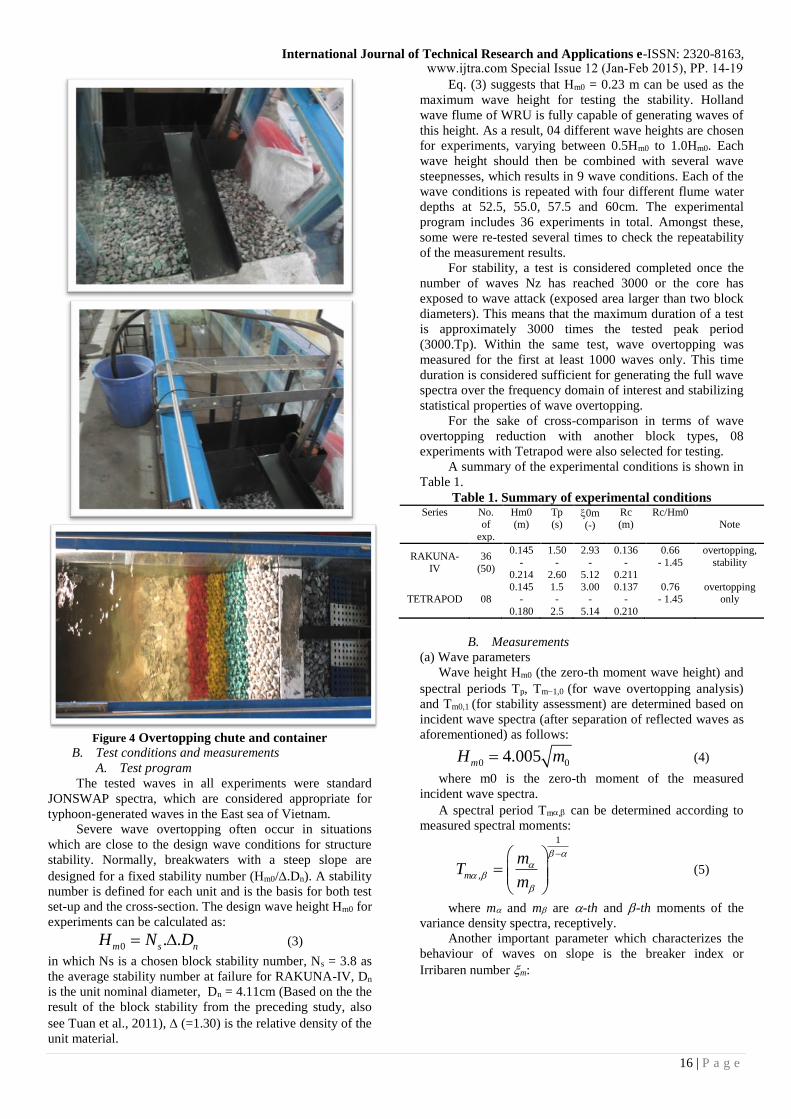
Figure 4 Overtopping chute and container
B. Test conditions and measurements
A. Test program
The tested waves in all experiments were standard
JONSWAP spectra, which are considered appropriate for
typhoon-generated waves in the East sea of Vietnam.
Severe wave overtopping often occur in situations
which are close to the design wave conditions for structure
stability. Normally, breakwaters with a steep slope are
designed for a fixed stability number (Hm0/.Dn). A stability
number is defined for each unit and is the basis for both test
set-up and the cross-section. The design wave height Hm0 for
experiments can be calculated as:
0 . .m s nH N D
(3)
in which Ns is a chosen block stability number, Ns = 3.8 as
the average stability number at failure for RAKUNA-IV, Dn
is the unit nominal diameter, Dn = 4.11cm (Based on the the
result of the block stability from the preceding study, also
see Tuan et al., 2011), (=1.30) is the relative density of the
unit material.
Eq. (3) suggests that Hm0 = 0.23 m can be used as the
maximum wave height for testing the stability. Holland
wave flume of WRU is fully capable of generating waves of
this height. As a result, 04 different wave heights are chosen
for experiments, varying between 0.5Hm0 to 1.0Hm0. Each
wave height should then be combined with several wave
steepnesses, which results in 9 wave conditions. Each of the
wave conditions is repeated with four different flume water
depths at 52.5, 55.0, 57.5 and 60cm. The experimental
program includes 36 experiments in total. Amongst these,
some were re-tested several times to check the repeatability
of the measurement results.
For stability, a test is considered completed once the
number of waves Nz has reached 3000 or the core has
exposed to wave attack (exposed area larger than two block
diameters). This means that the maximum duration of a test
is approximately 3000 times the tested peak period
(3000.Tp). Within the same test, wave overtopping was
measured for the first at least 1000 waves only. This time
duration is considered sufficient for generating the full wave
spectra over the frequency domain of interest and stabilizing
statistical properties of wave overtopping.
For the sake of cross-comparison in terms of wave
overtopping reduction with another block types, 08
experiments with Tetrapod were also selected for testing.
A summary of the experimental conditions is shown in
Table 1.
Table 1. Summary of experimental conditions Series No.
of
exp.
Hm0 (m)
Tp (s)
0m (-)
Rc (m)
Rc/Hm0 Note
RAKUNA-
IV
36
(50)
0.145
-
0.214
1.50
-
2.60
2.93
-
5.12
0.136
-
0.211
0.66
- 1.45
overtopping,
stability
TETRAPOD 08 0.145
-
0.180
1.5 -
2.5
3.00 -
5.14
0.137 -
0.210
0.76 - 1.45
overtopping only
B. Measurements
(a) Wave parameters
Wave height Hm0 (the zero-th moment wave height) and
spectral periods Tp, Tm1,0 (for wave overtopping analysis)
and Tm0,1 (for stability assessment) are determined based on
incident wave spectra (after separation of reflected waves as
aforementioned) as follows:
0 04.005mH m (4)
where m0 is the zero-th moment of the measured
incident wave spectra.
A spectral period Tm, can be determined according to
measured spectral moments: 1
,m
mT
m
(5)
where m and m are -th and -th moments of the
variance density spectra, receptively.
Another important parameter which characterizes the
behaviour of waves on slope is the breaker index or
Irribaren number m:
International Journal of Technical Research and Applications e-ISSN: 2320-8163,
17 | P a g e
0
2
tan
2
m
m
mm
m
s
Hs
gT
(6)
in which tan is structure slope (= 1/1.5), sm is fictitious
wave steepness based on spectral period Tm (either Tm1,0 or
Tm0,1).
(b) Wave overtopping
Overtopped water from the container is pumped out
and scaled with containers with volume reading marks. The
error in measuring the wave overtopping volume was
negligibly small.
The mean overtopping rate q is determined over the
test duration:
ovt
ovt
Vq
T (7)
where Vovt is the total overtopping volume measured
over the test duration for overtopping Tovt.
Since there was no means of disturbance-free supply of
water back into the flume, the mean water level was slowly
falling during the measurement. This means in fact that the
crest freeboard was slowly increasing, depending on the
severity of overtopping. To account for this effect, the flume
water level before and after each test was carefully
measured to determine the test-averaged crest freeboard Rc,
which is used later on for the data analysis.
0
1
2c c cR R R (8)
in which Rc0 is the initial crest freeboard (the vertical
distance from the structure crest level to the still water level
for testing), Rc is the flume water level difference before
and after a test. It is worth noticing that the structure crest
level considered herein is the level of the concrete cap, not
the top level of the main armour layer (see EurOtop-2007).
Overall, the maximum fall of the water level Rc was
about 1.5 cm, implying around 0.75 cm of additional
increase of freeboard for the heaviest overtopping. As
indicated in Tuan et al. (2006) through the use of the test-
averaged crest freeboard (and of course the fall in the water
level was implicitly accounted for in the measured wave
heights themselves) the effect of the flume drawdown within
this range on the overtopping parameterization can be
neglected.
C. Structure core and secondary layer
The study is restricted to the rubble mound type of
breakwaters. The model breakwater to be tested consists of
03 successive layers: armour (concrete blocks), secondary
and core. The two inner layers are grading stones, which are
carefully chosen to assure the stability of the armour layer as
is in prototype conditions.
As flume experiments are basically Froude scaled. The
top and the secondary layers of the model are scaled down
with a prescribed constant length-scale factor between
prototype and model (the model length scale) to describe the
stability of these two layers properly. The core, however,
would require a different scaling law according to Burcharth
et al. (1999) to minimize viscous effects and thus more
properly describe the friction of the porous flow in the
www.ijtra.com Special Issue 12 (Jan-Feb 2015), PP. 14-19model core. This approach often results in a coarser model
core. As we do not scale a real prototype breakwater the size
of the model core can be chosen so that it is not only
practical to build but also avoids instability of the cover
layer caused the internal setup.
The material sizes for the core and the under-layer for
this study are based on the preceding study of Tuan et al.
(2011) (see Table 2).
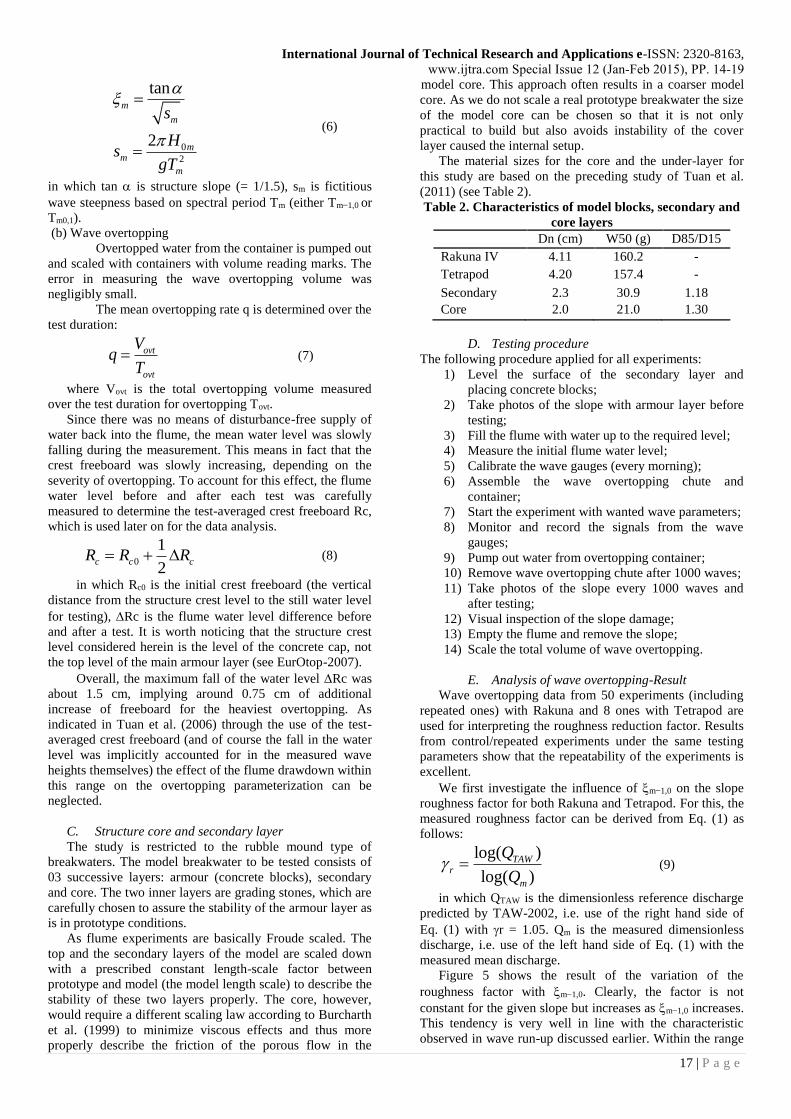
Table 2. Characteristics of model blocks, secondary and
core layers
Dn (cm) W50 (g) D85/D15
Rakuna IV 4.11 160.2 -
Tetrapod 4.20 157.4 -
Secondary 2.3 30.9 1.18
Core 2.0 21.0 1.30
D. Testing procedure
The following procedure applied for all experiments:
1) Level the surface of the secondary layer and
placing concrete blocks;
2) Take photos of the slope with armour layer before
testing;
3) Fill the flume with water up to the required level;
4) Measure the initial flume water level;
5) Calibrate the wave gauges (every morning);
6) Assemble the wave overtopping chute and
container;
7) Start the experiment with wanted wave parameters;
8) Monitor and record the signals from the wave
gauges;
9) Pump out water from overtopping container;
10) Remove wave overtopping chute after 1000 waves;
11) Take photos of the slope every 1000 waves and
after testing;
12) Visual inspection of the slope damage;
13) Empty the flume and remove the slope;
14) Scale the total volume of wave overtopping.
E. Analysis of wave overtopping-Result
Wave overtopping data from 50 experiments (including
repeated ones) with Rakuna and 8 ones with Tetrapod are
used for interpreting the roughness reduction factor. Results
from control/repeated experiments under the same testing
parameters show that the repeatability of the experiments is
excellent.
We first investigate the influence of m1,0 on the slope
roughness factor for both Rakuna and Tetrapod. For this, the
measured roughness factor can be derived from Eq. (1) as
follows:
log( )
log( )
TAWr
m
Q
Q (9)
in which QTAW is the dimensionless reference discharge
predicted by TAW-2002, i.e. use of the right hand side of
Eq. (1) with r = 1.05. Qm is the measured dimensionless
discharge, i.e. use of the left hand side of Eq. (1) with the
measured mean discharge.
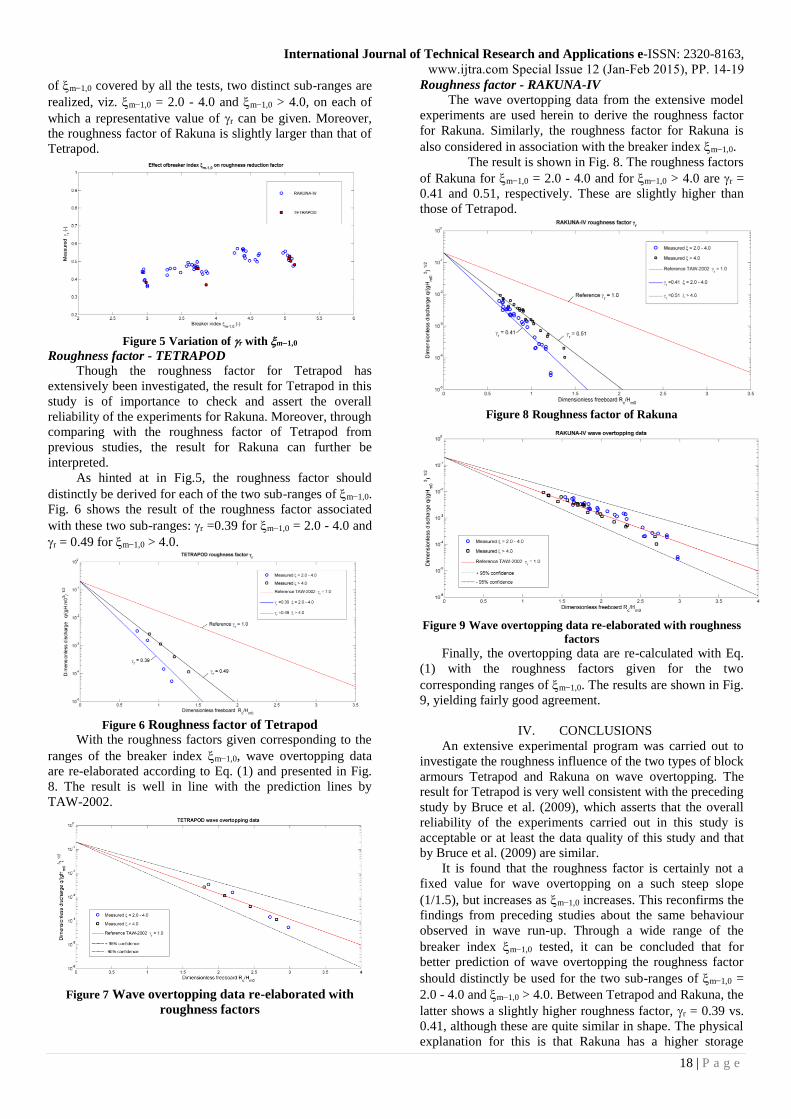
Figure 5 shows the result of the variation of the
roughness factor with m1,0. Clearly, the factor is not
constant for the given slope but increases as m1,0 increases.
This tendency is very well in line with the characteristic
observed in wave run-up discussed earlier. Within the range
International Journal of Technical Research and Applications e-ISSN: 2320-8163,
www.ijtra.com Special Issue 12 (Jan-Feb 2015), PP. 14-19
18 | P a g e
of m1,0 covered by all the tests, two distinct sub-ranges are
realized, viz. m1,0 = 2.0 - 4.0 and m1,0 > 4.0, on each of
which a representative value of r can be given. Moreover,
the roughness factor of Rakuna is slightly larger than that of
Tetrapod.
Figure 5 Variation of r with m1,0
Roughness factor - TETRAPOD
Though the roughness factor for Tetrapod has
extensively been investigated, the result for Tetrapod in this
study is of importance to check and assert the overall
reliability of the experiments for Rakuna. Moreover, through
comparing with the roughness factor of Tetrapod from
previous studies, the result for Rakuna can further be
interpreted.
As hinted at in Fig.5, the roughness factor should
distinctly be derived for each of the two sub-ranges of m1,0.
Fig. 6 shows the result of the roughness factor associated
with these two sub-ranges: r =0.39 for m1,0 = 2.0 - 4.0 and
r = 0.49 for m1,0 > 4.0.
Figure 6 Roughness factor of Tetrapod
With the roughness factors given corresponding to the
ranges of the breaker index m1,0, wave overtopping data
are re-elaborated according to Eq. (1) and presented in Fig.
8. The result is well in line with the prediction lines by
TAW-2002.
Figure 7 Wave overtopping data re-elaborated with
roughness factors
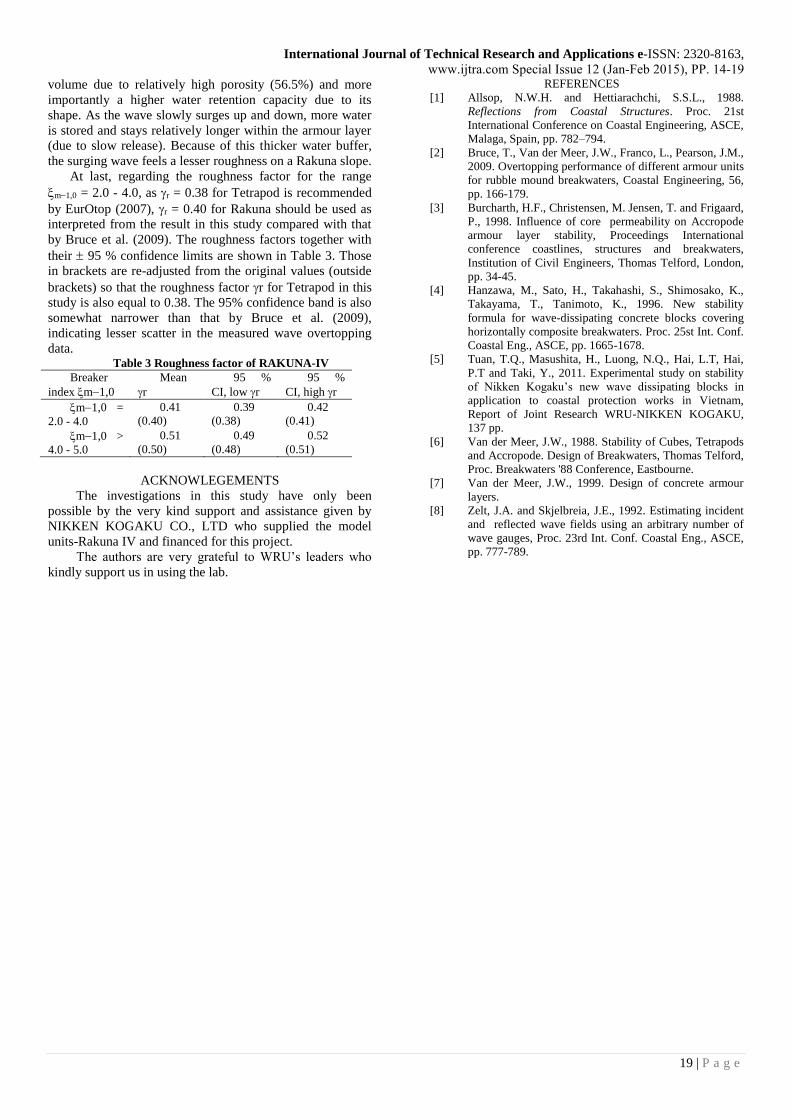
Roughness factor - RAKUNA-IV
The wave overtopping data from the extensive model
experiments are used herein to derive the roughness factor
for Rakuna. Similarly, the roughness factor for Rakuna is
also considered in association with the breaker index m1,0.
The result is shown in Fig. 8. The roughness factors
of Rakuna for m1,0 = 2.0 - 4.0 and for m1,0 > 4.0 are r =
0.41 and 0.51, respectively. These are slightly higher than
those of Tetrapod.
Figure 8 Roughness factor of Rakuna
Figure 9 Wave overtopping data re-elaborated with roughness
factors
Finally, the overtopping data are re-calculated with Eq.
(1) with the roughness factors given for the two
corresponding ranges of m1,0. The results are shown in Fig.
9, yielding fairly good agreement.
IV. CONCLUSIONS
An extensive experimental program was carried out to
investigate the roughness influence of the two types of block
armours Tetrapod and Rakuna on wave overtopping. The
result for Tetrapod is very well consistent with the preceding
study by Bruce et al. (2009), which asserts that the overall
reliability of the experiments carried out in this study is
acceptable or at least the data quality of this study and that
by Bruce et al. (2009) are similar.
It is found that the roughness factor is certainly not a
fixed value for wave overtopping on a such steep slope
(1/1.5), but increases as m1,0 increases. This reconfirms the
findings from preceding studies about the same behaviour
observed in wave run-up. Through a wide range of the
breaker index m1,0 tested, it can be concluded that for
better prediction of wave overtopping the roughness factor
should distinctly be used for the two sub-ranges of m1,0 =
2.0 - 4.0 and m1,0 > 4.0. Between Tetrapod and Rakuna, the
latter shows a slightly higher roughness factor, r = 0.39 vs.
0.41, although these are quite similar in shape. The physical
explanation for this is that Rakuna has a higher storage
International Journal of Technical Research and Applications e-ISSN: 2320-8163,
www.ijtra.com Special Issue 12 (Jan-Feb 2015), PP. 14-19
19 | P a g e
volume due to relatively high porosity (56.5%) and more
importantly a higher water retention capacity due to its
shape. As the wave slowly surges up and down, more water
is stored and stays relatively longer within the armour layer
(due to slow release). Because of this thicker water buffer,
the surging wave feels a lesser roughness on a Rakuna slope.
At last, regarding the roughness factor for the range
m1,0 = 2.0 - 4.0, as r = 0.38 for Tetrapod is recommended
by EurOtop (2007), r = 0.40 for Rakuna should be used as
interpreted from the result in this study compared with that
by Bruce et al. (2009). The roughness factors together with
their 95 % confidence limits are shown in Table 3. Those
in brackets are re-adjusted from the original values (outside
brackets) so that the roughness factor r for Tetrapod in this
study is also equal to 0.38. The 95% confidence band is also
somewhat narrower than that by Bruce et al. (2009),
indicating lesser scatter in the measured wave overtopping
data. Table 3 Roughness factor of RAKUNA-IV
Breaker
index m1,0
Mean
r
95 %
CI, low r
95 %
CI, high r
m1,0 =
2.0 - 4.0
0.41
(0.40)
0.39
(0.38)
0.42
(0.41)
m1,0 >
4.0 - 5.0
0.51
(0.50)
0.49
(0.48)
0.52
(0.51)
ACKNOWLEGEMENTS
The investigations in this study have only been
possible by the very kind support and assistance given by
NIKKEN KOGAKU CO., LTD who supplied the model
units-Rakuna IV and financed for this project.
The authors are very grateful to WRU’s leaders who
kindly support us in using the lab.
REFERENCES
[1] Allsop, N.W.H. and Hettiarachchi, S.S.L., 1988.
Reflections from Coastal Structures. Proc. 21st
International Conference on Coastal Engineering, ASCE,
Malaga, Spain, pp. 782–794.
[2] Bruce, T., Van der Meer, J.W., Franco, L., Pearson, J.M.,
2009. Overtopping performance of different armour units
for rubble mound breakwaters, Coastal Engineering, 56,
pp. 166-179.
[3] Burcharth, H.F., Christensen, M. Jensen, T. and Frigaard,
P., 1998. Influence of core permeability on Accropode
armour layer stability, Proceedings International
conference coastlines, structures and breakwaters,
Institution of Civil Engineers, Thomas Telford, London,
pp. 34-45.
[4] Hanzawa, M., Sato, H., Takahashi, S., Shimosako, K.,
Takayama, T., Tanimoto, K., 1996. New stability
formula for wave-dissipating concrete blocks covering
horizontally composite breakwaters. Proc. 25st Int. Conf.
Coastal Eng., ASCE, pp. 1665-1678.
[5] Tuan, T.Q., Masushita, H., Luong, N.Q., Hai, L.T, Hai,
P.T and Taki, Y., 2011. Experimental study on stability
of Nikken Kogaku’s new wave dissipating blocks in
application to coastal protection works in Vietnam,
Report of Joint Research WRU-NIKKEN KOGAKU,
137 pp.
[6] Van der Meer, J.W., 1988. Stability of Cubes, Tetrapods
and Accropode. Design of Breakwaters, Thomas Telford,
Proc. Breakwaters '88 Conference, Eastbourne.
[7] Van der Meer, J.W., 1999. Design of concrete armour
layers.
[8] Zelt, J.A. and Skjelbreia, J.E., 1992. Estimating incident
and reflected wave fields using an arbitrary number of
wave gauges, Proc. 23rd Int. Conf. Coastal Eng., ASCE,
pp. 777-789.