Embed Size (px)
Citation preview

Overcoming Barriers to the Effective Implementation
of Educational Information Systems
New York City’s Achievement Reporting and Innovation System (ARIS)
James S. LiebmanSimon H. Rifkind Professor
Columbia Law School
Educational Information Systems for Innovation and Improvement Workshop, October 14, 2010
1

2
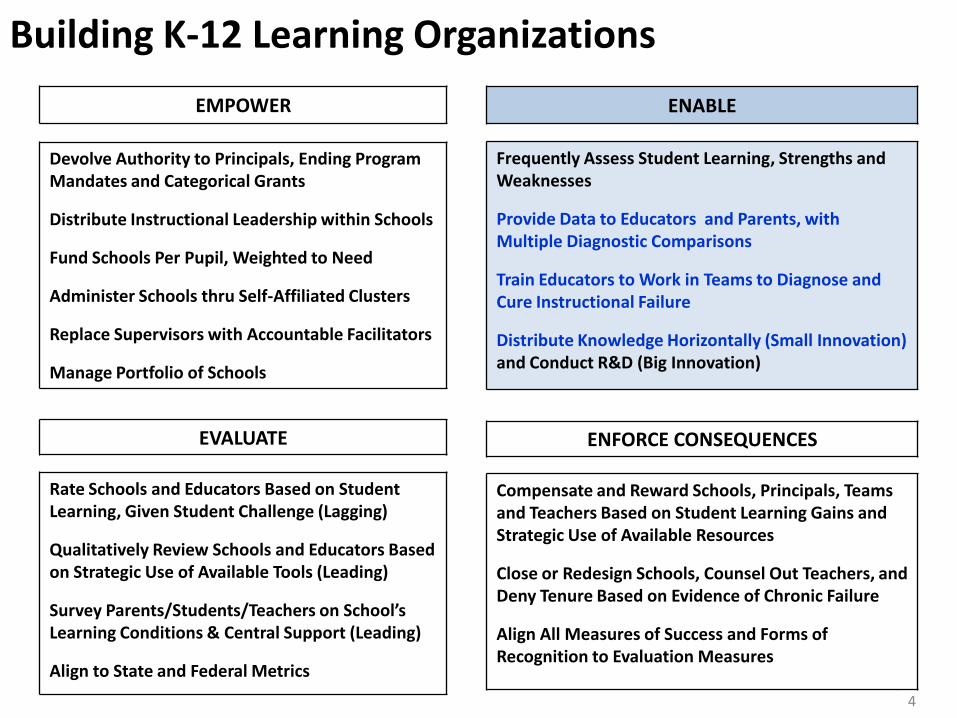
ENABLE
Frequently Assess Student Learning, Strengths and Weaknesses
Provide Data to Educators and Parents, with Multiple Diagnostic Comparisons
Train Educators to Work in Teams to Diagnose and Cure Instructional Failure
Distribute Knowledge Horizontally (Small Innovation) and Conduct R&D (Big Innovation)
EMPOWER
Devolve Authority to Principals, Ending Program Mandates and Categorical Grants
Distribute Instructional Leadership within Schools
Fund Schools Per Pupil, Weighted to Need
Administer Schools thru Self-Affiliated Clusters
Replace Supervisors with Accountable Facilitators
Manage Portfolio of Schools
EVALUATE
Rate Schools and Educators Based on Student Learning, Given Student Challenge (Lagging)
Qualitatively Review Schools and Educators Based on Strategic Use of Available Tools (Leading)
Survey Parents/Students/Teachers on School’s Learning Conditions & Central Support (Leading)
Align to State and Federal Metrics
ENFORCE CONSEQUENCES
Compensate and Reward Schools, Principals, Teams and Teachers Based on Student Learning Gains and Strategic Use of Available Resources
Close or Redesign Schools, Counsel Out Teachers, and Deny Tenure Based on Evidence of Chronic Failure
Align All Measures of Success and Forms of Recognition to Evaluation Measures
Building K-12 Learning Organizations
2

3
ENABLE
Frequently Assess Student Learning, Strengths and Weaknesses
Provide Data to Educators and Parents, with Multiple Diagnostic Comparisons
Train Educators to Work in Teams to Diagnose and Cure Instructional Failure
Distribute Knowledge Horizontally (Small Innovation) and Conduct R&D (Big Innovation)
EMPOWER
Devolve Authority to Principals, Ending Program Mandates and Categorical Grants
Distribute Instructional Leadership within Schools
Fund Schools Per Pupil, Weighted to Need
Administer Schools thru Self-Affiliated Clusters
Replace Supervisors with Accountable Facilitators
Manage Portfolio of Schools
EVALUATE
Rate Schools and Educators Based on Student Learning, Given Student Challenge (Lagging)
Qualitatively Review Schools and Educators Based on Strategic Use of Available Tools (Leading)
Survey Parents/Students/Teachers on School’s Learning Conditions & Central Support (Leading)
Align to State and Federal Metrics
ENFORCE CONSEQUENCES
Compensate and Reward Schools, Principals, Teams and Teachers Based on Student Learning Gains and Strategic Use of Available Resources
Close or Redesign Schools, Counsel Out Teachers, and Deny Tenure Based on Evidence of Chronic Failure
Align All Measures of Success and Forms of Recognition to Evaluation Measures
Building K-12 Learning Organizations
3
4
ENABLE
Frequently Assess Student Learning, Strengths and Weaknesses
Provide Data to Educators and Parents, with Multiple Diagnostic Comparisons
Train Educators to Work in Teams to Diagnose and Cure Instructional Failure
Distribute Knowledge Horizontally (Small Innovation) and Conduct R&D (Big Innovation)
EMPOWER
Devolve Authority to Principals, Ending Program Mandates and Categorical Grants
Distribute Instructional Leadership within Schools
Fund Schools Per Pupil, Weighted to Need
Administer Schools thru Self-Affiliated Clusters
Replace Supervisors with Accountable Facilitators
Manage Portfolio of Schools
EVALUATE
Rate Schools and Educators Based on Student Learning, Given Student Challenge (Lagging)
Qualitatively Review Schools and Educators Based on Strategic Use of Available Tools (Leading)
Survey Parents/Students/Teachers on School’s Learning Conditions & Central Support (Leading)
Align to State and Federal Metrics
ENFORCE CONSEQUENCES
Compensate and Reward Schools, Principals, Teams and Teachers Based on Student Learning Gains and Strategic Use of Available Resources
Close or Redesign Schools, Counsel Out Teachers, and Deny Tenure Based on Evidence of Chronic Failure
Align All Measures of Success and Forms of Recognition to Evaluation Measures
Building K-12 Learning Organizations
4

47
44
4745
4446
5150
48 48 48 4850 50 50
51 5153
54
5860
62
6668
47
49
53
59
34
3738
3739
45
51
50
55
1986 1988 1990 1992 1994 1996 1998 2000 2002 2004 2006 2008
After Stagnating, NYC’s Graduation Rate Has Increased
Percent of Students in a Cohort Graduating from High School in 4 Years
Class of
1992-2002: + 0% 2002-2009: + 33%1986-1992: + 9%
NYC Calculation Method NY State Calculation Method
Notes: NYC traditional calculation includes Local and Regents Diplomas, GEDs, Special Education diplomas, and August graduates. It does not include disabled students in self-contained classrooms or
District 75 students. The NYS calculation, used since 2005, includes Local and Regents Diplomas and all disabled students. It does not include GEDs and Special Education diplomas. The federal rate,
published by EdWeek, uses a method called the Cumulative Promotion Index (CPI).
NY State Calculation Method(Including August Grads)
61
5
56
63
Federal Calculation Method(includes students who transfer out)
5

Changing the Way New York City Schools Work
6
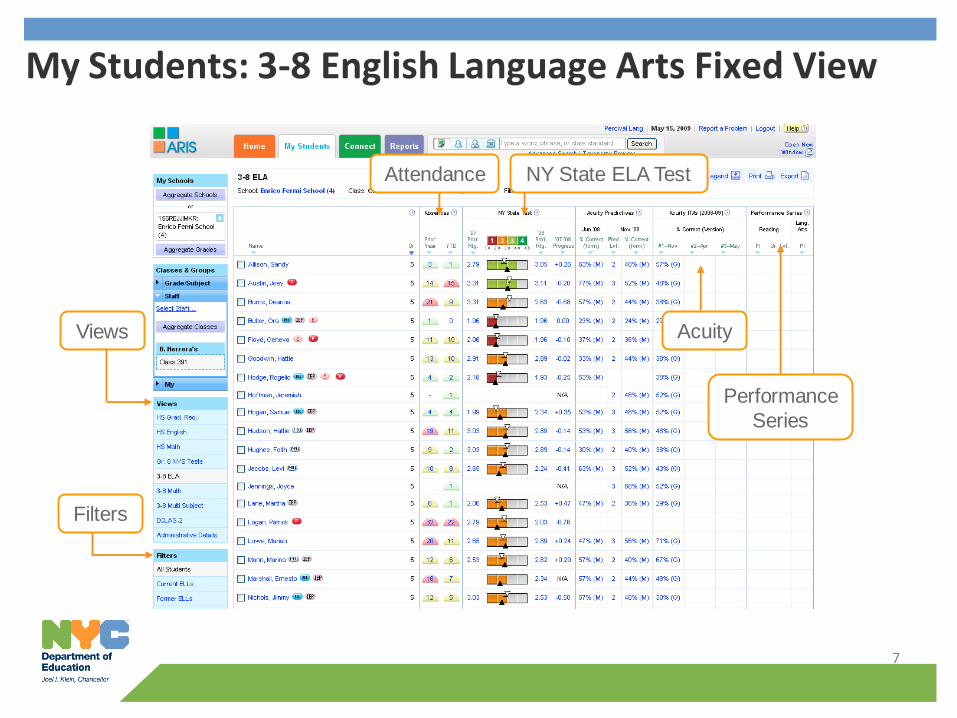
My Students: 3-8 English Language Arts Fixed View
Attendance NY State ELA Test
Views
Filters
Acuity
Performance
Series
7

8
My Students: High School Graduation Req’ts Fixed View
8

9
Aggregate Data
Views
School
Regents
Results
The Aggregate School View displays key performance metrics and some
administrative information for educators who work with multiple schools.
Principals see similar data for their own school. Teachers can see their
own classes.
Student Data Grade 8 NYS Tests
9

1010
My Students: Student ProfileTranscript
Credits Earned
gfg
Rafael Claudio Gordan
Attendance
Assessment Summary
Current Courses

11
Customized Reports

12
• Key knowledge is developed locally in individual schools inresponse to problems presented by individual students and groups of students.
• Connect enables collaboration through web 2.0 tools (wikis, blogs, discussion forums, communities) so that educators can share and refine best practices – describe what worked (or did not) when they tried to solve a similar problem. Provides:
– The framework for ongoing sharing of outcomes and learning across teams, across schools, and across the city.
– A forum for discussion of instructional practices, through public and private communities
– A library of instructional resources, many tagged to specific state standards.
ARIS Connect

13
ARIS Parent Link: Log In
Parent login
9 DOE Languages
Parents can log on at: www.arisparentlink.org

14
ARIS Parent Link: Welcome
What is my child learning?
How is my child doing?
How can I help my child
learn?
1515
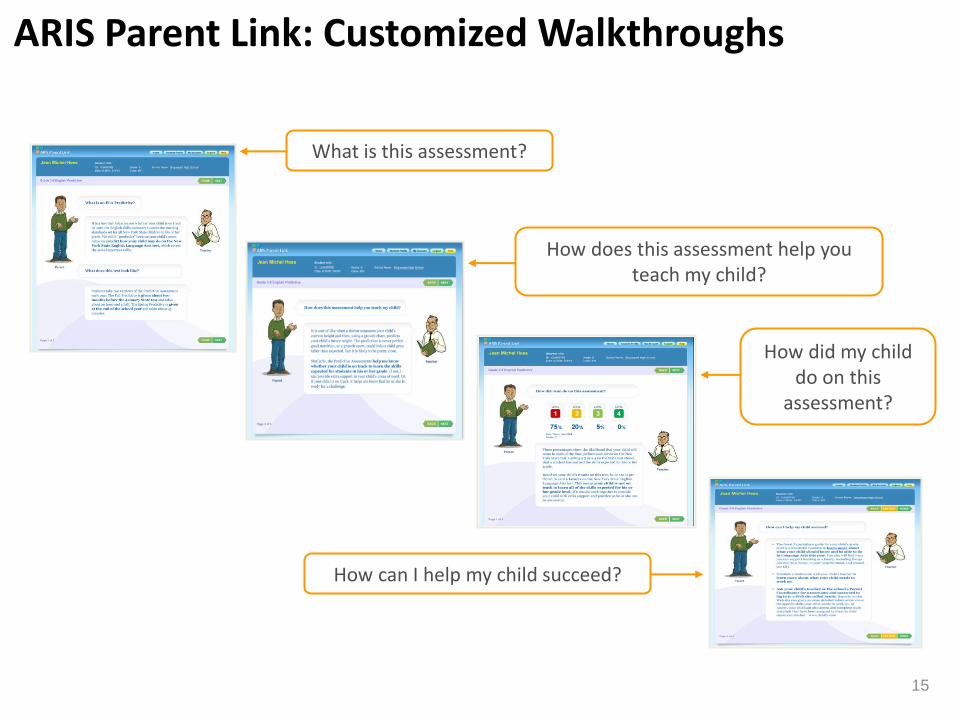
ARIS Parent Link: Customized Walkthroughs
What is this assessment?
How does this assessment help you teach my child?
How did my child do on this
assessment?
How can I help my child succeed?
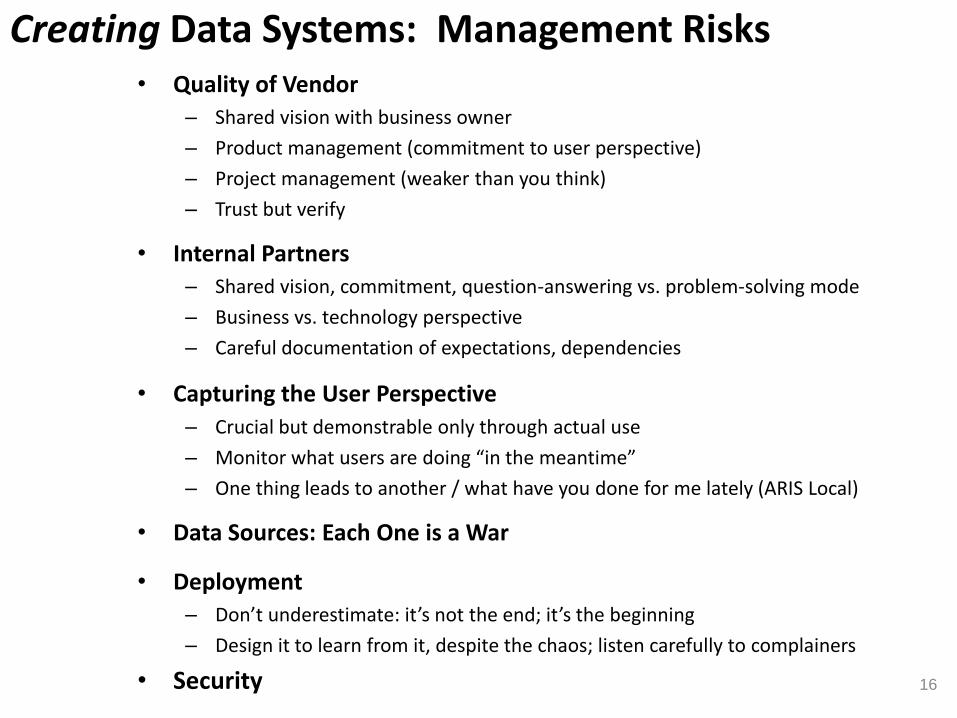
Creating Data Systems: Management Risks • Quality of Vendor
– Shared vision with business owner
– Product management (commitment to user perspective)
– Project management (weaker than you think)
– Trust but verify
• Internal Partners
– Shared vision, commitment, question-answering vs. problem-solving mode
– Business vs. technology perspective
– Careful documentation of expectations, dependencies
• Capturing the User Perspective
– Crucial but demonstrable only through actual use
– Monitor what users are doing “in the meantime”
– One thing leads to another / what have you done for me lately (ARIS Local)
• Data Sources: Each One is a War
• Deployment
– Don’t underestimate: it’s not the end; it’s the beginning
– Design it to learn from it, despite the chaos; listen carefully to complainers
• Security 16

17
The ability to log in to ARIS does not automatically provide access to private student-level data. Federal law limits who may view that information.
Teachers automatically have access to information on the students enrolled in their classes.
Principals automatically have access to information on students enrolled in their school.
A principal can grant school staff members access to student-level information if there is a legitimate educational need.
Central office may grant central staff member access to certain students’ information if there is a legitimate educational need.
Parents’ and guardians’ school provides them with notification of their child’s unique I.D. and, in a separate circulation, with a temporary password. When they log in the first time, they are urged to change the password.
Protecting Individual Student Data
Aggregate data for all classrooms, schools, networks, the district as a whole (exclusive of cells with 5 or fewer students) is available to all educators for comparative purposes.

Using Data Systems: Consumer-Related Risks
18
Risk Response
Teachers Can’t Use the Data Inquiry Teams
Teachers Won’t Use the Data(Accountability/Consequences Vs. Empowerment/Enablement)
•Clearly Delineate Summative and Formative Data•Find the Right Balance (and Repeat)•Use Data Believe in Data Add Data
Parents Can’t Use the Data Data-Informed Parent/Teacher Conferences
The Public Won’t Tolerate the Cost •Teacher and Parent Satisfaction• In the Meantime, Public Information

19
Data Informed Inquiry & Improvement
Factors affecting data-informed inquiry and improvement:
• Quality of data (but using it is the only way to improve it – data specialists)
• Teacher access to the data – ability to navigate the new system; ability to record local data and “mix and match” it with central data
• Teacher ability to interpret data and diagnose student needs
• Teacher ability to diagnose the conditions of learning that led to those needs and “prescribe” an instructional change strategy
• Teacher ability to seek out additional resources (e.g., colleagues, research, instructional resources)
• Teacher ability to monitor and evaluate whether treatments and resources are effective, and modify them as needed
• Teacher ability to use the new information generated to re-diagnose the instructional barriers to the students who do not respond to treatment
• Teacher ability to analyze larger systems that produced the conditions of learning and to design and implement system-level change strategies
• Inquiry Team Handbook: http://is239.schoolwires.com/14031072702333890/lib/14031072702333890/_files/Inquiry_Team_Handbook.pdf
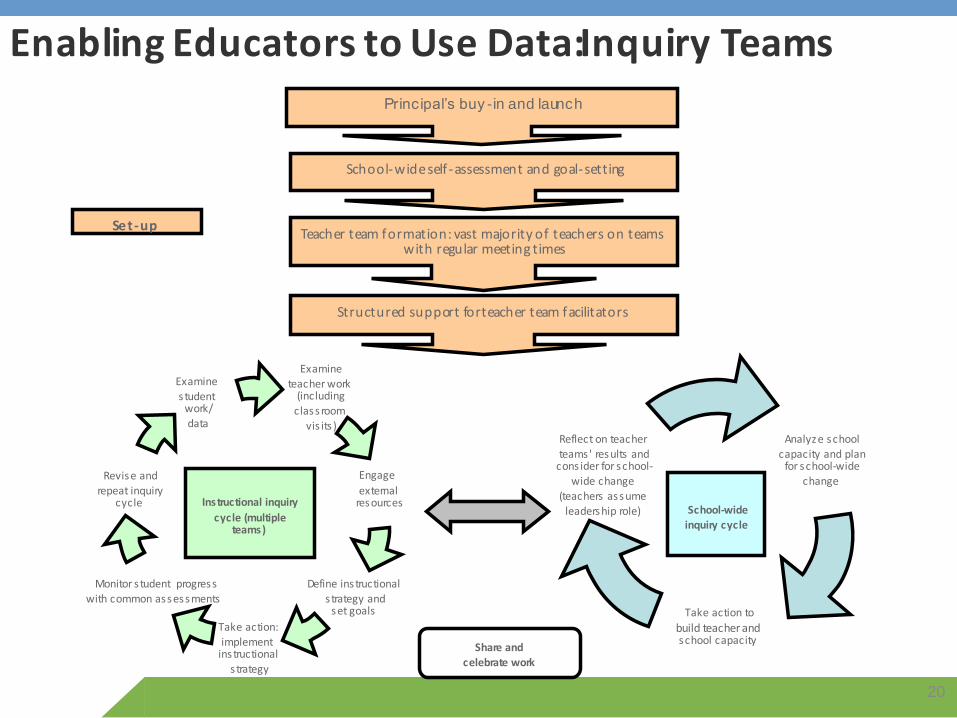
Principal’s buy -in and launch
School-wide self -assessment and goal-setting
Teacher team formation: vast majority of teachers on teams with regular meeting times
Share and
celebrate work
Structured support for teacher team facilitators
Examine
teacher work (including
classroom
vis its )
Revise and
repeat inquirycycle
Examine
s tudent work/
data
Monitor s tudent progress
with common assessments
Take action:
implement instructional
s trategy
Define instructional
s trategy and set goals
Engage
external resourcesInstructional inquiry
cycle (multiple teams)
Set-up
Take action to
build teacher and school capacity
Reflect on teacher
teams' results and cons ider for school-
wide change
(teachers assume
leadership role)
Analyze school
capacity and plan for school-wide
change
School-wide
inquiry cycle
Enabling Educators to Use Data: Inquiry Teams
20
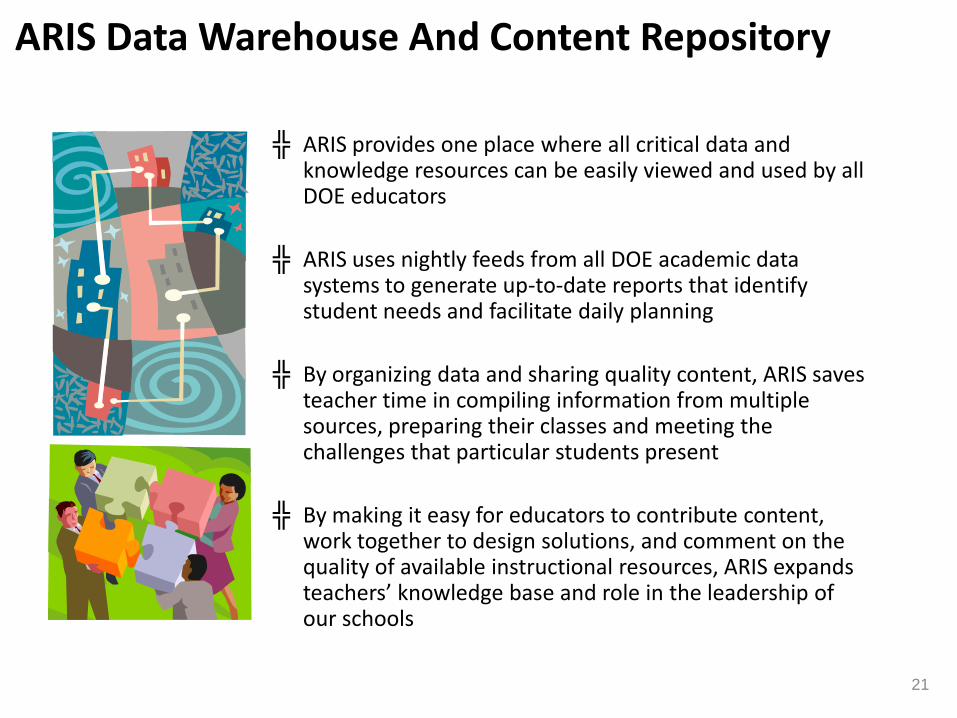
21
╬ ARIS provides one place where all critical data and knowledge resources can be easily viewed and used by all DOE educators
╬ ARIS uses nightly feeds from all DOE academic data systems to generate up-to-date reports that identify student needs and facilitate daily planning
╬ By organizing data and sharing quality content, ARIS saves teacher time in compiling information from multiple sources, preparing their classes and meeting the challenges that particular students present
╬ By making it easy for educators to contribute content, work together to design solutions, and comment on the quality of available instructional resources, ARIS expands teachers’ knowledge base and role in the leadership of our schools
ARIS Data Warehouse And Content Repository