Embed Size (px)
Citation preview
American Institute of Aeronautics and Astronautics
1
Over-flight Risk Considerations for the Launch of an ELV
Rocket to an ISS Inclination
Steven Millard*
Federal Aviation Administration, Washington, DC, 20591
Congress granted the FAA the authority to license commercial launch and reentry operations to ensure
protection of public, property, the national security and foreign policy interests of the United States and to
encourage, facilitate, and promote U.S. Commercial Space Transportation. To meet this responsibility, the
FAA performs safety evaluations of license applications to conduct commercial launches from the United
States or outside the United States by a U.S. citizen or an entity organized under the laws of the United
States. This paper discusses an example FAA analysis of the risk to the public resulting from the launch of
a space vehicle to the International Space Station from a launch site at the Eastern Range, headquartered at
Cape Canaveral, Florida, and the Mid-Atlantic Regional Spaceport, located in Wallops, Virginia. This
work is presented to address some of the challenges launch operators competing for the Commercial
Orbital Transportations Services (COTS) and the FAA face in their efforts to promote commercial space
activities while ensuring the launch operator meets their regulatory obligations and responsibility for
protecting the public.
Nomenclature
u1 = mean of data element 1 bivariate probability density function
u2 = mean of data element 2 bivariate probability density function
ρ = correlation between data element 1 and data element 2
σ1 = standard deviation of data element 1 bivariate probability density function
σ2 = standard deviation of data element 2 bivariate probability density function
σ12 = covariance between element 1 and element 2
x1 = data element 1 value
x2 = data element 2 value
Ec = Expected casualties
Pi = Probability of impact in the ith area
ρp = population density
Ca = sheltered casualty area
Photo: Delta II Wikipedia
* Aerospace Engineer, Federal Aviation Administration, AST-200, and AIAA Member.
AIAA Atmospheric and Space Environments Conference2 - 5 August 2010, Toronto, Ontario Canada
AIAA 2010-7996
This material is declared a work of the U.S. Government and is not subject to copyright protection in the United States.

American Institute of Aeronautics and Astronautics
2
I. Introduction
NASA contracts to resupply the International Space Stations (ISS) require ascent trajectories to the ISS, which pose
risk to the public on the ground in the event of a failure during ascent. Proposed COTS missions have chosen
unique approaches to vehicle design and launch point. The choice of launch point and mission profile exposes a
different area of the public to risk as the design of the nominal trajectory places the vehicle over different continents.
To gauge the relative risk, the FAA compared example trajectories from WFF and CCAFS for generic missions of
an expendable launch vehicle (ELV) to the ISS overflying Africa. This assessment assumes an identical launch
vehicle flown from each launch pad to inclinations of 28.5, 34.5, and 51.6 degrees. From the Wallops launch pad,
the FAA assumed a descending node ascent; while from the Cape Canaveral launch pad, an ascending node was
assumed. For the Wallops launch, only a 51.6 inclination was assessed because a 28.6 and 34.5 degree inclination
mission from this location is undesirable from a performance viewpoint. It should be noted that a significant factor
for an operation choosing one launch site location over another is vehicle performance. This paper does not address
the tradeoffs associated with vehicle performance and risk.
II. Objective
This paper identifies some of the key considerations for performing launch area and over-flight risk assessments of
launch vehicles. It also identifies some of the risk trade-offs for launching space vehicles from different launch sites
within the continental United States.
III. Authority
The FAA’s authority to regulate commercial space launches is given by Title 49 as summarized.
TITLE 49--TRANSPORTATION
SUBTITLE IX--COMMERCIAL SPACE TRANSPORTATION
CHAPTER 701--COMMERCIAL SPACE LAUNCH ACTIVITIES
Sec. 70103. General authority
(a) General.--The Secretary of Transportation shall carry out this chapter.
(b) Facilitating Commercial Launches and Reentries.--In carrying out this chapter, the Secretary shall--
(1) encourage, facilitate, and promote commercial space launches and reentries by the private sector, including
those involving space flight participants; and
(2) take actions to facilitate private sector involvement in commercial space transportation activity, and to
promote public-private partnerships involving the United States Government, State governments, and the private
sector to build, expand, modernize, or operate a space launch and reentry infrastructure.
(c) Safety.--In carrying out the responsibilities under subsection (b), the Secretary shall encourage, facilitate, and
promote the continuous improvement of the safety of launch vehicles designed to carry humans, and the Secretary
may, consistent with this chapter, promulgate regulations to carry out this subsection.
Title 14 of the Code of Federal Regulations (14 CFR)1 section 413.3 addresses who must obtain a license or permit
and states that a U.S. citizen or an entity organized under the laws of the United States or a State must obtain a
license to operate a launch vehicle outside the United States. Section 415.35 addresses acceptable flight risk for a
launch vehicle and states that the applicant for a launch license must demonstrate that the risk level associated with
American Institute of Aeronautics and Astronautics
3
debris from an applicant’s proposed launch meets the public risk criteria of section 417.101(b)(1). Section
417.101(b)(1) states that the acceptable risk is to be measured in terms of expected casualties and that the public risk
should not exceed a value of 30 in a million. The assessment described in this paper only considers inert debris,
however part 417 also addresses the risks to the public associated with explosive blast overpressure, distant focusing
overpressure, and the release of toxics.
IV. Definitions
Citizen of the United States means--
(A) an individual who is a citizen of the United States;
(B) an entity organized or existing under the laws of the United States or a State; or
(C) an entity organized or existing under the laws of a foreign country if the controlling interest (as defined
by the Secretary of Transportation) is held by an individual or entity described in subclause (A) or (B) of this clause.
Dwell time means the period during which a launch vehicle’s instantaneous impact point is over a populated or other
protected area.
Launch vehicle means--
(A) a vehicle built to operate in, or place a payload or human beings in, outer space; and
(B) a suborbital rocket.
Public safety means for a particular licensed launch, the safety of people and property that are not involved in
supporting the launch and includes those people and property, that may be located within the boundary of a launch
site, such as visitors, individuals providing goods or services not related to launch processing or flight, and any other
launch operator and its personnel.
Protected area means an area of land not controlled by a launch operator that is a populated area, is environmentally
sensitive, or contains a vital national asset.
Suborbital trajectory means the intentional flight path of a launch vehicle, reentry vehicle, or any portion thereof,
whose vacuum instantaneous impact point does not leave the surface of the Earth.
Suborbital rocket means a vehicle, rocket-propelled in whole or in part, intended for flight on a suborbital trajectory,
and the thrust of which is greater than its lift for the majority of the rocket-powered portion of its ascent.
United States means the States of the United States, the District of Columbia, and the territories and possessions of
the United States.
V. Methodology and Approach to Risk Analysis
A. Risk Determination
The analysis begins with the generation of 6-degree-of-freedom (DOF) malfunction trajectories using the
representative geometry, mass properties, propulsion, aerodynamics, winds, and a Monte Carlo algorithm to
incorporate dispersed values of these parameters used in the analyses of similar vehicles. In the risk analysis, three
failure modes originating from the nominal trajectory are of interest: on trajectory failures, malfunction tumble
turns, and random attitude turns. These failure modes envelop the many possible debris generating trajectories that
can result from failures of vehicle systems, such as the propulsion systems, structure, and guidance, navigation, and
control (GN&C) system. On trajectory failures consider the structural loss of the vehicle at anytime during an
otherwise normal flight. Malfunction tumble turn trajectories are generated by introducing a desired thrust vector
gimbal offset and direction at a specified failure time in the launch area or over-flight portion of the flight before
orbital insertion. This offset creates a moment about the vehicle’s center of gravity that causes it to depart from its
nominal trajectory and enter a turn that continues until the structural loads on the vehicle cause it to breakup or the
flight is otherwise terminated. Random attitude trajectories are modeled by assuming the vehicle can reorient itself
in a random direction and continue to fly in that direction until some thrust termination or vehicle destruct is

American Institute of Aeronautics and Astronautics
4
activated, a structural limit is violated, or the vehicle exhausts all usable propellants. The trajectories associated
with all three of these failure modes include the effects of guidance and performance dispersions about the nominal
trajectory, or the normal operating area of the vehicle. For the purposes of this paper, the FAA modeled all
trajectories using Sandia Laboratory’s Trajectory Analysis and Optimization Software (TAOS) because of the
flexibility available in the software.2
1. Trajectory Modeling
The preliminary process involves creating a representative nominal trajectory for the mission at hand. This requires
knowledge of the vehicle’s mass properties, including its center of gravity and inertia data, 6-DOF aerodynamics,
propulsion parameters, and trajectory shaping requirements. The nominal trajectory is shaped to fly the first stage
using an open loop guidance scheme, where steering commands are applied to achieve angle of attack and angle of
attack constraints until first stage separation. The second stage flight is modeled using a closed loop guidance
scheme, using optimization to achieve a set of guidance targets at main engine cutoff. The first stage staging
conditions, altitude climb rate, or staging flight path angle are adjusted such that the overall optimal performance to
the desired mission orbital targets is achieved.
2. Failure Trajectories
As mentioned in the introduction, the FAA used three sets of failure modes to characterize the possible failures that
could result in the generation of falling debris that exposes the public to risk. We modeled each set of failure
trajectories off of the normal or dispersed trajectory, which is generated using a Monte Carlo approach, to capture a
reasonable corridor about the nominal trajectory representative of the vehicle’s guidance and performance
uncertainty. In practice, we also investigated the sensitivity of the resulting risk value to changes in the width of this
corridor generated by the guidance and performance uncertainty, usually varying it by a factor of three greater and
smaller to the normal corridor.
2.1 On Trajectory Failure
The on trajectory failure models a failure of the vehicle as it is flying along its normal course of flight. Here
“normal” refers to the corridor of trajectories that result from a statistical sampling of guidance and performance
dispersions usually considered at a three standard deviation variation. Typically, the FAA does not attempt to model
an operator’s particular GN&C system in order to determine these corridors but rather implements a variation
approach that seeks to duplicate collecting dispersed trajectories obtained from the operator. However, the FAA
does have tools to model the nominal and GN&C trajectories. The FAA has found that a suitable way of creating
these dispersion corridors is to introduce wind variations in the first stage trajectory while flying the three degree of
freedom steering requirements like angle of attack and angle of sideslip. Having the ability to generate our
independent nominal and GN&C trajectories offers the FAA flexibility in assessing failure mode trajectories like
malfunction tumble turns and random attitude trajectories. The failure times of interest are identified as the range of
time from the point just before until just after the debris footprint passes over any continental land mass or island.
This is considered the over-flight portion of flight.
2.2 Tumble Turn Failures
The tumble turn failures are those trajectories that result due to a loss of thrust vector gimbal actuator control. To
model these trajectories, representative mass properties expressed in terms of center of gravity and moments of
inertia are required. The FAA modeled the thrust vector gimbal loss of control in a Monte Carlo fashion by
randomly sampling a range of pitch and roll angles at a specified failure time and flying the vehicle until a thrust
termination condition was violated, a structural constraint was achieved, or the vehicle consumed all usable
propellants. Over-flight of a land mass usually occurs during a stage of the vehicle’s flight where the vehicle is well
above the sensible atmosphere. The trajectory is terminated based upon one of the previous mentioned constraints.
Note that this failure mode requires a six degree of freedom trajectory modeling that accounts for jet damping. Jet
damping takes into account the momentum of the exiting mass from the propulsion system, which is a capability of
the TAOS tool used by the FAA.
2.3 Random Attitude Failure
The random attitude trajectories characterize those failures where the vehicle can reorient itself in any direction.
This reorientation is modeled as an instantaneously applied angle of deviation or vehicle attitude from the nominal
trajectory. This approach simplifies the otherwise complex modeling of this failure mode and generally produces
conservative results. Like the tumble turn trajectories, random attitude trajectories model vehicle flight from the

American Institute of Aeronautics and Astronautics
5
onset of the failure until some constraint is achieved. These trajectories require only a three degree of freedom
trajectory model. Again, the FAA runs these trajectories at each failure time until a vehicle or range constraint is
violated or ground impact occurs.
3. Casualty Area and Debris Modeling
3.1 Inert Debris
For inert debris, this analysis applied a modeling approach similar to the examples shown in Table 1 and Table 2. In
its evaluation, the analysis considered the effects of the various levels of sheltering provided by structures on the
ground to their inhabitants on the resulting casualty area. The license applicant typically provides the FAA with a
debris catalogue by which to characterize debris for this model. Typical debris catalogues supplied by license
applicants have shown casualty areas for the second stage vehicles which range from 2000 to 5000 square feet. The
FAA groups the debris into classes by similar characteristics, such as ballistic coefficient characteristics and
imparted energy. The resulting casualty area for each class is determined based upon a kinetic energy model that
considers the kinetic energy of each class of debris and the integrity of the structure it is impacting. For this analysis
no demise of the inert debris is considered, however, this effect could result in a 30 percent or greater reduction in
the casualty area, but requires extensive heating analysis to confirm this effect. Note that if the kinetic energy of the
impacting debris does not exceed the threshold value associated with the penetration of the structure, then it is
subtracted from the overall casualty area. Likewise, if the kinetic energy of the debris does exceed the threshold,
then an augmented casualty area is added to the basic casualty area. Table 1 shows an example of a simplified
kinetic energy penetration model that includes the fraction of the public assumed to be in the three structure types,
concrete buildings, residential homes, and unsheltered. Table 2 summarizes the resulting overall inert debris
sheltering casualty area used for this assessment. To be consistent with the findings from other launch operator’s
second stage launch vehicles, this assessment baselined a sheltered casualty area of 3500 ft2 as shown in Table 2.
Table 1: Example Sheltering Model
Shelter
Type
Description Kinetic energy (KE) based probability of casualty (Pcs) for
the sth
shelter type
Fraction of
people under
specified sth
shelter (Fps)
1 Building with
concrete or
reinforced roof
If (KE > 74000 ft-lb); Pc1 = 1
If (6200 ft-lb ≤ KE ≤ 74000 ft-lb); Pc1 ramps linearly from 0
to 1
If (KE < 6200 ft-lb); Pc1 = 0
Fp1 = 0.2
2 Single story
building such as
houses or trailers
If (KE > 3200 ft-lb); Pc2 = 1
If (100 ft-lb ≤ KE ≤ 3200 ft-lb); Pc2 ramps linearly from 0 to 1
If (KE < 100 ft-lb); Pc2 = 0
Fp2 = 0.7
3 Unsheltered If (KE > 35 ft-lb); Pc3 = 1
If (0 ≤ KE ≤ 35 ft-lb); Pc3 ramps linearly from 0 to 1
Fp3 = 0.1
Table 2: Inert Debris Casualty Area
Phase of Flight Sheltered Casualty Area
(ft2) [Ca used in analysis]
Stage 2 3500.0

American Institute of Aeronautics and Astronautics
6
3.2 Explosive Debris
In some circumstances, it is possible for the vehicle to remain intact after a tumble turn or random attitude failure
and impact with some residual propellant. In this situation, the casualty area would include explosive effects. The
resulting casualty area is then many times greater than the inert debris casualty area. The FAA calculated this
effective casualty area based upon the amount of propellant remaining at the time of impact, the estimated explosive
yields due to propellant mixing at the expected impact speeds, and overpressure and fragment throw thresholds that
result in a casualty. For this analysis, we assumed the breakup of the vehicle from the over-flight failure always to
occur and therefore no explosive casualty area was considered. For most second stage vehicles using liquid
propellants, this has been found to be true3. However, for a vehicle designed to survive reentry, we may have to
consider an explosive or toxic casualty area. Also for vehicles using a solid propellant second stage, failure to
sufficiently fragment the propellant could result in explosive casualty areas which could exceed the inert casualty
area.
4. Population Modeling
Population models are critical to determining the risk to the public. Population models can be obtained from several
sources as relevant to the area being analyzed as discussed in the following sections. In the past, the FAA has
applied population databases from U.S. Census Bureau data, the Oak Ridge National Laboratory’s LandScan
population database, and Columbia University’s Gridded Population of the World database4. For this particular
assessment, the FAA selected the Gridded Population of the World due to its ease of use in the risk tool applied.
Typically the FAA will examine the effect of the resolution of the population database and has found for over-flight
that a one degree by one degree resolution provides stable risk results.
5. Statistical Modeling of Probability of Impact
The FAA models all the grouped debris in a debris catalogue. The trajectory of the intact vehicle and each class of
debris is propagated from the point of the failure to the point at which it reaches ground impact. To determine the
probability of impact, the FAA computed a bivariate distribution from the ground impact footprint as shown in
equations 1 through 3. For the failure modes investigated, the FAA has shown that a bivariate distribution generally
results in conservative risk results and is applicable in the majority of situations for the type of failure mode
trajectories investigated5.
i. Bivariate Normal
(1)
(2)
(3)
5. Vehicle Probability of Failure Modeling
To determine the overall probability of impact of debris into a populated area, the trajectory probability of impact
must be scaled by the vehicle probability of failure at the particular failure time of interest. The U.S. Air Force,
NASA, and the FAA have developed a common standard for estimating the probability of failure for a new
expendable launch vehicle as a function of the number of failures suffered by similar vehicles launched under

American Institute of Aeronautics and Astronautics
7
similar circumstances6. For a new operator developing and launching a new launch vehicle, a suitable probability of
failure may be as much as an order of magnitude higher than the probability of failure of a derived vehicle launched
by an experienced operator. Figure 1 shows the range of probability of failure based upon historical data for various
launches conducted by operators from around the world. The data is computed from the post 1970’s probability of
failure database provided to the FAA by ACTA Incorporated. This database examined all of the launches that have
occurred from the 1970’s to 2007 and analysis determined all of those launches that resulted in a failure such that
the nominal mission was not achievable. In addition, the database attempts to identify the cause of the failure and
the stage in which it occurred. Typically, the probability of failure for the first two flights is desired. The data
presented in Figure 1 shows considerable variation in probability of failure, depending upon the country, varying
from about .1 to .8 when considering the upper and lower 99% confidence intervals. Because the vehicle under
consideration may be from an experienced or new developer having new or derived stages, a probability of failure of
0.5 was baselined for launches out of both sites being considered: the Cape Canaveral Air Force Station (CCAFS)
and the Wallops Flight Facility (WFF).
Figure 1: Probability of Failure as a Function of Flight Number Compared for Four Countries
The FAA determined the failure rate by dividing the total probability of vehicle failure by the duration of the total
second stage over flight, scaling the total probability of vehicle failure at each instant of flight. Past work in
probability of failure analysis performed by Research Triangle Institute (RTI) has shown that 2/3 of ELV failures
have occurred during first stage flight while 1/3 of ELV failures have occurred during second stage flight7 The
resulting second stage failure probability also scales the total vehicle probability of failure to determine the overall
probability of impact into a particular population center.
6. Allocating Probability of Failure In addition to considering the probability of failure of the vehicle, knowledge of the probability of occurrence of
each failure mode of interest is also required. One must answer what is the probability of the vehicle failure at an
instant of time and what is the probability of the failure mode, whether the failure mode be an on trajectory, tumble
turn, or random attitude. RTI recommended an allocation of 0.73 for on trajectory failures, 0.22 for malfunction

American Institute of Aeronautics and Astronautics
8
turn failures, and 0.05 for random attitude failures. Thus, given the probability of failure and allocation for the
failure mode and the probability of impact due to the trajectory data, the FAA can compute a probability of impact
into any population center for each failure mode.
7. Ec Modeling
Expected casualties (Ec) for all population centers or Gridded Population of the World (GPW) grid locations are
computed using equation 4 as illustrated below.
Ec = ΣPi x ρp x Ca (4)
Note that Pi is the final computed probability of impact and the summation is applied over all population grid
locations (represented by the population density term ρ) and over all failure times. The casualty area represents the
sheltered casualty area from each debris class.
VI. Analysis Results
B. RESOLV Assessment
The Risk Estimator for Suborbital and Orbital Launch Vehicles (RESOLV) is an independent risk analysis tool the
FAA developed to independently verify risk results produced by ACTA’s Range Risk Assessment Tool (RRAT)
and to perform sensitivity studies that inform its licensing and permitting evaluations. The tool takes user supplied
failure trajectories defined at an impact point and user defined sheltered casualty area and population database to
determine the risk to exposed populations by applying either a bivariate normal distribution or extreme value
distribution to the impact data. As part of the its internal procedures, the FAA performs an independent risk
analysis to insure consistency and confidence in the risk assessment for a particular operator.
1. Over-flight of Africa from a CCAFS Due East Launch
Over-flight of Europe on a trajectory to the ISS represents a new endeavor for a truly commercial operator. The
FAA compared the risk assessments to a baseline value corresponding to an over-fight of Africa, because most
commercial ELV launches from the Eastern Range have trajectories that overfly Africa. The FAA examined to
Africa missions, one for a due east or 28.5 degree inclination and one for a 34.5 degree inclination. The due east
mission was used as the normalization reference mission.
Figure 2 shows the instantaneous impact point (IIP) of the vehicle as it overflies Africa for a due east launch. Figure
3 and Figure 4 show typical outputs from the RESOLV tool for a on trajectory failure. Figure 3 shows the impact
trajectories for all failure times and shows the population as a function of the longitude and latitude. As seen by this
data, the over-flight portion of the trajectory passes mostly through some populated areas. Figure 4 shows the
maximum expected casualty for any failure point at each grid point. As seen by examination of this data, the
maximum expected casualty occurs on the western one third of Africa.

American Institute of Aeronautics and Astronautics
9
Figure 2: Instantaneous Impact over Africa Due East

American Institute of Aeronautics and Astronautics
10
Figure 3: Population Trajectory Corridor for On Trajectory Failure versus Location over Africa Due East

American Institute of Aeronautics and Astronautics
11
Figure 4: Relative Risk On Trajectory Failure versus Location over Africa Due East
Table 3 summarizes the over-flight risk considering the allocation of the probability of failure to both vehicle stages
and to the three failure modes, as described previously. Note that the allocation for each failure mode directly scales
the risk calculated for that failure mode. For over-flight of Africa, the baseline risk to the public is normalized as a
ratio of one. It can be seen from this table that the major contributor to risk is the on trajectory failure mode which
accounts for about 70% of the risk followed by the malfunction tumble turn failure mode which accounts for about
26% of the risk. The random attitude failure mode was found to account for less than 1% of the total risk. Note that
this does not include the risk due to tumble turn and random attitude trajectories, which can result in trajectories that
have debris reentering after one or more orbits. These trajectories are considered random reentry trajectories
because they have the potential for impacting anywhere on the Earth within the inclination band of the mission. For
a previous assessment, the FAA and ACTA determined that the risk from random reentry trajectories was in excess
of 50% of the risk for the over-flight risk from the on trajectory, tumble turn, and random attitude failure modes.
Table 3: Summary of Over-flight Results 28.6 degrees inclination
Failure Mode Allocation Total (ratio
after
allocation)
On Trajectory .73 0.70
MFT .22 0.26
American Institute of Aeronautics and Astronautics
12
RA .05 0.04
Total 1.0 1.0
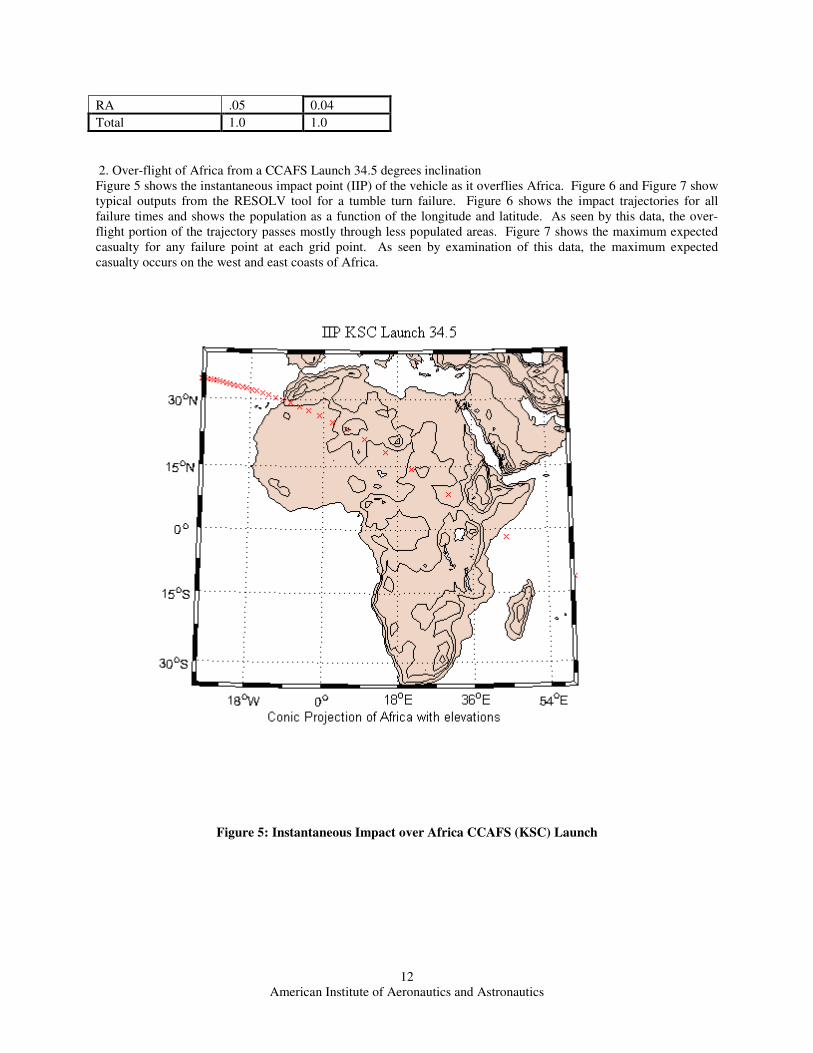
2. Over-flight of Africa from a CCAFS Launch 34.5 degrees inclination
Figure 5 shows the instantaneous impact point (IIP) of the vehicle as it overflies Africa. Figure 6 and Figure 7 show
typical outputs from the RESOLV tool for a tumble turn failure. Figure 6 shows the impact trajectories for all
failure times and shows the population as a function of the longitude and latitude. As seen by this data, the over-
flight portion of the trajectory passes mostly through less populated areas. Figure 7 shows the maximum expected
casualty for any failure point at each grid point. As seen by examination of this data, the maximum expected
casualty occurs on the west and east coasts of Africa.
Figure 5: Instantaneous Impact over Africa CCAFS (KSC) Launch

American Institute of Aeronautics and Astronautics
13
Figure 6: Population Trajectory Corridor for Malfunction Turn versus Location over Africa

American Institute of Aeronautics and Astronautics
14
Figure 7: Relative Risk Malfunction Turn versus Location over Africa
Table 4 summarizes the over-flight risk considering the allocation of the probability of failure to both vehicle stages
and to the three failure modes, as described previously. Note that the allocation for each failure mode directly scales
the risk calculated for that failure mode. For over-flight of Africa to a 34.5 degree inclination, the baseline risk to
the public is a factor of 4 less than the baseline mission.
Table 4: Summary of Over-flight Results 34.5 degrees inclination
Failure Mode Total (after
allocation)
Ratio Relative to
Due-East Baseline .23
3. Over-flight of Europe for a Launch to the ISS from a CCAFS Launch Site

American Institute of Aeronautics and Astronautics
15
An operator may choose to launch a vehicle to the ISS from the CCAFS launch site. Figure 8 shows the
instantaneous impact point for a launch out of CCAFS to the Space Station inclination of 51.6 degrees. Note that
the IIP passes just south of Great Britain, over France, and through Saudi Arabia.
Figure 8: IIP for 51.6 degrees inclination from CCAFS (KSC)
Figure 9 summarizes the populations, trajectory footprint, and risk for the tumble turn failures associated with this
trajectory, and shows the population density and the impact corridor. Figure10 shows the maximum contribution to
Ec over the continent for the failure times investigated.

American Institute of Aeronautics and Astronautics
16
Figure 9: Population and Impact Trajectories for Tumble Turn Failures over Europe-Middle East-Africa

American Institute of Aeronautics and Astronautics
17
Figure 10: Relative Risk Tumble Turn versus Location over Europe-Middle East-Africa
Table 5 is similar to Table 3. It summarizes the risk for all failure modes investigated and shows that the risk for
this mission is about a factor of four greater than the baseline.
Table 5: Summary of Over-flight Results 51.6 degrees inclination
Failure Mode Total (after
allocation)
Ratio Relative to
Due-East
Baseline 4.03
4. Over-flight of South America for a Launch to the ISS from WFF
Another commercially available launch site is the Wallops Flight Facility located in Wallops, Virginia. Figure 11
shows the instantaneous impact trace for a launch out of Wallops to the Space Station Inclination of 51.6 degrees
using a descending node trajectory. Note that these trajectories are without any yaw steering. As a result, the IIP
passes over the eastern tip of Brazil. Flight to the ISS would most likely require some form of steering to perform
rendezvous with the ISS as a function of the time of launch from an in-plane or optimal performance rendezvous
time and thus may not result in land overflight, note that for a launch from CCAFS for an ascending node, overflight
of land is inevitable.

American Institute of Aeronautics and Astronautics
18
Figure 11: ISS IIP for 51.6 degrees inclination from Wallops
The random attitude trajectories result in the widest trajectory corridor because the vehicle maintains a constant
attitude until burnout of the second stage. Figure 12 shows the corridor for the random attitude trajectories.

American Institute of Aeronautics and Astronautics
19
Figure 12: Over-flight Random Attitude Impacts for Launch from Wallops
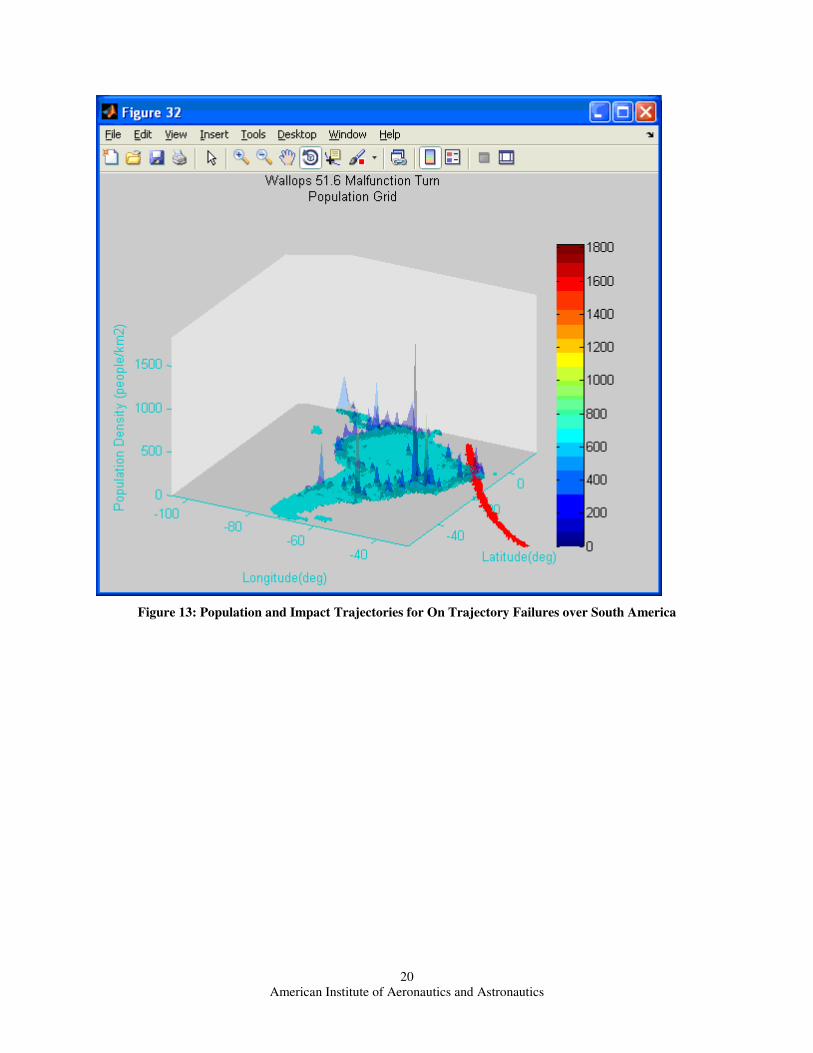
Figures 13 and 14 show an example of the results obtained for the on trajectory failure mode. Figure 13 illustrates
the trajectory impacts as a function of longitude and latitude and shows the population density for each grid point in
the population database. As seen by examination of Figure 13, the corridor for the random attitude trajectories
failure that the FAA modeled passes near some fair-sized or around 100,000 people, population centers. Figure 13
also summarize the unallocated risk for this failure mode. Figure 11 illustrates the maximum expected casualties
that occurred at any population grid location as a function of longitude and latitude. Figure 11 shows the greatest
maximum risk is at the point where the corridor first passes over Brazil and then exits Brazil.
American Institute of Aeronautics and Astronautics
20
Figure 13: Population and Impact Trajectories for On Trajectory Failures over South America

American Institute of Aeronautics and Astronautics
21
Figure 14: Relative Risk On Trajectory versus Location over South America
Similar to Tables 3 and 4, Table 6 summarizes the overall risk for each of the failure modes investigated. Table 5
states the risk to the public for the mission assessed is a factor of 1.6 increase over the baseline.
Table 6: Summary of Over-flight Results 51.6 degrees inclination Wallops Launch
Failure Mode Total (after
allocation)
Ratio Relative to
Due-East
Baseline 1.61
For a launch from WFF, it is possible to mitigate the risk to South America by yaw steering in the first stage. It is
possible to yaw steer east of Brazil while still being west of Bermuda. The FAA found the performance penalty for
this mitigation measure to be about 200 to 300 lbs payload weight. It is interesting to note that there is no
performance advantage for flying to an ISS inclination out of CCAFS as opposed to WFF because the Earth
rotational inertial velocity contribution at main engine cutoff (MECO) is almost the same for both trajectories at the
point of orbital insertion.
5. Individual Risk Considerations

American Institute of Aeronautics and Astronautics
22
The individual risk represents the probability of casualty for one individual. Assuming an individual occupies an
area of three square feet, the individual risk can be computed from the probability of impact contours knowing the
casualty area of the inert or explosive debris. The most conservative individual risk comes from the analysis of the
launch area for the case where explosive debris is considered. Typical assessments have shown this to be on the
order of 3 x10⁻⁸
. Because of the vast footprint of the over-flight portion of the trajectory, individual risk for over-
flight is an order of magnitude less than the individual risk for the launch area and thus not a factor in this risk
assessment.
VII. Conclusion
It is important to note that the risk evaluation presented does not represent the risk assessment for any particular
launch operator that has pursued an application for an FAA license. It is illustrative of the relative risk. Table 7
summarizes the total results for baseline mission, over-flight of Africa, and compares it with the over-flight risk for
launch from a CCAFS launch site and launch from a WFF. As can be seen from Table 7, if the probability of failure
for each vehicle from each launch site and the casualty area is considered the same, then there is a noticeable
difference from flying to the ISS from WFF because the risk is 40% of the risk for a launch from CCAFS.
Compared to the African baseline, the over-flight risk for a mission to the ISS is 1.6 to 4 times greater dependent
upon the launch site location. A launch to a 34.5 inclination as opposed to 28.6 degrees inclination reduces the risk
by a factor of 4. The overflight risk for an ISS launch from CCAFS is attributed to the greater population densities
associated with overflight of Europe. Absolute risk values are sensitive to vehicle probability of failures and debris
casualty areas which are unique to each operator depending upon their level of experience and the type of vehicle
they plan to put into service.
Table 7: Summary of Over-flight Results 51.6 degrees inclination Compared to Africa Baseline
.
VIII. Acronyms
CFR – Code of Federal Regulation
COTS – Commercial Orbital Transportation Services
IIP – Instantaneous Impact Point
ISS – International Space Station
TAOS – Trajectory Analysis and Optimization Software
FAA – Federal Aviation Administration
AST – Office of Commercial Space Transportation
RRAT – Range Risk Assessment Tool (RRAT)
DOF – Degree of Freedom
RESOLV – Risk estimator for suborbital and orbital launch vehicles
GPW – Gridded population of the world
ELV – Expendable launch vehicle
Launch Location Ratio
CCAFS Africa
Baseline 28.6
1.0
CCAFS Africa
34.5
0.23
CCAFS 51.6 4.0
Wallops 51.6 1.6

American Institute of Aeronautics and Astronautics
23
IX. References
1Title 14 Code of Federal Regulations Part 100 through Part 1199, Aeronautics and Space, January 1, 2006
2 Trajectory Analysis and Optimization Software (TAOS), Applied Aerospace Engineering and Advanced Concepts
Department, Sandia National Laboratory, March 2006
3 Falcon 9 Updated Reentry Aerodynamic Heating and Demise Evaluation, ACTA Report No. 10-605/17-01, May
2010, Draft
4 Center for International Earth Science Information Network (CIESIN), Columbia University; Gridded Population
of the World Version 3 (GPWv3). Available at http://sedac.ciesin.columbia.edu/gpw.
6 Risk Considerations for The Launch of the SpaceX Falcon 1 Rocket , AIAA Atmospheric Flight Mechanics
Conference, August 20, 2008
6 Draft Revision of Risk Analysis Advisory Circular, ACTA Report No. 06-527/10.4, July 2006
7 Launch Vehicle Failure Probabilities for Risk Estimation, RTI Final Report No. RTI/08360/103-11F, November
24, 2003
X. Acknowledgements
Sue Lender, Phil Brinkman, and Dan Murray, FAA AST employees for their technical review.

American Institute of Aeronautics and Astronautics
24