Embed Size (px)
Citation preview

Over- and undercoverage in the Labour Force Survey (LFS) – a register-based study

Over- and undercoverage in the Labour Force Survey (LFS) – a register-based studyStatistics Sweden2018
Producer Statistics Sweden, Population and Welfare Department, Labour Force Surveys Box 24300, SE-104 51 STOCKHOLM +46 10 479 40 00
Enquiries Frida Videll 010-479 47 22 [email protected]
Martin Axelson 010-479 61 18 [email protected]
It is permitted to copy and reproduce the contents in this publication. When quoting, please state the source as follows: Source: Statistics Sweden, Over- and undercoverage in the Labour Force Survey (LFS) – a register-based study
ISSN 1654-465X (Online)URN:NBN:SE:SCB-2018-AM76BR1802_pdf
This publication is only available in electronic form on www.scb.se
Over- and undercoverage in LFS Foreword
3
Foreword
Statistics are affected by various kinds of uncertainty, regardless of whether they
are based on registers or sample surveys. The quality of statistics based on sample
surveys is largely a function of how uncertainty that can be attributed to sampling,
frame coverage, measurement, nonresponse and data processing is taken into
account.
The Labour Force Survey (LFS) is a panel survey with so-called rotating samples,
which means that sampled individuals are included in the survey on several, but a
limited number of, occasions. More specifically, a sampled individual is included
in the LFS once per quarter for a total of eight times. The approach allows for
estimation of changes and flows in the labour market with high accuracy. At the
same time, it means that one is forced to accept a certain amount of primarily
undercoverage. For example, regardless of the reference month, the subset of the
LFS sample that is included for the eighth and final time was selected more than
two years ago and consequently it cannot reflect the population changes that have
occurred since that time.
This report discusses frame coverage and its impact on the quality of the statistics based on the LFS. The purpose of the report is threefold:
- To present an account of the differences that exist between the LFS
sampling frame and its target population under the sampling design and
estimation procedure used, - To present an account of how coverage deficiencies are handled in the LFS
estimation procedure, - To numerically illustrate how the accuracy of the statistics based on the
LFS is affected by the existing coverage deficiencies.
This work is part of a more comprehensive effort to analyse the quality of the Labour Force Survey. Another study pertains to nonresponse bias in the LFS.
Martin Axelson performed the study and produced the report. A reference group consisting of Elisabet Andersson and Magnus Sjöström was tied to the project. In addition to this, a reading group consisting of Marianne Ängsved, Sara Westling and Frida Videll contributed comments to improve the comprehensibility of the report. Statistics Sweden May 2017
Petra Otterblad Olausson
Magnus Sjöström
A note of thanks
We would like to express appreciation to our survey respondents – the people, enterprises, government agencies and other institutions of Sweden – with whose cooperation Statistics Sweden is able to provide reliable and timely statistical information meeting the current needs of our modern society.

4

Over- and undercoverage in LFS Contents
5
Contents Foreword .................................................................................................................. 3
Summary .................................................................................................................. 7
1 Introduction ..................................................................................................... 8
1.1 Background and purpose........................................................................... 8
1.2 Report structure ......................................................................................... 8
2 General information about the LFS ............................................................... 9
2.1 Purpose and structure ............................................................................... 9
2.2 Target population ....................................................................................... 9
2.3 Sample ....................................................................................................... 9
2.3.1 Sampling design .............................................................................. 11
3 Population changes and their consequences for the LFS coverage
properties ....................................................................................................... 12
3.1 What causes over- and undercoverage in the LFS? ............................... 12
3.2 Population changes in the 2000s ............................................................ 14
3.2.1 Undercoverage due to of immigration ............................................. 15
3.2.2 Overcoverage due to incorrect civil registration .............................. 19
4 Estimation procedure in the LFS ................................................................. 20
4.1 Generalised regression estimator (GREG) .............................................. 20
4.2 Auxiliary information in the LFS estimation procedure ............................ 20
4.2.1 The Total Population Register (TPR) .............................................. 20
4.2.2 The Employment Register ............................................................... 21
4.2.3 The Swedish Public Employment Service ...................................... 21
4.3 The LFS estimation procedure seen from a coverage
perspective .............................................................................................. 21
4.3.1 Bias due to overcoverage in the estimation of totals ...................... 22
4.3.2 Bias due to undercoverage in the estimation of totals .................... 23
4.3.3 Bias resulting from over- and undercoverage in the estimation
of ratios between totals .................................................................... 24
5 Impact of over- and under-coverage on accuracy – a numerical
illustration ...................................................................................................... 26
5.1 Method selected ...................................................................................... 26
5.2 Register analysis ..................................................................................... 28
5.2.1 Level estimates ............................................................................... 28
5.2.2 Change estimates ........................................................................... 40
6 Concluding remarks ..................................................................................... 45
7 References ..................................................................................................... 47
Appendices ............................................................................................................ 48
Contents Over- and undercoverage in LFS
6
Appendix A: The LFS sample’s coverage properties by calendar month and
time since latest registration date .................................................. 48
Appendix B: Schematic description of LFS’ estimation process upon full
response ........................................................................................ 49
Appendix C: Bias in the estimation of a ratio under a simple super-
population model ........................................................................... 53
Appendix D: Tables concerning level estimates ................................................ 55
Appendix E: Tables concerning change estimates ............................................ 67
Appendix F: The LFS sample’s coverage properties by calendar month
and time since latest registration date under monthly sample
selection ........................................................................................ 72
Appendix G: Tables concerning change estimates ............................................ 73

Over- and undercoverage in LFS Summary
7
Summary This report discusses frame coverage and its impact on the quality of the statistics based on the Labour Force Survey (LFS). The report has the following three purposes:
- To present an account of the differences that exist between the frame
population of the LFS and its target population with the sample design
and the estimation procedure used, - To present an account of how coverage deficiencies are handled in the LFS
estimation procedure, - To numerically illustrate how the accuracy of LFS statistics is affected by
the existing coverage deficiencies.
By way of introduction, a general overview of the LFS, with a focus on the survey’s
sampling design, is provided. In addition, an account is provided of the coverage
deficiencies in the LFS, with a focus on the coverage deficiencies expected to have
the greatest potential impact on the accuracy of the statistics. Considering how the
various categories of over- and undercoverage are taken into account and handled
in the LFS estimation procedure, it is mainly undercoverage caused by
immigration and overcoverage caused by individuals incorrectly registered in the
Swedish Population Register, held by the Swedish Tax Agency, that can cause
problems.
With support of arguments based on results of a theoretical nature, we can confirm
that the estimator used for cross-sectional estimates can be affected by bias due to
of both over- and undercoverage. For parameters estimated for study domains
defined based on persons born abroad, the bias can be substantial both absolutely
and relatively.
A number of the parameters that are central to the LFS are defined as a ratio
between two totals, i.e. the relative unemployment rate, the employment rate and
the labour force participation rate. With support of arguments based on results of a
statistical nature, it is confirmed that the problem of coverage bias can very well be
of a smaller size in the estimation of ratios. This applies in particular to ratios
where both numerators and denominators are estimated with estimators for which
the accuracy is affected by uncertainty due to sampling.
Numerical results are also presented in the report. The results are based on a
register study under certain assumptions. Accordingly, one neither can nor should
draw the conclusion that the results are directly transferable to LFS estimates,
which are based on data collected from respondents and the accuracy of which is
affected by the combined effect of all existing sources of uncertainty. Rather than
being interpreted as absolute truths, the results should be seen as indications of the
extent to which LFS estimates are affected by existing coverage deficiencies and
their treatment in the estimation procedure.
The results of the register analysis point out that the coverage problems introduce
bias of a magnitude that generally cannot be expected to be negligible. The picture
is not uniform, however. For some study domains, the coverage problems seem to
have a relatively negligible impact on accuracy in terms of both total and ratio
estimates, while the opposite is true of other study domains. Even if deviating
results exist, the overall conclusion is that the problem tends to be less prominent
in the estimation of ratios, a result that is in line with the theoretical reasoning
presented in the report.

Introduction Over- and undercoverage in LFS
8
1 Introduction
1.1 Background and purpose As with all other statistics, the statistics that are produced in the scope of the
Labour Force Survey (LFS) are affected by uncertainty. In SCB-FS 2016:17,
“Statistics Sweden’s regulations on quality in official statistics”, a quality concept is
prescribed that shall be used in the development and production of official
statistics and in its dissemination, including quality declarations. An important
dimension of the quality of statistics is the accuracy (or uncertainty) of the
statistics; for users to be able to use the statistics correctly they need information on
accuracy. The accuracy of the statistics is largely a consequence of the chosen
estimation procedure and how well it manages to take into account uncertainty
caused by the following sources of uncertainty: sampling, frame coverage,
measurement, nonresponse, data processing and model assumptions.
This report addresses frame coverage and its effect on the quality of LFS statistics. The report has the following three purposes:
- To present an account of the differences that exist between the frame
population of the LFS and its target population with the sample design
and the estimation procedure used, - To present an account of how coverage deficiencies are handled in the LFS
estimation procedure, - To numerically illustrate how the accuracy of LFS statistics is affected by
the existing coverage deficiencies.
1.2 Report structure The report begins with two sections of comprehensive introductory character. In
section 2, a general overview of the LFS, with a focus on the survey’s sampling
design, is provided. Section 3 provides an account of the coverage deficiencies
existing in the LFS, with a focus on the coverage deficiencies expected to have the
greatest potential impact on the accuracy of the statistics. Section 4 introduces the
LFS estimation procedure. This section concludes with a discussion of the
estimation procedure from a coverage perspective. Section 5 numerically illustrates
how the accuracy of the statistics based on the LFS is affected by the existing
coverage deficiencies. The numerical results are based on a register study. The
report concludes with section 6, which contains summary comments.
Over- and undercoverage in LFS General information about LFS
9
2 General information about the LFS
2.1 Purpose and structure The purpose of the LFS is to describe the current labour market conditions for the
entire population aged 15-74 and to provide information on the development of
the labour market. The LFS is the only source that continuously provides a
coherent picture of the labour market; employment, unemployment, hours
worked, etc.. The survey is regulated by several international guidelines and
regulations.
The LFS is a sample survey of individuals and is conducted every month
throughout the year. Sampled individuals answer questions about their situation
on the labour market during a specific week of the reference month. The result of
the monthly surveys are published shortly after the end of the reference period.
The monthly estimates also form the basis for estimations of quarterly and annual
averages.
The Labour Force Surveys are panel surveys with so-called rotating samples,
which means that sampled individuals are included in the survey on multiple, but
a limited number of occasions. The rotation schedule is such that 7/8 of the sample
is repeated at a three month interval and 1/8 of the sample is replaced with a new
sample of individuals. This means that each sampled individual is included in the
survey a total of eight times, once per quarter, for two years.
2.2 Target population The LFS target population for a specific reference month is comprised of all
individuals aged 15-74 who during the month should have been registered in
Sweden, i.e., registered in the Swedish Population Register, held by the Swedish
Tax Agency, if the regulations had been complied perfectly.
2.3 Sample The so-called annual sample for the LFS is selected in November every year. The
sampling frame is created based on Statistics Sweden’s Total Population Register
(TPR) per 30 September. The sample contains all new individuals who are to rotate
in during January-December of the next year, i.e. the size of the sample is set so
that the eighth of the sample that rotates out each month can be replaced, i.e. the
part of the sample that three months ago was in the LFS for the eighth and final
time. The twelve subsamples that the annual sample is divided into are also called
panels or rotation groups. The set-up means that some of the individuals sampled
in November in year t-3 will rotate into the LFS sample in December of year t-2, to
be included eight times with the last time in September of year t.
The monthly sample for a specific calendar month refers to the sampled
individuals who will be surveyed during the month in question. The monthly
sample is comprised of individuals linked to eight panels which, depending on the
calendar month, originate from two or three different annual samples.

General information about LFS Over- and undercoverage in LFS
10
The monthly composition of the sample for different calendar months is presented
in Figure 1 below. For example, the monthly sample for January of year t consists
of three different annual samples:
- rotation group 1 consists of individuals who were selected from the
sampling frame for 30 September of year t-1
- rotation groups 2-5 consist of individuals who were selected from the
sampling frame for 30 September of year t-2
- rotation groups 6-8 consist of individuals who were selected from the
sampling frame for 30 September of year t-3
The rotation group number indicates the number of times the panel has been
included in the LFS, i.e., rotation group 1 is the panel which is included for the
first time, rotation group 2 is the panel included for the second time, and so on.
Since the sampled individuals participate once per quarter, all monthly samples
within a quarter are equal in terms of which annual sample the rotation groups
originate from.
Figure 1 Connection between monthly sample and annual sample

Over- and undercoverage in LFS General information about LFS
11
2.3.1 Sampling design
As of January 2010, the monthly sample was increased by 8,000 persons and
includes a total of about 29,500 persons. Below, the sample of around 21,500
persons before the increase is called the ordinary LFS and the sample of around
8,000 persons is called the supplementary sample.
2.3.1.1 The ordinary LFS sample
The ordinary LFS sample comprises every month approximately 21,500 individuals
aged 15-74. To ensure that each of the eight rotation groups consist of those aged
15-74 years, the frame population comprises those aged 12-74 years where those
younger than 15 are interviewed only when they turn 15 and those 75 or older are
not interviewed.
For the ordinary sample, strata are created by combining region (24) and sex (2) for
a total of 48 strata, where region is comprised of residential county and the
metropolitan municipalities of Stockholm, Gothenburg and Malmö.
In each stratum, a sorting is done by country of birth (domestic/foreign born) and
personal identity number. Then, four systematic samples are selected, using four
different starting points.
The sampling fraction varies among counties; for example, smaller counties have a
higher fraction than larger counties. The sampling fraction also varies between age
groups where the age groups 15 and 65-74 years have a somewhat lower fraction
than the group 16-64 years.
2.3.1.2 The supplementary LFS sample
Each month the supplementary LFS sample includes approximately 8,000
individuals aged 16-66. As for the ordinary sample, the frame population consists
of those younger than 16 to ensure that each of the eight rotation groups consists of
those aged 16-66. Those who are younger than 16 are interviewed only when they
turn 16 and those who are 67 or older are not interviewed.
For the supplementary sample, strata are created by using information from TPR,
Statistics Sweden’s sources Longitudinal integration database for health insurance
and labour market studies (LISA) and the Register on income and taxation (IoT). A
total of 70 strata are created for domestically born persons by combining age (3),
region (7), information from LISA and the IoT (2) and sex (2). A total of 35 strata
are created for foreign born persons by combining age (3), region (7) and
information from LISA and IoT (2). This means that 105 different strata are formed
in total. Counties are grouped into seven regions, where each region consists of
one or more counties.
Within each stratum, individuals are sorted by personal identity number. Then,
four systematic samples are selected, using four different starting points.
For the age group 25-66, the sample is selected so that 80 per cent of the total
sample is used for individuals with a weaker connection to the labour market
according to indications from LISA and IoT.
Population changes and their consequences Over- and undercoverage in LFS
12
3 Population changes and their consequences for the LFS coverage properties
3.1 What causes over- and undercoverage in the LFS? Assume that a sample survey will be implemented with the objective of describing
the situation at a given time for a group of individuals. The set of individuals that a
study intends to reflect is called the target population while the set of individuals
identified through the sampling frame is called the frame population.
Differences between the frame population and the target population are typically
described in terms of over- and undercoverage. In the example above,
overcoverage refers to the group of individuals who are included in the frame
population and accordingly have a chance to be selected to be included in the
survey, but who do not belong to the target population. Conversely,
undercoverage refers to the group of individuals who belong to the target
population, but who are not included in the frame population and therefore have a
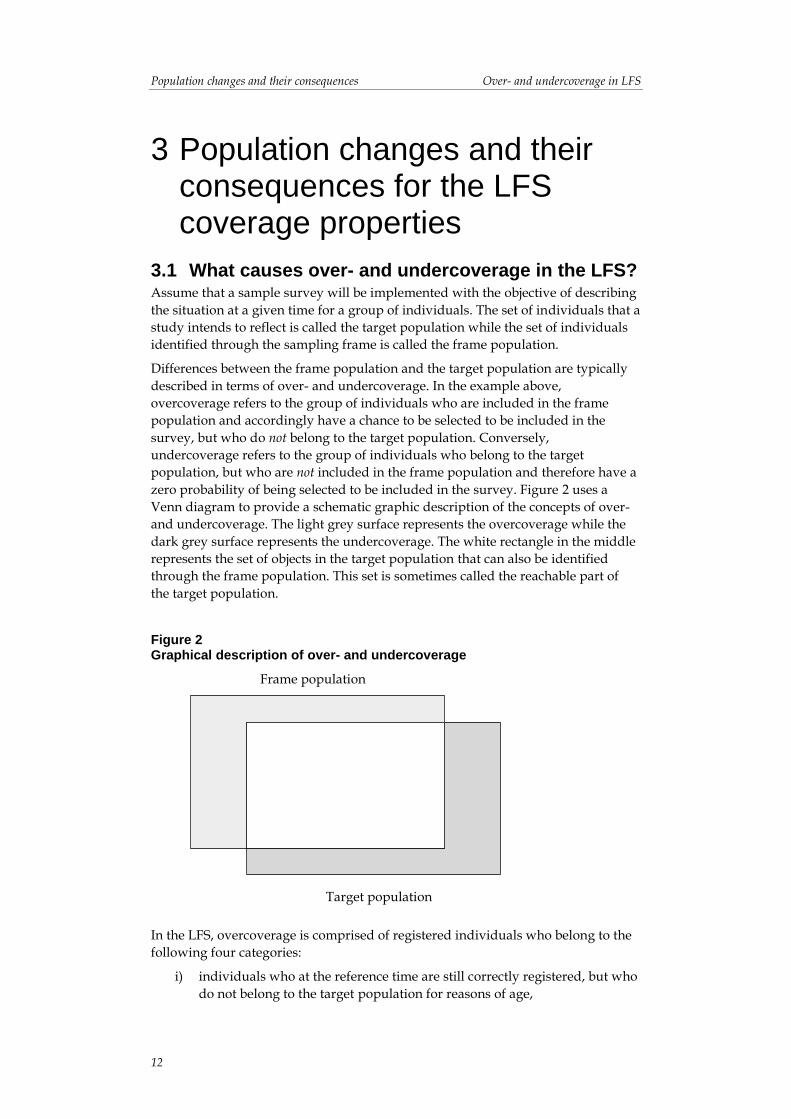
zero probability of being selected to be included in the survey. Figure 2 uses a
Venn diagram to provide a schematic graphic description of the concepts of over-
and undercoverage. The light grey surface represents the overcoverage while the
dark grey surface represents the undercoverage. The white rectangle in the middle
represents the set of objects in the target population that can also be identified
through the frame population. This set is sometimes called the reachable part of
the target population.
Figure 2 Graphical description of over- and undercoverage
In the LFS, overcoverage is comprised of registered individuals who belong to the
following four categories:
i) individuals who at the reference time are still correctly registered, but who
do not belong to the target population for reasons of age,
Frame population
population
Target population
population

Over- and undercoverage in LFS Population changes and their consequences
13
ii) individuals who emigrated before the reference time and for whom the
regulations that apply for civil registration were complied with,
iii) individuals who died before the reference time and for whom the
regulations that apply for civil registration were complied with,
iv) individuals who at the reference time are incorrectly registered because the
regulations that apply for civil registration were not complied with.
The overcoverage in category (i) is a consequence of the individuals who belong to
the frame population ageing. Since the LFS is a panel survey, where sampling from
a single frame population is used during a period of a total of 33 calendar months1,
there will be individuals in the frame population who in terms of age belong to the
target population during some, but not all of these months. The individuals that
belong to category (i) can be determined by comparing the frame population with
a more current version of TPR. The individuals in category (ii) and (iii) will cease
to be registered as soon as the event has been registered by the Swedish Tax
Agency. Accordingly, the overcoverage in category (ii) and (iii) can also gradually
be identified by comparing the frame population with a more current version of
TPR. The individuals who belong to category (iv) are those who have emigrated or
died without this having been reported or registered by the Swedish Tax Agency.
They are more problematic since they will continue to be included in TPR even
though they no longer meet the conditions for being registered. This means that
there is no possibility of directly identifying which individuals belong to this set
based on register comparisons.
The undercoverage in the LFS is comprised of the following two categories of
individuals who at the reference time belong to the target population:
v) individuals who were not included in the frame population when the
sample was selected, but thereafter immigrated and for which the
regulations that apply for civic registration were complied with,
vi) individuals who are permanently residing in Sweden, but are not
registered because civic registration regulations have not been complied
with.
The individuals in category (v) will be registered as soon as the event has been
registered by the Swedish Tax Agency. Accordingly, the undercoverage in
category (v) can also gradually be identified by comparing the frame population
with a more current version of TPR. Category (vi) is comprised of individuals who
are completely unknown to Statistics Sweden and are problematic, at least in
purely theoretical terms. Since there are such strong incentives for individuals who
have the right to be registered in Sweden to also actually become registered, it is
however probable that this group is small in terms of numbers.
Considering how the LFS in its estimation procedure takes into account and
handles the various categories of over- and undercoverage, it is mainly category
(v) – undercoverage caused by immigration – and category (iv) – overcoverage
caused by incorrectly registered individuals – that can cause problems. These
categories are therefore illustrated in more detail below.
1 Panels from the frame population that were used to select the annual sample in year t-1 will be
included in every monthly sample from January in year t to September in year t+2.

Population changes and their consequences Over- and undercoverage in LFS
14
3.2 Population changes in the 2000s2 As described in Section 2.3, the LFS monthly sample is comprised of eight panels
(rotation groups) that, depending on calendar month, originate from two or three
annual samples. The design reflects the fact that the LFS is carried out for two,
partly conflicting, purposes – besides providing information on the situation
during the reference month, the survey shall also provide information on the
development over time. Since the sample is selected at different times, the panels
are affected to differing extents by the population changes that occur during the
time that passes between the time of sampling and the specific reference month.
As already mentioned, the population changes that take place during one year and
that affect the composition and characteristics during the time that passes between
sample selection and survey, mainly concern immigrated and, to a lesser extent,
emigrated and deceased. From Table 1, it is apparent that on an annual basis,
- the number of immigrated has increased sharply
- the number of emigrated has increased, but less so than the number of
immigrated
- the number of deceased has largely been constant.
Table 1 Population changes, 2000-2015.
Number of
Year Immigrated Emigrated Deceased
2000 58,659 34,091 93,461
2001 60,795 32,141 93,752
2002 64,087 33,009 95,009
2003 63,795 35,023 92,961
2004 62,028 36,586 90,532
2005 65,229 38,118 91,710
2006 95,750 44,908 91,177
2007 99,485 45,418 91,729
2008 101,171 45,294 91,449
2009 102,280 39,240 90,080
2010 98,801 48,853 90,487
2011 96,467 51,179 89,938
2012 103,059 51,747 91,938
2013 115,845 50,715 90,402
2014 126,966 51,237 88,976
2015 134,240 55,830 90,907
2 Numerical information in this section regarding the size of the population, number of immigrants,
number of emigrants, etc. pertains to the registered population. The information has been obtained through joint processing of registers for which Statistics Sweden is responsible.
Over- and undercoverage in LFS Population changes and their consequences
15
3.2.1 Undercoverage due to immigration
In the table above, one can distinguish two large changes compared with earlier
periods. The first is 2006 when immigration increases by nearly 50% relative to the
year before. The other increase occurs between 2010 and 2015, with immigration
increasing by more than 30% during the period. Table 1 also includes those born in
Sweden who immigrate back to Sweden; during the period, that number remained
stable between 11,000 and 15,500 individuals per year. The majority of the
immigrants accordingly comprised individuals with a country of birth other than
Sweden.
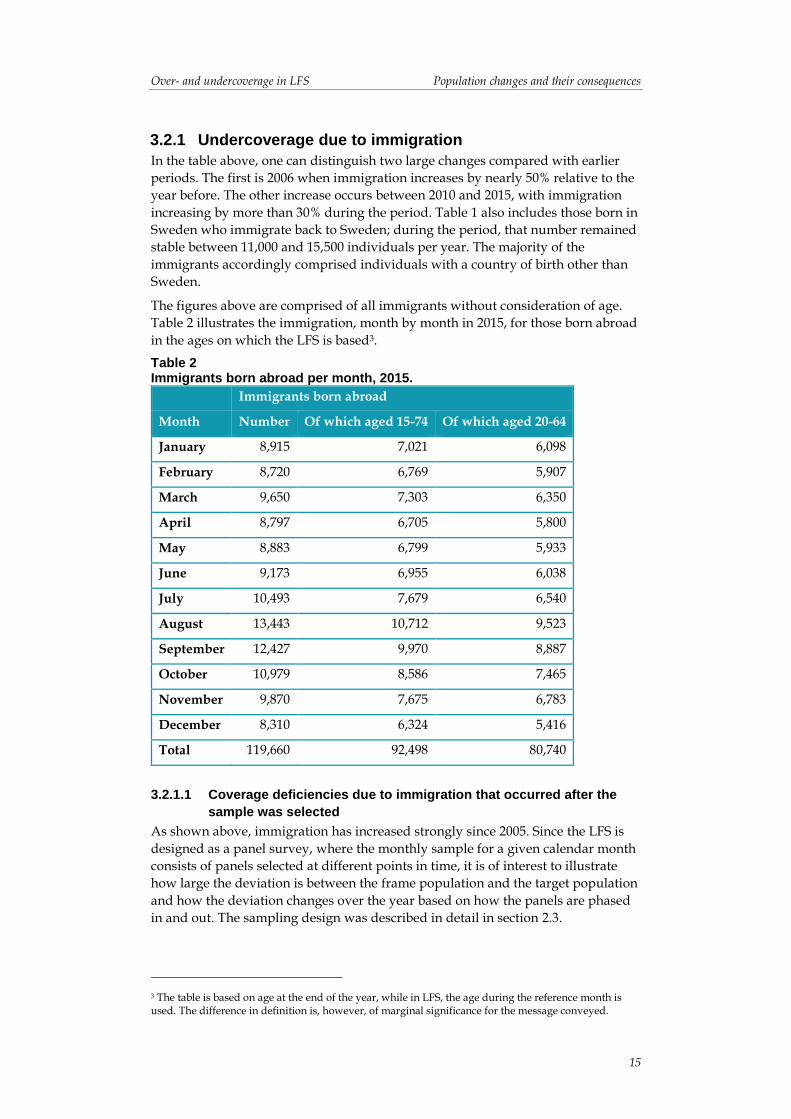
The figures above are comprised of all immigrants without consideration of age.
Table 2 illustrates the immigration, month by month in 2015, for those born abroad
in the ages on which the LFS is based3.
Table 2 Immigrants born abroad per month, 2015.
Immigrants born abroad
Month Number Of which aged 15-74 Of which aged 20-64
January 8,915 7,021 6,098
February 8,720 6,769 5,907
March 9,650 7,303 6,350
April 8,797 6,705 5,800
May 8,883 6,799 5,933
June 9,173 6,955 6,038
July 10,493 7,679 6,540
August 13,443 10,712 9,523
September 12,427 9,970 8,887
October 10,979 8,586 7,465
November 9,870 7,675 6,783
December 8,310 6,324 5,416
Total 119,660 92,498 80,740
3.2.1.1 Coverage deficiencies due to immigration that occurred after the
sample was selected
As shown above, immigration has increased strongly since 2005. Since the LFS is
designed as a panel survey, where the monthly sample for a given calendar month
consists of panels selected at different points in time, it is of interest to illustrate
how large the deviation is between the frame population and the target population
and how the deviation changes over the year based on how the panels are phased
in and out. The sampling design was described in detail in section 2.3.
3 The table is based on age at the end of the year, while in LFS, the age during the reference month is used. The difference in definition is, however, of marginal significance for the message conveyed.

Population changes and their consequences Over- and undercoverage in LFS
16
In accordance with Figure 1, the monthly sample for each calendar month in the
first quarter of 2015 consists of three panels that were selected in 2012, four panels
that were selected in 2013 and one panel that was selected in 2014. In the quarter
after, a panel from 2012 rotates out and is replaced by a new one selected in 2014.
In the same way, panels rotate in and out during the other two quarters of the year.
All panels have actuality on 30 September of the respective year.
Table 3 below presents the undercoverage for the calendar months in 2015 due to
immigration of those born abroad4. To take into account the fact that the monthly
sample consists of panels with different actuality, the undercoverage due to
immigration is calculated as a weighted sum. The deviation between the target
population and the frame population for the various annual samples is weighed
together with weights that correspond to the respective annual sample’s part of the
monthly sample. For example, for January the amount is 3/8*176,200 + 4/8*105,266
+ 1/8*20,272 = 121,242.
Table 3 Undercoverage per month due to immigration of those born abroad aged 15-74, 2015.
Population changes
after 30 September in
2015 Stock 20125 2013 2014 Under-
coverage
Percen-
tage
January 1,380,308 176,200 105,266 20,272 121,242 8.8
February 1,384,689 183,170 111,989 26,711 128,022 9.2
March 1,388,722 189,549 118,229 32,830 134,299 9.7
April 1,393,155 196,390 124,930 39,408 121,415 8.7
May 1,397,105 202,616 131,049 45,413 127,532 9.1
June 1,401,325 208,818 137,121 51,362 133,606 9.5
July 1,404,927 214,747 142,933 57,071 119,712 8.5
August 1,409,949 221,674 149,773 63,807 126,523 9.0
September 1,417,666 231,453 159,452 73,397 136,182 9.6
October 1,424,977 240,732 168,621 82,481 125,551 8.8
November 1,430,981 248,735 176,485 90,241 133,363 9.3
December 1,434,722 255,741 183,384 97,054 140,219 9.8
The table above states that in 2015 the deviation between the frame population for
a given annual sample and the target population ranged from just over 20,000 to
just over 230,000. Table 4 is analogous to Table 3, although with the difference that
4 In the calculations, age has been essentially defined in the same way as in the LFS.
5 In October, November and December, the undercoverage is not affected by the annual sample from
2012, which is why the population changes below are indicated with strikethroughs.

Over- and undercoverage in LFS Population changes and their consequences
17
it only pertains to those born abroad aged 20-64. Essentially, Table 4 conveys the
same message as Table 3.
Table 4 Undercoverage per month due to immigration of those born abroad aged 20-64, 2015.
Population changes
After 30 September in
2015 Stock 2012 2013 2014 Weighted
number
Percen-
tage
January 1,172,568 153,639 92,629 17,417 106,106 9.0
February 1,175,388 159,295 98,186 22,887 111,690 9.5
March 1,178,718 164,857 103,624 28,203 117,159 9.9
April 1,182,077 170,690 109,364 33,843 105,815 9.0
May 1,185,304 176,124 114,665 39,024 111,120 9.4
June 1,188,750 181,537 119,938 44,176 116,397 9.8
July 1,191,340 186,661 124,945 49,063 104,204 8.7
August 1,195,304 192,545 130,714 54,724 109,947 9.2
September 1,201,882 201,228 139,291 63,182 118,492 9.9
October 1,208,255 209,552 147,492 71,273 109,383 9.1
November 1,212,988 216,408 154,240 77,936 116,088 9.6
December 1,215,922 222,675 160,361 83,956 122,159 10.0
3.2.1.2 Immigrated persons born abroad by duration of stay
To further nuance the picture, information is presented in this section that reflects
the undercoverage for those born abroad aged 15-74 by the duration of stay in
Sweden. In the calculations that form the basis of the results, the duration of stay
for a given individual is defined based on the total number of days the person was
registered in Sweden. Because there are individuals who were already registered
among the individuals that make up the undercoverage due to immigration, the
undercoverage will therefore partly be comprised of persons with a duration of
stay that is longer than the time that has passed since their latest registration date.
There are two explanations as to why the results in Table 5 below do not monthly
sum up to the next to the last column in Table 3 above:
- For some individuals, there is no information on duration of stay, which is
why they are not included in the presentation below.
- The calculations in this section are based on definitions that deviate
somewhat from those used in the calculations in the previous section.
The lack of perfect numerical consistency between the tables does not weaken the
main message conveyed below - the shorter time an individual spends in Sweden,
the greater the risk that the individual is included in the LFS undercoverage set.
Population changes and their consequences Over- and undercoverage in LFS
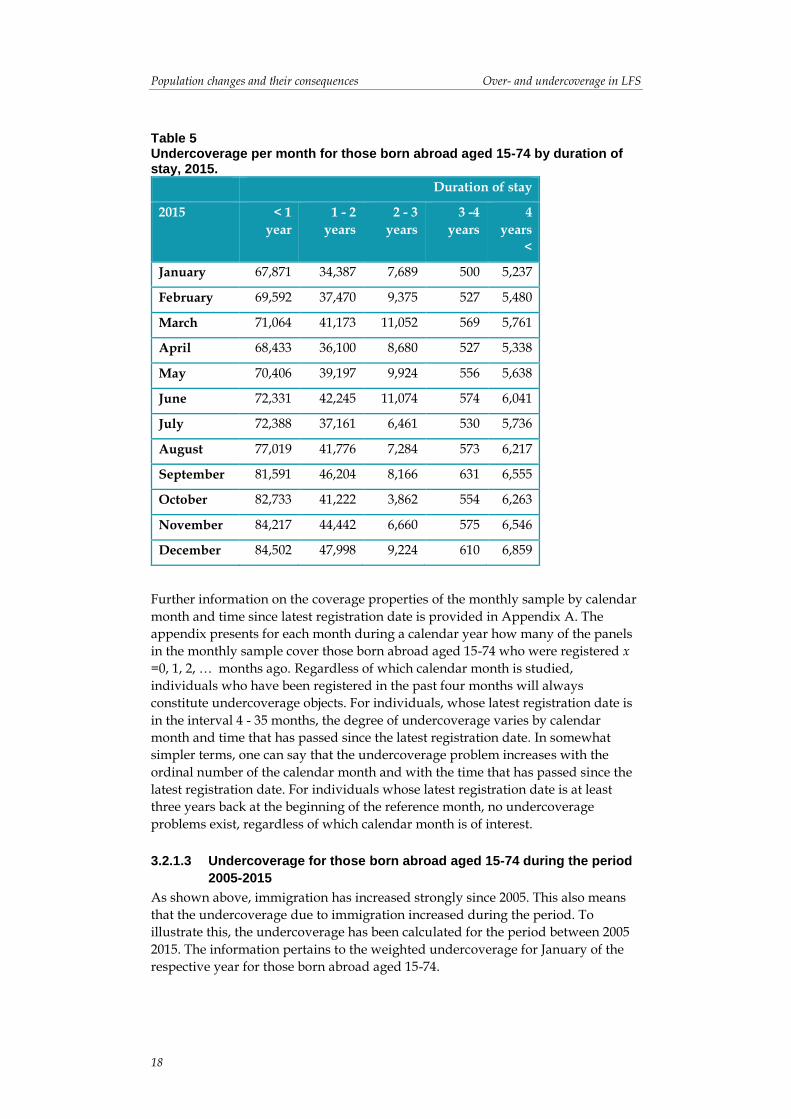
18
Table 5 Undercoverage per month for those born abroad aged 15-74 by duration of stay, 2015.
Duration of stay
2015 < 1
year
1 - 2
years
2 - 3
years
3 -4
years
4
years
<
January 67,871 34,387 7,689 500 5,237
February 69,592 37,470 9,375 527 5,480
March 71,064 41,173 11,052 569 5,761
April 68,433 36,100 8,680 527 5,338
May 70,406 39,197 9,924 556 5,638
June 72,331 42,245 11,074 574 6,041
July 72,388 37,161 6,461 530 5,736
August 77,019 41,776 7,284 573 6,217
September 81,591 46,204 8,166 631 6,555
October 82,733 41,222 3,862 554 6,263
November 84,217 44,442 6,660 575 6,546
December 84,502 47,998 9,224 610 6,859
Further information on the coverage properties of the monthly sample by calendar
month and time since latest registration date is provided in Appendix A. The
appendix presents for each month during a calendar year how many of the panels
in the monthly sample cover those born abroad aged 15-74 who were registered x
=0, 1, 2, … months ago. Regardless of which calendar month is studied,
individuals who have been registered in the past four months will always
constitute undercoverage objects. For individuals, whose latest registration date is
in the interval 4 - 35 months, the degree of undercoverage varies by calendar
month and time that has passed since the latest registration date. In somewhat
simpler terms, one can say that the undercoverage problem increases with the
ordinal number of the calendar month and with the time that has passed since the
latest registration date. For individuals whose latest registration date is at least
three years back at the beginning of the reference month, no undercoverage
problems exist, regardless of which calendar month is of interest.
3.2.1.3 Undercoverage for those born abroad aged 15-74 during the period
2005-2015
As shown above, immigration has increased strongly since 2005. This also means
that the undercoverage due to immigration increased during the period. To
illustrate this, the undercoverage has been calculated for the period between 2005
2015. The information pertains to the weighted undercoverage for January of the
respective year for those born abroad aged 15-74.

Over- and undercoverage in LFS Population changes and their consequences
19
Figure 3 Undercoverage in January for those born abroad aged 15-74, 2005-2015.
3.2.2 Overcoverage due to incorrect civil registration
Individuals who are incorrectly registered due to of the regulations not being
applied correctly are sometimes referred to as overcoverage in TPR. In terms of
definitions, the number of individuals who for a given reference month constitute
overcoverage due to incorrect registration is calculated as a weighted sum of the
overcoverage for the annual samples which contribute to the monthly sample, with
weights corresponding to each annual sample's part of the monthly sample. To be
able to calculate the number of individuals that constitute the overcoverage,
information is required at the individual level for those individuals who are
incorrectly registered, but such information does not exist in practice. Hence, it is
not possible to numerically illustrate the size of the overcoverage monthly.
However, there is good reason to assume that the overcoverage set, like the
undercoverage set, varies over time with regard to both number and composition.
Even if the size of the overcoverage in TPR cannot be calculated, many attempts to
estimate it have been made in recent years. Various methods have been used, such
as mortality rate assumptions, nonresponse studies, etc. In the most recent
attempts, focus has been placed on register studies, based on the basic idea that if
an individual resides in Sweden, this will leave imprints in one or more of the
registers which Statistics Sweden has at its disposal. It may concern events in the
Swedish Population Register, incomes, study participation, etc. If activities are
missing entirely during a calendar year, one can be assumed to have left the
country. Various projects have proceeded from these assumptions and further
developed the ideas. Common to the applied approaches is that they generate
estimates on an annual basis. For more information, see Statistics Sweden (2015).
If we proceed based on the results in Statistics Sweden (2015) and make a
projection for 2014, we can assume that the overcoverage resulting from incorrect
registration is on a magnitude of 75,000 individuals, of whom more than 50,000 are
born abroad. Earlier studies have found that if immigration increases, the
overcoverage will increase with a few years’ delay. A possible cause of this could
be that those who had difficulties establishing themselves in Sweden choose to
emigrate and do so without reporting it to the Swedish Tax Agency.
0
20000
40000
60000
80000
100000
120000
140000
2005 2006 2007 2008 2009 2010 2011 2012 2013 2014 2015

Estimation process in LFS Over- and undercoverage in LFS
20
4 Estimation procedure in the LFS
4.1 Generalised regression estimator (GREG) The estimation procedure in the LFS is based on a so-called generalised regression
estimator. The underlying idea is that, by explicitly using so-called auxiliary
information in the estimation procedure, one can reduce both the sampling error
and errors that arise due to of coverage deficiencies and nonresponse. For more
information about GREG estimation and the use of auxiliary information in the
estimation procedure, see e.g. Särndal, Swensson and Wretman (1992) and Särndal
and Lundström (2005).
4.2 Auxiliary information in the LFS estimation procedure
The auxiliary information in the LFS is comprised of, or derived from, register
variables. By using auxiliary information, consistency is created between estimates
in the LFS and the so-called auxiliary totals used in the estimation procedure. In a
mathematical sense, the auxiliary information used is comprised of both auxiliary
totals and a so-called auxiliary vector, which is created for all individuals that are
included in the monthly sample for the reference month which is of interest.
The auxiliary vector is created based on a number of register variables, which each
meet at least one of the following conditions:
- the variable co-varies with important survey variables
- the variable co-varies with selected individuals’ response propensity
- the variable can be used to identify one or more important study domains.
The auxiliary vector for a given reference month is compiled for all individuals
who (i) were included in TPR one month earlier and (ii) meet the LFS age criteria
during the reference month. How up-to-date the variables included in the auxiliary
vector are depends on the reference month. This means that the content of the
auxiliary vector for an individual included in a panel is not necessarily the same all
eight times the individual in question is included in the LFS monthly sample.
The auxiliary totals used for a given reference month are obtained by summing the
auxiliary vector for all individuals
- who were included in TPR on the last day of the calendar month before the
reference month
- who at the beginning of the reference month had turned at least 15
- who at the end of the reference month had not yet turned 75.
Below is a brief presentation of the variables included in the LFS auxiliary vector,
which form the basis of the calculations of the auxiliary totals used. For more
information, see Statistics Sweden (2011).
4.2.1 The Total Population Register (TPR)
For a given reference month, the LFS uses population information from TPR
pertaining to one month earlier. From TPR, information on sex, age, municipality,
county and country of birth is used:
- Sex is combined with age, divided into 15 years, 16-19 years, 20-24 years,
25-29 years, ..., 70-74 years, so that 26 groups are created.

Over- and undercoverage in LFS Estimation process in LFS
21
- Information about county and municipality is used to divide the
population into 26 groups.
- The division by country of birth is made into four groups: born in Sweden,
born elsewhere in the Nordic countries, born elsewhere in Europe and
born elsewhere in the world.
4.2.2 The Employment Register
In the estimation procedure, the LFS uses information from the Employment
Register, which is the register that forms the basis for Statistics Sweden's register-
based labour market statistics (RAMS). Based on this information, the population is
divided into eight groups where seven groups consist of the gainfully employed
divided by type of industry and one group made up of those not classified as
gainfully employed and/or where information on type of industry is missing.
For the calendar months January-November, the register information reflects the
conditions that existed in November two years earlier. The register information is
subsequently updated so that it for the reference month reflects the conditions that
existed in November one year earlier. Accordingly, the information from the
Employment Register is between 13 and 24 months old, depending on the
reference month.
4.2.3 The Swedish Public Employment Service
Based on information from the Swedish Public Employment Service, the
population is divided into two groups, openly unemployed or not. The
information pertains to the state during the reference month.
4.3 The LFS estimation procedure seen from a coverage perspective
The single most important reason that this report has been prepared is to illustrate
how the LFS estimation procedure is affected by undercoverage due to
immigration. The focus in this and upcoming sections is therefore on how the
estimation procedure used should be implemented under full response, i.e. if no
nonresponse existed and only sampling and frame coverage needed to be taken
into account as sources of uncertainty. This is because it is then possible to
mathematically isolate the impact the coverage deficiencies in sections 3.2.1 and
3.2.2 are expected to have on the statistics produced. Even if results regarding
coverage bias under full response are not directly transferable to the estimation
procedure used in practice – some of the individuals who constitute overcoverage
objects will normally be registered erroneously as nonresponse and vice versa – the
overall assessment is that the chosen approach is what best serves the purpose of
the analyses.
Appendix B provides a description of the LFS estimation procedure under full
response and a mathematical expression is given for the bias that can be attributed
to the treatment of the coverage deficiencies addressed in sections 3.2.1 and 3.2.2.
The presentation is based on all individuals in a monthly sample that are
incorrectly registered in connection with the data collection will correctly be
classified as belonging to the overcoverage set. The content in the appendix is
intended to give readers with statistical and mathematical training an insight into
how the LFS estimator is structured and how the coverage deficiencies discussed
are treated in purely mathematical terms and it is therefore relatively technical.

Estimation process in LFS Over- and undercoverage in LFS
22
Detailed understanding of the content in the appendix is, however, not necessary
to study the main results in the report in hand.
Many of the target parameters estimated in the LFS are defined as population
totals, i.e. as a sum of the variable values for all individuals that belong to the
target population. Totals on a study domain level can be expressed as totals on a
population level, by defining the target variable in such a way that it by definition
takes on the value of zero for all individuals that do not belong to the study
domain of interest. The presentation in Appendix B therefore addresses the
estimation of totals.
Let )(i
yt denote a total to be estimated for the reference month i and let )(ˆ i
yt denote
the LFS estimator for this parameter under full response6. Appendix B shows that
the bias for )(ˆ i
yt as an estimator for )(i
yt can be expressed in the form
)ˆ()ˆ()ˆ( )()()( i
yUC
i
yOC
i
y tBtBtB
where )ˆ( )(i
yOC tB represents the bias that follows from the treatment of
overcoverage (OC) due to incorrect registration, while )ˆ( )(i
yUC tB represents the
bias that follows from the treatment of undercoverage (UC) due to immigration.
The appendix provides formula expressions for both )ˆ( )(i
yOC tB and )ˆ( )(i
yUC tB .
4.3.1 Bias due to overcoverage in the estimation of totals
The term )ˆ( )(i
yOC tB arises because the estimation procedure used can be said to
assign values also to individuals who are incorrectly registered. In purely statistical
terms, this can be described as a form of imputation, which however takes place
implicitly rather than explicitly. The imputations arise due to it not being possible
in practice to adjust the auxiliary totals used for individuals that are incorrectly
registered. This is because the set that forms the basis for the calculation of the
auxiliary totals is based on TPR only one month before the end of the reference
month. Only much later is it possible to use register information to determine
which individuals were (most likely) incorrectly registered when the auxiliary
totals were determined. It may seem illogical to impute for overcoverage objects,
but there are explanations. It is indeed possible to construct an estimator for which
0)ˆ( )( i
yOC tB applies, but it would occur at the price of a larger sampling error. In
addition, it could have a negative impact on the numerical consistency that today
exists between important LFS estimates.
The size of the term )ˆ( )(i
yOC tB is largely driven by the number of incorrectly
registered individuals who numerically contribute to the auxiliary totals used. For
parameters regarding the population in general, as well as for parameters
regarding study domains that are made up of individuals born in Sweden, the
number of individuals that contribute to )ˆ( )(i
yOC tB are most likely few compared to
6 Nor is measurement error assumed to exist.

Over- and undercoverage in LFS Estimation process in LFS
23
the number of individuals who contribute to the target parameter )(i
yt . For this
kind of parameter, one can therefore on good grounds assume that )()( /)ˆ( i
y
i
yOC ttB is
very small, i.e. the bias that the treatment of overcoverage results in can be
expected to be small in relation to the target parameter that is estimated.
However, for parameters estimated for study domains based on those born abroad,
)ˆ( )(i
yOC tB can be substantial both absolutely and in relation to )(i
yt . However, over
time the overcoverage due to incorrect registration can be expected to be fairly
stable in terms of size and composition. This means that the possible bias that the
overcoverage causes in terms of size in the short and medium term can be expected
to be about the same, which in turn means that the bias is not necessarily a
problem when estimating the change in relation to the corresponding reference
time one year earlier.
4.3.2 Bias due to undercoverage in the estimation of totals
The term )ˆ( )(i
yUC tB represents the bias that arises as a result of how the coverage
deficiencies due to immigration are treated. Appendix B states that )ˆ( )(i
yUC tB can
be seen as a difference between two totals. The first total is comprised of the sum of
the expected value7 of the imputations that the estimation procedure results in for
the set of individuals who are identified as undercoverage when the auxiliary
totals are derived. The second total corresponds to the part of the monthly total
that can be attributed to those individuals who constituted undercoverage at the
reference time.
The size of )ˆ( )(i
yUC tB is accordingly affected by (i) the size of, and overlap between,
the two undercoverage sets and (ii) how large the deviation at the individual level
is between imputed (in expectation) and actual value. From a practical perspective,
it is most likely (ii) that gives rise to undercoverage bias of a substantial size. If the
individuals that constitute undercoverage due to immigration and the individuals
who do not comprise undercoverage were to show essentially the same
relationship between important survey variables and the auxiliary vector used, one
could probably ignore the potential bias that the undercoverage causes. However,
in practice, the situation is basically the opposite – the relationship between
important survey variables and the auxiliary vector used tends to be markedly
different for undercoverage individuals and other individuals.
As stated about )ˆ( )(i
yOC tB in the previous section, the extent to which )ˆ( )(i
yUC tB is
at risk of constituting a problem largely depends on what target parameter is of
interest. In general, however, when the immigration fluctuates a great deal over
time, the bias resulting from immigration can be expected to be a larger problem
than the bias resulting from overcoverage due to incorrect registration. This is
particularly, but not solely, true for the estimation of totals for study domains,
which are partly or wholly defined based on characteristics that can be linked to
immigration. Examples of such allocation grounds are those born abroad, country
of birth and duration of stay in Sweden.
7 In a mathematical statistics sense.

Estimation process in LFS Over- and undercoverage in LFS
24
Since the undercoverage tends to exhibit relatively large variation over time in
terms of both size and composition, one must also proceed on the basis that
undercoverage bias can potentially cause problems even when deriving change
estimates in relation to the corresponding reference time one year earlier.
4.3.3 Bias resulting from over- and undercoverage in the estimation of ratios between totals
Assume that one is interested in estimating the ratio
)(
)(
),(
, j
z
i
yji
zyt
tR
In purely mathematical terms, an estimate of )(
,
i
zyR is obtained by first estimating
the totals )(i
yt and )( j
zt with )(ˆ i
yt and )(ˆ j
zt , according to the estimation procedure
described in Appendix B, and then calculating the ratio
)(
)(
),(
, ˆ
ˆˆ
j
z
i
yji
zyt
tR
A number of the parameters central to the LFS are defined as a ratio between two
totals. Most common are ratios between totals that pertain to the same reference
time, i.e. the situation when ji . Important examples are the unemployment rate,
the employment rate and the labour force participation rate. These parameters are
estimated at both the population level and for a number of important study
domains.
Let )()()( /)ˆ()ˆ( i
y
i
y
i
y ttBtRB , i.e. let )ˆ( )(i
ytRB describe the ratio between the bias for
)(ˆ i
yt and )(i
yt , and define )ˆ( )( j
ztRB analogously. Hence8
)ˆ(1
)ˆ(1
)]ˆ(1[
)]ˆ(1[
)ˆ(
)ˆ()ˆ(
)(
)(
),(
,)()(
)()(
)(
)(
),(
, j
z
i
yji
zyj
z
j
z
i
y
i
y
j
z
i
yji
zytRB
tRBR
tRBt
tRBt
tE
tERE
which is why an approximate expression for ),(
,
),(
,
),(
, )ˆ()ˆ( ji
zy
ji
zy
ji
zy RRERB , the bias
for ),(
,ˆ ji
zyR as an estimator for )(
,
i
zyR , is given by
8 The approximation of the first step is a standard approximation within sampling theory. Its validity is
primarily a function of the sample size, which for the LFS is so large that the approximation is valid.
Over- and undercoverage in LFS Estimation process in LFS
25
)ˆ(1
)ˆ()ˆ(1
)ˆ(1
)ˆ(1)ˆ(
)(
)()(
),(
,)(
)(
),(
,
),(
, j
z
j
z
i
yji
zyj
z
i
yji
zy
ji
zytRB
tRBtRBR
tRB
tRBRRB (1)
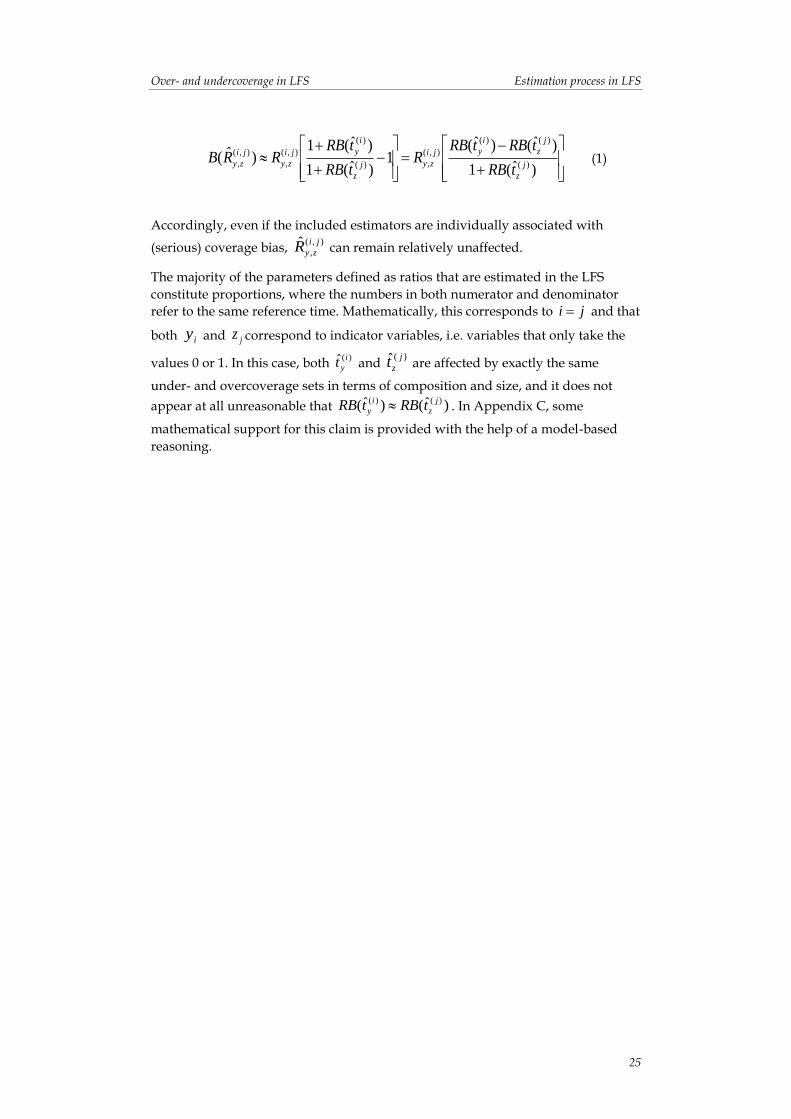
Accordingly, even if the included estimators are individually associated with
(serious) coverage bias, ),(
,ˆ ji
zyR can remain relatively unaffected.
The majority of the parameters defined as ratios that are estimated in the LFS
constitute proportions, where the numbers in both numerator and denominator
refer to the same reference time. Mathematically, this corresponds to ji and that
both iy and jz correspond to indicator variables, i.e. variables that only take the
values 0 or 1. In this case, both )(ˆ i
yt and )(ˆ j
zt are affected by exactly the same
under- and overcoverage sets in terms of composition and size, and it does not
appear at all unreasonable that )ˆ()ˆ( )()( j
z
i
y tRBtRB . In Appendix C, some
mathematical support for this claim is provided with the help of a model-based
reasoning.
Numerical illustration Over- and undercoverage in LFS
26
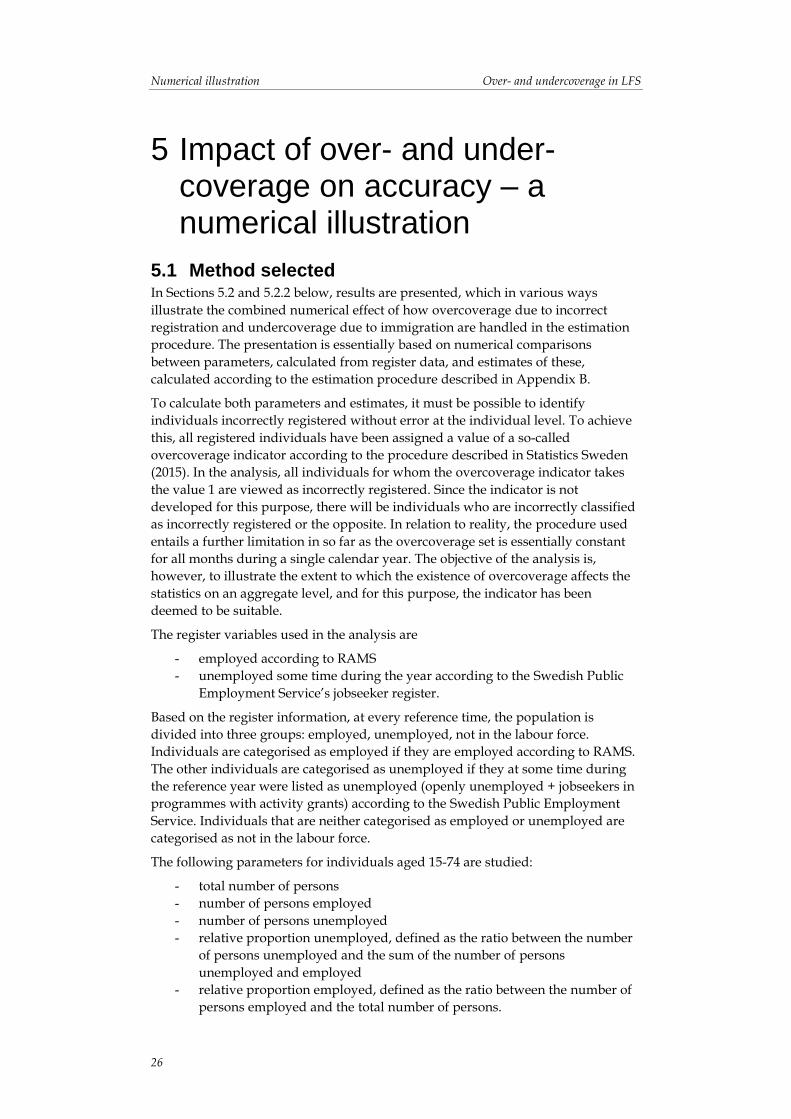
5 Impact of over- and under-coverage on accuracy – a numerical illustration
5.1 Method selected In Sections 5.2 and 5.2.2 below, results are presented, which in various ways
illustrate the combined numerical effect of how overcoverage due to incorrect
registration and undercoverage due to immigration are handled in the estimation
procedure. The presentation is essentially based on numerical comparisons
between parameters, calculated from register data, and estimates of these,
calculated according to the estimation procedure described in Appendix B.
To calculate both parameters and estimates, it must be possible to identify
individuals incorrectly registered without error at the individual level. To achieve
this, all registered individuals have been assigned a value of a so-called
overcoverage indicator according to the procedure described in Statistics Sweden
(2015). In the analysis, all individuals for whom the overcoverage indicator takes
the value 1 are viewed as incorrectly registered. Since the indicator is not
developed for this purpose, there will be individuals who are incorrectly classified
as incorrectly registered or the opposite. In relation to reality, the procedure used
entails a further limitation in so far as the overcoverage set is essentially constant
for all months during a single calendar year. The objective of the analysis is,
however, to illustrate the extent to which the existence of overcoverage affects the
statistics on an aggregate level, and for this purpose, the indicator has been
deemed to be suitable.
The register variables used in the analysis are
- employed according to RAMS
- unemployed some time during the year according to the Swedish Public
Employment Service’s jobseeker register.
Based on the register information, at every reference time, the population is
divided into three groups: employed, unemployed, not in the labour force.
Individuals are categorised as employed if they are employed according to RAMS.
The other individuals are categorised as unemployed if they at some time during
the reference year were listed as unemployed (openly unemployed + jobseekers in
programmes with activity grants) according to the Swedish Public Employment
Service. Individuals that are neither categorised as employed or unemployed are
categorised as not in the labour force.
The following parameters for individuals aged 15-74 are studied:
- total number of persons
- number of persons employed
- number of persons unemployed
- relative proportion unemployed, defined as the ratio between the number
of persons unemployed and the sum of the number of persons
unemployed and employed
- relative proportion employed, defined as the ratio between the number of
persons employed and the total number of persons.

Over- and undercoverage in LFS Numerical illustration
27
The parameters are estimated for the reference periods of month, quarter and year
for the following study domains:
- sex combined with age
- sex combined with country of birth
- sex combined with duration of stay9 for those born abroad
where age, country of birth and duration of stay are categorised. In addition to
statistics regarding cross sections, changes over time are also studied.
The three grounds for division have been chosen to reflect three different situations
in terms of the effect the undercoverage is expected to have on the accuracy of the
statistics. Pursuant to section 4.3, one can expect an noticeable effect for the
estimates reported by age and duration of stay.
The numerical results presented below and in Appendix D pertain to the years
2014 and 2015, which are the two latest years for which the overcoverage indicator
can be prepared. For each combination of parameter and study domain, the
following have been calculated for each reference month:
- parameter
- estimated parameter
- estimated margin of error, calculated as 2 * estimated standard error10
- estimated bias B̂ , calculated as parameter - estimated parameter
- estimateed relative bias BR ˆ , calculated as B̂ /parameter11.
The parameter is calculated based on register data for all individuals aged 15-74
who at the end of the reference month were registered and had the value of 0 for
the overcoverage indicator. The estimated parameter is derived according to the
procedure in Appendix B and the estimation is based on register data for the LFS
monthly sample under full response. This means that all individuals in the sample
for which the overcoverage indicator takes the value 0 are classified and treated as
overcoverage, while other individuals contribute with variable information. Both
the auxiliary vector and the auxiliary totals are comprised of the auxiliary
information used in the LFS.
Since the variance of B̂ is determined entirely by the variance for the point
estimator used, B̂ ± 2* estimated standard error can be interpreted as an
approximate 95% confidence interval for the bias. If an interval does not cover the
value 0, the conclusion is drawn that the bias is different from zero. In the tables
below and in Appendices D and E, this is indicated using an asterisk (*).
The results in Appendix D refer to level estimates, while the results in Appendix E
refer to change estimates. Parameters, and corresponding estimates, for quarters
9 Duration of stay in Sweden is defined in the same way as in section 3.2.1.2.
10 Corresponds to the root of the variance estimate that the variance estimator used by LFS today
results in under full response.
11 Formula (B.2) in Appendix B offers an alternative way to estimate the coverage bias; an estimate can
be obtained by replacing the unknown B-vector in (B.2) with the estimate as per (B.1). This estimator
would probably be less affected by sampling error than B̂ . It is possible to estimate the sampling error that an estimator based on (B.2) would have, but the procedure means that data must be processed in a manner that Statistics Sweden currently partly lacks IT-support for. Developing such support in the scope of this project has not been deemed reasonable.

Numerical illustration Over- and undercoverage in LFS
28
and years are based on numerical information regarding month according to the
procedure used in the LFS; for more information, see Statistics Sweden (2011).
5.2 Register analysis
5.2.1 Level estimates
5.2.1.1 Estimates for January 2014 – an in-depth look
Tables 6-8 below present results that pertain to estimates of the numbers for the
reference month of January 2014. The results are fully consistent with what can be
expected according to section 4.3. In all tables, the estimated bias pertains to bias
caused by overcoverage of those incorrectly registered and undercoverage of those
who immigrated.
The estimates in Table 6 regarding the number of persons by sex and age are all
accompanied by the standard error 0. This is a direct consequence of the chosen
estimation procedure and the auxiliary vector used, in the sense that the estimates
perfectly recreate the used auxiliary totals by sex and age. The estimated bias B̂ ,
which is calculated as the difference between an estimate and the estimated
parameter, corresponds in this case to the actual bias that the estimator is
associated with. Since the estimates for sex and age are not associated with any
sampling error, in a strict statistical sense the bias is different from 0, but in a
relative sense, the bias is almost negligible for most groups.

Over- and undercoverage in LFS Numerical illustration
29
Table 6 Number of persons by sex and age, January 2014.
Sex and age Register
total
Estimate and margin
of error
�̂� 𝐑�̂�
Men 15 years 51,164 51,174 ±0 10 * 0.0
16-19 years 228,131 228,453 ±0 322 * 0.1
20-24 years 340,623 343,573 ±0 2,950 * 0.9
25-34 years 614,233 630,216 ±0 15,983 * 2.6
35-44 years 623,691 634,182 ±0 10,491 * 1.7
45-54 years 642,934 651,374 ±0 8,440 * 1.3
55-59 years 286,287 289,681 ±0 3,394 * 1.2
60-64 years 282,950 285,035 ±0 2,085 * 0.7
65-69 years 297,978 299,188 ±0 1,210 * 0.4
70-74 years 219,329 220,513 ±0 1,184 * 0.5
Women 15 years 47,721 47,734 ±0 13 * 0.0
16-19 years 213,577 213,878 ±0 301 * 0.1
20-24 years 324,847 327,461 ±0 2,614 * 0.8
25-34 years 591,891 602,014 ±0 10,123 * 1.7
35-44 years 610,069 615,116 ±0 5,047 * 0.8
45-54 years 627,879 631,886 ±0 4,007 * 0.6
55-59 years 284,790 286,730 ±0 1,940 * 0.7
60-64 years 284,902 286,494 ±0 1,592 * 0.6
65-69 years 303,385 304,595 ±0 1,210 * 0.4
70-74 years 230,006 231,347 ±0 1,341 * 0.6
Also country of birth, with the four categories used in Table 7, is included in the
auxiliary vector, but the variable is not combined with sex. Therefore, the estimates
of the number of persons by sex and country of birth are associated with sampling
error. However, summing the estimates for men and women within the respective
country of birth category recreates the used auxiliary totals by country of birth.
This is reflected in the same standard error estimate being obtained for men and
women in the respective country of birth category. The estimated bias B̂ indicates
that some problems exist, but only in one case is it concluded that the bias is
different from zero. For those born in Sweden, the relative bias can be disregarded,
but for those born abroad, this is not necessarily the case.

Numerical illustration Over- and undercoverage in LFS
30
Table 7 Number of persons by sex and country of birth, January 2014.
Sex and country
of birth
Register
total
Estimate and margin
of error
�̂� 𝐑�̂�
Men
Born in Sweden 2,963,844 2,973,942 ±17,883 10,098 0.3
Born in the
Nordic
countries,
excluding
Sweden
84,528 88,017 ±8,451 3,489 4.1
Born in Europe,
excluding the
Nordic
countries
211,273 231,417 ±11,422 20,144 * 9.5
Born in the rest
of the world 327,675 340,013 ±13,020 12,338 3.8
Women
Born in Sweden 2,868,904 2,881,421 ±17,883 12,517 0.4
Born in the
Nordic
countries,
excluding
Sweden
107,208 111,876 ±8,451 4,668 4.4
Born in Europe,
excluding the
Nordic
countries
211,487 210,687 ±11,422 -800 -0.4
Born in the rest
of the world 331,468 343,271 ±13,020 11,803 3.6
Table 8 presents results regarding estimation of the number of persons born
abroad by duration of stay. For Table 8, the sum of all estimates is not associated
with sampling error since the sum perfectly recreates the sum of the auxiliary
totals for those born abroad. This is also an effect of the auxiliary information used.
Despite this, the bias problems are obvious; in six out of twelve cases, the
conclusion is drawn that the bias is different from zero. This is largely a
consequence of how the undercoverage is treated in the estimation procedure. It is
also worth pointing out that the sum of the estimated bias for men and women,
respectively, in Table 8 corresponds to the sum of bias estimates in Table 7 over the
three categories of country of birth that correspond to those born abroad.
Accordingly, there is a dependency between the bias estimates in the Tables 8 and
7. This means that the table cells in Table 8 are partially “communicating vessels”,
which for example can be seen in the bias estimates for men. The estimated bias for
men born abroad in Tables 7 and 8 is summed in the respective table to 35,791.
Since one can in advance expect that the undercoverage will cause serious
underestimates when estimating totals representing number of persons for

Over- and undercoverage in LFS Numerical illustration
31
individuals with a short duration of stay, one can at the same time expect serious
overestimates for one or more of the groups that pertain to individuals with a long
duration of stay. This is also exactly what is seen in Table 8.
Table 8 Number of persons born abroad by sex and duration of stay, January 2014.
Sex and duration
of stay
Register
total
Estimate and margin
of error
�̂� 𝐑�̂�
Men
1 year or less 33,192 3,879 ±2,183 -29,313 * -88.3
More than 1 year,
but not longer than
2 years
27,638 17,187 ±4,659 -10,451 * -37.8
More than 2 years,
but not longer than
3 years
24,776 25,339 ±5,253 563 2.3
More than 3 years,
but not longer than
4 years
23,778 28,466 ±5,760 4,688 19.7
More than 4 years 498,129 569,489 ±18,289 71,360 * 14.3
Information on
duration of stay is
unavailable
15,963 15,086 ±5,385 -877 -5.5
Women 1 year or less
30,475 3,009 ±1,880 -27,466 * -90.1
More than 1 years,
but not longer than
2 years
26,767 18,419 ±4,663 -8,348 * -31.2
More than 2 years,
but not longer than
3 years
23,322 24,539 ±5,098 1,217 5.2
More than 3 years,
but not longer than
4 years
22,733 27,865 ±5,422 5,132 22.6
More than 4 years 534,288 577,160 ±18,224 42,872 * 8.0
Information on
duration of stay is
unavailable
12,578 14,842 ±4,327 2,264 18.0
Even though the effects are harder to predict for estimates regarding the numbers
of persons employed and unemployed, for these parameters as well, the auxiliary
information results in a dependency between estimates, regarding both parameters
and bias, in study domains that by definition can be linked to each other. Results
for January 2014 are provided in Tables D.1-D.6 in Appendix D. In these tables, all
estimates of bias are associated with sampling error, but considering this, the tables
convey essentially the same message as Tables 6-8 above. Even though the picture

Numerical illustration Over- and undercoverage in LFS
32
is not perfect for estimates by sex and age or sex and country of birth – it is clear
that some non-negligible bias problems exist – it is apparent that the problem is of
an entirely different magnitude when studying estimates that pertain to totals
presented by duration of stay in Sweden for those born abroad.
In line with the discussion in section 4.3.3, one can expect the estimates of ratios at
study domain level to be affected to a lesser extent by coverage bias. This is
because the coverage problems are treated in an analogous manner in the
estimation of numerator and denominator. The extent to which bias remains is
essentially a function of the relative bias for the estimators used to estimate
numerator and denominator. Tables 9-11 below present results that pertain to the
proportion employed. Even though the picture conveyed is not perfect, it is
encouraging – when considering the sampling error that the estimates are
associated with, the bias is significantly different from 0 only for five specific study
domains.
The results for the relative proportion unemployed (see Tables D.7-D.9 in
Appendix D) point in the same direction. Even though the conclusion is that the
eight bias estimates are different from 0, four of them pertain to study domains
that are of limited interest seen from a Swedish labour market perspective: men
and women aged 15 and 70-74, respectively.

Over- and undercoverage in LFS Numerical illustration
33
Table 9 Proportion employed by sex and age, January 2014.
Sex and age Register
total
Estimate and
margin of error
�̂� 𝐑�̂�
Men 15 years
1.1 0.0 ±0.0 -1.1 * -100.0
16-19 years 27.9 27.7 ±2.7 -0.2 -0.7
20-24 years 63.7 64.8 ±2.4 1.2 1.8
25-34 years 80.8 80.7 ±1.4 -0.1 -0.2
35-44 years 87.6 87.9 ±1.2 0.3 0.3
45-54 years 86.0 85.9 ±1.2 0.0 0.0
55-59 years 81.3 80.3 ±2.2 -1.0 -1.2
60-64 years 64.8 62.6 ±2.7 -2.2 -3.4
65-69 years 27.9 24.9 ±3.8 -3.0 -10.7
70-74 years 15.9 16.4 ±4.2 0.5 3.1
Women 15 years
2.0 3.1 ±3.5 1.1 57.8
16-19 years 33.0 31.5 ±2.9 -1.5 -4.5
20-24 years 61.1 61.9 ±2.5 0.7 1.2
25-34 years 76.3 76.1 ±1.6 -0.1 -0.2
35-44 years 84.5 84.3 ±1.4 -0.2 -0.2
45-54 years 84.3 83.8 ±1.3 -0.5 -0.6
55-59 years 79.4 78.3 ±2.3 -1.0 -1.3
60-64 years 58.6 57.7 ±2.8 -0.9 -1.5
65-69 years 16.5 18.4 ±3.3 1.9 11.3
70-74 years 8.0 6.3 ±2.4 -1.7 -21.2

Numerical illustration Over- and undercoverage in LFS
34
Table 10 Number of persons employed by sex and country of birth, January 2014.
Sex and country of
birth
Register
total
Estimate and margin
of error
�̂� 𝐑�̂�
Men
Born in Sweden 69.2 69.1 ±0.7 -0.1 -0.1
Born in the Nordic
countries,
excluding Sweden
51.3 51.4 ±6.5 0.1 0.2
Born in Europe,
excluding the
Nordic countries
64.0 61.6 ±4.1 -2.4 -3.7
Born in the rest of
the world 55.7 56.1 ±2.8 0.4 0.7
Women
Born in Sweden 65.9 65.9 ±0.7 0.0 0.0
Born in the Nordic
countries,
excluding Sweden
50.2 49.1 ±5.9 -1.1 -2.3
Born in Europe,
excluding the
Nordic countries
57.3 57.5 ±3.6 0.3 0.5
Born in the rest of
the world 48.6 47.4 ±2.9 -1.2 -2.4

Over- and undercoverage in LFS Numerical illustration
35
Table 11 Percentage of employed individuals born abroad by sex and duration of stay, January 2014.
Sex and duration
of stay
Register
total
Estimate and margin
of error
�̂� 𝐑�̂�
Men 1 year or less
38.1 43.5 ±28.2 5.4 14.1
More than 1 years,
but not longer than
2 years
50.9 56.2 ±13.7 5.2 10.3
More than 2 years,
but not longer than
3 years
55.8 55.9 ±10.5 0.2 0.3
More than 3 years,
but not longer than
4 years
58.1 61.2 ±10.3 3.0 5.2
More than 4 years 61.6 58.9 ±2.3 -2.6 * -4.3
Information on
duration of stay is
unavailable
0.1 0.0 ±0.0 -0.1 * -100.0
Women 1 year or less
21.6 41.8 ±31.0 20.2 93.5
More than 1 years,
but not longer than
2 years
31.1 29.8 ±11.7 -1.3 -4.2
More than 2 years,
but not longer than
3 years
37.8 36.8 ±10.1 -1.0 -2.6
More than 3 years,
but not longer than
4 years
39.6 42.6 ±9.8 3.0 7.5
More than 4 years 56.7 53.9 ±2.3 -2.8 * -5.0
Information on
duration of stay is
unavailable
0.0 0.0 ±0.0 0.0 * -100.0
5.2.1.2 Summary comments regarding level estimates
Summary results are presented below regarding the level estimates included in the
study.
Tables 12-14 present results regarding three estimated parameters defined as totals:
number of persons, number of persons employed, and number of persons
unemployed. For each category of the three study domains included in the study,
the average relative bias, calculated as an arithmetic mean of the monthly estimates
of relative bias, and the proportion of the bias estimates that are significant are
presented. Both results are given as percentages.
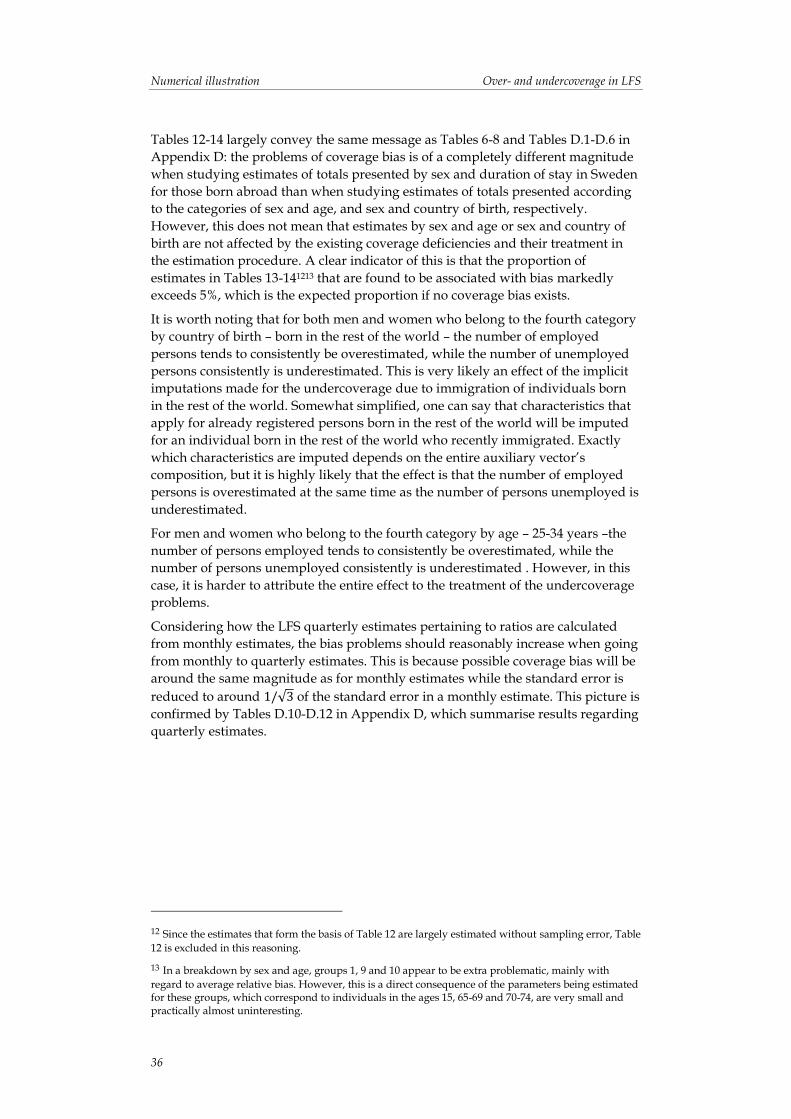
Numerical illustration Over- and undercoverage in LFS
36
Tables 12-14 largely convey the same message as Tables 6-8 and Tables D.1-D.6 in
Appendix D: the problems of coverage bias is of a completely different magnitude
when studying estimates of totals presented by sex and duration of stay in Sweden
for those born abroad than when studying estimates of totals presented according
to the categories of sex and age, and sex and country of birth, respectively.
However, this does not mean that estimates by sex and age or sex and country of
birth are not affected by the existing coverage deficiencies and their treatment in
the estimation procedure. A clear indicator of this is that the proportion of
estimates in Tables 13-141213 that are found to be associated with bias markedly
exceeds 5%, which is the expected proportion if no coverage bias exists.
It is worth noting that for both men and women who belong to the fourth category
by country of birth – born in the rest of the world – the number of employed
persons tends to consistently be overestimated, while the number of unemployed
persons consistently is underestimated. This is very likely an effect of the implicit
imputations made for the undercoverage due to immigration of individuals born
in the rest of the world. Somewhat simplified, one can say that characteristics that
apply for already registered persons born in the rest of the world will be imputed
for an individual born in the rest of the world who recently immigrated. Exactly
which characteristics are imputed depends on the entire auxiliary vector’s
composition, but it is highly likely that the effect is that the number of employed
persons is overestimated at the same time as the number of persons unemployed is
underestimated.
For men and women who belong to the fourth category by age – 25-34 years –the
number of persons employed tends to consistently be overestimated, while the
number of persons unemployed consistently is underestimated . However, in this
case, it is harder to attribute the entire effect to the treatment of the undercoverage
problems.
Considering how the LFS quarterly estimates pertaining to ratios are calculated
from monthly estimates, the bias problems should reasonably increase when going
from monthly to quarterly estimates. This is because possible coverage bias will be
around the same magnitude as for monthly estimates while the standard error is
reduced to around 1/√3 of the standard error in a monthly estimate. This picture is
confirmed by Tables D.10-D.12 in Appendix D, which summarise results regarding
quarterly estimates.
12 Since the estimates that form the basis of Table 12 are largely estimated without sampling error, Table
12 is excluded in this reasoning.
13 In a breakdown by sex and age, groups 1, 9 and 10 appear to be extra problematic, mainly with
regard to average relative bias. However, this is a direct consequence of the parameters being estimated for these groups, which correspond to individuals in the ages 15, 65-69 and 70-74, are very small and practically almost uninteresting.

Over- and undercoverage in LFS Numerical illustration
37
Table 12 Estimate of number of persons, month: average relative bias (1) and proportion of significant bias estimates (2).
Grp. Men
and age
Women
and age
Men and
country of
birth
Women and
country of
birth
Men and
duration of
stay
Women and
duration of
stay
(1) (2) (1) (2) (1) (2) (1) (2) (1) (2) (1) (2)
1 -0.1 100.0 -0.1 100.0 0.8 83.3 0.0 0.0 -94.2 100.0 -93.8 100.0
2 0.0 100.0 0.1 100.0 4.6 4.2 3.8 0.0 -49.5 100.0 -49.1 100.0
3 0.7 100.0 0.6 100.0 3.4 25.0 5.7 58.3 8.7 8.3 10.9 20.8
4 2.3 100.0 1.6 100.0 3.0 29.2 3.0 20.8 23.0 41.7 22.5 37.5
5 1.7 100.0 0.8 100.0 . . . . 13.4 100.0 12.0 100.0
6 1.3 100.0 0.6 100.0 . . . . 1.7 16.7 -4.1 16.7
7 1.2 100.0 0.7 100.0 . . . . . . . .
8 0.8 100.0 0.6 100.0 . . . . . . . .
9 0.4 100.0 0.4 100.0 . . . . . . . .
10 0.5 100.0 0.6 100.0 . . . . . . . .
Table 13 Estimate of number of persons employed, month: average relative bias (1) and proportion of significant bias estimates (2).
Grp. Men
and age
Women
and age
Men and
country of
birth
Women and
country of
birth
Men and
duration of
stay
Women and
duration of
stay
(1) (2) (1) (2) (1) (2) (1) (2) (1) (2) (1) (2)
1 176.9 45.8 36.3 41.7 -0.2 0.0 -1.1 37.5 -94.0 100.0 -91.2 100.0
2 -0.3 0.0 -0.6 0.0 9.6 29.2 3.4 0.0 -49.2 100.0 -41.9 66.7
3 -0.6 0.0 0.9 16.7 1.4 25.0 7.8 54.2 4.6 0.0 16.8 0.0
4 2.7 91.7 2.8 58.3 8.8 83.3 10.8 83.3 23.0 20.8 28.5 25.0
5 1.2 54.2 1.2 33.3 . . . . 11.6 100.0 10.8 91.7
6 1.1 37.5 -0.8 12.5 . . . . -75.0 83.3 -20.8 29.2
7 0.0 0.0 -0.8 0.0 . . . . . . . .
8 -1.9 12.5 -1.7 0.0 . . . . . . . .
9 0.1 0.0 1.6 0.0 . . . . . . . .
10 -7.2 4.2 -13.4 8.3 . . . . . . . .
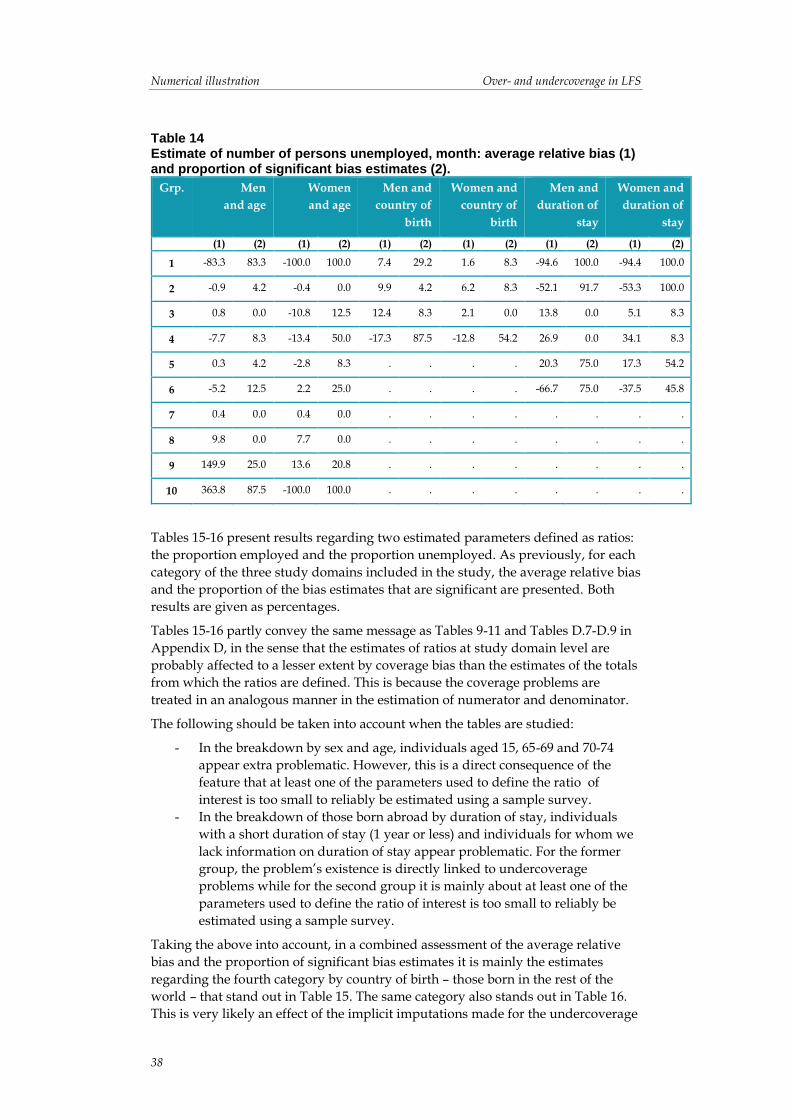
Numerical illustration Over- and undercoverage in LFS
38
Table 14 Estimate of number of persons unemployed, month: average relative bias (1) and proportion of significant bias estimates (2).
Grp. Men
and age
Women
and age
Men and
country of
birth
Women and
country of
birth
Men and
duration of
stay
Women and
duration of
stay
(1) (2) (1) (2) (1) (2) (1) (2) (1) (2) (1) (2)
1 -83.3 83.3 -100.0 100.0 7.4 29.2 1.6 8.3 -94.6 100.0 -94.4 100.0
2 -0.9 4.2 -0.4 0.0 9.9 4.2 6.2 8.3 -52.1 91.7 -53.3 100.0
3 0.8 0.0 -10.8 12.5 12.4 8.3 2.1 0.0 13.8 0.0 5.1 8.3
4 -7.7 8.3 -13.4 50.0 -17.3 87.5 -12.8 54.2 26.9 0.0 34.1 8.3
5 0.3 4.2 -2.8 8.3 . . . . 20.3 75.0 17.3 54.2
6 -5.2 12.5 2.2 25.0 . . . . -66.7 75.0 -37.5 45.8
7 0.4 0.0 0.4 0.0 . . . . . . . .
8 9.8 0.0 7.7 0.0 . . . . . . . .
9 149.9 25.0 13.6 20.8 . . . . . . . .
10 363.8 87.5 -100.0 100.0 . . . . . . . .
Tables 15-16 present results regarding two estimated parameters defined as ratios:
the proportion employed and the proportion unemployed. As previously, for each
category of the three study domains included in the study, the average relative bias
and the proportion of the bias estimates that are significant are presented. Both
results are given as percentages.
Tables 15-16 partly convey the same message as Tables 9-11 and Tables D.7-D.9 in
Appendix D, in the sense that the estimates of ratios at study domain level are
probably affected to a lesser extent by coverage bias than the estimates of the totals
from which the ratios are defined. This is because the coverage problems are
treated in an analogous manner in the estimation of numerator and denominator.
The following should be taken into account when the tables are studied:
- In the breakdown by sex and age, individuals aged 15, 65-69 and 70-74
appear extra problematic. However, this is a direct consequence of the
feature that at least one of the parameters used to define the ratio of
interest is too small to reliably be estimated using a sample survey.
- In the breakdown of those born abroad by duration of stay, individuals
with a short duration of stay (1 year or less) and individuals for whom we
lack information on duration of stay appear problematic. For the former
group, the problem’s existence is directly linked to undercoverage
problems while for the second group it is mainly about at least one of the
parameters used to define the ratio of interest is too small to reliably be
estimated using a sample survey.
Taking the above into account, in a combined assessment of the average relative
bias and the proportion of significant bias estimates it is mainly the estimates
regarding the fourth category by country of birth – those born in the rest of the
world – that stand out in Table 15. The same category also stands out in Table 16.
This is very likely an effect of the implicit imputations made for the undercoverage

Over- and undercoverage in LFS Numerical illustration
39
due to immigration, in accordance with the argumentation above. Also the fourth
category by age – 25-34 years – stands out in Table 16, but as previously
mentioned, it is harder in this case to attribute the entire effect to the treatment of
the undercoverage problems.
For the same reason presented above, the bias problems should reasonably
increase when going from monthly estimates to quarterly estimates. This picture is
confirmed by Tables D.13-D.14 in Appendix D, which summarise results regarding
quarterly estimates.
Table 15 Estimate of proportion employed, month: average relative bias (1) and proportion of significant bias estimates (2).
Grp. Men
and age
Women
and age
Men and
country of
birth
Women and
country of
birth
Men and
duration
of stay
Women and
duration of
stay
(1) (2) (1) (2) (1) (2) (1) (2) (1) (2) (1) (2)
1 177.3 45.8 36.3 41.7 -1.0 41.7 -1.1 41.7 2.2 45.8 -10.3 41.7
2 -0.3 0.0 -0.7 0.0 4.7 16.7 -0.4 0.0 0.1 8.3 13.3 8.3
3 -1.2 4.2 0.3 16.7 -2.0 8.3 2.0 8.3 -3.7 4.2 5.6 0.0
4 0.4 0.0 1.2 25.0 5.6 50.0 7.5 70.8 0.1 0.0 4.9 4.2
5 -0.4 12.5 0.3 25.0 . . . . -1.5 25.0 -1.0 8.3
6 -0.2 12.5 -1.4 41.7 . . . . -75.0 83.3 -20.8 29.2
7 -1.2 12.5 -1.4 4.2 . . . . . . . .
8 -2.8 33.3 -2.3 0.0 . . . . . . . .
9 -0.3 0.0 1.2 0.0 . . . . . . . .
10 -7.7 8.3 -13.9 8.3 . . . . . . . .
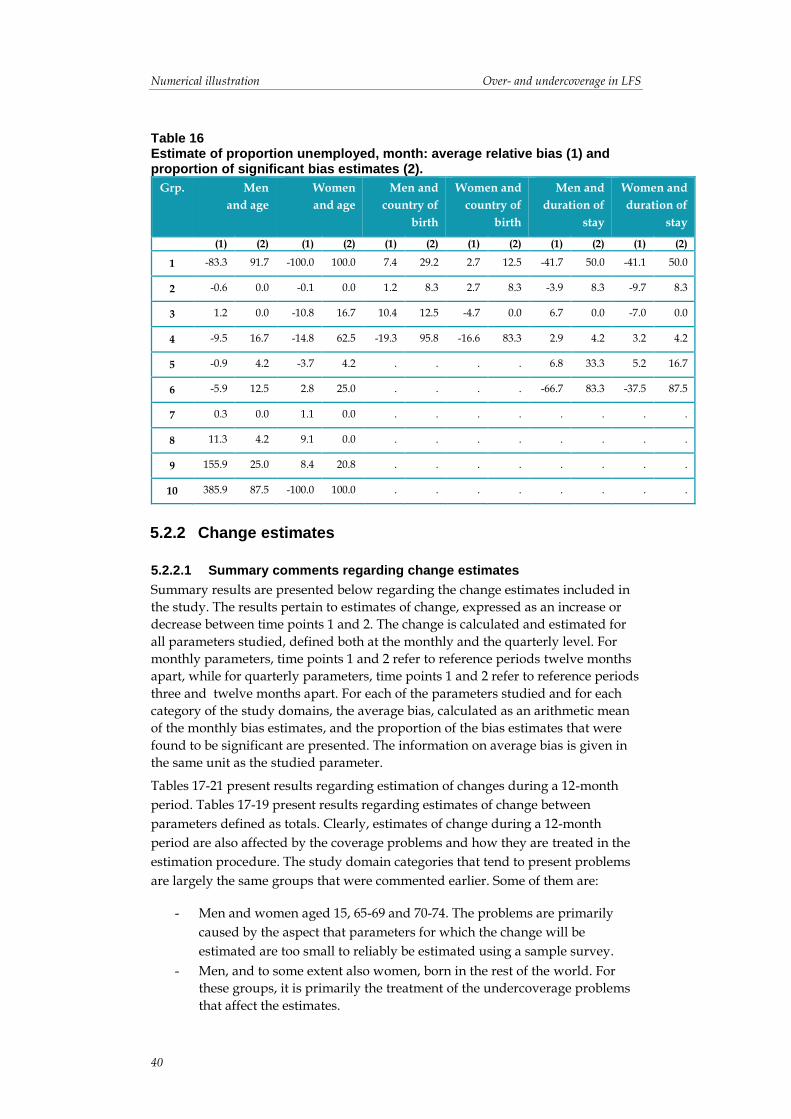
Numerical illustration Over- and undercoverage in LFS
40
Table 16 Estimate of proportion unemployed, month: average relative bias (1) and proportion of significant bias estimates (2).
Grp. Men
and age
Women
and age
Men and
country of
birth
Women and
country of
birth
Men and
duration of
stay
Women and
duration of
stay
(1) (2) (1) (2) (1) (2) (1) (2) (1) (2) (1) (2)
1 -83.3 91.7 -100.0 100.0 7.4 29.2 2.7 12.5 -41.7 50.0 -41.1 50.0
2 -0.6 0.0 -0.1 0.0 1.2 8.3 2.7 8.3 -3.9 8.3 -9.7 8.3
3 1.2 0.0 -10.8 16.7 10.4 12.5 -4.7 0.0 6.7 0.0 -7.0 0.0
4 -9.5 16.7 -14.8 62.5 -19.3 95.8 -16.6 83.3 2.9 4.2 3.2 4.2
5 -0.9 4.2 -3.7 4.2 . . . . 6.8 33.3 5.2 16.7
6 -5.9 12.5 2.8 25.0 . . . . -66.7 83.3 -37.5 87.5
7 0.3 0.0 1.1 0.0 . . . . . . . .
8 11.3 4.2 9.1 0.0 . . . . . . . .
9 155.9 25.0 8.4 20.8 . . . . . . . .
10 385.9 87.5 -100.0 100.0 . . . . . . . .
5.2.2 Change estimates
5.2.2.1 Summary comments regarding change estimates
Summary results are presented below regarding the change estimates included in
the study. The results pertain to estimates of change, expressed as an increase or
decrease between time points 1 and 2. The change is calculated and estimated for
all parameters studied, defined both at the monthly and the quarterly level. For
monthly parameters, time points 1 and 2 refer to reference periods twelve months
apart, while for quarterly parameters, time points 1 and 2 refer to reference periods
three and twelve months apart. For each of the parameters studied and for each
category of the study domains, the average bias, calculated as an arithmetic mean
of the monthly bias estimates, and the proportion of the bias estimates that were
found to be significant are presented. The information on average bias is given in
the same unit as the studied parameter.
Tables 17-21 present results regarding estimation of changes during a 12-month
period. Tables 17-19 present results regarding estimates of change between
parameters defined as totals. Clearly, estimates of change during a 12-month
period are also affected by the coverage problems and how they are treated in the
estimation procedure. The study domain categories that tend to present problems
are largely the same groups that were commented earlier. Some of them are:
- Men and women aged 15, 65-69 and 70-74. The problems are primarily
caused by the aspect that parameters for which the change will be
estimated are too small to reliably be estimated using a sample survey.
- Men, and to some extent also women, born in the rest of the world. For
these groups, it is primarily the treatment of the undercoverage problems
that affect the estimates.

Over- and undercoverage in LFS Numerical illustration
41
- Men and women born abroad with a short duration of stay (1 year or less)
and those for whom we lack information on the duration of stay. For the
former group the problem is directly linked to the undercoverage
problems, while for the latter group it is mainly about the aspect that the
parameters for which the change will be estimated are too small to be
reliably estimated using a sample survey.
Tables 20-21 essentially present a similar picture for change estimates regarding
parameters defined as ratios.
Table 17 Change estimate of number of persons, 12-month distance, month: average bias (1) and proportion of significant bias estimates (2).
Grp. Men
and age
Women
and age
Men and
country of
birth
Women and
country of
birth
Men and
duration of
stay
Women and
duration of
stay
(1) (2) (1) (2) (1) (2) (1) (2) (1) (2) (1) (2)
1 -13.2 100.0 -13.2 100.0 6,666.4 0.0 -6,779.2 0.0 -3,885.9 83.3 -1,556.8 58.3
2 -90.1 100.0 -79.9 100.0 -1,432.8 0.0 859.7 0.0 -3,197.9 50.0 -1,602.7 33.3
3 -414.1 100.0 -284.6 100.0 -4,144.5 0.0 4,851.1 8.3 599.7 0.0 -3,734.9 41.7
4 -2,333.4 100.0 -1,425.1 100.0 -4,357.3 0.0 -949.3 0.0 851.4 25.0 809.6 8.3
5 -494.3 100.0 -261.7 100.0 . . . . -5,248.2 0.0 10,579.3 0.0
6 -97.3 100.0 -52.7 100.0 . . . . 946.2 16.7 267.1 8.3
7 78.8 100.0 10.2 100.0 . . . . . . . .
8 113.0 100.0 48.9 100.0 . . . . . . . .
9 -60.5 100.0 -27.9 100.0 . . . . . . . .
10 42.8 100.0 68.3 100.0 . . . . . . . .

Numerical illustration Over- and undercoverage in LFS
42
Table 18 Change estimate of number of persons employed, 12-month distance, month: average bias (1) and proportion of significant bias estimates (2).
Grp. Men
and age
Women
and age
Men and
country of
birth
Women and
country of
birth
Men and
duration of
stay
Women and
duration of
stay
(1) (2) (1) (2) (1) (2) (1) (2) (1) (2) (1) (2)
1 207.4 33.3 -335.1 50.0 -4,864.8 8.3 -17,304.4 8.3 -1,176.1 50.0 -454.1 58.3
2 36.0 0.0 751.6 0.0 -2,052.6 16.7 -241.3 0.0 -448.2 16.7 -1,188.5 25.0
3 -386.7 0.0 -1,111.0 8.3 -3,890.6 25.0 3,292.3 0.0 -1,187.5 0.0 -967.3 16.7
4 -2,391.4 0.0 -4,096.0 8.3 2,983.4 8.3 3,978.4 8.3 -151.1 0.0 -59.7 0.0
5 -5,920.1 16.7 -1,242.5 0.0 . . . . 2.3 8.3 9,698.4 16.7
6 174.6 25.0 -297.3 8.3 . . . . 0.8 50.0 0.6 41.7
7 1,126.6 0.0 103.2 0.0 . . . . . . . .
8 -1,749.4 0.0 -117.3 0.0 . . . . . . . .
9 3,029.8 0.0 -4,057.2 0.0 . . . . . . . .
10 -1,951.5 0.0 126.5 0.0 . . . . . . . .
Table 19 Change estimate of number of persons unemployed, 12-month distance, month: average bias (1) and proportion of significant bias estimates (2).
Grp. Men
and age
Women
and age
Men and
country of
birth
Women and
country of
birth
Men and
duration of
stay
Women and
duration of
stay
(1) (2) (1) (2) (1) (2) (1) (2) (1) (2) (1) (2)
1 -1.8 83.3 -0.2 50.0 1,714.5 0.0 727.8 0.0 -1,094.4 58.3 -1,090.5 50.0
2 -778.5 0.0 -150.8 16.7 -403.9 8.3 -36.9 0.0 -2,419.8 41.7 -15.6 0.0
3 -1,629.8 25.0 -795.9 0.0 404.7 0.0 -1,434.5 0.0 457.7 0.0 -1,050.6 8.3
4 -1,396.7 8.3 -2,159.3 0.0 -5,837.4 41.7 -2,565.8 0.0 -204.5 8.3 -177.3 0.0
5 1,016.8 0.0 2,031.7 0.0 . . . . -2,577.0 8.3 -1,702.5 0.0
6 -406.8 0.0 -416.1 0.0 . . . . 1.4 91.7 -0.5 33.3
7 101.1 0.0 -1,585.3 0.0 . . . . . . . .
8 -570.3 0.0 -171.3 0.0 . . . . . . . .
9 -312.2 25.0 -62.0 33.3 . . . . . . . .
10 -143.9 75.0 -0.2 58.3 . . . . . . . .
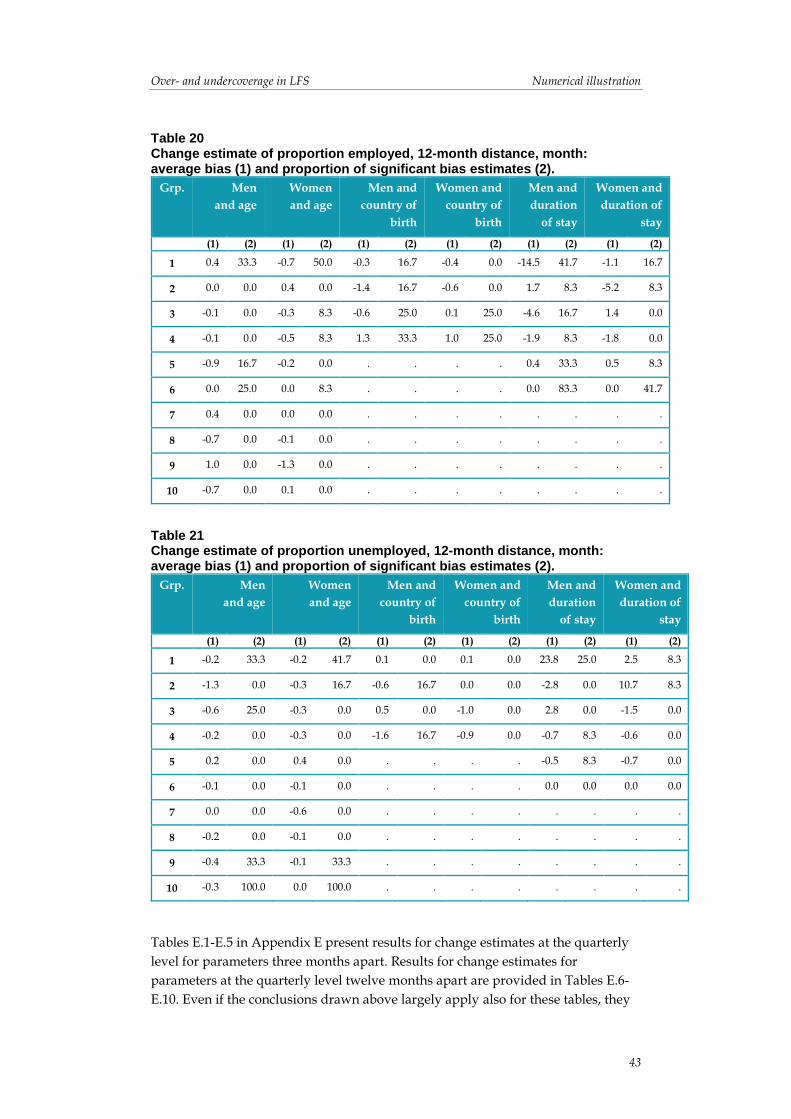
Over- and undercoverage in LFS Numerical illustration
43
Table 20 Change estimate of proportion employed, 12-month distance, month: average bias (1) and proportion of significant bias estimates (2).
Grp. Men
and age
Women
and age
Men and
country of
birth
Women and
country of
birth
Men and
duration
of stay
Women and
duration of
stay
(1) (2) (1) (2) (1) (2) (1) (2) (1) (2) (1) (2)
1 0.4 33.3 -0.7 50.0 -0.3 16.7 -0.4 0.0 -14.5 41.7 -1.1 16.7
2 0.0 0.0 0.4 0.0 -1.4 16.7 -0.6 0.0 1.7 8.3 -5.2 8.3
3 -0.1 0.0 -0.3 8.3 -0.6 25.0 0.1 25.0 -4.6 16.7 1.4 0.0
4 -0.1 0.0 -0.5 8.3 1.3 33.3 1.0 25.0 -1.9 8.3 -1.8 0.0
5 -0.9 16.7 -0.2 0.0 . . . . 0.4 33.3 0.5 8.3
6 0.0 25.0 0.0 8.3 . . . . 0.0 83.3 0.0 41.7
7 0.4 0.0 0.0 0.0 . . . . . . . .
8 -0.7 0.0 -0.1 0.0 . . . . . . . .
9 1.0 0.0 -1.3 0.0 . . . . . . . .
10 -0.7 0.0 0.1 0.0 . . . . . . . .
Table 21 Change estimate of proportion unemployed, 12-month distance, month: average bias (1) and proportion of significant bias estimates (2).
Grp. Men
and age
Women
and age
Men and
country of
birth
Women and
country of
birth
Men and
duration
of stay
Women and
duration of
stay
(1) (2) (1) (2) (1) (2) (1) (2) (1) (2) (1) (2)
1 -0.2 33.3 -0.2 41.7 0.1 0.0 0.1 0.0 23.8 25.0 2.5 8.3
2 -1.3 0.0 -0.3 16.7 -0.6 16.7 0.0 0.0 -2.8 0.0 10.7 8.3
3 -0.6 25.0 -0.3 0.0 0.5 0.0 -1.0 0.0 2.8 0.0 -1.5 0.0
4 -0.2 0.0 -0.3 0.0 -1.6 16.7 -0.9 0.0 -0.7 8.3 -0.6 0.0
5 0.2 0.0 0.4 0.0 . . . . -0.5 8.3 -0.7 0.0
6 -0.1 0.0 -0.1 0.0 . . . . 0.0 0.0 0.0 0.0
7 0.0 0.0 -0.6 0.0 . . . . . . . .
8 -0.2 0.0 -0.1 0.0 . . . . . . . .
9 -0.4 33.3 -0.1 33.3 . . . . . . . .
10 -0.3 100.0 0.0 100.0 . . . . . . . .
Tables E.1-E.5 in Appendix E present results for change estimates at the quarterly
level for parameters three months apart. Results for change estimates for
parameters at the quarterly level twelve months apart are provided in Tables E.6-
E.10. Even if the conclusions drawn above largely apply also for these tables, they

Numerical illustration Over- and undercoverage in LFS
44
must be interpreted with great caution. This is due to the very small number of
estimates on which the analysis is based; in Tables E.1-E.5, the results in each table
are based on seven estimates, and in Tables E.6-E.10, the results in each table are
based on four estimates!

Over- and undercoverage in LFS Concluding remarks
45
6 Concluding remarks The results presented in section 5 are based on a register study under the
assumptions of (i) full response and (ii) individuals who are incorrectly registered
being able to be identified14. Accordingly, one neither can nor should draw the
conclusion that the results are directly transferable to LFS estimates, which are
based on data collected from respondents and the accuracy of which is affected by
the combined effect of all existing sources of uncertainty. Instead of being
interpreted as absolute truths, the results should be seen as indications of the
extent to which the LFS estimates are affected by the coverage deficiencies that
exist in the LFS and their treatment in the estimation procedure.
The results of the register analysis indicate that the coverage deficiencies introduce
bias of a magnitude that cannot be expected to be negligible. The picture is not
clear, however. For some study domains, the coverage deficiencies seem to have a
relatively negligible impact on accuracy in terms of both impact on total and ratio
estimates, while the opposite is true of other study domains. Even if deviating
results exist, the overall conclusion is that the problem tends to be less prominent
in the estimation of ratios. This applies in particular to ratios for which both
numerators and denominators are estimated with estimators for which the
accuracy is affected by sampling error, a result fully in line with the theoretical
reasoning presented in section 4.3.3.
In the estimation of parameters for the reference period of a quarter, the coverage
bias tends to be around the same magnitude as for monthly estimates while the
standard error is reduced to around 1/√3 of the standard error in a monthly
estimate. This means that the coverage bias’ part of the total uncertainty is larger
for quarterly estimates.
In light of the above, it appears natural to more closely take stock and investigate
what possible measures can be implemented to reduce the problems of bias. Even
if this is not a task in this project, the work has identified two possibilities:
a) more frequent sample selection
b) alternative ways of taking over- and undercoverage into account in the
estimation procedure.
Appendix F presents the coverage properties of the monthly sample by calendar
month and time since the latest civil registration date under monthly sample
selection. The starting point is that instead of drawing one sample a year that is
then divided into 12 panels, as is the case today (see section 2.3), a new sample is
selected every month, corresponding to one of the eight panels in the LFS. The
point of departure for the table is that the panel rotating into the sample during a
calendar month is selected from a sampling frame created from TPR per the last
day of the month that transpired four months before the reference month.
Even if monthly sample selection in itself does not eliminate the undercoverage
deficiencies that the current LFS design entails, better conditions would be created
compared to the present to deal with the problems. More specifically, monthly
sample selection enables treating the undercoverage in the estimation procedure in
a manner like that proposed by Rosén and Lindén (1994). In combination, the two
14 For all individuals in the target population for the calculation of target parameters, for all individuals
in the sample in the calculation of estimates.
Concluding remarks Over- and undercoverage in LFS
46
measures would eliminate in a large part of the bias due to undercoverage. By
using an estimation procedure in line with Rosén and Lindén (1994) for the
calendar month of January, one can numerically illustrate the potential a) and b)
hold when combined. This is because the first rotation group for the reference
month of January under the current sampling procedure has the same coverage
properties that would exist under monthly sample selection.
In Appendix G, Tables G.1-G.5, results are presented for January 2014 for those
born abroad by duration of stay. Each table contains point and standard error
estimates based on the estimation procedure used today and on an alternative
estimation procedure inspired by Rosén and Lindén (1994). Tables G.1-G.3 clearly
exemplify that a) and b) in combination have a major potential to reduce bias
caused by undercoverage due to immigration when estimating parameters defined
as totals. Tables G.4-G.5 present results regarding estimation of parameters defined
as ratios between two totals. The results indicate that even if it is possible under a)
and b) in combination to design estimators with substantially less undercoverage
bias for both numerator and denominator, it is not given that this results in a
substantial improvement of the accuracy when they are used to estimate a ratio.
One can use statistical theory to argue that the alternative estimation procedure
used to produce the alternative estimates in the tables in Appendix G is likely to
come at the price of a larger sampling error for cross-sectional estimates. The larger
the problem is with undercoverage bias under the estimation procedure used
today, the larger the increase of the sampling error can be expected under the
alternative procedure.
The effect on change estimates remains to be examined, but even in this case it is
possible to argue, based on statistical theory, that the sampling error is likely to
increase. Somewhat simplified, the larger the impact of undercoverage bias on
change estimates under the present estimation procedure, the larger the increase of
sampling error can be expected under the alternative process.
Even if one refrains from changing the estimation procedure, there is at least one
distinct advantage of moving to monthly sample selection – it would ensure that
the undercoverage, in terms of which durations of stay that are covered by what
rotation groups, is the same every month.

Over- and undercoverage in LFS References
47
7 References Rosén, Bengt, and Lindén, Håkan (1994). Undersökningar med flera paneler av
stratifierade nätverksurval. Estimationsförfarande vid undertäckande paneler och överlappande urvalsstratan. Med tillämpning på HINK92-undersökningen. R&D Report 1994:2. Statistics Sweden. http://www.scb.se/H/Teori%20och%20metod/R%20and%20D%20Report%201988-2004/RnD-Report-1994-02-green.pdf
Statistics Sweden (2011). Urvals- och estimationsförfarandet i de svenska arbetskraftsundersökningarna (AKU) 2005–. Bakgrundsfakta till Arbetsmarknads- och utbildningsstatistiken 2011:6. [The Sampling and Estimation procedure in the Swedish Labour Force Surveys (LFS) 2005-. Background facts, Labour and Education Statistics 2011:6.] Statistics Sweden. http://www.scb.se/statistik/_publikationer/AM0401_2011A01_BR_AM76BR1106.pdf
Statistics Sweden (2014). Metod för estimation vid sammanslagning av urval med olika design i arbetskraftsundersökningarna. Bakgrundsfakta till Arbetsmarknads- och utbildningsstatistiken 2014:1. [Method for estimation when combining samples with different designs in the Swedish Labour Force Surveys . Background facts, Labour and Education Statistics 2014:1.] Statistics Sweden. http://www.scb.se/Statistik/_Publikationer/AM0401_2014M01_BR_AM76BR1401.pdf
Statistics Sweden (2015). Övertäckning i Registret över totalbefolkningen – en registerstudie. Bakgrundsfakta Befolkning och välfärd 2015:1. [Overcoverage in the Total Population Register – a register study. Background facts, Population and Welfare 2015:1.] Statistics Sweden. http://www.scb.se/Statistik/_Publikationer/OV9999_2015A01_BR_BE96BR1501.pdf
Särndal, C. E., and, Lundström, S. (2005). Estimation in Surveys with Nonresponse.
John Wiley & sons, Chichester, UK.
Särndal, C. E., Swensson, B., and Wretman, J. (1992). Model Assisted Survey
Sampling. Springer-Verlag, New York.
Ängsved, M. (2006). Contributions to finite population estimation under frame
imperfections and nonresponse. Academic essay, Örebro Studies in statistics 3.
Örebro University.
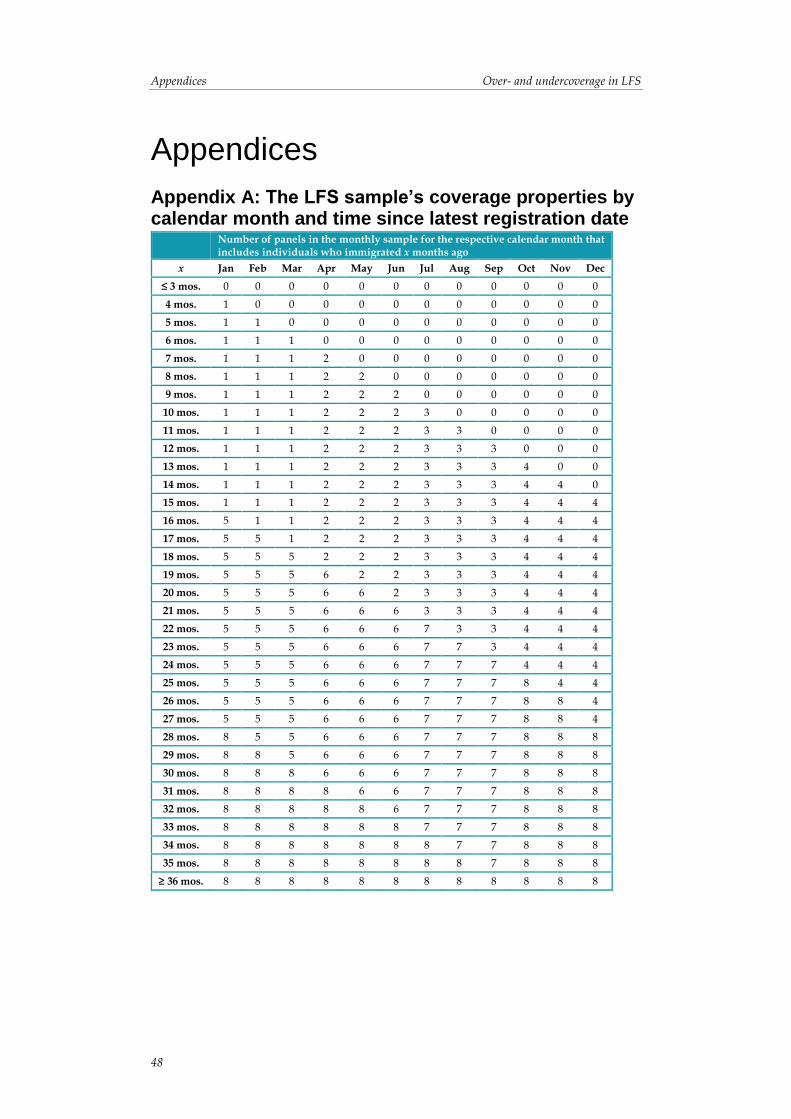
Appendices Over- and undercoverage in LFS
48
Appendices
Appendix A: The LFS sample’s coverage properties by calendar month and time since latest registration date
Number of panels in the monthly sample for the respective calendar month that includes individuals who immigrated x months ago
x Jan Feb Mar Apr May Jun Jul Aug Sep Oct Nov Dec
≤ 3 mos. 0 0 0 0 0 0 0 0 0 0 0 0
4 mos. 1 0 0 0 0 0 0 0 0 0 0 0
5 mos. 1 1 0 0 0 0 0 0 0 0 0 0
6 mos. 1 1 1 0 0 0 0 0 0 0 0 0
7 mos. 1 1 1 2 0 0 0 0 0 0 0 0
8 mos. 1 1 1 2 2 0 0 0 0 0 0 0
9 mos. 1 1 1 2 2 2 0 0 0 0 0 0
10 mos. 1 1 1 2 2 2 3 0 0 0 0 0
11 mos. 1 1 1 2 2 2 3 3 0 0 0 0
12 mos. 1 1 1 2 2 2 3 3 3 0 0 0
13 mos. 1 1 1 2 2 2 3 3 3 4 0 0
14 mos. 1 1 1 2 2 2 3 3 3 4 4 0
15 mos. 1 1 1 2 2 2 3 3 3 4 4 4
16 mos. 5 1 1 2 2 2 3 3 3 4 4 4
17 mos. 5 5 1 2 2 2 3 3 3 4 4 4
18 mos. 5 5 5 2 2 2 3 3 3 4 4 4
19 mos. 5 5 5 6 2 2 3 3 3 4 4 4
20 mos. 5 5 5 6 6 2 3 3 3 4 4 4
21 mos. 5 5 5 6 6 6 3 3 3 4 4 4
22 mos. 5 5 5 6 6 6 7 3 3 4 4 4
23 mos. 5 5 5 6 6 6 7 7 3 4 4 4
24 mos. 5 5 5 6 6 6 7 7 7 4 4 4
25 mos. 5 5 5 6 6 6 7 7 7 8 4 4
26 mos. 5 5 5 6 6 6 7 7 7 8 8 4
27 mos. 5 5 5 6 6 6 7 7 7 8 8 4
28 mos. 8 5 5 6 6 6 7 7 7 8 8 8
29 mos. 8 8 5 6 6 6 7 7 7 8 8 8
30 mos. 8 8 8 6 6 6 7 7 7 8 8 8
31 mos. 8 8 8 8 6 6 7 7 7 8 8 8
32 mos. 8 8 8 8 8 6 7 7 7 8 8 8
33 mos. 8 8 8 8 8 8 7 7 7 8 8 8
34 mos. 8 8 8 8 8 8 8 7 7 8 8 8
35 mos. 8 8 8 8 8 8 8 8 7 8 8 8
≥ 36 mos. 8 8 8 8 8 8 8 8 8 8 8 8

Over- and undercoverage in LFS Appendices
49
Appendix B: Schematic description of LFS’ estimation process upon full response Every month, the monthly sample of the LFS comprises a total of 16 panels, of
which eight are linked to the so-called ordinary sample and eight are linked to the
so-called supplementary sample (see section 2.3.1 for more information). To
facilitate the presentation somewhat, the description below is solely based on the
ordinary sample, but the simplification has no significant impact on the main
results conveyed.
Let vs , 8,...,2,1v , denote the panels for which data are to be collected in month i .
Also let )(iy denote the survey variable15 that is of interest at that time point and
let )(ix denote the auxiliary vector that is used in the estimation regarding i , and
let )(i
ky and )(i
kx denote the fix values the variables assume for individual k .
Lastly, for vsk , 8,...,2,1v , let vkd denote the design weight, adjusted for
overcoverage in categories (i)-(iii) (see section 3.1), and let vkb denote the
predetermined weight that is used to weigh together the panels (see Statistics
Sweden, 2014, for more information).
A somewhat simplified expression for the estimator that would be used under full
response is provided by
)(
,
)(
,
)()(
,
)( ˆ)ˆ(ˆˆ i
sy
i
s
ii
sy
i
y FTFTFTtt xxx Btt
where
8
1
)()(
,
,8
1ˆ
v sk
i
kvk
i
sy
vFT
FTydt
8
1
)()(
,
,8
1ˆ
v sk
i
kvk
i
s
vFT
FTd xtx
and
8
1
)()(18
1
)()()(
,
,,8
1]
8
1[ˆ
v sk
i
k
i
kvk
v sk
i
k
i
kvk
i
sy
vFTvFT
FTydd xxxBx (B.1)
where vFTs , denotes the subset of the sample vs that belongs to both frame
population (F for frame) and the target population (T for target). Since the set vFTs ,
15 In practice, there are of course several survey variables, but one is enough for the presentation in this
appendix.

Appendices Over- and undercoverage in LFS
50
does not contain any overcoverage objects, it is assumed that all individuals in vs
that constitute overcoverage due to incorrect registration are identified in
connection with the data collection.
As mentioned in section 4.2, the auxiliary totals included in the vector )(i
xt are
obtained by summing the auxiliary vector for all individuals
- who were included in TPR on the last day of the calendar month before the
reference month,
- who at the beginning of the reference month had turned at least 15 years,
- who at the end of the reference month had not yet turned 75 years.
Let )( iU denote the set of individuals who contributed in the calculation of
)(i
xt , i.e.
)(
)()(
iUk
i
k
i
xtx
and let )()(
,,
ii
vFT UU denote the subset comprised of individuals who both belong
to the target population for month i and belonged to the frame population for the
annual sample that the v th panel originates from. Also let )(
,,
i
vTFU
and )(
,,
i
vTFU
denote a partitioning of the set )(
,,
)( i
vFT
i UU , where )(
,,
i
vTFU
is comprised of
individuals who in relation to the target population constitute overcoverage and )(
,,
i
vTFU
are comprised of individuals who in relation to the target population
constitute undercoverage. Then, an alternative expression for the vector )(i
xt is
given by
8
1
)(
,,
8
1
)(
,,
8
1
)(
,,
)(
8
1
8
1
8
1
v
i
vTFv
i
vTFv
i
vFT
i
xxxx tttt
where
)(
,,
)()(
,,i
vFTUk
i
k
i
vFT
xtx ,
)(
,,
)()(
,,i
vTFUk
i
k
i
vTF
xtx and
)(
,,
)()(
,,i
vTFUk
i
k
i
vTF
xtx
.
Let )(iU denote the target population for month i , let )()(
,
ii
vT UUF
denote the
subset comprised of individuals who belonged to the frame population for the
annual sample that the v th panel originates from and let )(
,
)()(
,
i
vT
ii
vTFF
UUU .
Hence,
8
1
)(
,
)(
,8
1)ˆ(
v
i
vyT
i
sy FFTttE
with
)(,
)()(
,i
vFT
F
Uk
i
k
i
vyT yt and

Over- and undercoverage in LFS Appendices
51
8
1
)(
,,
)(
,8
1)ˆ(
v
i
vFT
i
sFTE xx tt
which is why
8
1
)(8
1
)(
,,
8
1
)(
,,
)(
,
)( )8
1
8
1(
8
1)ˆ(
v
i
y
v
i
vTFv
i
vTF
i
vyT
i
y FttE xxx
Btt
where )ˆ( )(
,
)( i
sy
i
y FTE xx BB . Since
8
1
)(
,
8
1
)(
,
)()()()(
8
1
8
1
)(,
)(,
)( v
i
vyT
v
i
vyT
Ul
i
l
Uk
i
k
Uk
i
k
i
yFF
ivFT
ivFT
i
ttyyyt
it is also such that an expression for the bias for )(ˆ i
yt is given by
8
1
)(
,
)()(
,,
)()(
,,
8
1
)(
,
)(8
1
)(
,,
8
1
)(
,,
)()()(
)(8
1
8
1)
8
1
8
1)ˆ()ˆ(
v
i
vyT
i
y
i
vTF
i
y
i
vTF
v
i
vyT
i
y
v
i
vTFv
i
vTF
i
y
i
y
i
y
F
F
t
tttEtB
xxxx
xxx
BtBt
Btt
(B.2)
The expression for bias reflects the total effect of the treatment of both
overcoverage due to incorrect registration and undercoverage due to immigration.
How much bias the handling of the coverage deficiencies cause clearly depends on
how well )()(
,,
)()(
,,
i
y
i
vTF
i
y
i
vTF xxxxBtBt
estimates )(
,
i
vyTF
t , 8,...,2,1v . Each of the terms
)()(
,,
i
y
i
vTF xxBt
and )()(
,,
i
y
i
vTF xxBt
can be seen as a sum of imputations of the type )()( i
y
i
k xBx
,
on an object level.
An alternative expression for the bias is given by
)ˆ()ˆ()ˆ( )()()( i
yUC
i
yOC
i
y tBtBtB
where)()(
,,
)( )ˆ( i
y
i
vTF
i
yOC tB xxBt
and )(
,
)()(
,,
)( )ˆ( i
vyT
i
y
i
vTF
i
yUCF
ttB
xxBt . The term )ˆ( )(i
yOC tB
represents the contribution to the bias due the implicit imputations which the
estimation procedure results in for objects that constitute overcoverage, while
)ˆ( )(i
yUC tB represents the contribution attributable to the treatment of
undercoverage due to immigration in the estimation procedure. The size of

Appendices Over- and undercoverage in LFS
52
)ˆ( )(i
yUC tB primarily depends on how well )()( i
y
i
k xBx
works as imputation for )(i
ky for
the individuals that in the reference month i constitute undercoverage due to
immigration.

Over- and undercoverage in LFS Appendices
53
Appendix C: Bias in the estimation of a ratio under a simple super-population model The notation in this appendix follows the notation introduced in the previous
appendix, although under the more streamlined situation that only one sample is
selected. Then
)()()(
,
)()(
,
)( )ˆ( i
yT
i
y
i
TF
i
y
i
TF
i
yF
ttB
xxxxBtBt
and
)()()(
,
)()(
,
)( )ˆ( i
zT
i
z
i
TF
i
z
i
TF
i
zF
ttB
xxxxBtBt
where
FTFT Uk
i
k
i
k
Uk
i
k
i
k
i
y y )()(1)()()( )( xxxBx
and
FTFT Uk
i
k
i
k
Uk
i
k
i
k
i
z z )()(1)()()( )( xxxBx
Assume that the population values for the variables )(iy and
)(iz can be
considered as generated by a model such that
otherwise0
domain study tobelongs individual if)(
)(
)( gkyE
i
yi
k
otherwise0
domain study tobelongs individual if)(
)(
)( gkzE
i
zi
k
where )(E represents the expected value under the model . Since the auxiliary
vector of LFS is such that a vector λ exists such that 1)( i
kxλ for all individuals,
then alternative bias expressions are given by

Appendices Over- and undercoverage in LFS
54
)()()()()()(1)()()(
,
)(
,
)( )()()]ˆ([ i
yg
i
y
Uk
i
gk
i
y
Uk
i
gk
i
gk
Uk
i
k
i
k
i
TF
i
TF
i
y
FTFTFT
tBE
λxλxxxxttxx
and
)()()()()()(1)()()(
,
)(
,
)( )()()]ˆ([ i
zg
i
z
Uk
i
gk
i
z
Uk
i
gk
i
gk
Uk
i
k
i
k
i
TF
i
TF
i
z
FTFTFT
tBE
λxλxxxxttxx
where
otherwise0
domain study tobelongs individual if)(
)( gki
ki
gk
xx
and
])()[( )()()(1)()()(
,
)(
,λxλxxxxtt
xx
FTFTFT Uk
i
gk
Uk
i
gk
i
gk
Uk
i
k
i
k
i
TF
i
TFg
In addition, it follows that )()()()( )( i
yg
i
y
Uk
i
gk
i
y
T
tE
λx and
)()()()( )( i
zg
i
z
Uk
i
gk
i
z
T
tE
λx , which in turn means that
)]ˆ([)]ˆ([ )(
)(
)(
)(
)(
)( i
zi
zg
i
zg
i
yg
i
ygi
y tRBEtRBE

Over- and undercoverage in LFS Appendices
55
Appendix D: Tables concerning level estimates Table D.1 Number of persons employed by sex and age, January 2014.
Sex and age Register
total
Estimate and margin
of error
�̂� 𝐑�̂�
Men 15 years 581 0 ±0 -581 * -100.0
16-19 years 63,686 63,356 ±6,114 -330 -0.5
20-24 years 216,853 222,757 ±8,256 5,904 2.7
25-34 years 496,314 508,388 ±9,128 12,074 * 2.4
35-44 years 546,646 557,735 ±7,640 11,089 * 2.0
45-54 years 552,792 559,789 ±7,865 6,997 1.3
55-59 years 232,652 232,632 ±6,403 -20 -0.0
60-64 years 183,373 178,444 ±7,811 -4,929 -2.7
65-69 years 83,139 74,506 ±11,349 -8,633 -10.4
70-74 years 34,958 36,222 ±9,178 1,264 3.6
Women 15 years 943 1,488 ±1,684 545 57.8
16-19 years 70,563 67,477 ±6,187 -3,086 -4.4
20-24 years 198,609 202,541 ±8,281 3,932 2.0
25-34 years 451,464 458,375 ±9,826 6,911 1.5
35-44 years 515,347 518,629 ±8,407 3,282 0.6
45-54 years 529,329 529,506 ±8,264 177 0.0
55-59 years 226,015 224,556 ±6,474 -1,459 -0.6
60-64 years 166,932 165,304 ±8,147 -1,628 -1.0
65-69 years 50,030 55,916 ±9,911 5,886 11.8
70-74 years 18,401 14,575 ±5,576 -3,826 -20.8
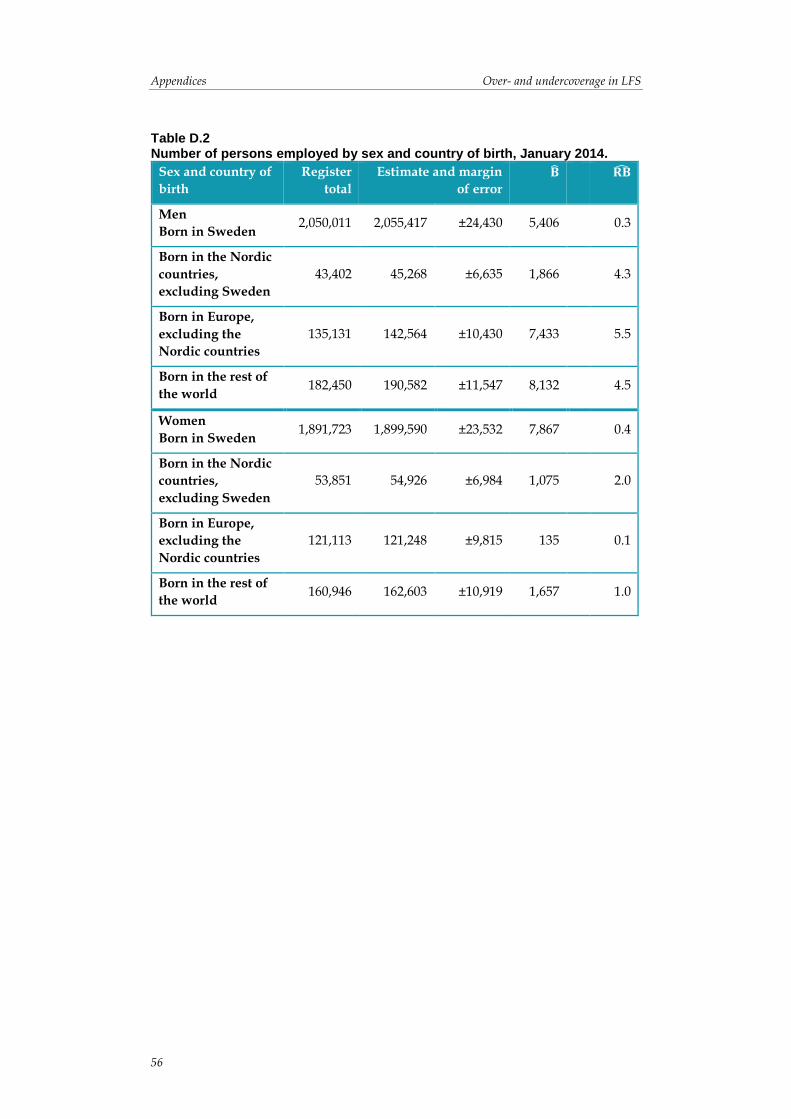
Appendices Over- and undercoverage in LFS
56
Table D.2 Number of persons employed by sex and country of birth, January 2014.
Sex and country of
birth
Register
total
Estimate and margin
of error
�̂� 𝐑�̂�
Men
Born in Sweden 2,050,011 2,055,417 ±24,430 5,406 0.3
Born in the Nordic
countries,
excluding Sweden
43,402 45,268 ±6,635 1,866 4.3
Born in Europe,
excluding the
Nordic countries
135,131 142,564 ±10,430 7,433 5.5
Born in the rest of
the world 182,450 190,582 ±11,547 8,132 4.5
Women
Born in Sweden 1,891,723 1,899,590 ±23,532 7,867 0.4
Born in the Nordic
countries,
excluding Sweden
53,851 54,926 ±6,984 1,075 2.0
Born in Europe,
excluding the
Nordic countries
121,113 121,248 ±9,815 135 0.1
Born in the rest of
the world 160,946 162,603 ±10,919 1,657 1.0

Over- and undercoverage in LFS Appendices
57
Table D.3 Number of persons employed, born abroad by sex and duration of stay, January 2014.
Sex and duration
of stay
Register
total
Estimate and margin
of error
�̂� 𝐑�̂�
Men
1 year or less 12,642 1,686 ±1,476 -10,956 * -86.7
More than 1 years,
but not longer than
2 years
14,078 9,653 ±3,388 -4,425 * -31.4
More than 2 years,
but not longer than
3 years
13,814 14,170 ±3,916 356 2.6
More than 3 years,
but not longer than
4 years
13,818 17,407 ±4,291 3,589 26.0
More than 4 years 306,623 335,497 ±15,676 28,874 * 9.4
Information on
duration of stay is
unavailable
8 0 ±0 -8 * -100.0
Women 1 year or less
6,587 1,259 ±1,242 -5,328 * -80.9
More than 1 years,
but not longer than
2 years
8,331 5,490 ±2,555 -2,841 * -34.1
More than 2 years,
but not longer than
3 years
8,820 9,034 ±3,066 214 2.4
More than 3 years,
but not longer than
4 years
9,003 11,860 ±3,546 2,857 31.7
More than 4 years 303,166 311,135 ±15,124 7,969 2.6
Information on
duration of stay is
unavailable
3 0 ±0 -3 * -100.0

Appendices Over- and undercoverage in LFS
58
Table D.4 Number of persons unemployed by sex and age, January 2014.
Sex and age Register
total
Estimate and margin
of error
�̂� 𝐑�̂�
Men 15 years
18 0 ±0 -18 * -100.0
16-19 years 11,188 10,354 ±2,834 -834 -7.5
20-24 years 23,804 25,355 ±4,608 1,551 6.5
25-34 years 33,788 34,058 ±5,217 270 0.8
35-44 years 27,094 28,180 ±4,724 1,086 4.0
45-54 years 28,937 28,928 ±4,531 -9 -0.0
55-59 years 14,644 15,380 ±3,151 736 5.0
60-64 years 8,579 9,060 ±2,334 481 5.6
65-69 years 126 607 ±942 481 381.4
70-74 years 11 0 ±0 -11 * -100.0
Women 15 years
13 0 ±0 -13 * -100.0
16-19 years 6,830 6,330 ±2,241 -500 -7.3
20-24 years 15,779 14,026 ±3,532 -1,753 -11.1
25-34 years 31,952 28,910 ±4,936 -3,042 -9.5
35-44 years 30,313 27,632 ±4,717 -2,681 -8.8
45-54 years 27,737 26,577 ±4,537 -1,160 -4.2
55-59 years 12,238 14,038 ±2,961 1,800 14.7
60-64 years 6,961 7,626 ±2,075 665 9.6
65-69 years 87 228 ±316 141 162.2
70-74 years 5 0 ±0 -5 * -100.0
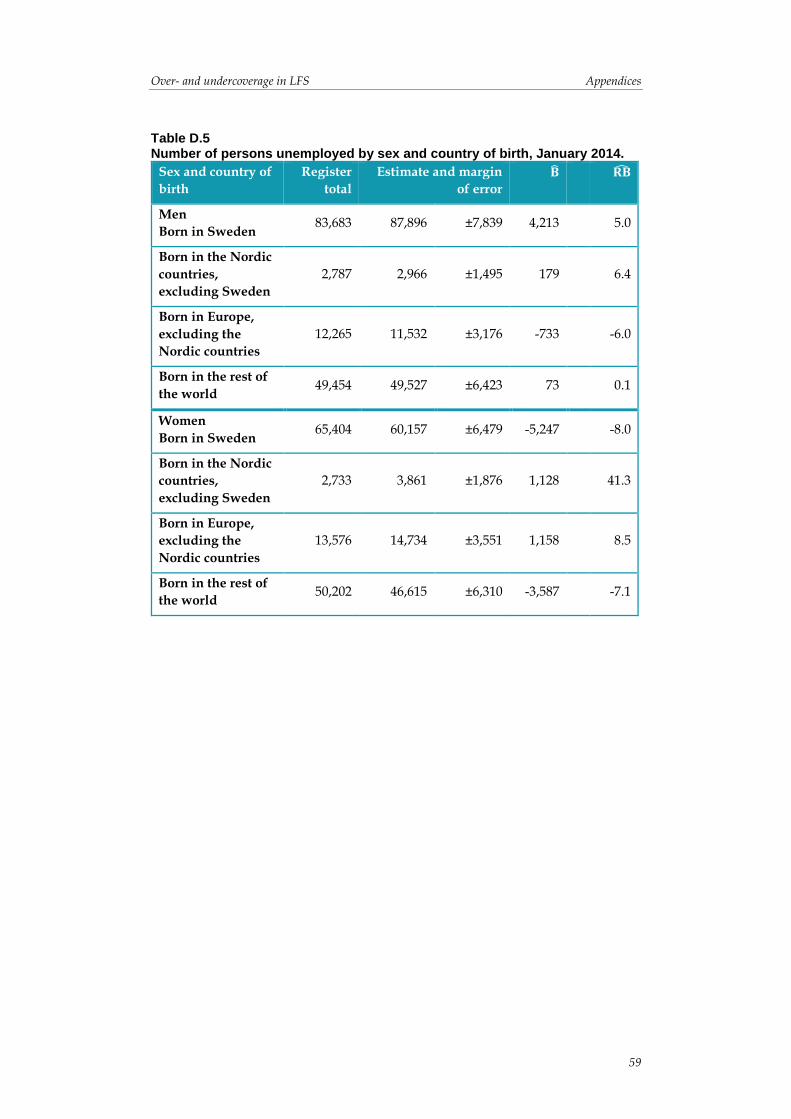
Over- and undercoverage in LFS Appendices
59
Table D.5 Number of persons unemployed by sex and country of birth, January 2014.
Sex and country of
birth
Register
total
Estimate and margin
of error
�̂� 𝐑�̂�
Men
Born in Sweden 83,683 87,896 ±7,839 4,213 5.0
Born in the Nordic
countries,
excluding Sweden
2,787 2,966 ±1,495 179 6.4
Born in Europe,
excluding the
Nordic countries
12,265 11,532 ±3,176 -733 -6.0
Born in the rest of
the world 49,454 49,527 ±6,423 73 0.1
Women
Born in Sweden 65,404 60,157 ±6,479 -5,247 -8.0
Born in the Nordic
countries,
excluding Sweden
2,733 3,861 ±1,876 1,128 41.3
Born in Europe,
excluding the
Nordic countries
13,576 14,734 ±3,551 1,158 8.5
Born in the rest of
the world 50,202 46,615 ±6,310 -3,587 -7.1

Appendices Over- and undercoverage in LFS
60
Table D.6 Number of persons unemployed, born abroad by sex and duration of stay, January 2014.
Sex and duration
of stay
Register
total
Estimate and margin
of error
�̂� 𝐑�̂�
Men
1 year or less 10,622 1,300 ±1,270 -9,322 * -87.8
More than 1 years,
but not longer than
2 years
4,901 2,177 ±1,626 -2,724 * -55.6
More than 2 years,
but not longer than
3 years
3,608 4,027 ±2,083 419 11.6
More than 3 years,
but not longer than
4 years
3,359 3,689 ±1,848 330 9.8
More than 4 years 42,013 52,833 ±6,502 10,820 * 25.8
Information on
duration of stay is
unavailable
3 0 ±0 -3 * -100.0
Women 1 year or less
10,498 324 ±634 -10,174 * -96.9
More than 1 years,
but not longer than
2 years
6,339 3,714 ±2,036 -2,625 * -41.4
More than 2 years,
but not longer than
3 years
4,144 3,187 ±1,909 -957 -23.1
More than 3 years,
but not longer than
4 years
3,724 5,686 ±2,508 1,962 52.7
More than 4 years 41,805 52,299 ±6,499 10,494 * 25.1
Information on
duration of stay is
unavailable
1 0 ±0 -1 * -100.0

Over- and undercoverage in LFS Appendices
61
Table D.7 Proportion unemployed by sex and age, January 2014.
Sex and age Register
total
Estimate and margin
of error
�̂� 𝐑�̂�
Men 15 years
3.0 0.0 ±0.0 -3.0 * -100.0
16-19 years 14.9 14.0 ±3.6 -0.9 -6.0
20-24 years 9.9 10.2 ±1.8 0.3 3.3
25-34 years 6.4 6.3 ±1.0 -0.1 -1.5
35-44 years 4.7 4.8 ±0.8 0.1 1.8
45-54 years 5.0 4.9 ±0.8 -0.1 -1.2
55-59 years 5.9 6.2 ±1.3 0.3 4.7
60-64 years 4.5 4.8 ±1.2 0.4 8.1
65-69 years 0.2 0.8 ±1.3 0.7 433.6
70-74 years 0.0 0.0 ±0.0 0.0 * -100.0
Women 15 years
1.4 0.0 ±0.0 -1.4 * -100.0
16-19 years 8.8 8.6 ±2.9 -0.2 -2.8
20-24 years 7.4 6.5 ±1.6 -0.9 -12.0
25-34 years 6.6 5.9 ±1.0 -0.7 -10.2
35-44 years 5.6 5.1 ±0.9 -0.5 -8.9
45-54 years 5.0 4.8 ±0.8 -0.2 -4.0
55-59 years 5.1 5.9 ±1.2 0.7 14.5
60-64 years 4.0 4.4 ±1.2 0.4 10.2
65-69 years 0.2 0.4 ±0.6 0.2 134.1
70-74 years 0.0 0.0 ±0.0 0.0 * -100.0
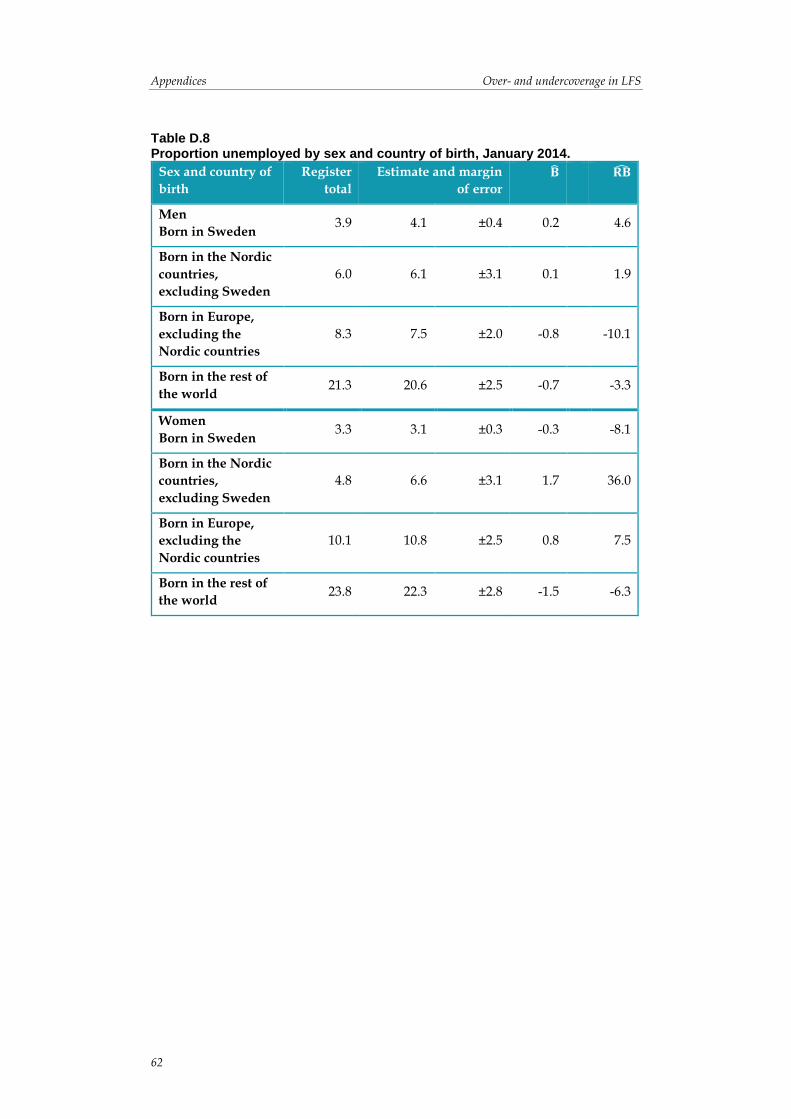
Appendices Over- and undercoverage in LFS
62
Table D.8 Proportion unemployed by sex and country of birth, January 2014.
Sex and country of
birth
Register
total
Estimate and margin
of error
�̂� 𝐑�̂�
Men
Born in Sweden 3.9 4.1 ±0.4 0.2 4.6
Born in the Nordic
countries,
excluding Sweden
6.0 6.1 ±3.1 0.1 1.9
Born in Europe,
excluding the
Nordic countries
8.3 7.5 ±2.0 -0.8 -10.1
Born in the rest of
the world 21.3 20.6 ±2.5 -0.7 -3.3
Women
Born in Sweden 3.3 3.1 ±0.3 -0.3 -8.1
Born in the Nordic
countries,
excluding Sweden
4.8 6.6 ±3.1 1.7 36.0
Born in Europe,
excluding the
Nordic countries
10.1 10.8 ±2.5 0.8 7.5
Born in the rest of
the world 23.8 22.3 ±2.8 -1.5 -6.3
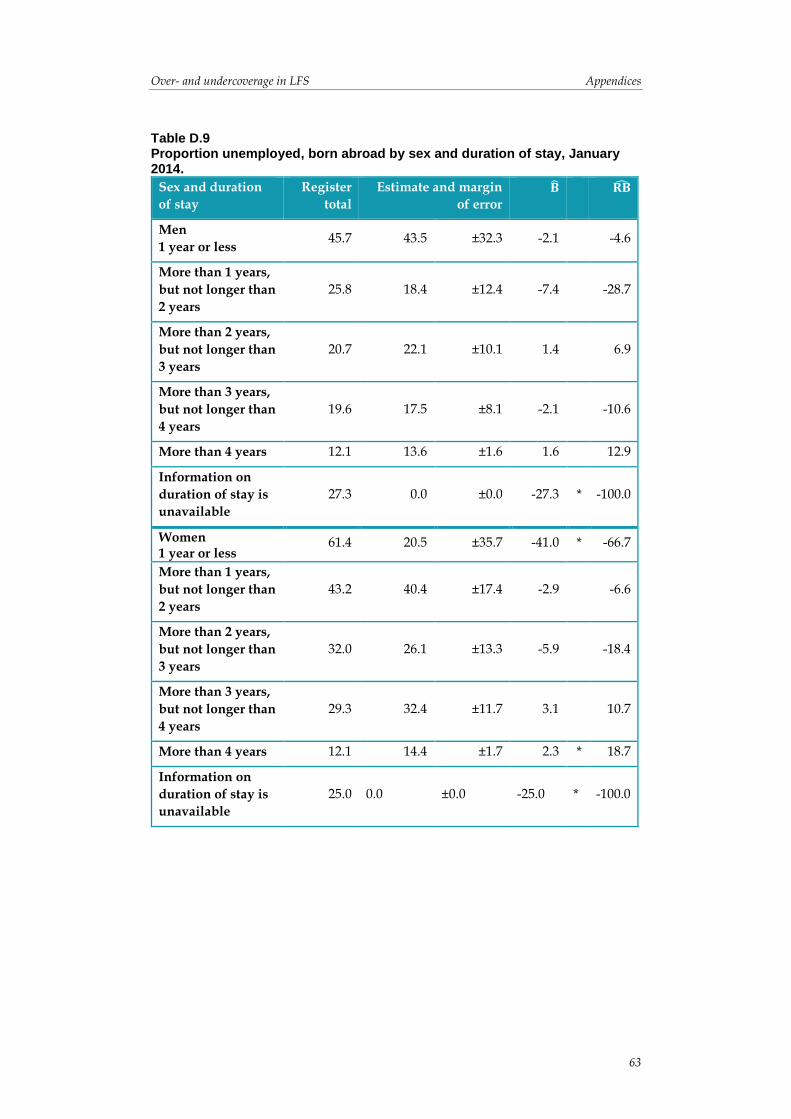
Over- and undercoverage in LFS Appendices
63
Table D.9 Proportion unemployed, born abroad by sex and duration of stay, January 2014.
Sex and duration
of stay
Register
total
Estimate and margin
of error
�̂� 𝐑�̂�
Men
1 year or less 45.7 43.5 ±32.3 -2.1 -4.6
More than 1 years,
but not longer than
2 years
25.8 18.4 ±12.4 -7.4 -28.7
More than 2 years,
but not longer than
3 years
20.7 22.1 ±10.1 1.4 6.9
More than 3 years,
but not longer than
4 years
19.6 17.5 ±8.1 -2.1 -10.6
More than 4 years 12.1 13.6 ±1.6 1.6 12.9
Information on
duration of stay is
unavailable
27.3 0.0 ±0.0 -27.3 * -100.0
Women 1 year or less
61.4 20.5 ±35.7 -41.0 * -66.7
More than 1 years,
but not longer than
2 years
43.2 40.4 ±17.4 -2.9 -6.6
More than 2 years,
but not longer than
3 years
32.0 26.1 ±13.3 -5.9 -18.4
More than 3 years,
but not longer than
4 years
29.3 32.4 ±11.7 3.1 10.7
More than 4 years 12.1 14.4 ±1.7 2.3 * 18.7
Information on
duration of stay is
unavailable
25.0 0.0 ±0.0 -25.0 * -100.0

Appendices Over- and undercoverage in LFS
64
Table D.10 Estimate of number of persons, quarter: average relative bias (1) and proportion of significant bias estimates (2).
Grp. Men
and age
Women
and age
Men and
country of
birth
Women and
country of
birth
Men and
duration of
stay
Women and
duration of
stay
(1) (2) (1) (2) (1) (2) (1) (2) (1) (2) (1) (2)
1 -0.1 100.0 -0.1 100.0 0.8 100.0 0.0 0.0 -94.3 100.0 -94.0 100.0
2 0.0 100.0 0.1 100.0 4.7 25.0 3.8 25.0 -49.7 100.0 -49.7 100.0
3 0.7 100.0 0.6 100.0 3.2 37.5 5.8 100.0 8.9 37.5 10.9 37.5
4 2.3 100.0 1.6 100.0 3.0 75.0 3.0 87.5 23.2 100.0 22.9 100.0
5 1.7 100.0 0.8 100.0 . . . . 13.3 100.0 12.0 100.0
6 1.3 100.0 0.6 100.0 . . . . 1.1 25.0 -7.3 37.5
7 1.2 100.0 0.7 100.0 . . . . . . . .
8 0.9 100.0 0.6 100.0 . . . . . . . .
9 0.4 100.0 0.4 100.0 . . . . . . . .
10 0.5 100.0 0.6 100.0 . . . . . . . .
Table D.11 Estimate of number of persons employed, quarter: average relative bias (1) and proportion of significant bias estimates (2).
Grp. Men
and age
Women
and age
Men and
country of
birth
Women and
country of
birth
Men and
duration of
stay
Women and
duration of
stay
(1) (2) (1) (2) (1) (2) (1) (2) (1) (2) (1) (2)
1 136.4 50.0 30.3 25.0 -0.2 0.0 -1.1 62.5 -94.0 100.0 -91.6 100.0
2 -0.4 0.0 -0.7 0.0 9.0 50.0 3.6 0.0 -50.1 100.0 -42.6 100.0
3 -0.7 0.0 1.1 0.0 1.3 12.5 8.0 87.5 4.7 0.0 17.2 25.0
4 2.7 100.0 2.8 100.0 8.6 100.0 10.8 100.0 23.5 62.5 29.5 87.5
5 1.2 50.0 1.1 87.5 . . . . 11.4 100.0 11.0 100.0
6 1.0 87.5 -0.8 37.5 . . . . -75.0 100.0 -25.0 50.0
7 0.0 0.0 -0.8 0.0 . . . . . . . .
8 -1.9 25.0 -1.6 12.5 . . . . . . . .
9 0.0 0.0 0.8 0.0 . . . . . . . .
10 -7.5 25.0 -13.8 50.0 . . . . . . . .
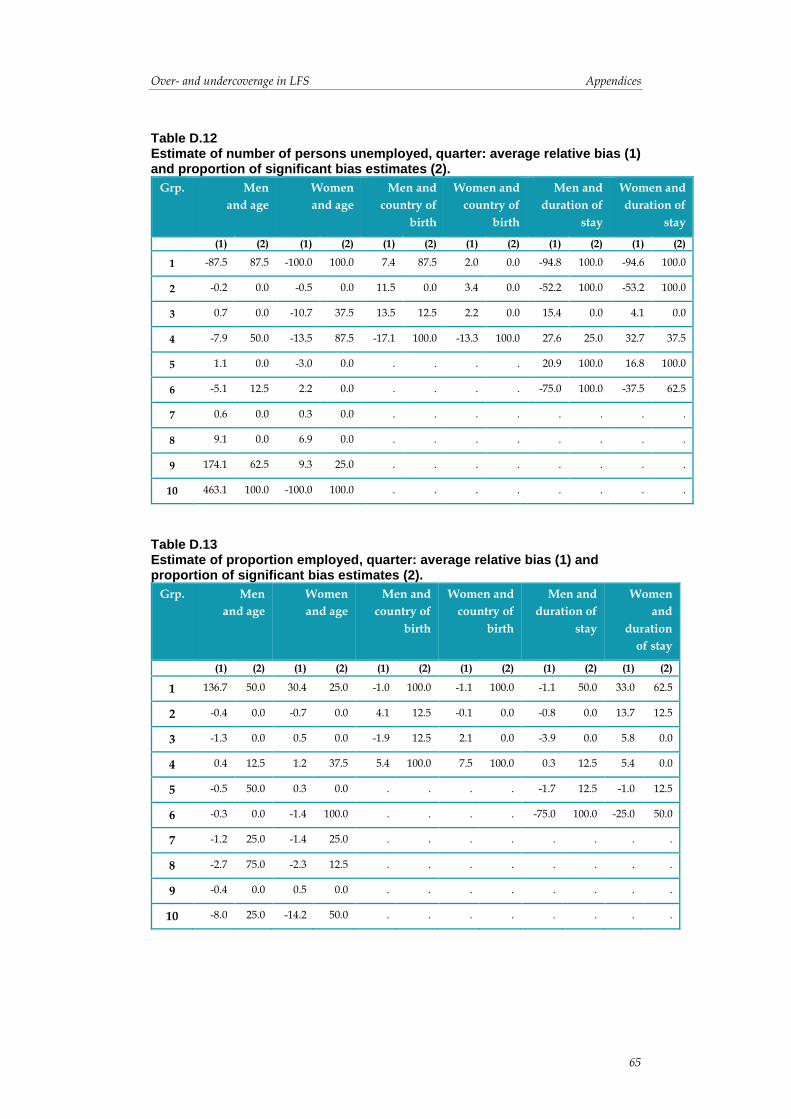
Over- and undercoverage in LFS Appendices
65
Table D.12 Estimate of number of persons unemployed, quarter: average relative bias (1) and proportion of significant bias estimates (2).
Grp. Men
and age
Women
and age
Men and
country of
birth
Women and
country of
birth
Men and
duration of
stay
Women and
duration of
stay
(1) (2) (1) (2) (1) (2) (1) (2) (1) (2) (1) (2)
1 -87.5 87.5 -100.0 100.0 7.4 87.5 2.0 0.0 -94.8 100.0 -94.6 100.0
2 -0.2 0.0 -0.5 0.0 11.5 0.0 3.4 0.0 -52.2 100.0 -53.2 100.0
3 0.7 0.0 -10.7 37.5 13.5 12.5 2.2 0.0 15.4 0.0 4.1 0.0
4 -7.9 50.0 -13.5 87.5 -17.1 100.0 -13.3 100.0 27.6 25.0 32.7 37.5
5 1.1 0.0 -3.0 0.0 . . . . 20.9 100.0 16.8 100.0
6 -5.1 12.5 2.2 0.0 . . . . -75.0 100.0 -37.5 62.5
7 0.6 0.0 0.3 0.0 . . . . . . . .
8 9.1 0.0 6.9 0.0 . . . . . . . .
9 174.1 62.5 9.3 25.0 . . . . . . . .
10 463.1 100.0 -100.0 100.0 . . . . . . . .
Table D.13 Estimate of proportion employed, quarter: average relative bias (1) and proportion of significant bias estimates (2).
Grp. Men
and age
Women
and age
Men and
country of
birth
Women and
country of
birth
Men and
duration of
stay
Women
and
duration
of stay
(1) (2) (1) (2) (1) (2) (1) (2) (1) (2) (1) (2)
1 136.7 50.0 30.4 25.0 -1.0 100.0 -1.1 100.0 -1.1 50.0 33.0 62.5
2 -0.4 0.0 -0.7 0.0 4.1 12.5 -0.1 0.0 -0.8 0.0 13.7 12.5
3 -1.3 0.0 0.5 0.0 -1.9 12.5 2.1 0.0 -3.9 0.0 5.8 0.0
4 0.4 12.5 1.2 37.5 5.4 100.0 7.5 100.0 0.3 12.5 5.4 0.0
5 -0.5 50.0 0.3 0.0 . . . . -1.7 12.5 -1.0 12.5
6 -0.3 0.0 -1.4 100.0 . . . . -75.0 100.0 -25.0 50.0
7 -1.2 25.0 -1.4 25.0 . . . . . . . .
8 -2.7 75.0 -2.3 12.5 . . . . . . . .
9 -0.4 0.0 0.5 0.0 . . . . . . . .
10 -8.0 25.0 -14.2 50.0 . . . . . . . .
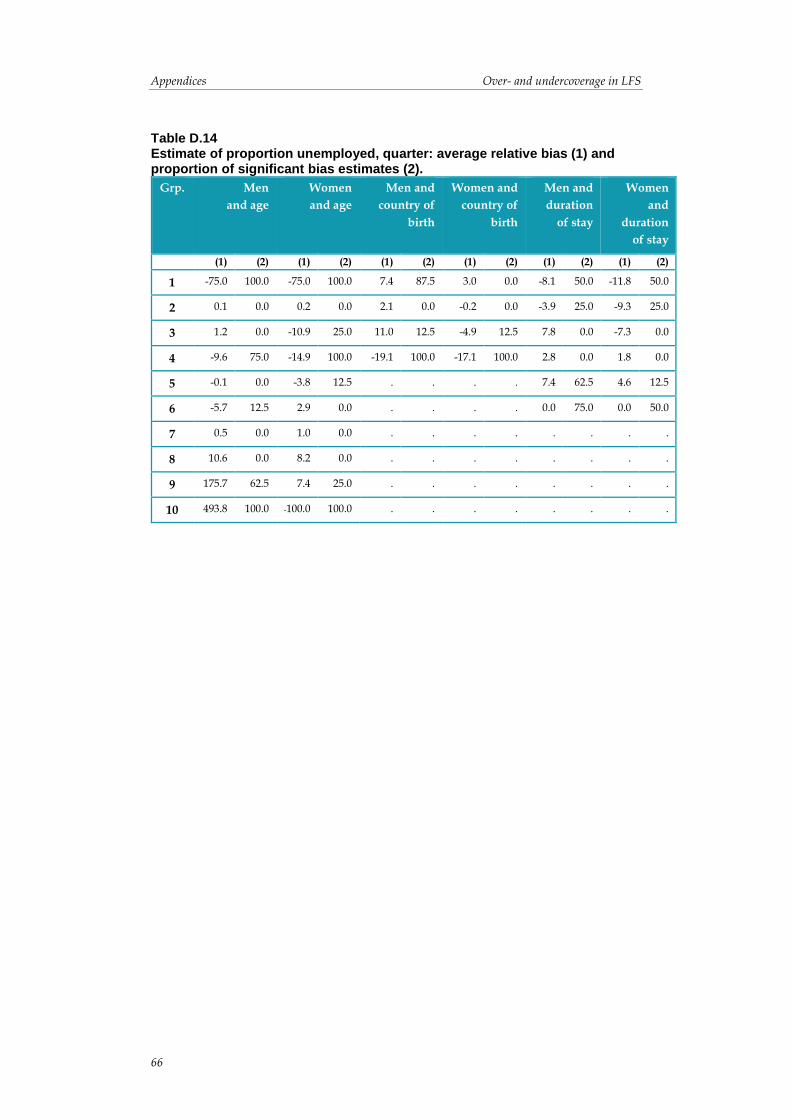
Appendices Over- and undercoverage in LFS
66
Table D.14 Estimate of proportion unemployed, quarter: average relative bias (1) and proportion of significant bias estimates (2).
Grp. Men
and age
Women
and age
Men and
country of
birth
Women and
country of
birth
Men and
duration
of stay
Women
and
duration
of stay
(1) (2) (1) (2) (1) (2) (1) (2) (1) (2) (1) (2)
1 -75.0 100.0 -75.0 100.0 7.4 87.5 3.0 0.0 -8.1 50.0 -11.8 50.0
2 0.1 0.0 0.2 0.0 2.1 0.0 -0.2 0.0 -3.9 25.0 -9.3 25.0
3 1.2 0.0 -10.9 25.0 11.0 12.5 -4.9 12.5 7.8 0.0 -7.3 0.0
4 -9.6 75.0 -14.9 100.0 -19.1 100.0 -17.1 100.0 2.8 0.0 1.8 0.0
5 -0.1 0.0 -3.8 12.5 . . . . 7.4 62.5 4.6 12.5
6 -5.7 12.5 2.9 0.0 . . . . 0.0 75.0 0.0 50.0
7 0.5 0.0 1.0 0.0 . . . . . . . .
8 10.6 0.0 8.2 0.0 . . . . . . . .
9 175.7 62.5 7.4 25.0 . . . . . . . .
10 493.8 100.0 -100.0 100.0 . . . . . . . .

Over- and undercoverage in LFS Appendices
67
Appendix E: Tables concerning change estimates Table E.1 Change estimate of number of persons, 3-month distance, quarter: average bias (1) and proportion of significant bias estimates (2).
Grp. Men
and age
Women
and age
Men and
country of
birth
Women and
country of
birth
Men and
duration of
stay
Women and
duration of
stay
(1) (2) (1) (2) (1) (2) (1) (2) (1) (2) (1) (2)
1 -4.6 100.0 -1.7 100.0 -2,540.1 14.3 2,563.4 14.3 -11.5 100.0 -319.4 85.7
2 9.5 100.0 16.7 100.0 881.2 14.3 -642.8 14.3 938.8 71.4 262.8 71.4
3 75.2 100.0 43.2 100.0 1,183.1 42.9 -1,480.6 42.9 130.0 14.3 1,882.8 57.1
4 996.2 100.0 642.2 100.0 1,879.5 14.3 416.0 0.0 -66.6 0.0 -97.1 57.1
5 280.0 100.0 153.8 100.0 . . . . 3,343.3 42.9 -3,398.9 57.1
6 51.3 100.0 24.1 100.0 . . . . 41.5 28.6 -149.0 28.6
7 -19.4 100.0 -3.2 100.0 . . . . . . . .
8 2.7 100.0 5.5 100.0 . . . . . . . .
9 27.1 100.0 6.4 100.0 . . . . . . . .
10 -14.2 100.0 -30.9 100.0 . . . . . . . .
Table E.2 Change estimate of number of persons employed, 3-month distance, quarter: average bias (1) and proportion of significant bias estimates (2).
Grp. Men
and age
Women
and age
Men and
country of
birth
Women and
country of
birth
Men and
duration of
stay
Women and
duration of
stay
(1) (2) (1) (2) (1) (2) (1) (2) (1) (2) (1) (2)
1 -88.0 85.7 103.9 28.6 2,032.2 0.0 5,815.7 57.1 723.4 71.4 350.1 85.7
2 437.7 14.3 -209.6 14.3 713.8 0.0 -61.2 0.0 105.1 28.6 696.9 28.6
3 45.1 0.0 313.4 0.0 1,443.2 28.6 -280.9 14.3 763.8 28.6 393.1 14.3
4 1957.8 42.9 2,178.8 28.6 22.4 14.3 -506.4 14.3 -60.2 14.3 226.0 0.0
5 2,291.6 57.1 495.1 0.0 . . . . 646.9 0.0 -2,514.4 28.6
6 -366.6 0.0 605.1 0.0 . . . . 0.8 57.1 0.1 42.9
7 -377.0 14.3 -73.8 0.0 . . . . . . . .
8 579.6 0.0 40.0 0.0 . . . . . . . .
9 -714.1 14.3 1,643.7 14.3 . . . . . . . .
10 445.4 0.0 -129.3 14.3 . . . . . . . .
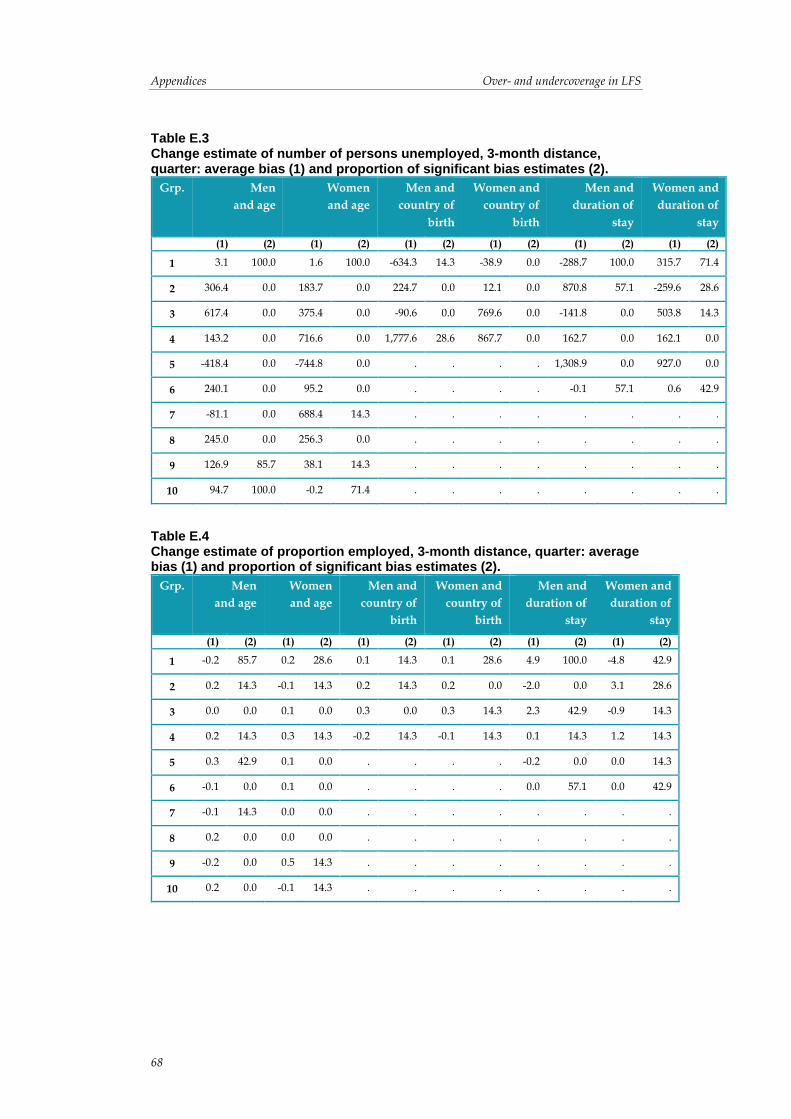
Appendices Over- and undercoverage in LFS
68
Table E.3 Change estimate of number of persons unemployed, 3-month distance, quarter: average bias (1) and proportion of significant bias estimates (2).
Grp. Men
and age
Women
and age
Men and
country of
birth
Women and
country of
birth
Men and
duration of
stay
Women and
duration of
stay
(1) (2) (1) (2) (1) (2) (1) (2) (1) (2) (1) (2)
1 3.1 100.0 1.6 100.0 -634.3 14.3 -38.9 0.0 -288.7 100.0 315.7 71.4
2 306.4 0.0 183.7 0.0 224.7 0.0 12.1 0.0 870.8 57.1 -259.6 28.6
3 617.4 0.0 375.4 0.0 -90.6 0.0 769.6 0.0 -141.8 0.0 503.8 14.3
4 143.2 0.0 716.6 0.0 1,777.6 28.6 867.7 0.0 162.7 0.0 162.1 0.0
5 -418.4 0.0 -744.8 0.0 . . . . 1,308.9 0.0 927.0 0.0
6 240.1 0.0 95.2 0.0 . . . . -0.1 57.1 0.6 42.9
7 -81.1 0.0 688.4 14.3 . . . . . . . .
8 245.0 0.0 256.3 0.0 . . . . . . . .
9 126.9 85.7 38.1 14.3 . . . . . . . .
10 94.7 100.0 -0.2 71.4 . . . . . . . .
Table E.4 Change estimate of proportion employed, 3-month distance, quarter: average bias (1) and proportion of significant bias estimates (2).
Grp. Men
and age
Women
and age
Men and
country of
birth
Women and
country of
birth
Men and
duration of
stay
Women and
duration of
stay
(1) (2) (1) (2) (1) (2) (1) (2) (1) (2) (1) (2)
1 -0.2 85.7 0.2 28.6 0.1 14.3 0.1 28.6 4.9 100.0 -4.8 42.9
2 0.2 14.3 -0.1 14.3 0.2 14.3 0.2 0.0 -2.0 0.0 3.1 28.6
3 0.0 0.0 0.1 0.0 0.3 0.0 0.3 14.3 2.3 42.9 -0.9 14.3
4 0.2 14.3 0.3 14.3 -0.2 14.3 -0.1 14.3 0.1 14.3 1.2 14.3
5 0.3 42.9 0.1 0.0 . . . . -0.2 0.0 0.0 14.3
6 -0.1 0.0 0.1 0.0 . . . . 0.0 57.1 0.0 42.9
7 -0.1 14.3 0.0 0.0 . . . . . . . .
8 0.2 0.0 0.0 0.0 . . . . . . . .
9 -0.2 0.0 0.5 14.3 . . . . . . . .
10 0.2 0.0 -0.1 14.3 . . . . . . . .
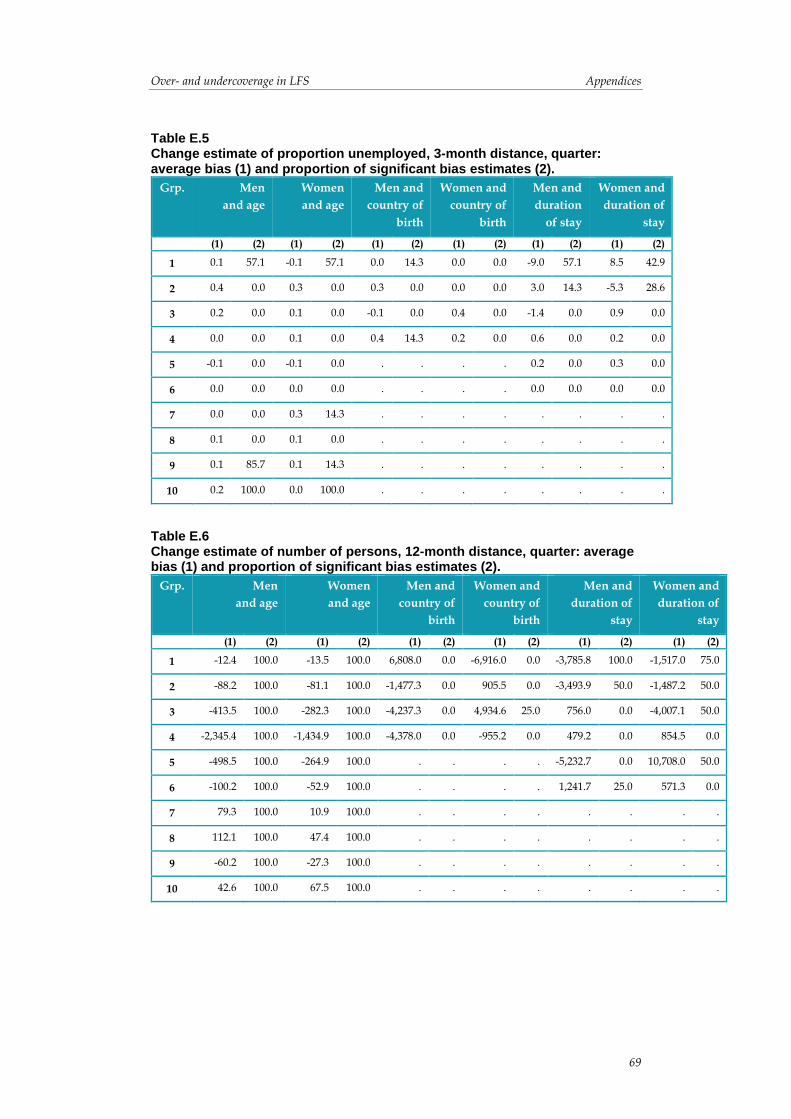
Over- and undercoverage in LFS Appendices
69
Table E.5 Change estimate of proportion unemployed, 3-month distance, quarter: average bias (1) and proportion of significant bias estimates (2).
Grp. Men
and age
Women
and age
Men and
country of
birth
Women and
country of
birth
Men and
duration
of stay
Women and
duration of
stay
(1) (2) (1) (2) (1) (2) (1) (2) (1) (2) (1) (2)
1 0.1 57.1 -0.1 57.1 0.0 14.3 0.0 0.0 -9.0 57.1 8.5 42.9
2 0.4 0.0 0.3 0.0 0.3 0.0 0.0 0.0 3.0 14.3 -5.3 28.6
3 0.2 0.0 0.1 0.0 -0.1 0.0 0.4 0.0 -1.4 0.0 0.9 0.0
4 0.0 0.0 0.1 0.0 0.4 14.3 0.2 0.0 0.6 0.0 0.2 0.0
5 -0.1 0.0 -0.1 0.0 . . . . 0.2 0.0 0.3 0.0
6 0.0 0.0 0.0 0.0 . . . . 0.0 0.0 0.0 0.0
7 0.0 0.0 0.3 14.3 . . . . . . . .
8 0.1 0.0 0.1 0.0 . . . . . . . .
9 0.1 85.7 0.1 14.3 . . . . . . . .
10 0.2 100.0 0.0 100.0 . . . . . . . .
Table E.6 Change estimate of number of persons, 12-month distance, quarter: average bias (1) and proportion of significant bias estimates (2).
Grp. Men
and age
Women
and age
Men and
country of
birth
Women and
country of
birth
Men and
duration of
stay
Women and
duration of
stay
(1) (2) (1) (2) (1) (2) (1) (2) (1) (2) (1) (2)
1 -12.4 100.0 -13.5 100.0 6,808.0 0.0 -6,916.0 0.0 -3,785.8 100.0 -1,517.0 75.0
2 -88.2 100.0 -81.1 100.0 -1,477.3 0.0 905.5 0.0 -3,493.9 50.0 -1,487.2 50.0
3 -413.5 100.0 -282.3 100.0 -4,237.3 0.0 4,934.6 25.0 756.0 0.0 -4,007.1 50.0
4 -2,345.4 100.0 -1,434.9 100.0 -4,378.0 0.0 -955.2 0.0 479.2 0.0 854.5 0.0
5 -498.5 100.0 -264.9 100.0 . . . . -5,232.7 0.0 10,708.0 50.0
6 -100.2 100.0 -52.9 100.0 . . . . 1,241.7 25.0 571.3 0.0
7 79.3 100.0 10.9 100.0 . . . . . . . .
8 112.1 100.0 47.4 100.0 . . . . . . . .
9 -60.2 100.0 -27.3 100.0 . . . . . . . .
10 42.6 100.0 67.5 100.0 . . . . . . . .
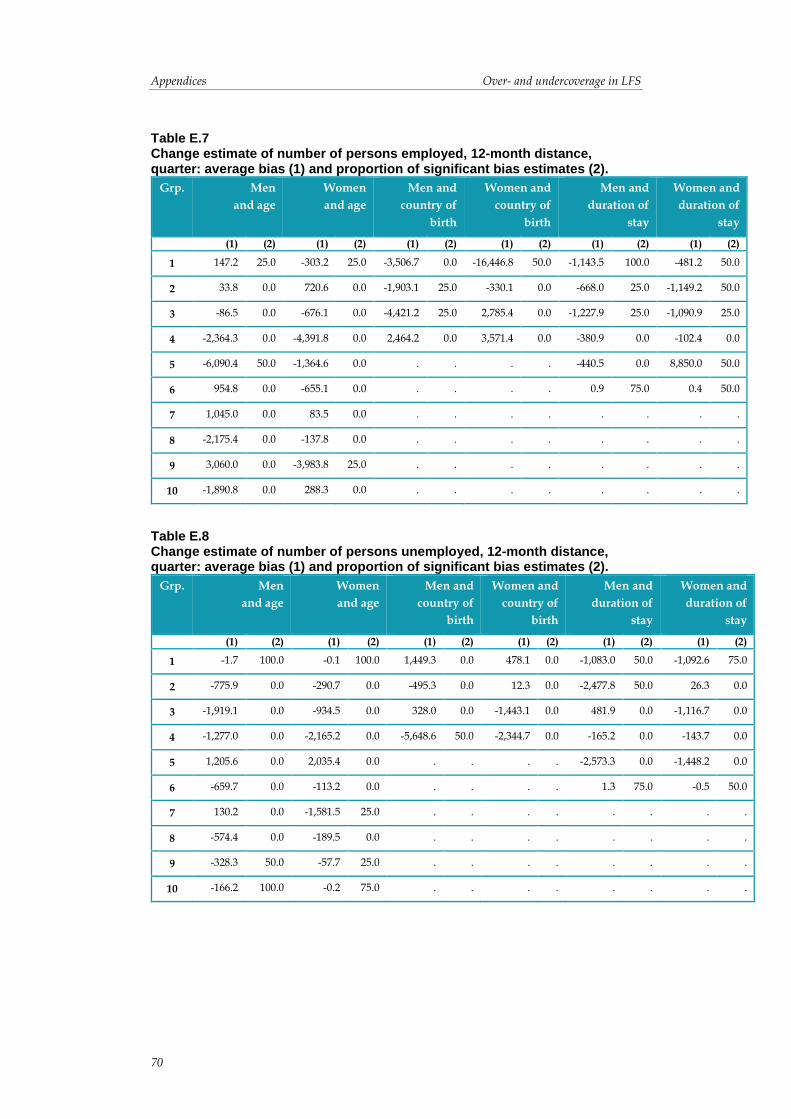
Appendices Over- and undercoverage in LFS
70
Table E.7 Change estimate of number of persons employed, 12-month distance, quarter: average bias (1) and proportion of significant bias estimates (2).
Grp. Men
and age
Women
and age
Men and
country of
birth
Women and
country of
birth
Men and
duration of
stay
Women and
duration of
stay
(1) (2) (1) (2) (1) (2) (1) (2) (1) (2) (1) (2)
1 147.2 25.0 -303.2 25.0 -3,506.7 0.0 -16,446.8 50.0 -1,143.5 100.0 -481.2 50.0
2 33.8 0.0 720.6 0.0 -1,903.1 25.0 -330.1 0.0 -668.0 25.0 -1,149.2 50.0
3 -86.5 0.0 -676.1 0.0 -4,421.2 25.0 2,785.4 0.0 -1,227.9 25.0 -1,090.9 25.0
4 -2,364.3 0.0 -4,391.8 0.0 2,464.2 0.0 3,571.4 0.0 -380.9 0.0 -102.4 0.0
5 -6,090.4 50.0 -1,364.6 0.0 . . . . -440.5 0.0 8,850.0 50.0
6 954.8 0.0 -655.1 0.0 . . . . 0.9 75.0 0.4 50.0
7 1,045.0 0.0 83.5 0.0 . . . . . . . .
8 -2,175.4 0.0 -137.8 0.0 . . . . . . . .
9 3,060.0 0.0 -3,983.8 25.0 . . . . . . . .
10 -1,890.8 0.0 288.3 0.0 . . . . . . . .
Table E.8 Change estimate of number of persons unemployed, 12-month distance, quarter: average bias (1) and proportion of significant bias estimates (2).
Grp. Men
and age
Women
and age
Men and
country of
birth
Women and
country of
birth
Men and
duration of
stay
Women and
duration of
stay
(1) (2) (1) (2) (1) (2) (1) (2) (1) (2) (1) (2)
1 -1.7 100.0 -0.1 100.0 1,449.3 0.0 478.1 0.0 -1,083.0 50.0 -1,092.6 75.0
2 -775.9 0.0 -290.7 0.0 -495.3 0.0 12.3 0.0 -2,477.8 50.0 26.3 0.0
3 -1,919.1 0.0 -934.5 0.0 328.0 0.0 -1,443.1 0.0 481.9 0.0 -1,116.7 0.0
4 -1,277.0 0.0 -2,165.2 0.0 -5,648.6 50.0 -2,344.7 0.0 -165.2 0.0 -143.7 0.0
5 1,205.6 0.0 2,035.4 0.0 . . . . -2,573.3 0.0 -1,448.2 0.0
6 -659.7 0.0 -113.2 0.0 . . . . 1.3 75.0 -0.5 50.0
7 130.2 0.0 -1,581.5 25.0 . . . . . . . .
8 -574.4 0.0 -189.5 0.0 . . . . . . . .
9 -328.3 50.0 -57.7 25.0 . . . . . . . .
10 -166.2 100.0 -0.2 75.0 . . . . . . . .

Over- and undercoverage in LFS Appendices
71
Table E.9 Change estimate of proportion employed, 12-month distance, quarter: average bias (1) and proportion of significant bias estimates (2).
Grp. Men
and age
Women
and age
Men and
country of
birth
Women and
country of
birth
Men and
duration
of stay
Women and
duration of
stay
(1) (2) (1) (2) (1) (2) (1) (2) (1) (2) (1) (2)
1 0.3 25.0 -0.6 25.0 -0.3 0.0 -0.4 25.0 -18.3 50.0 0.5 25.0
2 0.0 0.0 0.3 0.0 -1.2 25.0 -0.7 0.0 2.1 0.0 -5.0 25.0
3 0.0 0.0 -0.2 0.0 -0.8 0.0 -0.2 0.0 -5.2 25.0 1.2 0.0
4 -0.1 0.0 -0.6 0.0 1.1 25.0 0.9 0.0 -2.2 0.0 -2.2 0.0
5 -0.9 50.0 -0.2 0.0 . . . . 0.3 0.0 0.3 0.0
6 0.2 0.0 -0.1 0.0 . . . . 0.0 75.0 0.0 50.0
7 0.3 0.0 0.0 0.0 . . . . . . . .
8 -0.8 0.0 -0.1 0.0 . . . . . . . .
9 1.0 0.0 -1.3 25.0 . . . . . . . .
10 -0.7 0.0 0.2 0.0 . . . . . . . .
Table E.10 Change estimate of proportion unemployed, 12-month distance, quarter: average bias (1) and proportion of significant bias estimates (2).
Grp. Men
and age
Women
and age
Men and
country of
birth
Women and
country of
birth
Men and
duration
of stay
Women and
duration of
stay
(1) (2) (1) (2) (1) (2) (1) (2) (1) (2) (1) (2)
1 -0.8 75.0 -0.2 75.0 0.1 0.0 0.0 0.0 20.6 50.0 0.2 0.0
2 -1.3 0.0 -0.4 0.0 -0.7 0.0 0.1 0.0 -3.5 0.0 10.4 25.0
3 -0.7 0.0 -0.4 0.0 0.4 0.0 -1.0 0.0 2.9 0.0 -1.7 0.0
4 -0.2 0.0 -0.3 0.0 -1.5 25.0 -0.7 0.0 -0.3 0.0 -0.4 0.0
5 0.2 0.0 0.4 0.0 . . . . -0.5 0.0 -0.6 0.0
6 -0.1 0.0 0.0 0.0 . . . . 0.0 0.0 0.0 0.0
7 0.0 0.0 -0.6 25.0 . . . . . . . .
8 -0.2 0.0 -0.1 0.0 . . . . . . . .
9 -0.4 50.0 -0.1 25.0 . . . . . . . .
10 -0.4 100.0 0.0 100.0 . . . . . . . .

Appendices Over- and undercoverage in LFS
72
Appendix F: The LFS sample’s coverage properties by calendar month and time since latest registration date under monthly sample selection
Number of panels in the monthly sample for the respective calendar month that includes individuals who immigrated x months ago
x Jan Feb Mar Apr May Jun Jul Aug Sep Oct Nov Dec
≤ 3 mos.
0 0 0 0 0 0 0 0 0 0 0 0
4 mos.
1 1 1 1 1 1 1 1 1 1 1 1
5 mos.
1 1 1 1 1 1 1 1 1 1 1 1
6 mos.
1 1 1 1 1 1 1 1 1 1 1 1
7 mos.
2 2 2 2 2 2 2 2 2 2 2 2
8 mos.
2 2 2 2 2 2 2 2 2 2 2 2
9 mos.
2 2 2 2 2 2 2 2 2 2 2 2
10 mos.
3 3 3 3 3 3 3 3 3 3 3 3
11 mos.
3 3 3 3 3 3 3 3 3 3 3 3
12 mos.
3 3 3 3 3 3 3 3 3 3 3 3
13 mos.
4 4 4 4 4 4 4 4 4 4 4 4
14 mos.
4 4 4 4 4 4 4 4 4 4 4 4
15 mos.
4 4 4 4 4 4 4 4 4 4 4 4
16 mos.
5 5 5 5 5 5 5 5 5 5 5 5
17 mos.
5 5 5 5 5 5 5 5 5 5 5 5
18 mos.
5 5 5 5 5 5 5 5 5 5 5 5
19 mos.
6 6 6 6 6 6 6 6 6 6 6 6
20 mos.
6 6 6 6 6 6 6 6 6 6 6 6
21 mos.
6 6 6 6 6 6 6 6 6 6 6 6
22 mos.
7 7 7 7 7 7 7 7 7 7 7 7
23 mos.
7 7 7 7 7 7 7 7 7 7 7 7
24 mos.
7 7 7 7 7 7 7 7 7 7 7 7
25 mos.
8 8 8 8 8 8 8 8 8 8 8 8
26 mos.
8 8 8 8 8 8 8 8 8 8 8 8
27 mos.
8 8 8 8 8 8 8 8 8 8 8 8
≥ 28 mos.
8 8 8 8 8 8 8 8 8 8 8 8

Over- and undercoverage in LFS Appendices
73
Appendix G: Tables concerning change estimates Table G.1 Number of persons, born abroad by sex and duration of stay, January 2014.
Sex and duration
of stay
Register
total
Estimate and margin
of error
Estimate and margin
of error,
alternative approach
Men
1 year or less 33,192 3,879 ±2,183 26,774 ±14,481
More than 1 years,
but not longer than
2 years
27,638 17,187 ±4,659 38,210 ±14,324
More than 2 years,
but not longer than
3 years
24,776 25,339 ±5,253 25,860 ±5,506
More than 3 years,
but not longer than
4 years
23,778 28,466 ±5,760 26,152 ±5,375
More than 4 years 498,129 569,489 ±18,289 528,389 ±20,197
Information on
duration of stay is
unavailable
15,963 15,086 ±5,385 17,657 ±6,065
Women 1 year or less
30,475 3,009 ±1,880 21,093 ±12,810
More than 1 years,
but not longer than
2 years
26,767 18,419 ±4,663 45,152 ±14,832
More than 2 years,
but not longer than
3 years
23,322 24,539 ±5,098 25,419 ±5,457
More than 3 years,
but not longer than
4 years
22,733 27,865 ±5,422 24,777 ±4,912
More than 4 years 534,288 577,160 ±18,224 531,571 ±19,687
Information on
duration of stay is
unavailable
12,578 14,842 ±4,327 14,227 ±4,170

Appendices Over- and undercoverage in LFS
74
Table G.2 Number of persons employed, born abroad by sex and duration of stay, January 2014.
Sex and duration
of stay
Register
total
Estimate and margin
of error
Estimate and margin
of error,
alternative approach
Men
1 year or less 12,642 1,686 ±1,476 11,778 ±10,078
More than 1 years,
but not longer than
2 years
14,078 9,653 ±3,388 15,446 ±6,262
More than 2 years,
but not longer than
3 years
13,814 14,170 ±3,916 14,933 ±4,251
More than 3 years,
but not longer than
4 years
13,818 17,407 ±4,291 16,201 ±4,033
More than 4 years 306,623 335,497 ±15,676 312,662 ±16,109
Information on
duration of stay is
unavailable
8 0 ±0 0 ±0
Women 1 year or less
6,587 1,259 ±1,242 8,835 ±8,547
More than 1 years,
but not longer than
2 years
8,331 5,490 ±2,555 14,679 ±8,999
More than 2 years,
but not longer than
3 years
8,820 9,034 ±3,066 9,715 ±3,465
More than 3 years,
but not longer than
4 years
9,003 11,860 ±3,546 10,502 ±3,169
More than 4 years 303,166 311,135 ±15,124 290,327 ±15,151
Information on
duration of stay is
unavailable
3 0 ±0 0 ±0
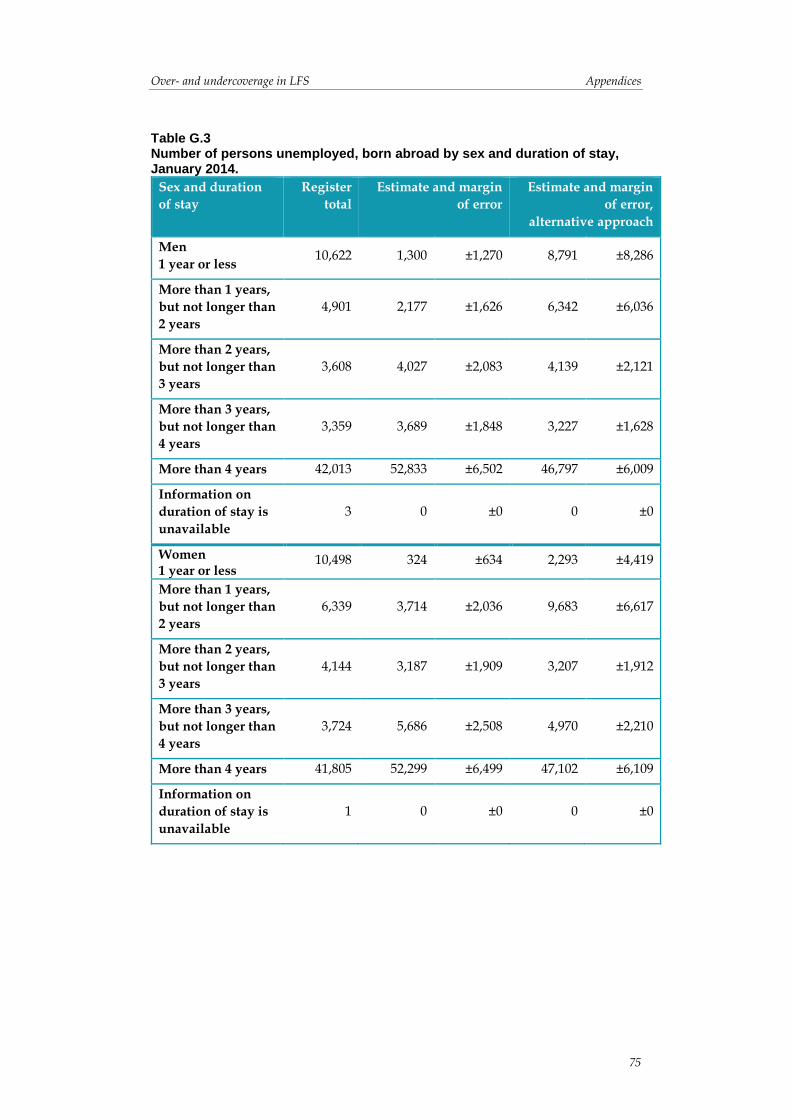
Over- and undercoverage in LFS Appendices
75
Table G.3 Number of persons unemployed, born abroad by sex and duration of stay, January 2014.
Sex and duration
of stay
Register
total
Estimate and margin
of error
Estimate and margin
of error,
alternative approach
Men
1 year or less 10,622 1,300 ±1,270 8,791 ±8,286
More than 1 years,
but not longer than
2 years
4,901 2,177 ±1,626 6,342 ±6,036
More than 2 years,
but not longer than
3 years
3,608 4,027 ±2,083 4,139 ±2,121
More than 3 years,
but not longer than
4 years
3,359 3,689 ±1,848 3,227 ±1,628
More than 4 years 42,013 52,833 ±6,502 46,797 ±6,009
Information on
duration of stay is
unavailable
3 0 ±0 0 ±0
Women 1 year or less
10,498 324 ±634 2,293 ±4,419
More than 1 years,
but not longer than
2 years
6,339 3,714 ±2,036 9,683 ±6,617
More than 2 years,
but not longer than
3 years
4,144 3,187 ±1,909 3,207 ±1,912
More than 3 years,
but not longer than
4 years
3,724 5,686 ±2,508 4,970 ±2,210
More than 4 years 41,805 52,299 ±6,499 47,102 ±6,109
Information on
duration of stay is
unavailable
1 0 ±0 0 ±0
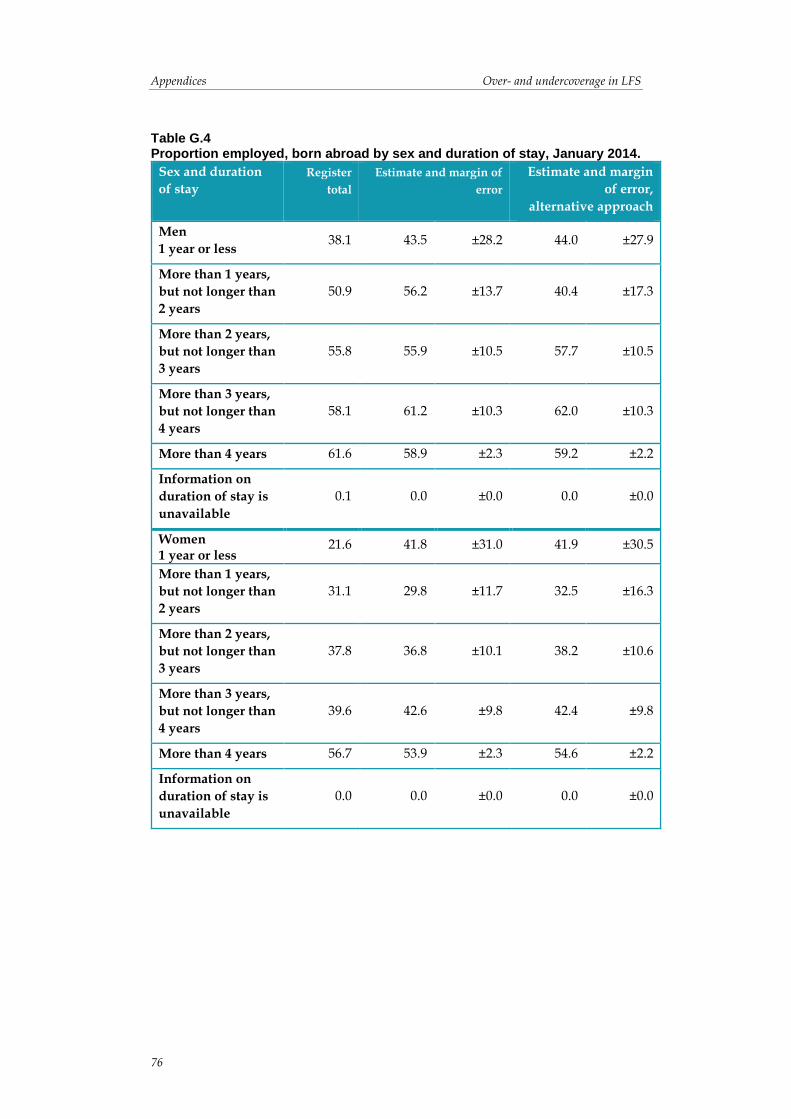
Appendices Over- and undercoverage in LFS
76
Table G.4 Proportion employed, born abroad by sex and duration of stay, January 2014.
Sex and duration
of stay
Register
total
Estimate and margin of
error
Estimate and margin
of error,
alternative approach
Men
1 year or less 38.1 43.5 ±28.2 44.0 ±27.9
More than 1 years,
but not longer than
2 years
50.9 56.2 ±13.7 40.4 ±17.3
More than 2 years,
but not longer than
3 years
55.8 55.9 ±10.5 57.7 ±10.5
More than 3 years,
but not longer than
4 years
58.1 61.2 ±10.3 62.0 ±10.3
More than 4 years 61.6 58.9 ±2.3 59.2 ±2.2
Information on
duration of stay is
unavailable
0.1 0.0 ±0.0 0.0 ±0.0
Women 1 year or less
21.6 41.8 ±31.0 41.9 ±30.5
More than 1 years,
but not longer than
2 years
31.1 29.8 ±11.7 32.5 ±16.3
More than 2 years,
but not longer than
3 years
37.8 36.8 ±10.1 38.2 ±10.6
More than 3 years,
but not longer than
4 years
39.6 42.6 ±9.8 42.4 ±9.8
More than 4 years 56.7 53.9 ±2.3 54.6 ±2.2
Information on
duration of stay is
unavailable
0.0 0.0 ±0.0 0.0 ±0.0

Over- and undercoverage in LFS Appendices
77
Table G.5 Proportion unemployed, born abroad by sex and duration of stay, January 2014.
Sex and duration
of stay
Register
total
Estimate and margin
of error
Estimate and margin
of error,
alternative approach
Men
1 year or less 45.7 43.5 ±32.3 42.7 ±31.4
More than 1 years,
but not longer than
2 years
25.8 18.4 ±12.4 29.1 ±21.5
More than 2 years,
but not longer than
3 years
20.7 22.1 ±10.1 21.7 ±10.0
More than 3 years,
but not longer than
4 years
19.6 17.5 ±8.1 16.6 ±7.8
More than 4 years 12.1 13.6 ±1.6 13.0 ±1.6
Information on
duration of stay is
unavailable
27.3 0.0 ±0.0 0.0 ±0.0
Women 1 year or less
61.4 20.5 ±35.7 20.6 ±35.4
More than 1 years,
but not longer than
2 years
43.2 40.4 ±17.4 39.7 ±22.2
More than 2 years,
but not longer than
3 years
32.0 26.1 ±13.3 24.8 ±13.0
More than 3 years,
but not longer than
4 years
29.3 32.4 ±11.7 32.1 ±11.7
More than 4 years 12.1 14.4 ±1.7 14.0 ±1.7
Information on
duration of stay is
unavailable
25.0 0.0 ±0.0 0.0 ±0.0


![Brochure Leviflow LFS Family English - Home - Levitronix ......LFS-008 LFS-04(H) LFS-08(H) LFS-20(H) LFS-50(H) LFS-80(H) Flow Range [lpm] 0 – 0.8 0 – 4 0 – 8 0 – 20 0 – 50](https://img.pdfslide.us/doc/110x75/61393aa2a4cdb41a985b916a/brochure-leviflow-lfs-family-english-home-levitronix-lfs-008-lfs-04h.jpg)


![Git LFS - acailly.github.io · $ git config --list [...] filter.lfs.clean=git-lfs clean -- %f filter.lfs.smudge=git-lfs smudge -- %f filter.lfs.process=git-lfs filter-process filter.lfs.required=true](https://img.pdfslide.us/doc/110x75/60bd0c0fa3a22721690a1c10/git-lfs-git-config-list-filterlfscleangit-lfs-clean-f-filterlfssmudgegit-lfs.jpg)