Embed Size (px)
Citation preview

Outsourcing, Inequality, and Cities
Wen-Chi Liao1
University of Minnesota
Preliminary Version
May 2005
1I am grateful to Thomas Holmes, Samuel Kortum, and Andrea Moro for valuable advices. Ithank Marcus Berliant, James Foster, Fan-Chin Kung, Paul Rothstein, and participants in theMidwest Economic Theory Meeting for helpful comments and suggestions. I also thank DanielMcMillen for kindness feedbacks. I thank Chiang Ching-Kuo Foundation for International ScholarlyExchange for financial support. E-mail: [email protected].
Abstract
Communication technology breakthroughs have made it possible to separate the proximity of certain
production tasks. For instance, lawyers and secretaries used to have to work in the same building,
but now secretaries can type a lawyer’s dictation miles away from where the lawyer works. In other
words, the secretarial job can now be ”outsourced.”
The previous literature on outsourcing has been concerned with its role in an international
context. It has examined changes in the location of jobs. From a domestic perspective, outsourcing
can have an additional affect: it can change where people live. Given lawyers and secretaries no
longer need to work in the same building, they no longer need to live in the same city either.
This paper exams how the new technologies affect where people work and where they live, on
both the empirical and theoretical fronts. Its empirical contribution is to show two facts: (i) “back
office” activity like low skill secretarial work is increasingly concentrated in small cities, while “front
office” activity like high skill managerial work is increasingly specialized in large cities; (ii) workers
without college degrees are migrating to small cities, whereas workers with degrees are moving to
large cities. The theoretical contribution of this paper is to explore how the new technologies lead
to the observed increasing geographic segregation of workers by skills in a system of cities model.
An important question addressed by the theory is how the advent of the new technologies affects
city characteristics and the welfare of skilled and unskilled individuals.
JEL: F0; R12; R13; R23
Key words: Outsourcing; segregation; inequality
1 Introduction
Communication technology breakthroughs1 in the 1990s, including the advent of the internet,
have made it possible to separate the proximity of certain production tasks. For instance,
lawyers and secretaries used to have to work in the same building, but now secretaries can
type a lawyer’s dictation miles away from where the lawyer works2. In other words, the
secretarial job can now be ”outsourced.”
The emerging literature on outsourcing has been concerned with its role in an interna-
tional context. It has examined changes in the location of jobs. From a domestic perspective,
outsourcing can have an additional effect: it can change where people live. Given that lawyers
and secretaries no longer need to work in the same building, they no longer need to live in
the same city either.
This paper examines how the new technologies affect where people work and where they
live, on both the empirical and theoretical fronts. Its empirical contribution is to show that
”back office” activity like unskilled secretarial work is increasingly concentrated in small
cities, while ”front office” activity like skilled managerial work is increasingly specialized
in large cities. Also, it presents evidence that unskilled workers are migrating to small
cities, whereas their skilled counterparts are moving to large cities. These empirical patterns
indicate increasing geographic segregation of workers by skills.
The theoretical contribution of this paper is to explore how the new technologies lead to
the observed increasing geographic segregation of workers by skills in a Henderson’s (1974)
system of cities model. An important question addressed by the theory is how the advent
of the new technologies affects city characteristics and the welfare of skilled and unskilled
individuals.
1The first all digital telephony country was born in the early 90s. From the mid 90s to the late 90s, theworld started to get online and E-mail became a major communication tool. In 1998, the first deploymentof IP telephony was announced. This technology is used by Dell Inc. for calls made to its India servicecenter, and by Ford Co. for communication between its US plants. Because of these new technologies,communication costs fell dramatically as was widely documented in the press, e.g. The Economist,
2An example is http://www.legaltypist.com/
1

In the model economy, the centripetal force that agglomerates cities is a static produc-
tion externality, e.g. knowledge spillover by Lucas (1988), that exists locally. However,
agglomeration yields congestion which is a centrifugal force. The balance of the two powers
determines the size of cities.
There are two main ingredients besides the standard system of cities framework in the
model developed here. First, it has heterogeneous agents of two skill types - skilled workers
who bring externality and unskilled workers who do not. For instance, the information
exchange between stockbrokers seems to increase the total factor productivity in Wall Street,
whereas bookkeepers may not have sufficient knowledge to comprehend market information
and share analysis with colleagues.
Second, a frictional cost is incurred if unskilled individuals work separately from their
skilled counterparts. Because the empirical part of this study focuses on the 1990s when
communication friction declined dramatically, the model assumes the cost is due to commu-
nication. Certainly, one may assume the cost is due to transportation if the concern is the
1980s. Previously, the friction was high, and having unskilled and skilled employees working
and living together in cities was the viable way to organize production. Nowadays, the low
friction makes it possible to move unskilled personnel out of cities and have them work-
ing separately from skilled workers, which is desirable because unskilled workers increase
congestion but do not aid externality.
The model implicitly assumes only face to face communication can facilitate production
externality so that the advent of communication technology will not dissolve the funda-
mental need of cities. This paper does not intend to justify this assumption, but recent
research, e.g. Brown and Liedholm (2002), does argue that for sophisticated ideas, face to
face communication is more effective than long distance communication.
The model presents striking results that are in contrast with commentators’ conjectures
on how new technology and unskilled job outsourcing would affect the economy. First, new
technology that eliminates communication friction will enlarge cities, transform them to
2

places for elites, and make them more productive. The technology does not, as presumed,
eradicate the need for big cities as production centers. Second, outsourcing is beneficial
to unskilled workers, but it can make skilled workers worse off. This finding is contrary
to the supposition that outsourcing helps skilled workers at the cost of unskilled laborers.
Moreover, instead of worsening welfare inequality, the change reduces it along with higher
aggregate welfare.
As mentioned earlier, the current literature on outsourcing is in international context.
Like my paper, Kremer and Maskin (2003) and Antras, Garicano and Rossi-Hansberg (2004)
show that new technology results in outsourcing of unskilled jobs and study the impact on
welfare. The main differences are: (i) I consider domestic outsourcing in which people can
also relocate, whereas they concern jobs to India in which people cannot move; (ii) I prove
that domestic outsourcing is beneficial to unskilled domestic workers, while they show that
international outsourcing can hurt these people.
On domestic outsourcing, the literature is just new, and a systematic analysis is waiting
for development, as pointed out by Antras and Helpman (2004). Abraham and Taylor (1996)
document a fast growing trend of domestic outsourcing. From the theoretic perspective, there
is Duranton and Puga (forthcoming) which is closest to mine. They show that: (i) When
communication friction is high, firms have managerial and production functions integrated in
the same places and cities are specialized by industry; (ii) When the friction is low, firms have
the two functions separated in different places and cities are specialized by function. In the
second case, readers can notice domestic outsourcing at the plant level. The main differences
between their paper and mine are: (i) I focus on welfare analysis by having heterogeneous
workers, while they do not touch the issue but consider industrial structural change in cities
by assuming homogeneous workers. (ii) In terms of empirical contribution, I study the new
wave of white-color job outsourcing and present geographic segregation between skilled and
unskilled workers, while they study geographic specialization of manufacturing industries
and the functions of cities. (iii) From modeling aspect, the emergence of cities in my model
3

is due to a Marshallian production externality, whereas it is due to product variety in their
work.
This paper is also different from Kremer and Maskin (1996). In particular, my model
consider geographic segregation between skilled and unskilled workers, while their work con-
cerns cross sector segregation between the two types of workers and does not have spatial
element.
The remainder of this paper is organized as follows. Section 2 presents evidences on
increasing geographic segregation between skilled and unskilled workers. Section 3 sets
up the model. Section 4 characterizes solutions and analyzes how new technology affects
segregation, city characteristics, and workers’ welfare. Section 5 concludes and discusses the
boundary of the theory.
2 The Facts
Organized in two parts, this section presents evidences that indicate increasing geographic
segregation between skilled and unskilled workers. In the first part, I consider changes in
the locations of jobs. The findings are: (i) Outsourcing of unskilled secretarial kinds of sup-
portive jobs is prevalent and is fast growing; (ii) These outsourced jobs are increasingly and
disproportionally allocated in small cities; (iii) While these jobs are increasingly concentrated
in small cities, the geographic concentration of their main users does not change; (iv) These
main users are skilled industries; (v) Even within these main users, unskilled supportive jobs
are increasingly concentrated in small cities, whereas skilled managerial jobs are increasingly
specialized in large cities. In the second part, I examine changes in the locations of people
and find that: Through cross city migration, workers without a bachelor degree are moving
from large cities to small cities whereas workers with degrees are moving in the opposite di-
rection. The sources of evidences are County Business Pattern, Public Used Micro Samples,
and Input-Output Accounts. In the appendix, details on the use of the data are provided.
4

2.1 Unskilled and Skilled Jobs Are Geographically Separated
Here, I focus on the industry of Business Support Services (NAICS 5614) and those industries
who are main users of the support services. By definition, Business Support Services perform
outsourced ongoing supportive routines, such as document preparation, telemarketing, and
customer services. The industry is unskilled because in 2000 only 17% of its employees had
a bachelor degree or more while 26% of American workers had that qualification. Due to
the new outsourcing wave of white-color unskilled jobs (part of these jobs go to India as well
known), this industry is emerging and is fast growing. Before 1997, it was unremarked and
did not have its own classification, but in 2002, it had 0.7 million employees, a figure 1.3
times as large as the industry of Air Transportation. Between 1998 and 2002, it grew twice
as fast as the US employment growth (See Table 1).
Table 2 reports the employment of Business Support Services in 1998 and 2002 by four
city size classes. The grouping criteria are: (i) Large cities are metropolitan areas with
more than two million people; (ii) Upper medium cities are metropolitan areas having a
population between one and two millions; (iii) Lower medium cities are metropolitan areas
with a population between a quarter and one million; (iv) Small cities include rural areas and
metropolitan areas with less than a quarter million people. The table shows disproportional
growth of the industry across places. During the four year period, the industry employment
increased by more than 20% in lower medium cities and in small cities, while it had virtually
no growth in upper medium and in large cities.
Table 3 presents the evolution of geographic concentration of Business Support Services
from 1998 to 2002. For each city size class (location) I calculate and report the industry
location quotient (LQ), which is the ratio of the location’s share of the industry employment
to its share of aggregate employment. A value above one means that the location is relatively
specialized in the industry; whereas a value below one shows that the location is relatively
less concentrated in the industry. If every location has a value of one, it implies that the
5
industrial activities are evenly distributed across places. The table shows consistent increase
of the industry LQ in lower medium and small cities and consistent decline in large and upper
medium cities over time. In the four year period, the LQ increased by around 14% and 18%
in lower medium cities and in small cities, whereas it decreased by about 8% and 5% in large
cities and in upper medium cities. These changes indicate that geographic concentration of
Business Support Services is moving from large cities to small cities.
To understand whether or not this new wave of unskilled job outsourcing results in
geographic separation between unskilled and skilled workers, it is important to know the
characteristics and geographic concentrations of those industries who are main users of Busi-
ness Support Services. Table 4 presents the usage of the services by industry in 1997. In
the table, industries are classified by 2 digit NAICS codes except three smaller industries
including legal services (5411) are reported separately, because they are the extremely inten-
sive user in the 2 digit classification they belong. The first nine industries used up 75% of
total intermediate supplied by Business Support Services but weighted only 38% of the US
GDP. Moreover, the nine industries all used the services intensively as indicated in column
7. Therefore, I consider these industries as the main users of the services and sometimes call
them, as a whole, the downstream sector.
Table 5 presents LQ of the main users of Business Support Services by city size class
between 1998 and 2002. The direction of changes was ambiguous for the first three classes.
In small cities, industries such as legal services (5411), information (51), and financial services
(52) had decreasing LQ. For all the main users as a whole, changes of LQ were tiny. Therefore,
the geographic concentration of the downstream sector might not change during the period.
We have seen the geographic separation between Business Support Services and the
downstream sector. If this separation can constitute geographic segregation between skilled
and unskilled workers, then the main users of the services have to be skilled industries in
general. Table 6 summarizes skill composition by industry in 2000. Except wholesale trade
and retail trade, all the main users had a much larger share of workers having a bachelor
6

degree or more comparing to the US average 26%. This skilled share was 59% in legal
services and 58% in scientific services, and the share was more than 40% in four other main
users. As a whole, the downstream sector had a skilled share of 33%, 7% higher than the
US average. Therefore, the main users are skilled industries in general.
Given that the downstream sector has created the new wave of outsourcing, it is inter-
esting to see if those white-color unskilled jobs remaining in the sector are also being sent
to small cities and being segregated from skilled jobs. If the answer is positive, then an
important evidence of increasing geographic segregation between skilled and unskilled work-
ers is found, because the downstream sector consistently weighted more than 47% of US
employment between 1998 and 2002.
To investigate, I consider managers and office and administrative supportive workers. In
the downstream sector, managers are skilled jobs because 57% of them had a bachelor degree
or more in 2000. On the other hand, supportive workers, including secretaries, customer
service representatives, typists, etc, are unskilled positions because only 15% of them had
degrees in that year. Another important reason to study supportive workers is that they
are with the highest risk to be outsourced from the downstream sector. In 2000, 48% of
employees in Business Support Services were this type of workers.
In Table 7, I calculate and report the occupation LQ. For example, the manager LQ is
the ratio of the location’s share of managers in the downstream sector to its share of total
employment in that sector. The table presents occupation LQ in 1990 and in 2000 by city
size class. From the highest to the smallest class, the manager LQ changed by about 4%,
6%, -5%, and -11% whereas the LQ of secretaries changed by around -7%, -1%, 3%, and 11%
during the decade. This indicates that the geographic concentration of skilled managerial
activities was shifting from small cities to large cities, while the concentration of unskilled
supportive activities was shifting in the opposite direction.
Table 8 presents a clear pattern of increasing geographic segregation between skilled and
unskilled workers during the period between 1990 and 2000. In 1990, one might meet 69
7
managers and 163 supportive workers by greeting one thousand employees in the downstream
sector in small cities. Ten years after, the person greeted another one thousand employees
in the sector in small cities, and she would find that she met 6 less managers and 27 more
supportive workers comparing to 1990. By doing the same experiment, one would find
that in 2000, she would meet 7 more managers and 3 less supportive workers in large cities
comparing to the result in 1990. As showed in the table, the downstream sector’s managerial
jobs moved to larger cities whereas supportive jobs in the sector moved to smaller cities
during the decade. Given that the downstream sector had about half of US employment in
2000, this is an important evidence of increasing geographic segregation between skilled and
unskilled workers.
2.2 Unskilled and Skilled People Are Geographically Separated
Here, I focus on changes in the locations of people. More precisely, it is on how people
migrate across cities. Because domestic outsourcing not only affects where jobs are located
but also has an impact on where people live, if the displacement of unskilled jobs for some
industries is strong enough in large cities, then we may also observe that large cities are losing
unskilled workers through cross city migration, even though job mobility across occupations
and industries (e.g. a secretary can be a taxi driver) may counteract the significance.
Using migration data in PUMS 2000, the evidence presented here is that unskilled workers
are migrating from large cities to small cities, whereas their skilled counterparts are migrating
in the opposite direction. By skill type (having a B.A. or not), I calculate each metropolitan
area’s in-migration and out-migration flows, between 1995 and 2000, for workers not in the
armed forces. Out-migration is subtracted out from in-migration, to get the net-migration
flow of the 5 year period. Then, I derive the net-migration rate which is the net-migration
flow as a percentage of the approximated 1995 skill specific non-armed labor force.
By skill type, I regress, for each metropolitan areas, the net migration rate against the log
city size and have the result in figure 1 and figure 2. Figure 1 presents a negative relationship
8

between the log city size and the net migration rate of workers without college degrees. It
indicates that small cities were gaining unskilled workers through cross city migration while
large cities were losing them, during the five years. Figure 2 shows a positive relationship
between the log city size and the net migration rate of workers with degrees. It indicates
that large cities were gaining skilled workers through cross city migration whereas small cities
were losing them. The coefficients and standard errors of the regressions are reported in the
figures. The results are significant at 5% level and indicate increasing geographic segregation
between skilled and unskilled workers.
3 The Model and Definitions
In the economy, competitive firms can produce tradable numeraire at a location with the
technology
Y = AF (H,M)
whereH is total ideas andM is total intermediate goods both used in producing total output
Y at the location. A is a static production externality arising from the agglomeration of
ideas at the location. Assumed
A = Hγ
For simplicity, the internal technology of firms, F (., .), is assumed Cobb-Douglas:
F (H,M) = HαM1−α
although the theory will work for CES functional forms with positive elasticity of substitu-
tion.
Ideas are made internally in firms, but intermediate goods are a composite of perfectly
9

substitutable support
M = L+ τLr
where L is total in-house support at the location and Lr is total outsourcing support done
by remote subcontractors. Remote support is subject to an iceberg cost. Only τ portion
of the remote support can survive after transmission. Therefore τ ∈ [0, 1] is the technology
level with which we are concerned. When τ = 0, outsourcing support is not possible. When
τ = 1, support can be done anywhere without a friction.
The economy has a unit measure of workers of two skill types. Let φ be the fraction of
population that is skilled. Each skilled worker generates one unit of idea, and every unskilled
worker provides one unit of support. They choose where to live and where to work, and have
linear preference over numeraire consumption. Each individual must pay rent for one unit
of residential land and must commute between home and workplace. The commuting cost
is c units of numeraire per unit of land round trip.
The economy has infinite supply of land on a real line, and has a continuum of competitive
land developers who organize cities on the line with zero sunk cost. A developer can collect
rent from its residents and may offer them transfer. Cities have a monocentric structure,
with a center point called Central Business District (CBD) as the production center and
workers’ homes lined up equally on both sides of the CBD.
Cities create congestion from commutes, although they facilitate production spillover.
Consider a city with size N population. Workers living z units away from the CBD must
pay cz commuting cost, and the city edges are N2units away from the CBD. Therefore, the
city’s total commuting cost is
Total commuting cost = 2
Z N2
0
czdz =cN2
4
This congestion cost increases exponentially with the city size.
Rural areas are the land outside cities. They are inexhaustible and are of measure zero
10

size. Thus, workers residing there pay zero rent and have jobs right next to home, and the
production spillover will be zero in rural areas.
I now proceed with definitions. For simplicity, I consider symmetric cities, following the
common practice in the literature. An allocation is a vector of five variables: (i) H is the
representative city’s total (used for citywide level from now) skilled population; (ii) L is the
city’s total unskilled population; (iii) Lr is the total number of outside unskilled workers
delivering remote support into the city; (iv) N is the city size; (v) µ is the measure of cities.
The first three variables are the production factors used in the city.
Definition 1 An optimal allocation is (H,L,Lr, N, µ) that maximizes the economy’s aggre-
gate welfare, which is aggregate output net of aggregate congestion cost, subject to feasibility
constraints.
Definition 2 A competitive equilibrium is an allocation (H,L,Lr, N, µ), a price vector (wh, wl, wlr),
and a transfer κ such that: (i) Workers maximize preference by choosing where to work and
where to live; (ii) Competitive firms maximize profit by choosing where to produce and how
much to employ; (iii) Competitive city developers maximize profit; (iv) Market clearing con-
ditions hold.
The feasibility constraints and market clearing conditions can be written as
H + L = N (1)
Hµ = φ
Lµ+ Lrµ = 1− φ
which require: (i) A city’s population is the sum of total skilled and total unskilled workers
living in the representative city; (ii) The economy’s measure of skilled workers equals the
representative city’s total skilled workers times the measure of cities; (iii) The economy’s
measure of unskilled workers equals the measure of cities times the sum of the representative
11

city’s total unskilled workers and the total rural unskilled workers delivering remote support
into the city.
The above conditions acknowledge two facts: (i) All unskilled workers providing remote
support live in rural areas; (ii) All skilled workers live in cities. The former is the result
of avoiding unnecessary congestion and rent, and the later is because skilled jobs are only
available in cities.
The last definition is about segregation:
Definition 3 The economy is completely integrated if unskilled personnel all live together
with skilled workers in cities. In such case, Lr = 0. The economy is completely segregated if
unskilled personnel all live in rural areas while skilled workers all live in cities. In this case,
L = 0. The economy is partially segregated if there are unskilled individuals in cities as well
as in rural areas.
Finally, I make four assumptions: (i) γ ∈ (0, 1); (ii) φ ≥ 2γ−(1−α)2γ
; (iii) 2γ > 1− α; (iv)
α−γ1−γ > φ. The first assumption guarantees city size will not grow explosively, the second one
assures the existence of the symmetric equilibrium, the third one is for regularity, and the
last one simply makes skilled workers obtain higher welfare than unskilled personnel.
4 Solutions and Analysis
This section analyzes how better technology affects segregation, city characteristics, and
workers’ welfare. I divide the section into three parts. In the first part, I characterize the
optimal allocation and the equilibrium at two limiting levels of technology, τ = 1 and τ = 0.
A direct comparison between solutions of the two cases illustrates key implications of the
model easily. In the second part, I discuss the solution of the general case, τ ∈ (0, 1). In the
last part, I formally state, prove, and discuss the model’s implications which apply generally.
12

4.1 Two Limiting Cases:
4.1.1 τ = 1
Optimal Allocation When τ = 1, all unskilled personnel should live and work in rural
areas, because rural unskilled workers do not create congestion but do have the same marginal
productivity as urban unskilled workers given this frictionless technology. The economy
should have complete segregation and L1 = 0, where the subscript indicates the solution
at τ = 1. The planner’s welfare optimization can be written as an unconstrained problem
in which the planer simply chooses city size (H in this case) to maximize aggregate output
minus aggregate congestion cost:
MAXH
(φHγ
µ1− φ
φ
¶1−α− φ
c
4H
)
A larger agglomeration (H) on one hand raises aggregate output, but on the other hand in-
creases aggregate congestion due to the longer average commuting distance H4of bigger cities.
Since γ < 1, there exists a unique optimal size of spillover which occurs when agglomeration
benefit weighs urban congestion at the margin.
The first order condition implies
H1 =
µ4γ
c
¶ 11−γµ1− φ
φ
¶ 1−α1−γ
(2)
The optimal allocation is characterized by H1, L1 = 0, and (1).
Not surprisingly, optimal size of agglomeration increases with γ but decreases with c.
When γ is large, marginal effect of the agglomeration on total factor productivity decays
slowly. Large agglomeration is desired. On the contrary, when c is high, commuting cost
increases drastically in distance and urban congestion outweighs agglomeration benefit easily.
Small agglomeration is preferred.
13

Competitive Equilibrium In the equilibrium, urban cost of living, the sum of rent and
commuting cost, is homogeneous everywhere within cities because citizens must be indifferent
between where to live. In a size N city,
Urban cost of living =cN
2
since workers living at the city edges pay zero rent and cN2commuting cost. Given the
homogeneous urban cost of living, workers must pay cx extra rent by living x units closer to
the CBD. Therefore, the total rent of the city is
Total rent = 2
Z N2
0
c
µN
2− z
¶dz =
cN2
4
When τ = 1, rural unskilled workers earn the same income as urban unskilled workers,
because remote support and in-house support are perfectly substitutable. Moreover, rural
unskilled workers need not pay urban cost of living. Therefore, all unskilled individuals
prefer living in rural areas, and L1 = 0.
The representative city developer maximizes profit, which is the city’s total rent less total
transfer payment. Its decision is subject to the ”no incentive to leave” constraints. That
is the developer must guarantee utility and wage levels such that production factors and
firms have no incentive to relocate. To attract skilled workers, the production factor that
brings externality, the developer offers them a transfer κ. In addition to the city size and
the transfer, the total amount of each production factor used in the city is also picked, in
order to affect guaranteed levels. However, the levels are equalized over the economy and
must be taken as given due to competition among developers.
14

Given that L1 = 0 in the equilibrium, the developer’s problem is reduced to
MAX{H,Lr ,κ}
½cH2
4− κH
¾s.t. Vh = ph + κ− cH
2
Vl = plr
wh = αHγ+α−1L1−αr
wlr = (1− α)Hγ+αL−αr
where the first two constraints are the indirect utilities of skilled and rural unskilled workers
and the last two constraints are equilibrium wage functions derived from firms’ profit maxi-
mization. The indirect utility and the equilibrium wage function of urban unskilled workers
are omitted here because L1 = 0.
The first order conditions imply the transfer as a function of production factors. Substi-
tuting out Lr using L1 = 0 and (1), it is
κ = γHγ
µ1− φ
φ
¶1−α(3)
In the equilibrium, the developer must earn zero profit due to free entry. This condition
together with (3) implies (2). (1), (2) and L1 = 0 then characterize the equilibrium allocation,
which in turn solves the equilibrium wages and transfer.
4.1.2 τ = 0
When τ = 0, outsourcing support to remote subcontractors is not possible. Therefore, all
unskilled workers must live in cities and Lr0 = 0. Given this fact, solving the optimal allo-
cation and the equilibrium is analogous to the τ = 1 case. The solutions can be determined
after deriving
H0 = φ2
1−γ
µ4γ
c
¶ 11−γµ1− φ
φ
¶1−α1−γ
(4)
15

4.1.3 Comparison
A direct comparison between equilibrium outcomes at the above two limiting cases easily
illustrates implications on how better technology affects segregation, city characteristics,
and welfare. From τ = 0 to τ = 1, the economy is subject to the following changes. First,
unskilled workers leave cities and the economy changes from complete integration (Lr = 0)
to complete segregation (L = 0). Second, city size increases, because given that φ ∈ (0, 1),
N1 = H1 > φ1+γ1−γH1 =
1
φH0 = N0
Consequently, cities’ average rent cN4increases. Third, unskilled workers’ welfareWl becomes
higher, because given that H1 > H0,
Wl1 = Hγ1 (1− α)
µ1− φ
φ
¶−α> Hγ
0 (1− α)
µ1− φ
φ
¶−α− c
2N0 =Wl0
unskilled workers benefit from more productive cities and earn higher income than before.
Moreover, they save urban cost of living. Fourth, skilled workers’ welfare Wh may decrease,
because on one hand, they obtain higher income.
Hγ1 (α+ γ)
µ1− φ
φ
¶1−α> Hγ
0 (α+ γ)
µ1− φ
φ
¶1−α
On the other hand, they pay more urban cost of living.
c
2N1 >
c
2N0
In a numerical example that α = 0.66, φ = 0.5, and γ = 0.2, skilled workers get worse of
from τ = 0 to τ = 1.
16

4.2 The General Case
One might like to solve the equilibrium at τ ∈ (0, 1). Solving this general case is an analogy
of solving limiting cases, noticing that: (i) The representative city developer is now subject
to three constraints of indirect utilities, three constraints of equilibrium wages, and non-
negative constraints of L and Lr; (ii) When both non-negative constraints are not binding,
unskilled workers must be indifferent between living in cities and living in rural areas. Solving
the equilibrium, one can see that: (i) The economy is of partial segregation when τ is in a
range of medium values,
(τ , τ) =
⎛⎝(1− α)− 2γ (1− φ)
(1− α),
(1− α)
(1− α) + 2γ³1−φφ
´⎞⎠
(ii) It is of complete integration, when τ ≤ τ . (iii) It is of complete segregation, when τ ≥ τ .
4.3 Analysis
Here I formally analyze how an increase of technology τ affects segregation, city character-
istics, and workers’ welfare. The following propositions focus on the case that τ ∈ [τ , τ),
because if and only if τ is in this range, an increase of τ can alter segregation and city
characteristics. The analysis on the two other cases that τ ∈ [0, τ) and τ ∈ [τ , 1] are fairly
easy and are excluded from the propositions. Briefly speaking, when τ ∈ [0, τ), a marginal
increase of τ has no effect. When τ ∈ [τ , 1], a marginal increase of τ increases aggregate
welfare and benefits both types of workers without changing the equilibrium allocation.
Proposition 4 Increasing τ increases geographic segregation between skilled and unskilled
workers.
Proof. For ease of exposition, define ρ = LHbe the ratio of cities’ unskilled to skilled workers.
When τ ∈ [τ , τ), it is necessary that unskilled workers are indifferent between living in rural
17

areas and living in cities. The wage premium of urban unskilled workers is to compensate
urban cost of living. That is
(1− τ) (1− α)Hγ
µρ+ τ
µ1− φ
φ− ρ
¶¶−α=
c (1 + ρ)
2H
in which N , L, and Lr are substituted out by ρ and H. From the above equation, it is seen
that holding ρ and H fixed, a marginal increase of τ reduces the wage premium of urban
unskilled workers so that the premium is not enough to compensate urban cost of living.
The left hand side expression becomes smaller than the right hand side expression. In other
words, cities are too expensive to live for the unskilled workers. This inequality motivates
urban unskilled workers relocating to rural areas. Given that ∂H∂τ
> 0, which will be proved
true, restoring the equality requires ∂ρ∂τ
< 0, which implies less urban unskilled workers in
the equilibrium. That is higher segregation.
Proposition 5 The First Welfare Theorem holds.
Proof. The gap between social and private marginal productivity of skilled workers is
∂
∂HHγ+αM1−α − ∂
∂HAHαM1−α = γHγ
µM
H
¶1−α
which is exactly the transfer κ offered by city developers. The First Welfare Theorem holds
because city developers internalize the production externality.
Proposition 6 Increasing τ increases production spillover Hγ, city size N and average rent
cN4.
Proof. The proof is fairly simple and intuitive given that the First Welfare Theorem holds.
When τ ∈ [τ , τ), a marginal increase of τ results in unskilled workers leaving cities. If
a skilled worker is added into the city when a unskilled worker leaves, the city size does
not change, and consequently the total congestion is invariant. Nevertheless, the density
18

of skilled workers increases in the city. The higher density enhances agglomeration benefit
and makes it outweigh total congestion at the original city size. Therefore, city size should
increase by attracting even more skilled workers. As a result, the average rent increases.
Proposition 7 Increasing τ raises aggregate welfare and aggregate output.
Proof. Only aggregate output
Y = φHγ
µM
H
¶1−α(5)
needs to be considered, since congestion always takes away γ portion of the output as a
standard feature of system of cities. The value of (5) depends on (i)Hγ the size of production
spillover and (ii)M/H the total employment of intermediate goods relative to ideas in cities.
In the appendix, I show that a higher τ , though does decrease M/H, increases Y , because
its positive effect on the production spillover always dominates. This suffices to the proof.
Proposition 8 Increasing τ reduces welfare inequality between skilled and unskilled workers.
Proof. We have the following facts. First, given unit elasticity of substitution, skilled and
unskilled workers earn constant shares of aggregate output. The shares are α for skilled
workers and 1−α for unskilled workers in this model. Second, given the structure of system
of linear cities, the aggregate urban cost of living is 2γY . Half of the cost is aggregate
congestion, and the other half is aggregate rent which eventually becomes a part of skilled
workers’ income through city developers’ transfer payment. Third, every urban worker pays
the same urban cost of living regardless of types. When τ is such that a θ measure of
unskilled workers living in rural areas, the economy has 1−θ urban workers and φ of them is
skilled. Therefore, φ/ (1− θ) portion of the aggregate urban cost of living is paid by skilled
workers, and the other (1− φ− θ) / (1− θ) portion is paid by unskilled workers. Thus, the
19

welfare of a skilled worker is
Wh =
∙α+ γ −
µφ
1− θ
¶2γ
¸Y
φ(6)
and for an unskilled worker, it is
Wl =
∙(1− α)−
µ1− φ− θ
1− θ
¶2γ
¸Y
1− φ(7)
Given that ∂θ∂τ
> 0 by proposition 4, clearly ∂(Wh/Wl)∂τ
< 0 as τ ∈ [τ , τ).
Proposition 9 Increasing τ raises unskilled workers’ welfare.
Proof. Given that ∂θ∂τ
> 0 by proposition 4 and ∂Y∂τ
> 0 by proposition 7, clearly (7) is
increasing in τ .
The above propositions make clear why unskilled workers can benefit from the geographic
segregation between skilled and unskilled workers. The better technology expels unskilled
workers, who do not aid production externality, from cities and brings in skilled workers who
do contribute. This results in more efficient use of urban land space which makes viable
larger cities and higher production spillover and raises unskilled workers’ wages. Moreover,
unskilled workers pay smaller share of aggregate urban cost of living as some of them relocate
to rural areas. In summary, the better technology allows unskilled workers saving on rent
and commuting cost while still benefiting from more productive cities.
Skilled workers may not benefit from the new technology and the spatial sorting. With
the new technology, they have to pay an increasing share of the rising aggregate urban cost
of living, although they do get higher income. The next proposition states this result.
Proposition 10 Increasing τ decreases skilled workers’ welfare.
Proof. Because the expression inside the square bracket of (6) is decreasing in τ but ∂Y∂τ
> 0,
it needs further calculation to determine the net effect of a higher τ on skilled workers’
welfare. In the appendix, I show that the net effect is negative.
20
5 Concluding Remarks
This paper contributes to the research on domestic outsourcing, with evidence and theory.
The empirical findings are that not only unskilled jobs but also unskilled workers are moving
from large cities to small cities, whereas both skilled jobs and skilled workers are moving from
small cities to large cities. The theory developed here shows how this increasing geographic
segregation of workers by skill emerges. The advent of communication technology results
in unskilled job outsourcing, and the released urban land space allows more skilled workers,
who contribute production spillover, to come in. This spatial sorting in turn increases the
density of urban skilled workers and enhances agglomeration benefit of cities. Therefore,
cities enlarge and become places of elites.
To the extent of workers’ welfare, the increasing geographic segregation in fact benefits
unskilled workers. They earn higher wage since firms have higher total factor productivity,
and they save urban cost of living by moving to rural areas. On the other hand, skilled
workers are made worse off. Although their wage increases, the urban cost of living they
have to pay increases even more.
The idea of this paper can be alternatively modeled in a core-periphery environment
although this paper is in system of cities. Then, location changes of activities within a
metropolitan area can be studied.
The welfare results rely on the assumption of mobility. If instead people are immobile
across places, the results can be overturned. To see this, assume the economy is originally
at a technology level such that there are unskilled workers in rural areas as well as in
cities. Also, assume that relocation cost is so high that urban unskilled workers will not
move given a technology progress. Then, city characteristics such as city size and size of
production spillover will not change, but relative employment of intermediate goods to ideas
becomes higher because rural unskilled workers can deliver more support. Consequently,
urban unskilled workers are laid behind since they earn lower wages but pay the same urban
21

cost of living as before. On the other hand, skilled workers are better off since their wages are
higher but the urban cost of living is the same. As for rural unskilled workers, they are still
better off because of increasing demand of unskilled jobs in rural areas. This environment
in fact can fit into international outsourcing without much modification and has results
consistent with trade literature.
The model of this paper is isolated from other possible sources of externality such as
neighborhood effect. Since outsourcing results in segregation, one might wonder how neigh-
borhood effect will influence if it is important. Rural unskilled workers might not learn from
skilled workers. Rural children might have inferior education resources. If these are impor-
tant, there may be more unskilled workers staying in cities and sacrificing current utility for
better prospect of future. Moreover, segregation that deters social mobility may have long
run impacts on skill composition and productivity of the economy. Further research effort is
needed.
References
[1] Abdel-Rahman Hesham M. and Ping Wang (1997), ”Social Welfare and Income In-
equality in a System of Cities”, Journal of Urban Economics, 41: 462-483
[2] Abraham, Katharine G. and Susan K. Taylor (1996), ”Firms’ Use of Outside Contrac-
tors: Theory and Evidence”, Journal of Labor Economics 14: 394-424
[3] Antras, Pol and Elhanan Helpman (2004), ”Global Sourcing”, Journal of Political Econ-
omy, 112: 552-580
[4] Antras, Pol, Luis Garicano and Esteban Rossi-Hansberg (2004), ”Offshoring in a Knowl-
edge Economy”
[5] Black, Duncan and J. Vernon Henderson (1999), ”A Theory of Urban Growth”, Journal
of Political Economy, 107: 252-284
22

[6] Brown, Byron W. and Carl E. Liedholm (2002) ”Can Web Courses Replace the Class-
room in Principles of Microeconomics?” American Economic Review 92: 444-448
[7] Duranton, Gilles and Diego Puga (forthcoming), ”From Sectoral to Functional Urban
Specialization”, Journal of Urban Economics
[8] Franklin, Rachel S. (2003), ”Migration of the Young, Single, and College Educated:
1995 - 2000”, Census 2000 Special Reports
[9] Gaspar, Jess and Edward L. Glaeser (1998), ”Information Technology and the Future
of Cities”, Journal of Urban Economics, 43: 136-156
[10] Glaeser, Edward L. (1999), ”Learning in Cities”, Journal of Urban Economics, 46: 254-
277
[11] Glaeser, Edward L. and David C. Mare (2001), ”Cities and Skills”, Journal of Labor
Economics, 19: 316-341
[12] Glaeser, Edward L., Matthew E. Kahn, and Jordan Rappaport (2000), ”Why Do the
Poor Live in Cities?”, NBER Working Paper 7636
[13] Henderson, J. Vernon (1974), ”The Size and Types of Cities”, American Economic
Review, 64: 640-656
[14] Holmes, Thomas and John Stevens (2003), ”Spatial Distribution of Economics Activities
in North America”, to appear in the Handbook of Urban and Regional Economics, ed.
J. V. Henderson and J. F. Thisse
[15] Kremer, Michael (1997), ”How Much Does Sorting Increase Inequality?”, Quarterly
Journal of Economics, 112: 115-193
[16] Kremer, Michael and Eric Maskin (1996), ”Wage Inequality and Segregation by Skill”,
NBER Working Paper 5718
23
[17] Kremer, Michael and Eric Maskin (2003), ”Globalization and Inequality”
[18] Krugman, Paul (1991), ”Increasing Returns and Economic Geography”, Journal of
Political Economy, 99: 483-499
[19] Lucas, Robert E. Jr. (1988), ”On the Mechanics of Economic Development”, Journal
of Monetary Economics, 22: 3—42.
[20] Mills, E.S. (1967), ”An Aggregative Model of Resource Allocation in a Metropolitan
Area”, American Economic Review, 61: 197-210.
[21] Wheeler, Christopher H. (2004), ”Cities, Skills, and Inequality”, FRB St. Louis Working
Paper, 2004-020A
[22] Wheeler, Christopher H. (2004), ”Metropolitan v.s. Non-Metropolitan Trends in Earn-
ings Inequality and Education Returns in the 8th District: 1970-2000”
24

Table 1: Size and growth of Business Support Services, 1998 - 2002
Table 2: Employment of Business Support Services by city sizes, 1998 - 2002
25

Table 3: Geographic concentration of Business Support Services, 1998 - 2002
26

Table 4: Usage of Business Support Services (BSS) by industry in 1997
27
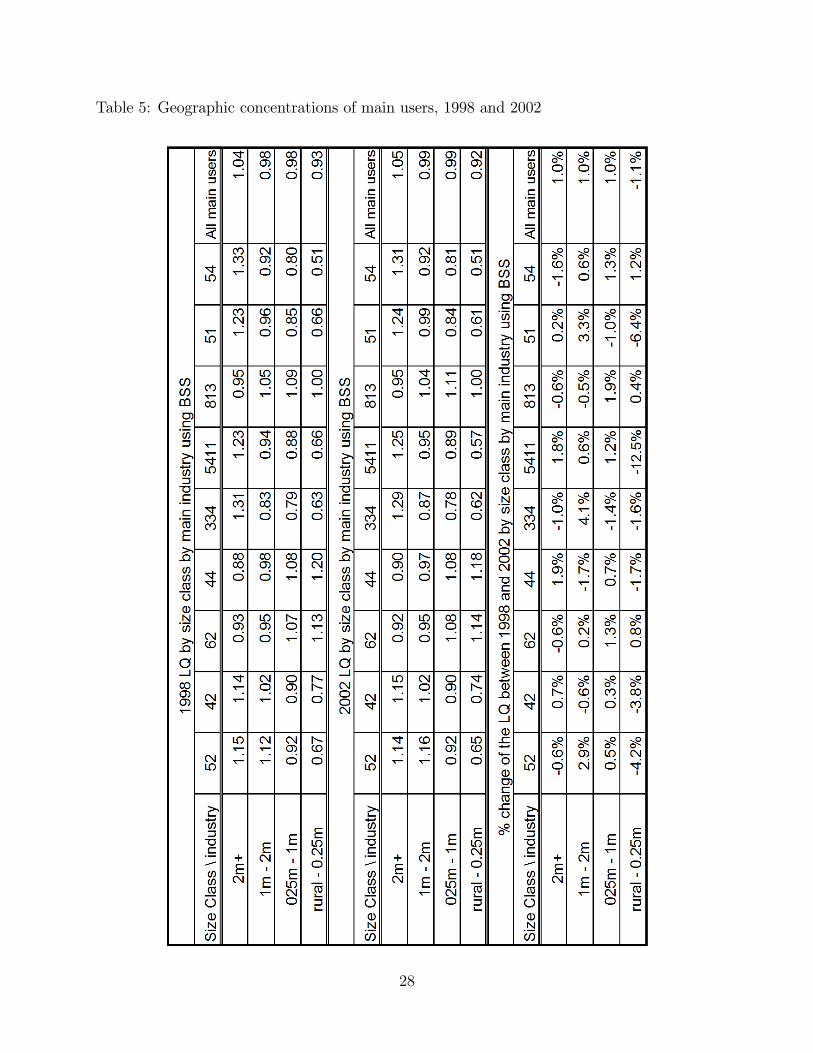
Table 5: Geographic concentrations of main users, 1998 and 2002
28

Table 6: Skill composition by industry, 2000
Table 7: Geographic concentrations of managers and supportive workers within the down-
stream sector, 1990 and 2000
29

Table 8: Number of occupation specific workers per 1000 downstream sector employees, 1990
and 2000
30
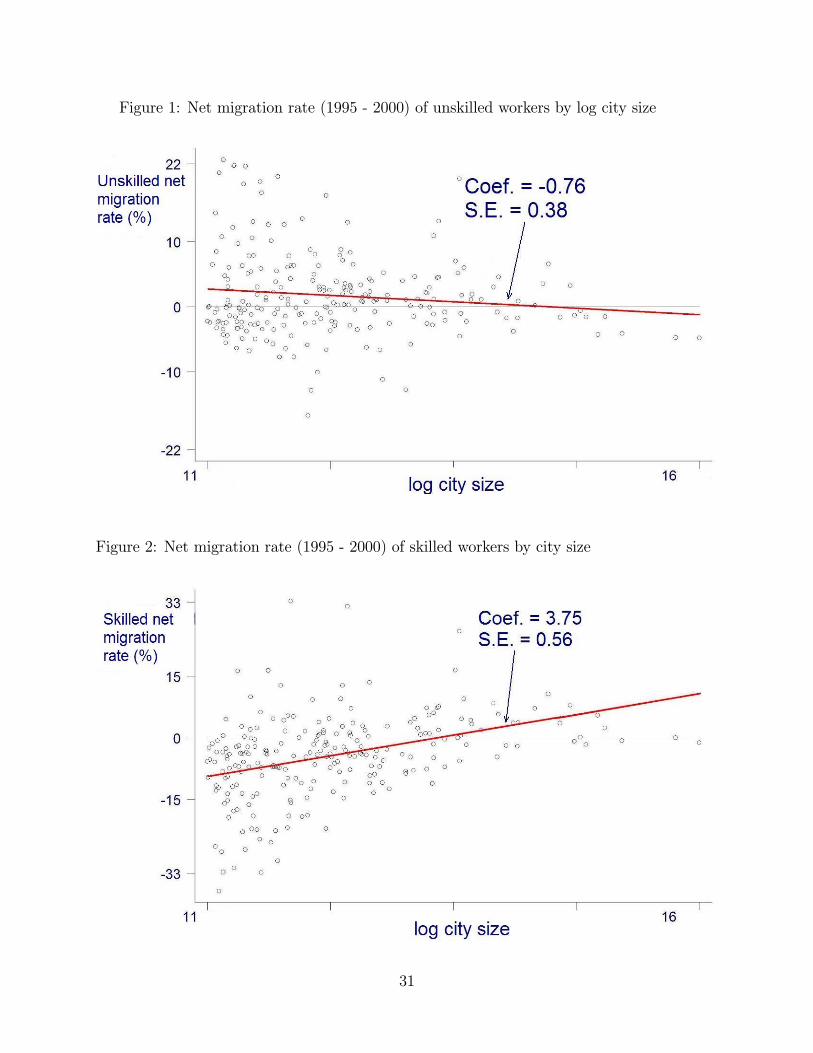
Figure 1: Net migration rate (1995 - 2000) of unskilled workers by log city size
Figure 2: Net migration rate (1995 - 2000) of skilled workers by city size
31

6 Data Appendix
The sources of evidences of this paper are County Business Pattern (CBP) 1998 through 2002,
Public Used Micro Samples (PUMS) 1990 and 2000, and Input-Output (I-O) Accounts 1997
Benchmark. The CBP data are used to produce Table 1, 2, 3, and 5. The PUMS data are
used to produce Table 6, 7, and 8 and Figure 1 and 2. The Input-Output Accounts are used
to produce Table 4.
The geographic units studied here are metropolitan areas and rural areas. For CBP data,
metropolitan areas and rural areas are as defined in 1999 by the Office of Management and
Budget (OMB). The concepts of metropolitan areas are NECMA for New England States
and MSA/CMSA for other states. As producing Figure 1 and 2, I directly follow 2000
PUMS definition of metropolitan areas. As comparing 1990 and 2000 figures in Table 7 and
8, I actually use Integrated Public Used Micro Samples and metropolitan areas are in 1990
PUMS definition. Though here is lack of discipline, effectiveness of the evidences are not
affected.
CBP data has a severe nondisclosure problem for determining the exact industrial em-
ployment at a location. Holmes and Stevens (2003) develop an estimation procedure. It is of
particular value as estimating employment at a location having establishments in 1000-plus
employee size classes. I follow their procedure to estimate county level employment and then
aggregate data to the metropolitan level.
For PUMS data, I use uses 5% sample for 2000 and 1% metro sample for 1990 because
of the interest in metropolitan data. The structure of the fundamental geographic unit
(PUMA) in PUMS varied across years. For samples in 2000, the 5% is superior than 1%,
because metropolitan information in geographic units with population less than 400,000 are
not identifiable in the 1% sample. For 1990 samples, the 1% metro sample is superior than
5% state sample because 1% PUMAs follow metropolitan borders while 5% PUMAs do not.
32

7 Analytical Appendix
7.1 ∂Y∂τ > 0
Here, I show that increasing τ has a positive net effect on aggregate output when τ ∈ [τ , τ).
This suffices to the proof of proposition 7. Substituting
H =
µ4γ
c
¶ 11−γ
(1 + ρ (τ))−21−γ
µρ (τ) + τ
µ1− φ
φ− ρ (τ)
¶¶1−α1−γ
(8)
for H in (5), we have
eY = φ
µ4γ
c
¶ γ1−γ
Θ (τ)1
1−γ
Θ (τ) = (1 + ρ (τ))−2γµρ (τ) + τ
µ1− φ
φ− ρ (τ)
¶¶1−α
where
ρ (τ) =(1− α)− 2γ τ
(1−τ)
³1−φφ
´2γ − (1− α)
Taking derivative of Θ with respect to τ , one can see that Θ0 (τ) > 0 for any τ ∈ [τ , τ) if
Θ0 (τ) > 0. Evaluating the derivative at τ , we have
Θ0 (τ) =
"µ1
φ
¶2γ− 1#"
(1− α)2
[2γ − (1− α)] (1− φ)α φ1−α
#> 0
Therefore,
∂eY∂τ
> 0, ∀τ ∈ [τ , τ)
33

7.2 ∂(M/H)∂τ < 0
Applying (8) into the condition that urban wage premium of unskilled workers is to com-
pensate urban cost of living
(1− τ) (1− α)Hγ
µM
H
¶−α=
c (1 + ρ)H
2
we have
M
H=(1− τ) (1 + ρ (τ)) (1− α)
2γ
which is decreasing in τ since ρ0 (τ) < 0.
7.3 ∂Wh
∂τ < 0
Here, I show that increasing τ has a negative net effect on the welfare of skilled workers
when τ ∈ [τ , τ). This suffices to the proof of proposition 10. A skilled worker’s welfare is
defined as
Wh = ph + κ− cN
2
In the equilibrium, it is
Wh =
µ4γ
c
¶ γ1−γ
⎡⎢⎣µρ (τ) + τ
µ1− φ
φ− ρ (τ)
¶¶1−α1−γ
⎛⎜⎝ (α+ γ) (1 + ρ (τ))−2γ1−γ
−2γ (1 + ρ (τ))−1−γ1−γ
⎞⎟⎠⎤⎥⎦
Taking derivative with respect to τ , we have
∂Wh
∂τ= Ψ (τ)
µ4γ
c
¶ γ1−γÃ(2γ − (1− α))
2γ−(1−α)1−γ (1− α)
1−α1−γ
(2γ)2γ1−γ (1− γ)φ
!(1− τ)
γ−α1−γ
∙φ− τ
(1− τ)φ
¸−α−11−γ
Ψ (τ) =
⎡⎢⎣ (2γ − (1− α)) (1− α)−³(1−φ)(1+γ)(2γ−(1−α))
(1−τ)
´+³2γ(1−φ)(1−τ) − (1− α)
´³φ−τ(1−τ)φ
´(α+ γ)
⎤⎥⎦
34

∂Wh
∂τ< 0 if and only if Ψ (τ) < 0. To verify the sign of Ψ (τ), consider convex combinations
of τ and τ
τ = (1− λ)(1− α)− 2γ (1− φ)
(1− α)+ λ
(1− α)
(1− α) + 2γ³1−φφ
´for any λ ∈ [0, 1]. After some mechanical algebraic operation, one can find that
Ψ (τ) = −
⎡⎣ (2γ − (1− α))
1 +³(2γ−(1−α))(1−φ)(1−λ)
1−α
´⎤⎦
⎡⎢⎢⎢⎢⎢⎢⎢⎢⎢⎢⎢⎢⎢⎢⎣
(1−γ)2γ
((1− φ) 2γ + (1− α)φ)
+ (2γ − (1− α)) (1− φ)λ
+(2γ − (1− α)) (α+ γ) (1− α)φ
+(2γ − (1− α)) (α+ γ) (1− φ) (1− λ) 2γ
+ 12γ
¡1− (2γ)2
¢(α+ γ) (1− α)
+¡1− (2γ)2
¢(1− λ) (α+ γ)
³1−φφ
´
⎤⎥⎥⎥⎥⎥⎥⎥⎥⎥⎥⎥⎥⎥⎥⎦< 0
Therefore, for any τ ∈ [τ ,τ), ∂Wh
∂τ< 0.
35