Embed Size (px)
Citation preview

OUTPUT ONLY INVESTIGATION OF THE EFFECT OFPOST-TENSIONING FORCE ON NATURAL FREQUENCIESOF POST-TENSIONED CONCRETE BEAMS
Darragh Noble 1, Maria Nogal 2, Alan John O’Connor 3 and Vikram Pakrashi 4
1 PhD Student, Dept. of Civil, Structural & Environ. Eng., Trinity College Dublin, Dublin, Ireland, [email protected] Post-Doc Researcher, Dept. of Civil, Structural & Environ. Eng., Trinity College Dublin, Dublin, Ireland, [email protected] Assoc. Prof., Dept. of Civil, Structural & Environ. Eng., Trinity College Dublin, Dublin, Ireland, [email protected] Assist. Prof., Dept. of Civil & Environ. Eng., University College Cork, Cork, Ireland, [email protected].
ABSTRACTThis paper describes the outcome of output only experimental modal analysis on 9No. post-tensionedconcrete beams. Dynamic impact testing was conducted on each of the 9No. beams at different levelsof post-tensioning force. The Fast Fourier Transform (FFT) was implemented on accelerometer impactdata, and the fundamental frequencies of the simply supported post-tensioned concrete beams were de-termined by a peak-picking algorithm at each post-tensioning load level. The tests were repeated 10times at each impact location to ensure repeatability of the experiment. There were 3 impact locationsper post-tensioning load level, and there were 11 post-tensioning load levels at which the beams weretested. A first-order linear regression model was then applied to the measured fundamental bendingfrequencies with increasing post-tensioning load. Statistical significance tests were then conducted onthe recorded data to determine if any statistically significant changes in fundamental bending frequencywith increasing post-tensioning load was observed. This problem is particularly important in the field ofprestressed concrete bridge girders and more recently for pre-cast post-tensioned concrete wind turbinetowers, both of which are structures that may be susceptible to extreme dynamic loading over their designlife. Structural engineers should thus be able to monitor or estimate changes in the dynamic propertiesof PSC structures over the course of their design life to ensure their safety and serviceability.
Keywords: Output-only, Experimental modal analysis, Post-tensioned concrete, Linear regression mod-elling, Fundamental bending frequency

1. INTRODUCTION
The prediction of the change in natural vibration frequencies with varying prestress force magnitude forpre- and post- tensioned concrete (PSC) structures is a particularly important problem. This problemhas many implications, particularly in the field of PSC bridge girders and more recently for pre-cast,post-tensioned concrete wind turbine towers, both of which are structures that are susceptible to extremedynamic excitation. Pre-stress force decreases over time due to concrete creep, steel relaxation, anchor-age pull in and other factors. Structural engineers should thus be able to monitor or estimate changes inthe dynamic properties of PSC structures over the course of their design life to ensure their safety andserviceability. As a result, prediction of change in the dynamic characteristics of pre-stressed concretestructures over time is of great importance. The Eurocode 2 equation for pre-stress loss as a function oftime is well established. If the relationship between pre-stress force and dynamic characteristics, (e.g.fundamental bending frequency, ω1), for PSC structures can be established, then the variation of ω1 overthe design life of a PSC structure due to pre-stress loss can be estimated.
The effect of prestress force magnitude and eccentricity on the fundamental bending frequency of PSCstructures is something that has been widely debated in literature to date [1]. There are three distinctarguments to be found in the literature;
1. The fundamental bending frequency (ω1) decreases with increasing pre-stress force magnitude(N ). This is known as the “compression softening” effect and is based on classical Euler-Bernoullitheory of an externally axially loaded homogeneous beam [2, 3].
2. ω1 is unaffected by N . This is based on a non-linear kinematic model which concludes that thefinal equation of motion for a vibrating beam is independent of pre-stress force magnitude [4].
3. ω1 increases with increasing N . This has been found to be the case in numerous empirical studies[5, 6] however, a satisfactory mathematical model has yet to be formulated, despite some attempts[7].
2. EXPERIMENTAL SET-UP
Dynamic impact testing has been conducted on 9No. post-tensioned concrete beams. Figure 1 shows theexperimental set-up. Each beam was 200mm deep and 150mm wide in cross-section. Each beam had adifferent straight-profiled post-tensioning strand eccentricity, as outlined in Figure 1. The concrete hada characteristic strength, fck = 30MPa and a Young’s Modulus measured to be Ec = 26.88GPa. Thebeams were lightly reinforced with 2No. H12 as bottom reinforcement and 2No. H8 as hanger bars (topreinforcement). H8 shear links were provided at 200mm centres and an additional 2No. H8 shear linkswere provided in the anchorage zone as bursting reinforcement, in accordance with the CIRIA method,and as shown in Figure 1. Cover to all reinforcement was specified to be a minimum of 25mm [8].
A 15.7mm Freyssinet pre-stressing strand, with a yield strength, fy=1880MPa was threaded through astraight-profiled plastic duct, cast into the reinforced concrete beam as shown in Figure 2. A 20mmthick steel plate was placed against the rectangular beam face at each end. 300 ton hydraulic loadingjacks were then placed at each end of the beam. The jacks were connected to load cells, which measuredthe magnitude of the post-tensioning force induced in the beam. The strand was secured using collets oneither end of the load cells [8].
Dynamic impact testing was conducted at three locations along the length of the beam span, as outlined inFigure 2, labelled L1-L3. The beam was struck 10 times at each location using an impact rig assembledin the lab with a rope and pulley system. The experiment was repeated at different post-tensioningload levels, as outlined in Figure 1. This helped ensure repeatability of the experiment. Strain gaugeswere fixed at the three impact locations (e1- e3) in order to obtain the mode shapes of vibration. Theaccelerometer (A1) was strategically placed at a distance of 800mm from the support, in order to identify

2000LOAD CELL
LOADINGJACK/ACTUATOR
LOAD CELL & ACTUATOR FIXEDTO EXTERNAL FRAME
LOADINGJACK/ACTUATOR
15.7mm PRESTRESSINGSTRAND
LVDTACCELEROMETER
9No. test specimens:
9No. 150 wide x 250 deep PS beams with following PSbar/strand eccentricities:e = -52, -39, -26, -13, 0, +13, +26, +39, +52
11No. PS Load testing levels:P = 0, 20, 40, 60, 80, 100, 120, 140, 160, 180, 200 kN
2No. H8 SHEAR LINKSPROVIDED @140MM FROMBEAM FACE AS ADDITIONALBURSTING REINFORCEMENTIN ACCORDANCE WITH CIRIAMETHOD
20MM THKSTEEL PLATE200 X 150 MM
800
Figure 1: Experimental set-up.
333 333 334
800
150X 10
L1/e1 L2/e2 L3/e3
X 10 X 10
A1 ea1
150
200
15.7mmpre-stressing
strand H8 @ 200mm centres
H12
H8
Figure 2: Instrumentation.
all of the first three modes of vibration. Placement at midspan would eliminate the opportunity to obtainthe second mode of vibration as it is a nodal point for the second mode. A fourth strain gauge (ea1)was placed in the axial direction, close to midspan, in order to compare the axial strain data with thepre-stress load data obtained from the load cells [8].
3. EXPERIMENTAL ANALYSIS
Following collection of the impact hammer data, the raw acceleration-time signal was imported intoMATLAB [9]. The Fast Fourier Transform (FFT) was then performed on the acceleration data in thetime domain, representing the signal in the frequency domain. A peak picking algorithm was used toidentify the peaks in the frequency domain. Sample results can be seen in Figure 3. The peak pickingmethod is the simplest means of determining the modal characteristics in the frequency domain, in whichthe natural frequencies correspond to the peaks in the FFT, however as pointed out in [10] “this methodis not reliable when the different modes of vibration are not sufficiently separated from each other.”
The raw signal contained significant electrical noise. Subsequently, the peaks in the frequency domainwere initially difficult to determine. This is outlined in Figure 3. The fundamental peak is readilyidentifiable at a value of approximately 71.8Hz, as shown in Figure 3a and Figure 3b, however allsubsequent peaks are distorted due to high frequency noise components in the signal. A signal processingalgorithm was developed in MATLAB [9] and is outlined in Figure 4. Following smoothing in thefrequency domain, the peak picking algorithm was reapplied and the peaks were again determined. Thesearch bands for the fundamental frequency of each beam were defined as 55-85Hz.
Following signal processing, the structural peaks were much easier to identify as outlined in Figure 5a.The peaks in the frequency domain were identified as the natural frequencies of the structural system,

0 1 2 3 4−1
0
1x 10⁴
200 400 600 800 10000
0.1Time, t (s)
Frequency,ω (Hz)
Acc
eler
atio
n, a
(t) (g
)|a(ω
)|max
|a(ω
)|
(a)
0 1 2 3 4−1
0
1x 10⁴
40 60 80 100 1200.06
0.1Time, t (s)
Frequency,ω (Hz)
Acc
eler
atio
n, a
(t) (g
)|a(ω
)|max
|a(ω
)|
(b)
Figure 3: Unprocessed, noisy signal at different scales (a) and (b). Identification of fundamental bending fre-quency possible. Higher modes unintelligible.
Figure 4: Signal processing algorithm flow chart.
as shown in Figure 5b. This algorithm is required to deal with the high levels of noise associatedwith impact testing of concrete beams with a relatively high fundamental bending frequency, which isexpected to be in the region of 78Hz.
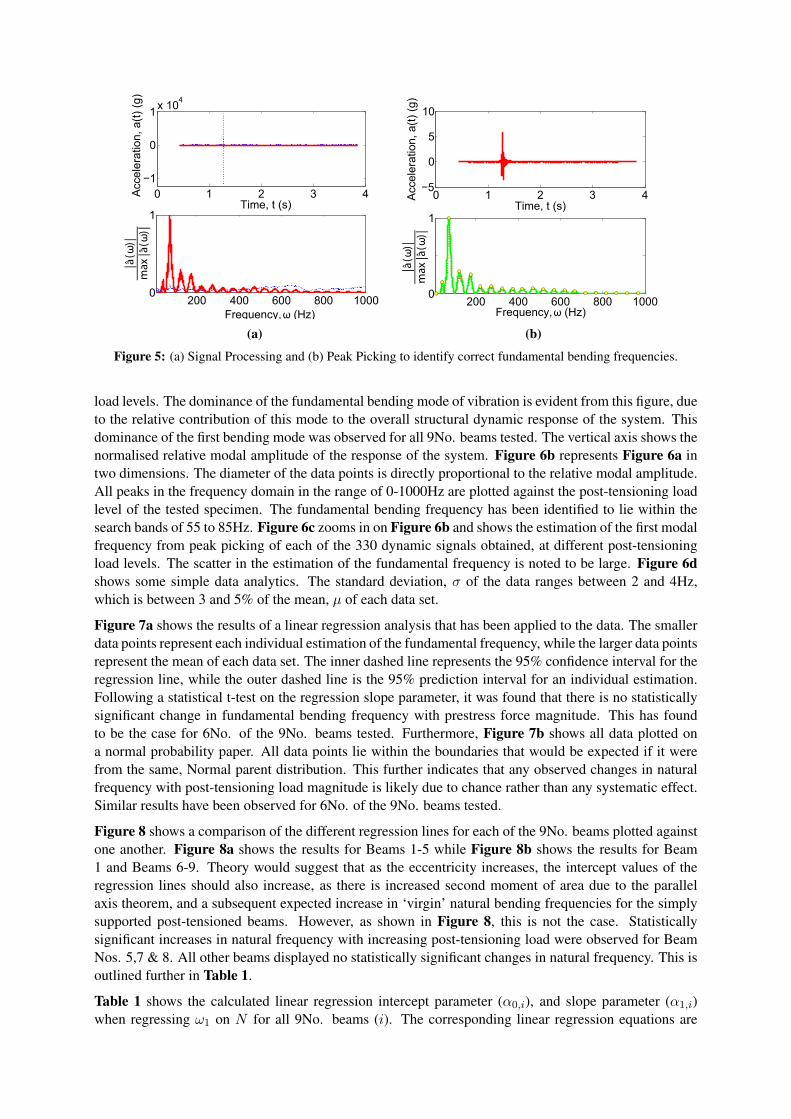
Figure 5 shows a typical accelerometer response a post-tensioned concrete beam. Figure 5a and 5bshow the accelerometer signals in both the time and frequency domain, before the signal was processedto eliminate noise and after signal processing. The scale of the acceleration axis in the time domain ofeach signal is significantly reduced following signal processing, indicating the extent of the amplitudeattributable to noise components.
4. EXPERIMENTAL RESULTS
Figure 6 and Figure 7 show sample results for Beam 2 (e=+13mm). Figure 6a shows the peaks of thefrequency domain representation of all 30 signals superimposed on each other for varying post-tensioning
0 1 2 3 4−1
0
1x 10⁴
200 400 600 800 10000
1Time, t (s)
Acc
eler
atio
n, a
(t) (g
)
Frequency,ω (Hz)
|a(ω
)|max
|a(ω
)|
(a)
0 1 2 3 4−5
0
5
10
200 400 600 800 10000
1
|a(ω
)|max
|a(ω
)|A
ccel
erat
ion,
a(t)
(g)
Time, t (s)
Frequency,ω (Hz)
(b)
Figure 5: (a) Signal Processing and (b) Peak Picking to identify correct fundamental bending frequencies.
load levels. The dominance of the fundamental bending mode of vibration is evident from this figure, dueto the relative contribution of this mode to the overall structural dynamic response of the system. Thisdominance of the first bending mode was observed for all 9No. beams tested. The vertical axis shows thenormalised relative modal amplitude of the response of the system. Figure 6b represents Figure 6a intwo dimensions. The diameter of the data points is directly proportional to the relative modal amplitude.All peaks in the frequency domain in the range of 0-1000Hz are plotted against the post-tensioning loadlevel of the tested specimen. The fundamental bending frequency has been identified to lie within thesearch bands of 55 to 85Hz. Figure 6c zooms in on Figure 6b and shows the estimation of the first modalfrequency from peak picking of each of the 330 dynamic signals obtained, at different post-tensioningload levels. The scatter in the estimation of the fundamental frequency is noted to be large. Figure 6dshows some simple data analytics. The standard deviation, σ of the data ranges between 2 and 4Hz,which is between 3 and 5% of the mean, µ of each data set.
Figure 7a shows the results of a linear regression analysis that has been applied to the data. The smallerdata points represent each individual estimation of the fundamental frequency, while the larger data pointsrepresent the mean of each data set. The inner dashed line represents the 95% confidence interval for theregression line, while the outer dashed line is the 95% prediction interval for an individual estimation.Following a statistical t-test on the regression slope parameter, it was found that there is no statisticallysignificant change in fundamental bending frequency with prestress force magnitude. This has foundto be the case for 6No. of the 9No. beams tested. Furthermore, Figure 7b shows all data plotted ona normal probability paper. All data points lie within the boundaries that would be expected if it werefrom the same, Normal parent distribution. This further indicates that any observed changes in naturalfrequency with post-tensioning load magnitude is likely due to chance rather than any systematic effect.Similar results have been observed for 6No. of the 9No. beams tested.
Figure 8 shows a comparison of the different regression lines for each of the 9No. beams plotted againstone another. Figure 8a shows the results for Beams 1-5 while Figure 8b shows the results for Beam1 and Beams 6-9. Theory would suggest that as the eccentricity increases, the intercept values of theregression lines should also increase, as there is increased second moment of area due to the parallelaxis theorem, and a subsequent expected increase in ‘virgin’ natural bending frequencies for the simplysupported post-tensioned beams. However, as shown in Figure 8, this is not the case. Statisticallysignificant increases in natural frequency with increasing post-tensioning load were observed for BeamNos. 5,7 & 8. All other beams displayed no statistically significant changes in natural frequency. This isoutlined further in Table 1.
Table 1 shows the calculated linear regression intercept parameter (α0,i), and slope parameter (α1,i)when regressing ω1 on N for all 9No. beams (i). The corresponding linear regression equations are

0
100
2000
500
1000
0
0.5
1|a(ω
)|max
|a(ω
)|
Axial Load, N (kN)Frequency,ωn , (Hz)
(a)
0 50 100 150 2000
200
400
600
800
1000
Axial Load, N (kN)
Freq
uenc
y,ω
n, (H
z)
(b)
0 50 100 150 20050
60
70
80
90
100
Axial Load, N (kN)
Fre
quen
cy, ω
n, (H
z)
(c)
0 50 100 150 20050
60
70
80
90
100
µ=71.30 σ=2.02 n=30 n
act=30
µ=73.77 σ=3.82 n=30 n
act=30
µ=73.81 σ=2.36 n=30 n
act=30
µ=69.40 σ=3.19 n=30 n
act=30
Axial Load, N (kN)
Fre
quen
cies
, ω1 (
Hz)
(d)
Figure 6: (a) Processed signals in frequency domain as a function of axial load (3D); (b) All modes plotted againstaxial load (2D); (c) Zooming in on the fundamental bending frequency; (d) Simple data analytics on the measuredfrequencies as a function of axial force (Beam 2).
obtained by substituting into the following formula;
ω1 = α0,i + α1,iN (1)
5. CONCLUSIONS
The prediction of the change in natural bending frequencies with varying prestress force magnitude forPSC structures is an important problem, particularly in the field of PSC bridge girders and more recentlyfor pre-cast, post-tensioned concrete wind turbine towers, both of which are structures that are suscep-tible to extreme dynamic excitation. Following this output-only modal analysis study, it was concludedthat no statistically significant relationship was found between post-tension force magnitude and fun-damental bending frequency for 6No. of 9No. simply supported post-tensioned concrete beams testedin the laboratory. The other 3No. beams displayed a statistically significant increase in fundamentalbending frequency with increasing post-tensioning load. Recently the interest on variability of dynamicproperties of bridges (i.e. natural frequency, mode shape, damping ratio) caused by environmental ef-fects such as temperature, humidity, wind and other factors is increasing [11]. Studies conducted [12, 13]report frequency differences in the ranges of 6% and 14-18% respectively due to normal environmen-tal changes (e.g. temperature effects, lack of ideal support conditions, material variability etc...). Thechange in natural frequency due to prestress loss is therefore considered negligible in relation to suchlarge environmental effects.

0 50 100 150 20050
60
70
80
90
100
ω1 = 72.0282 + 0.0025N
Pretress Force, N (kN)
Fre
quen
cies
, ω1 (
Hz)
Observed DataMeans95% CI95% PI
(a)
64 66 68 70 72 74 76 78 80 82 84
0.005
0.05
0.2
0.4 0.6
0.8
0.95
0.995
Frequencies, ω1
Pro
babi
lity
(b)
Figure 7: (a) Linear regression analysis on change in fundamental frequency with increasing post-tensioning force(Beam 2); (b) All data plotted on a normal probability paper, indicating data normality.
0 50 100 150 20065
70
75
80
Axial force (kN)
Nat
ural
Fre
quen
cy, ω
(Hz)
e=0mme=+13mme=+26mme=+39mme=+52mm
(a)
0 50 100 150 20065
70
75
80
Axial force (kN)
Nat
ural
Fre
quen
cy, ω
(Hz)
e=0mme=-13mme=-26mme=-39mme=-52mm
(b)
Figure 8: Collated data of linear regression of fundamental bending frequency as a function of post-tensioningload for (a) Beams 1-5 and (b) Beams 1, 6-9.
ACKNOWLEDGMENTS
The authors would like to gratefully acknowledge the financial support donated by the Irish ResearchCouncil (IRC) under its Embark initiative. The authors would also like to sincerely thank BanagherConcrete, Heitons Steel, Roadstone Ireland, Fairyhouse Steel, and Freyssinet Ireland for their support insupplying testing materials throughout the duration of the project to date.
REFERENCES
[1] Quilligan, A., O’Connor, A., and Pakrashi, V. (2012). Fragility analysis of steel and concrete windturbine towers. Engineering Structures, 36:270 – 282.
[2] Tse, F., Morse, I., and Hinkle, R. (1978). Mechanical vibrations: theory and applications. Allynand Bacon series in mechanical engineering and applied mechanics. Allyn and Bacon.
[3] Miyamoto, A., Tei, K., Nakamura, H., and Bull, J. (2000). Behavior of prestressed beam strength-ened with external tendons. Journal of Structural Engineering, 126(9):1033–1044.
[4] Hamed, E. and Frostig, Y. (2006). Natural frequencies of bonded and unbonded prestressed beams -prestress force effects. Journal of Sound and Vibration, 295(1-2):28 – 39.

[5] Hop, T. (1991). The effect of degree of prestressing and age of concrete beams on frequency anddamping of their free vibration. Materials and Structures, 24:210–220.
[6] Saiidi, M., Douglas, B., and Feng, S. (1994). Prestress force effect on vibration frequency of concretebridges. Journal of Structural Engineering, 120(7):2233–2241.
[7] Kim, J.-T., Yun, C.-B., Ryu, Y.-S., and Cho, H.-M. (2004). Identification of prestress-loss in PSCbeams using modal information. Structural Engineering and Mechanics, 17(3 - 4):467–482.
[8] Noble, D., Nogal, M., O’Connor, A., and Pakrashi, V. (2014). The effect of prestress force magnitudeon the natural frequencies of prestressed concrete structures. In Proceedings of the 23rd AustralasianConference on the Mechanics of Structures and Materials (ACMSM23), volume I, pages 333–338.Southern Cross University.
[9] MATLAB (2014). version 8.3.0 (R2014a). The MathWorks Inc., Natick, Massachusetts.
[10] Foti, D., Gattulli, V., and Potenza, F. (2014). Output-only identification and model updating bydynamic testing in unfavorable conditions of a seismically damaged building. Computer-Aided Civiland Infrastructure Engineering, 29(9):659–675.
[11] Ho, D., Kim, J., Stubbs, N., and Park, W. (2012). Prestress-force estimation in PSC girder usingmodal parameters and system identification. Advances in Structural Engineering, 15(6):997–1012.
[12] Peeters, B. and De Roeck, G. (2001). One-year monitoring of the z24-bridge: Environmentaleffectsversus damage events. Earthquake Engineering and Structural Dynamics, 30(2):149–171. citedBy (since 1996)182.
[13] Cornwell, P., Farrar, C., Doebling, S., and Sohn, H. (1999). Environmental variability of modalproperties. Experimental Techniques, 23(6):45–48.
Table 1: Statistical analysis on regression parameters for ω1 on NBeam e (mm) Reg. P. Value SE t-value t-crit. p 95% CI
B1 0 α0,1 68.6585 2.0515 33.4680 1.9672 0.0000 (64.6228,72.6942)α1,1 0.0033 0.0204 0.1635 1.9672 0.8702 (-0.0368,0.0434)
B2 +13 α0,2 72.0282 0.3415 210.9027 1.9672 0.0000 (71.3563,72.7000)α1,2 0.0025 0.0029 0.8589 1.9672 0.3910 (-0.0032,0.0082)
B3 +26 α0,3 71.8116 0.4017 178.7481 1.9672 0.0000 (71.0213,72.6020)α1,3 0.0035 0.0034 1.0310 1.9672 0.3033 (-0.0031,0.0101)
B4 +39 α0,4 71.1915 0.3728 190.9584 1.9672 0.0000 (70.4581,71.9249)α1,4 -0.0043 0.0031 -1.3659 1.9672 0.1729 (-0.0104,0.0019)
B5 +52 α0,5 67.6526 0.5805 116.5487 1.9672 0.0000 (66.5107,68.7946)α1,5 0.0211 0.0049 4.2831 1.9672 0.0000 (0.0114,0.0307)
B6 -13 α0,6 66.1165 0.4804 137.6213 1.9672 0.0000 (65.1714,67.0616)α1,6 0.0059 0.0040 1.4877 1.9672 0.1378 (-0.0019,0.0138)
B7 -26 α0,7 69.1750 0.4050 170.8070 1.9675 0.0000 (68.3782,69.9718)α1,7 0.0450 0.0034 13.2705 1.9675 0.0000 (0.0383,0.0516)
B8 -39 α0,8 70.5274 0.7308 96.5109 1.9672 0.0000 (69.0898,71.9649)α1,8 0.0172 0.0061 2.8070 1.9672 0.0053 (0.0051,0.0292)
B9 -52 α0,9 66.3616 0.6663 99.5991 1.9672 0.0000 (65.0509,67.6724)α1,9 -0.0032 0.0054 -0.5856 1.9672 0.5586 (-0.0137,0.0074)