Embed Size (px)
Citation preview
8/29/2018 1
Outlook/Visi Pengembangan Industri Kopi, Kakao serta Industri Pengolahannya Lainnya
Forum Diskusi Pengembangan Industri dan Rantai Nilai Global: Pelajaran dari Sektor Kopi dan Kakao
Jakarta , 28 August 2018
Adhi LukmanChairman of Indonesian Food and Beverage Industry Association

DEVELOPMENT OF FOOD INDUSTRYTowards GVC

The 4th largest population.
261.9 millions (June, 2017)
GDP 1.004 Trillions USD
(2017)*
GDP growth 5.27%
(YoY-Q2-2018)
Inflation 3.12 % (YoY
Q2-2018)
Expenditure/capita
-Food 50.62 %-Processed food 17.15 %
of GDP (2017)
GDP per capita 3,876 USD (2017)
Indonesia
The 2nd longest Coastline
99,000 KM
13,466 islands

Contribution to GDP by Island (Q2-2018)

Arah Pembangunan Industri Nasional

5.61 % 4.84 %4.43 %5.05 %
5.32% 6.14 %5.97 %5.61 %
9.49% 9.23 %8.33 %7.54 %
4.41 %
2014 2015 2016 2017 2018 Q2
All About Food Industry (Source: BPS – MoI)
Non-Oil Industry Sector growth
Contribution Food
Industry to Total GDP
Food Industry growth
8.67 %

F&B is the Biggest Contributor to Public Consumption

F&B Industry (Source: BPS)
Category
2014 2015 Growth
Medium - Large Small & Micro Medium - Large Small & Micro Medium - Large Small & Micro
Food 877,771 2,324,212 719,116 3,664,208 (18.07) 57.65
Beverages 52681 81,027 46,379 85,167 (11.96) 5.11
Total 930,452 2,405,239 765,495 3,749,375 (17.73) 55.88
% 27.89 72.11 16.95 83.05
Category
2014 2015 Growth
Medium - Large Small & Micro Medium - Large Small & Micro Medium - Large Small & Micro
Food 5,794 1,198,491 5,438 1,567,019 (6.14) 30.75
Beverages 374 44,694 310 47,130 (17.11) 5.45
Total 6,168 1,243,185 5,748 1,614,149 (6.81) 29.84
% 0.49 99.51 0.35 99.65
Workers Engaged
Number of Establishment Source : BPS

All About Food Industry: F&B Investment Realization
Source: BKPM
Investment in F&B industry sector 2017: ➢DDI grow around 20% ➢FDI grow minus 7%
INVESTMENT
2014 2015 2016 2017
P I P I P I P I
DDI 493 19,596.39 879 24,533.99 1,169 32,028.50 1,419 38,540.10
(Rp. Billions)
FDI 1,054 3,139.60 886 1,521.18 1,947 2,115.00 1,649 1,970.30
(USD million)
Total 1,547 1,765 3,116 3,068

FDI Food Industry 586.7 Million USD


8/29/2018 12
Ease Of Doing
Business Index 2018
# 72 of 190 (91 of 190) Countries
#6 in ASEAN
The Global Competitiveness Index
2017 – 2018
36 of 137(41 of 138)Countries
#4 in ASEAN
LogisticPerformance Index 201846 0f 167
(63 of 160)Countries
#5 in ASEAN
Labor Productivity per worker GDP 2012
#4 in ASEAN
Global Food Security
Index 2017
69 of 113 Countries
(71 of 113)#5 in
ASEAN
The Global Innovation Index 2017
87 of 127 Countries
#5 in ASEAN
INDONESIA in the World Rank

Trade Balance of Semi processed & Processed Food in 2014-2018 (April)In USD . Source: BPS/ Ministry of Trade
Export Import Balanced
2014 2015 2016 2017 2018 Apr 2014 2015 2016 2017 2018 Apr 2014 2015 2016 2017 2018 Apr
6.353.427.439 6.002.001.194 6.152.058.092 6.504.683.113 2.256.021.3667.304.062.157 6.278.094.256 7.063.688.813 7.807.647.063 2.418.132.060 -950.634.718 -276.093.062 -911.630.721 -1.302.963.950 -162.110.694
Export Import Balanced
Country 2014 2015 2016 2017 2018 Apr 2014 2015 2016 2017 2018 Apr 2014 2015 2016 2017 2018 Apr
MALAYSIA 813.305.570 785.566.583 735.289.971 704.925.394 225.357.729 392.852.447 331.810.997 386.036.415 489.775.664 179.240.439 420.453.123 453.755.586 349.253.556 215.149.730 46.117.290
PHILIPPINE 456.899.018 468.351.572 558.369.049 612.528.900 218.608.110 29.956.751 25.143.725 29.910.789 37.799.770 16.654.838 426.942.267 443.207.847 528.458.260 574.729.130 201.953.272
SINGAPORE 309.196.623 268.166.469 284.789.030 314.471.812 118.828.186 215.983.590 186.202.973 184.752.627 200.305.955 79.957.477 93.213.033 81.963.496 100.036.403 114.165.857 38.870.709
VIETNAM 223.762.918 231.197.147 295.497.627 291.108.463 74.929.255 24.189.870 49.755.636 37.885.175 57.933.920 27.556.694 199.573.048 181.441.511 257.612.452 233.174.543 47.372.561
CAMBODIA 307.079.757 271.217.783 284.468.926 287.720.284 83.603.973 18.170 22.817 404.570 375.905 3.518 307.061.587 271.194.966 284.064.356 287.344.379 83.600.455
THAILAND 187.767.449 186.750.794 203.284.548 203.982.509 77.184.143 870.044.570 856.477.952 1.134.814.892 1.361.172.913 456.101.626 -682.277.121 -669.727.158 -931.530.344 -1.157.190.404 -378.917.483
BRUNEI DARUSSALAM
13.244.236 13.901.646 14.187.345 12.240.986 4.107.817 0 0 0 1.110 200 13.244.236 13.901.646 14.187.345 12.239.876 4.107.617
MYANMAR 10.596.204 14.715.019 23.578.338 49.709.705 23.032.039 2.463.692 3.879.744 4.170.781 3.142.794 1.430.350 8.132.512 10.835.275 19.407.557 46.566.911 21.601.689
LAOS 123.094 152.381 184.638 352.296 12.066 50.617.818 741.902 54.885 463.261 0 -50.494.724 -589.521 129.753 -110.965 12.066
Indonesia – World
Indonesia – ASEAN
Indonesia – RECP plus
Indonesia -RCEP + Canada
Export Import Balanced
Country 2014 2015 2016 2017 2018 Apr 2014 2015 2016 2017 2018 Apr 2014 2015 2016 2017 2018 Apr
JAPAN 250,862,770 226,707,352 227,329,602 240,348,838 83,434,444 19,085,240 19,799,056 20,536,360 23,274,284 7,711,607 231,777,530 206,908,296 206,793,242 217,074,554 75,722,837
PR of CHINA 284,715,924 311,181,650 329,740,193 395,041,597 112,644,081 711,277,907 560,982,575 742,865,199 806,769,405 251,893,438 (426,561,983) (249,800,925) (413,125,006) (411,727,808) (139,249,357)
SOUTH KOREA 266,142,310 149,784,454 172,942,833 175,333,109 65,679,641 107,400,680 99,083,843 104,660,674 123,625,210 46,582,927 158,741,630 50,700,611 68,282,159 51,707,899 19,096,714
NEW ZEALAND 191,879,150 130,146,361 114,830,423 155,949,061 56,031,924 79,783,943 64,563,264 54,751,252 51,735,039 12,469,782 112,095,207 65,583,097 60,079,171 104,214,022 43,562,142
AUSTRALIA 156,792,692 171,938,542 152,890,834 165,231,710 65,408,877 534,128,428 511,516,419 525,902,863 420,569,925 64,325,050 (377,335,736) (339,577,877) (373,012,029) (255,338,215) 1,083,827
INDIA 73,159,685 80,753,824 89,522,434 90,066,304 39,358,441 177,847,853 90,199,505 80,040,579 93,853,422 41,968,885 (104,688,168) (9,445,681) 9,481,855 (3,787,118) (2,610,444)
CANADA 33,980,315 34,396,421 62,674,691 66,216,684 20,170,699 50,441,403 25,209,561 12,095,506 9,855,771 3,983,881 (16,461,088) 9,186,860 50,579,185 56,360,913 16,186,818

Trade Balance of Semi processed & Processed Food in 2014-2018 (April)In USD . Source: BPS/ Ministry of Trade
Huge Export Potential To Be Explored
(1,400,000,000)
(1,200,000,000)
(1,000,000,000)
(800,000,000)
(600,000,000)
(400,000,000)
(200,000,000)
0
200,000,000
400,000,000
600,000,000
800,000,000
USD
2014 2015 2016 2017 2018 Apr
Indonesia – ASEAN

(500,000,000)
(400,000,000)
(300,000,000)
(200,000,000)
(100,000,000)
0
100,000,000
200,000,000
300,000,000
JAPAN PR of CHINA SOUTH KOREA NEW ZEALAND AUSTRALIA INDIA TAIWAN CANADA
2014 2015 2016 2017 2018 Apr
Trade Balance of Semi processed & Processed Food in 2014-2018 (April)In USD . Source: BPS/ Ministry of Trade
Huge Export Potential To Be Explored
Indonesia – RECP ++

State of the Global Islamic Economy (GIE) Report 2017/2018(73 Countries) by Thomson Reuters

Challenges Along the Food Supply Chain
Competitiveness
TariffQuality
Nutrition
Healthier Choice
HALAL
Standard
Label
Regulation & Govt Policy
Logistic
Time delivery
Ethnic &
Habits.
Resources
Innovation
Disruptive Economic
Big Data
Food loss
Food waste
Profitability
Added Value

Cost related to raw material import, export , energy, logistic, etc.

Opportunity to Canada

The Three Stages of Export Preparation to Canada
Source: TPSA
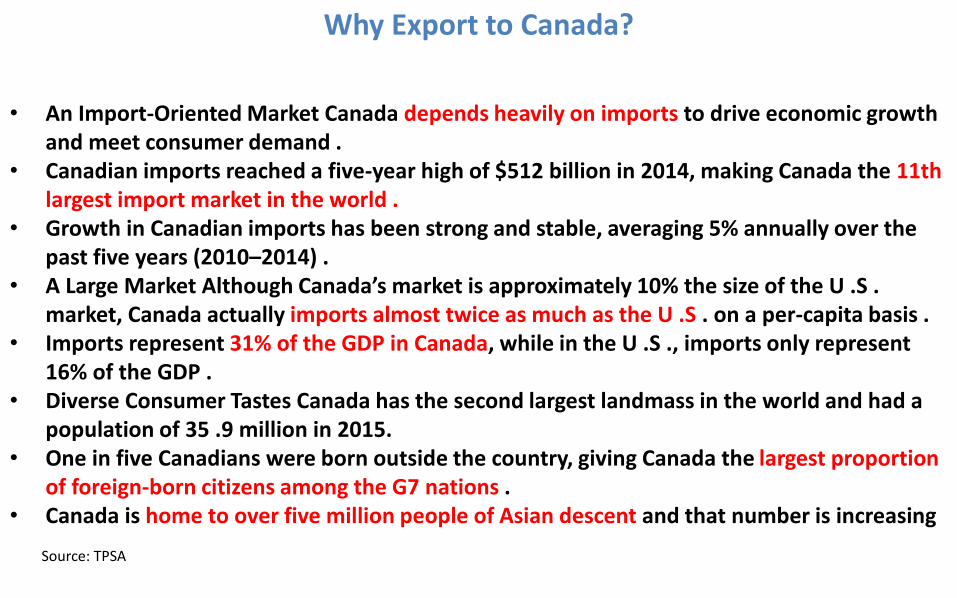
• An Import-Oriented Market Canada depends heavily on imports to drive economic growth and meet consumer demand .
• Canadian imports reached a five-year high of $512 billion in 2014, making Canada the 11th largest import market in the world .
• Growth in Canadian imports has been strong and stable, averaging 5% annually over the past five years (2010–2014) .
• A Large Market Although Canada’s market is approximately 10% the size of the U .S . market, Canada actually imports almost twice as much as the U .S . on a per-capita basis .
• Imports represent 31% of the GDP in Canada, while in the U .S ., imports only represent 16% of the GDP .
• Diverse Consumer Tastes Canada has the second largest landmass in the world and had a population of 35 .9 million in 2015.
• One in five Canadians were born outside the country, giving Canada the largest proportion of foreign-born citizens among the G7 nations .
• Canada is home to over five million people of Asian descent and that number is increasing
Why Export to Canada?
Source: TPSA

• Canada’s multiculturalism also influences mainstream consumer tastes . • A Strong Economy, grew by 2 .4% in 2014, and inflation rates have remained below 3% for
the past two decades . While Canada appeared to be entering a recession in mid-2015, the economy has remained stable and with a strong labour force .
• Increasing Exports from Southeast Asia to Canada. Exports from ASEAN countries to Canada have increased by 55% over the last 10 years . Canada’s overall imports only increased 35% in that same time period .
• A Strong Canada-Indonesia Partnership Indonesia and Canada have a long history of collaboration and cooperation .
Why Export to Canada?
Source: TPSA

Opportunities for Exporting to Canada (Agro-Food)
Source: TPSA *Normalized Revealed Comparative Advantage

Opportunities in Canada

Cocoa
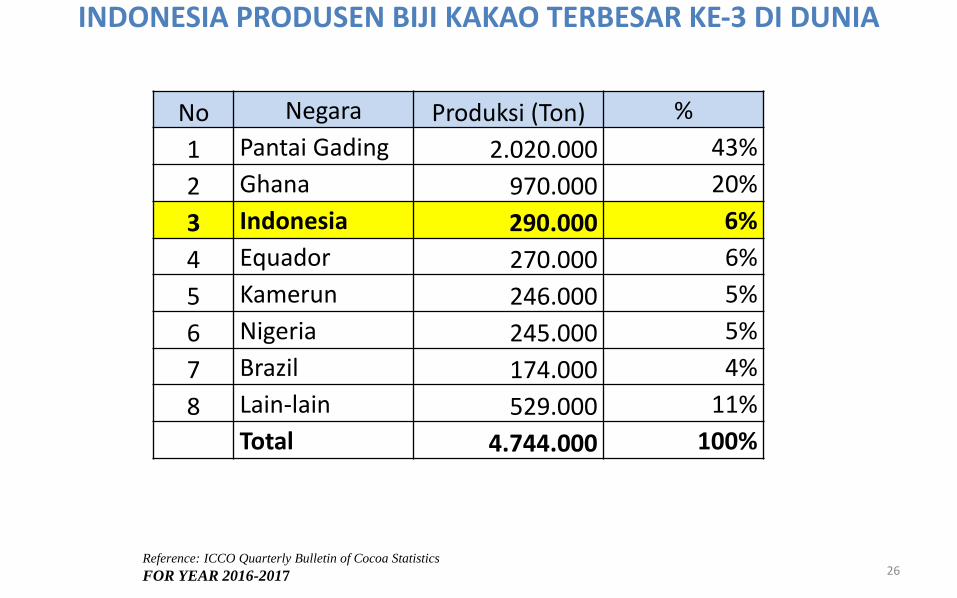
INDONESIA PRODUSEN BIJI KAKAO TERBESAR KE-3 DI DUNIA
Reference: ICCO Quarterly Bulletin of Cocoa Statistics
FOR YEAR 2016-2017
No Negara Produksi (Ton) %
1 Pantai Gading 2.020.000 43%
2 Ghana 970.000 20%
3 Indonesia 290.000 6%
4 Equador 270.000 6%
5 Kamerun 246.000 5%
6 Nigeria 245.000 5%
7 Brazil 174.000 4%
8 Lain-lain 529.000 11%
Total 4.744.000 100%
26

Proyeksi Demand & Supply Kakao Dunia
0
1
2
3
4
5
6
7
8
9
2014 2015 2016 2017 2018 2019 2020 2021 2022 2023 2024
supply
demand
price
( U
SD
00
0 )
(Demand & Supply in million tones)27

28
KONSUMSI KAKAO DUNIA per negara (kg/capita)
World cocoa demand continues to increase 2-4% every year or about 80.000 tons-160.000 tons/year.
Source : ICCO 2010 edited
11.56
10.519.72 9.44
8.498.16
7.26
6.37 6.34 6.21
0.25 0.04 0.030
2
4
6
8
10
12
14

PRODUSEN KAKAO OLAHAN DUNIA
(OOO TONS)
Source : ICCO Ouarterly Bulletin of Cocoa Statistic. 29
No. Negara 2010 2011 2012 2013 2014 2015 2016
2017
1 Pantai Gading 411 431 471 535 519 558 510 577
2 Belanda 525 500 535 540 530 508 520 565
3 Indonesia 150 270 310 324 340 335370 455
4 Jerman 361 407 402 415 530 415 440 410
5 USA 382 387 413 418 446 400 410 390
6 Brasil 226 242 241 245 240 224 228 227
7 Ghana 212 212 225 228 234 234 210 250
8 Malaysia 298 297 293 260 259 195190 216
9 Singapura 80 80 80 80 80 80 80 80
10 Lain-lain 1,086 1,146 1,141 1,217 1,157 1,203
1,202 1,230
Total 3,731 3,972 4,111 4,262 4,335 4,152 4,160 4,400

KAPASITAS INDUSTRI KAKAO INDONESIA
Tahun
Kap.
Terpasang
( Ton )
Kap.
Terpakai
( Ton )
Tingkat
Utilisasi
(%)
2007 345,000 159,934 46%
2008 345,000 172,827 50%
2009 345,000 130,054 38%
2010 360,000 151,420 42%
2011 560,000 268,000 48%
2012 660,000 310,000 47%
2013 735,000 324,000 44%
2014 765,000 392,000 51%
2015 800,000 414,000 52%
2016 800,000 392,000 49%
2017 800,000 465,000 58%30
Industri kakao berkembang
pesat sejak diterapkan bea
keluar biji kakao tahun 2010.
0
50,000
100,000
150,000
200,000
250,000
300,000
350,000
400,000
450,000
500,000
2007 2008 2009 2010 2011 2012 2013 2014 2015 2016 2017
Source: AIKI

31
MAPPING OF INDONESIAN COCOA INDUSTRY
Tangerang-Banten
PT. Golden Harvest Cocoa PT. Danora Agro Prima PT. Bumi Tangerang PT. Kakao Mas Gemilang PT. Mas Ganda
Sulawesi Tenggara
PT. Kalla Kakao Industry
Sulawesi Selatan
PT. Mars Symbiosience
PT. Unicom Kakao Makmur
PT. Makassar Berkat Kakao
PT. Kopi Jaya Kakao
PT. Hope Indonesia
Pt.Transmar Cocoa
PT. Barry – Comextra
Jawa Barat
PT. Papandayan Cocoa
IndustryJawa Timur
PT. Teja Sekawan Cocoa Ind
PT. Budidaya Kakao Lestari
PT. Jebe Koko
PT.Cargill Indonesia
Medan, Sumatera Utara
PT. Cocoa Ventures Indonesia
Batam
PT. Asia Cocoa Indonesia

Ekspor – Impor Kakao Indonesia
32
CommodityExport Import Balanced
2017 2018 Jun 2017 2018 Jun 2017 Juni 2018
Cocoa 1,120,251,807 559,832,864 646,337,454 365,052,431 473,914,353 194,780,433 Sumber: Basis Data Ekspor Impor Komoditi Pertanian, Kementerian Pertanian, Agustus 2018 (USD)
Tahun Volume (ton) Nilai ( USD )
2007 19.655 39.221.399
2008 22.968 59.573.565
2009 24.286 76.312.425
2010 24.831 89.497.057
2011 19.100 62.881.032
2012 23.943 62.977.883
2013 30.766 77.422.094
2014 109.409 341.437.411
2015 53.372 169.734.659
2016 61.015 184.667.284
2017 226.613 486.544.060
Sumber : BPS
Sejak 2014 Indonesia telah menjadi pengimpor biji kakao.
Volume dan Nilai impor Biji Kakao Indonesia
Tahun Biji Kakao Kakao Olahan
2010 432,000 103,055
2011 210,000 178,951
2012 163,500 196,479
2013 188,320 196,333
2014 63,330 240,967
2015 39,622 287,193
2016 28,329 273,057
2017 25,098 303,880
EKSPOR BIJI KAKAO & OLAHANNYA (ton)

NILAI DEVISA KOMODITI KAKAO
Tahun
2011 2012 2013 2014 2015 2016 2017
Devisa(USDMilyar)
1,40 0,99 1,09 1,09 1,27 1,19 1,07
Kakao penghasil devisa terbesar ketiga setelah sawit dan karet dalam sektor perkebunan.

Coffee

110
119
108
129
120
129
123
133137
148152
149152
157 158
113116
120123
129
133 132
136139
143
149152
155 155157
105
115
125
135
145
155
2003 3004 2005 2006 2007 2008 2009 2010 2011 2012 2013 2014 2015 2016 2017 *)
Pruduction
Consumption
35
WORLD COFFEE PRODUCTION & CONSUMPTION
Volume (billion bag)
Sumber : ICO. Tahun 2017 *)
Estimated

REGION 2012/13 2013/14 2014/15 2015/16 CAGR
Africa 10 470 10 597 10 754 10 794 1.0 %
Asia & Oceania 29 445 30 701 32 550 33 611 4.5 %
Central America & Mexico
5 200 5 156 5235 5306 0.7 %
Europe 50 028 50 179 50 912 51 590 1.0 %
North America 26 778 27 706 27 359 28 931 2.6 %
South America 25 042 24 682 24 949 25 237 0.3 %
WORLD TOTAL 146 964(8 817 840 Ton)
149 022(8 941 320 Ton)
151 758 (9 105 480 Ton)
155 469(9 328 140 Ton)
1.9 %
WORLD COFFEE CONSUMPTION, 2012/2013 – 2015/2016
In Thousand 60 kg bags
Source: ICO

No. NEGARA KONSUMSI TOTAL 2015/16 PERTUMBUHAN/TH (%) KONSUMSI/KAPITA
1 European Union 42 604 0,7 6,5 kg/th
2 USA 25 336 2,9 4,3 kg/th
3 Japan 7 790 1,9 3,4 kg/th
6 Russian Federation 4 303 6,9 1,8 kg/th
5 Canada 3 595 0,8 6,5 kg/th
6 Algeria 2 282 2,4 3,4 kg/th
7 South Korea 2 161 7,3 2,5 kg/th
8 Australia 1 720 3,2 4,3 kg/th
9 Saudi Arabia 1 566 7,6 2,9 kg/th
10 Turkey 1 106 10,5 0,9 kg/th
INDONESIA 4 500 (270 000 Ton) 4,9 1,1 kg/th
KONSUMSI KOPI 10 NEGARA PENGIMPOR KOPI TERBESAR
Dalam ribuan kantong 60 kg

Composition of World Coffee Production and The Position of Indonesia
38

Produksi Kopi di Indonesia (000 Ton)
PRODUKSI KOPI Indonesia
ACEH6%
SUMUT8%
SUMBAR 4%
JAWA TIMUR
8%
SULSEL5%
SUMSEL22%
LAMPUNG21%
BENGKULU9%
LAINNYA17%
Produksi kopi thn 2017 *) : 637.539 ton
ACEH
SUMUT
SUMBAR
JAWA TIMUR
SULSEL
SUMSEL
LAMPUNG
BENGKULU
LAINNYA
Sumber : Statistik Perkebunan Indonesia 2016Keterangan: *) Angka Sementara

1. Brazil: US$4.6 billion (14.1% of total coffee exports)
2. Vietnam: $3.5 billion (10.7%)
3. Germany: $2.64 billion (8.1%)
4. Colombia: $2.58 billion (7.9%)
5. Switzerland: $2.2 billion (6.9%)
6. Italy: $1.6 billion (5%)
7. Indonesia: $1.19 billion (3.6%)
8. Honduras: $1.16 billion (3.6%)
9. France: $1.07 billion (3.3%)
10. Belgium: $940.3 million (2.9%)
11. Ethiopia: $938 million (2.9%)
12. United States: $873.1 million (2.7%)
13. Netherlands: $754.1 million (2.3%)
14. Guatemala: $748.6 million (2.3%)
15. Peru: $707.2 million (2.2%)http://www.worldstopexports.co
m/coffee-exports-country/
The 15 Countries that
Exported the Highest
Dollar Value Worth Of
Coffee in 2017
vs

Source: BPS

Perkembangan Berat dan Nilai Ekspor Kopi, 2009-2016
Perkembangan Berat dan Nilai Impor Kopi, 2009-2016
Export – Import Coffee Indonesia
GVCKadang dibutuhkan import coffee bean untuk memenuhi demand dari Consumers (blending)

Berat Ekspor Kopi menurut Deskripsi HS, 2016
• Sebagian besarekspor mentah
• Nilai tambahrendah
Source: BPS

Source: MARKET RESEARCH REPORT (TPSA Feb, 2017)
Peluang Meningkatkan Ekspor Kopi keKanada masih Cukup Besar
• Canadian imports of Indonesian coffee climbed to $44.3 million last year (2017), an increase of 28% since 2014.
• Indonesia ranks as the sixth-largest supplier of coffee to Canada
https://biv.com/article/2018/05/initiative-aims-increase-indonesian-coffee-imports

Towards GVC

Raw Material:
• Availability, continuity and sustainability
• Quality, Time Delivery, Price competitiveness
• Planning upstream –downstream
• Regulations and government policies must support sustainable raw materials and business friendly
• Innovation is a must
Added Value Products:
• Market more open & difficult to stop Global Sourcing
• Competition is tougher• Food Products must be
innovative with new products to meet consumer’s needs and lifestyle
• Anticipation of rapid changes in the global market
• Disruptive economicThe food industry is still dependent on imported raw materials (semi processed) → intermediate industry

The Global Value Chain (GVC) Challenges
47
• Trade is no longer dominated by products, but in tasks and components.
• According to UNCTAD, 60% of global trade is in intermediate goods and services.
› Share of Foreign Value-Added in global exports is 28% (22% for food products)

What is Indonesia’s involvement in GVCs?
Indonesia is not currently well integrated into GVCs as yet ......
48 |
CountryForeign value-added content of exports
Korea 44
Malaysia 42
Mexico 32
Thailand 30
China 30
Indonesia 9

Why are Global Value Chains (GVC) Important?
49 |
• Industrial organisation (and economic opportunities for participation) is increasingly shaped by the actor practices of globally coordinated lead firms
• “There is a positive correlation between participation in GVCs and growth rates of GDP per capita. GVCs have a direct economic impact on value added, jobs and income.”
• “They can also be an important avenue for developing countries to build productive capacity, including through technology dissemination and skill building, thus opening up opportunities for longer-term industrial upgrading.”
(UNCTAD 2013 World Investment Report on Global Value Chains)

50|

IFIC operations
Foundation
IFIC
International Collaborations
Research Institutes
Other Industry
Associations
Food Association
GAPPMI/ Industry
Stakeholders Academia CSIRO/BI
C
Accreditation Org.
Go
vern
ance
Fun
din
g
Universities
IFIC Programs & Projects
Governance & Management
Service Revenues
THE STAKEHOLDERS, THE PROPOSED SCOPE: PROJECTS & PROGRAMS
G o I & Agencies Representatives
❑ Development Projects❑ Capacity Development ❑ Promotion Programs
❑ Information Services❑ Intermediary Services❑ One-on-One Projects ❑ Consortium Projects

It’s time..!

8/29/2018 53
Natural
Resources
Gov. Policy & other
supporting
ADDED VALUE PRODUCT,
SAFE , Halal
COMPETITIVE
CONSUMERS
What industry need? →Creating a Competitive Product to GVC
•Technology•Disruptive economic•Innovation•Consumer’s preference•Marketing
purpose

548/29/2018
Compliance to Regulation
The market between Indonesia-Canada is
complimentary
F & B trade between Indonesia and
Canada is still small
Innovative for Added Value
Competitiveness Technical assistance
What to do ? → Key to Success

8/29/2018 55
Thank you


![kakao[Kakao Driver auto pay] [Kakao Money transfer] [Billing service] Kakao Bank [Installment Saving] [FX transfer] • Kakao Pay subscribers 16.8 million, total transaction volume](https://img.pdfslide.us/doc/110x75/60bbbb1bb6cd3d06fc70e674/kakao-driver-auto-pay-kakao-money-transfer-billing-service-kakao-bank-installment.jpg)