Embed Size (px)
Citation preview
United StatesDepartmentof Agriculture
Electronic Outlook Report from the Economic Research Service and Foreign Agricultural Service
www.ers.usda.gov www.fas.usda.gov
Outlook for U.S. Agricultural Trade FY 2009 Agricultural Exports Forecast at $113 Billion; Imports Rise to Record $83 Billion
AES-59 August 28, 2008
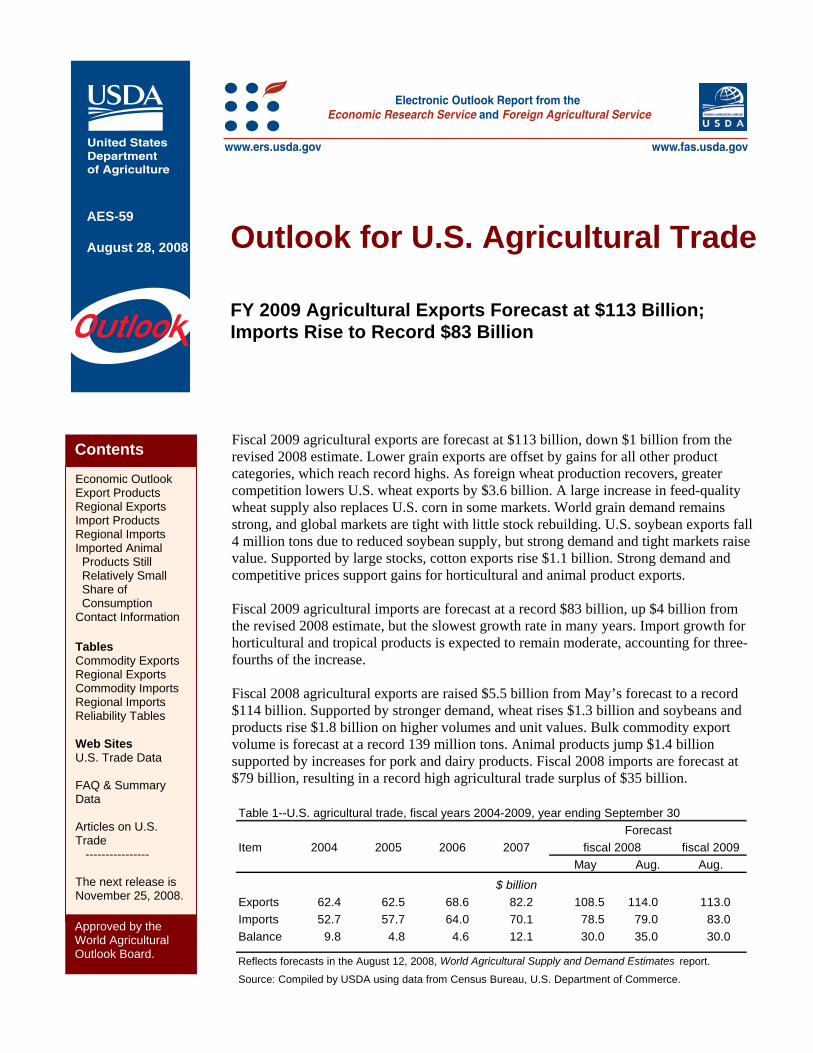
Fiscal 2009 agricultural exports are forecast at $113 billion, down $1 billion from the revised 2008 estimate. Lower grain exports are offset by gains for all other product categories, which reach record highs. As foreign wheat production recovers, greater competition lowers U.S. wheat exports by $3.6 billion. A large increase in feed-quality wheat supply also replaces U.S. corn in some markets. World grain demand remains strong, and global markets are tight with little stock rebuilding. U.S. soybean exports fall 4 million tons due to reduced soybean supply, but strong demand and tight markets raise value. Supported by large stocks, cotton exports rise $1.1 billion. Strong demand and competitive prices support gains for horticultural and animal product exports.
Approved by the World Agricultural Outlook Board.
Contents
Economic Outlook Export Products Regional Exports Import Products Regional Imports Imported Animal Products Still Relatively Small Share of Consumption Contact Information Tables Commodity Exports Regional Exports Commodity Imports Regional Imports Reliability Tables Web Sites U.S. Trade Data FAQ & Summary Data Articles on U.S. Trade ---------------- The next release is November 25, 2008.
Fiscal 2009 agricultural imports are forecast at a record $83 billion, up $4 billion from the revised 2008 estimate, but the slowest growth rate in many years. Import growth for horticultural and tropical products is expected to remain moderate, accounting for three-fourths of the increase. Fiscal 2008 agricultural exports are raised $5.5 billion from May’s forecast to a record $114 billion. Supported by stronger demand, wheat rises $1.3 billion and soybeans and products rise $1.8 billion on higher volumes and unit values. Bulk commodity export volume is forecast at a record 139 million tons. Animal products jump $1.4 billion supported by increases for pork and dairy products. Fiscal 2008 imports are forecast at $79 billion, resulting in a record high agricultural trade surplus of $35 billion.
Table 1--U.S. agricultural trade, fiscal years 2004-2009, year ending September 30
Item 2004 2005 2006 2007 fiscal 2009May Aug. Aug.
$ billionExports 62.4 62.5 68.6 82.2 108.5 114.0 113.0 Imports 52.7 57.7 64.0 70.1 78.5 79.0 83.0 Balance 9.8 4.8 4.6 12.1 30.0 35.0 30.0
Reflects forecasts in the August 12, 2008, World Agricultural Supply and Demand Estimates report.
Source: Compiled by USDA using data from Census Bureau, U.S. Department of Commerce.
fiscal 2008Forecast
Economic Outlook
2 Outlook for U.S. Agricultural Trade/AES-59/August 28, 2008
Economic Research Service, USDA
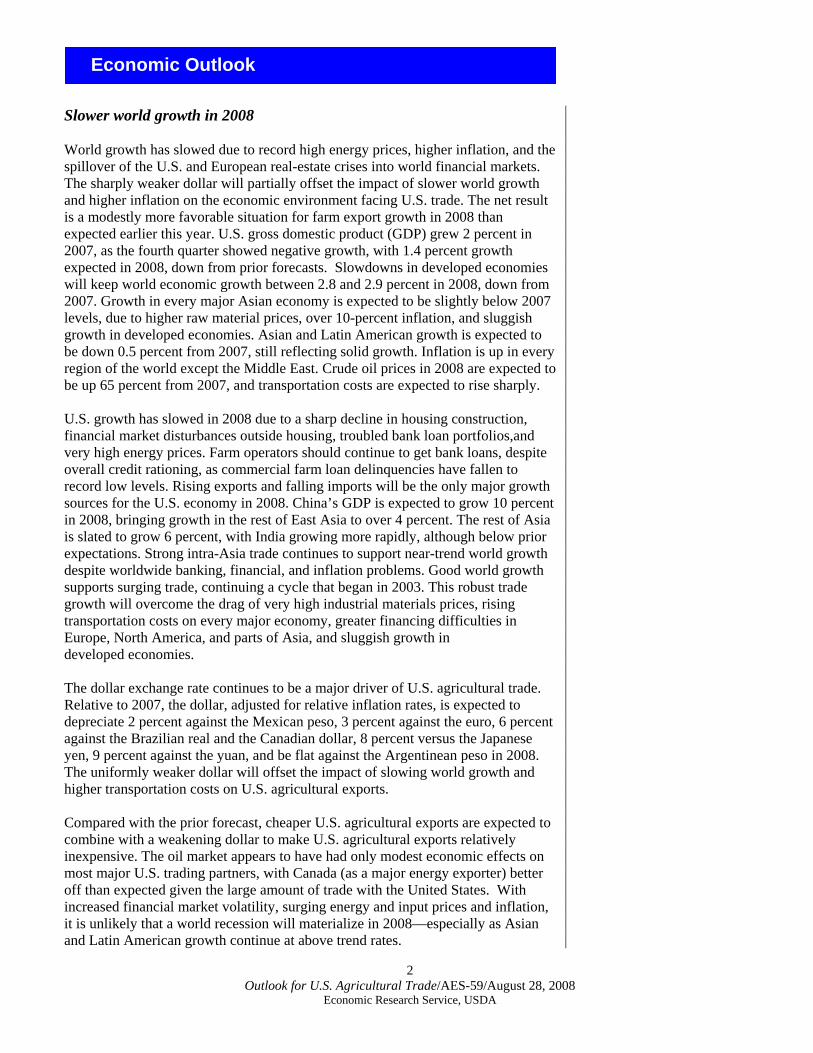
Economic Outlook Slower world growth in 2008 World growth has slowed due to record high energy prices, higher inflation, and the spillover of the U.S. and European real-estate crises into world financial markets. The sharply weaker dollar will partially offset the impact of slower world growth and higher inflation on the economic environment facing U.S. trade. The net result is a modestly more favorable situation for farm export growth in 2008 than expected earlier this year. U.S. gross domestic product (GDP) grew 2 percent in 2007, as the fourth quarter showed negative growth, with 1.4 percent growth expected in 2008, down from prior forecasts. Slowdowns in developed economies will keep world economic growth between 2.8 and 2.9 percent in 2008, down from 2007. Growth in every major Asian economy is expected to be slightly below 2007 levels, due to higher raw material prices, over 10-percent inflation, and sluggish growth in developed economies. Asian and Latin American growth is expected to be down 0.5 percent from 2007, still reflecting solid growth. Inflation is up in every region of the world except the Middle East. Crude oil prices in 2008 are expected to be up 65 percent from 2007, and transportation costs are expected to rise sharply. U.S. growth has slowed in 2008 due to a sharp decline in housing construction, financial market disturbances outside housing, troubled bank loan portfolios,and very high energy prices. Farm operators should continue to get bank loans, despite overall credit rationing, as commercial farm loan delinquencies have fallen to record low levels. Rising exports and falling imports will be the only major growth sources for the U.S. economy in 2008. China’s GDP is expected to grow 10 percent in 2008, bringing growth in the rest of East Asia to over 4 percent. The rest of Asia is slated to grow 6 percent, with India growing more rapidly, although below prior expectations. Strong intra-Asia trade continues to support near-trend world growth despite worldwide banking, financial, and inflation problems. Good world growth supports surging trade, continuing a cycle that began in 2003. This robust trade growth will overcome the drag of very high industrial materials prices, rising transportation costs on every major economy, greater financing difficulties in Europe, North America, and parts of Asia, and sluggish growth in developed economies. The dollar exchange rate continues to be a major driver of U.S. agricultural trade. Relative to 2007, the dollar, adjusted for relative inflation rates, is expected to depreciate 2 percent against the Mexican peso, 3 percent against the euro, 6 percent against the Brazilian real and the Canadian dollar, 8 percent versus the Japanese yen, 9 percent against the yuan, and be flat against the Argentinean peso in 2008. The uniformly weaker dollar will offset the impact of slowing world growth and higher transportation costs on U.S. agricultural exports. Compared with the prior forecast, cheaper U.S. agricultural exports are expected to combine with a weakening dollar to make U.S. agricultural exports relatively inexpensive. The oil market appears to have had only modest economic effects on most major U.S. trading partners, with Canada (as a major energy exporter) better off than expected given the large amount of trade with the United States. With increased financial market volatility, surging energy and input prices and inflation,it is unlikely that a world recession will materialize in 2008—especially as Asian and Latin American growth continue at above trend rates.
Economic Outlook
3 Outlook for U.S. Agricultural Trade/AES-59/August 28, 2008
Economic Research Service, USDA
Looking ahead to 2009 The situation in 2009 suggests a far less favorable environment for agricultural export growth. The United States is expected to continue into another year of subpar growth, in the range of 1 to 1.4 percent. The world is slated to grow between 2.3 and 2.4 percent, as European and Japanese growth are expected to come in below trend at 1 percent. Several European economies may be in recessions in early 2009. The effects of higher core inflation will cause the European central bank to keep interest rates high, curtailing growth. The good news is that energy prices should increase only modestly, with crude oil prices rising 5 percent, easing inflationary pressures. As the U.S. economy strengthens in the second half of 2009, the Federal Reserve will raise short-term interest rates, strengthening the dollar. U.S. growth will slow further in early 2009 due to continuing sluggish housing construction, higher long-term interest rates, near peak energy prices, and weaker consumer spending. Modestly higher exports and falling imports will again be the only major growth sources for the U.S. economy in early 2009. As the domestic economy picks up, the trade sector will be neutral—neither adding to nor subtracting from overall growth. China’s GDP is expected to grow 8 percent in 2009, as exports to the developed world slow sharply, bringing growth in the rest of East Asia below 4 percent. The rest of Asia is slated to grow about 5 percent, with Indian growth slowing to about 6 percent—below the strong growth of recent years. Strong growth in total world trade seen over the last 5 years will slow as world growth drops below trend. Latin American growth will slow to below 4 percent as Argentina and Brazil slow from the 5 percent pace of 2008. The lagged impacts of high materials costs, rising transportation costs, greater financing difficulties in Europe, North America, and Asia, and even more sluggish growth in developed economies, will bring world GDP and trade growth below trend. These factors will constrain U.S. agricultural exports. While still relatively weak by historical standards, the real value of the dollar will modestly appreciate as the dollar strengthens 3 percent against the Canadian dollar. Relative to 2008, the dollar, adjusted for relative inflation rates, is expected to appreciate 1 percent against the euro and the Brazilian real, 2 percent against the Mexican peso, and 3 percent against the Argentinean peso. The dollar will depreciate 4 percent versus the yuan and the Japanese yen in 2008. The risk of a worldwide recession is much higher in 2009 due largely to the sharp growth slowdown in Europe and Japan and high inflation worldwide.
4 Outlook for U.S. Agricultural Trade/AES-59/August 28, 2008
Economic Research Service, USDA
Export Products Grain and feed exports are forecast at $32.2 billion in fiscal 2009, down $4.8 billion from record 2008 exports. Nearly all the decline is due to significant decreases in wheat volume and unit values. A sharp drop in corn shipments is also expected, but value should drop less as unit values are expected higher. Rice export volume remains unchanged, but value rises on higher unit values. Fiscal 2009 wheat exports are forecast to decline $3.6 billion from 2008 due to a 5.7-million-ton decrease and a 15-percent drop in average unit value. Foreign crop recoveries lead to increased competition, but markets will remain tight. Europe’s exportable supply recovers, records are forecast for Ukraine and Russia, and Australia’s crop is expected to return to pre-drought levels. Foreign supplies of lower protein wheat will be especially large, but somewhat tighter markets for high-protein wheat could support increased U.S. hard wheat exports. World demand will remain strong, with especially strong import demand from drought-stricken areas in the Middle East. Only limited stock rebuilding will occur, as global markets are expected to remain tight. No government export restrictions are expected. While projected down 20 million metric tons, the 2008/09 domestic corn crop is the second-largest on record. This supports both domestic ethanol production and exports. However, an abundance of feed quality wheat in Russia, Ukraine, and the European Union (EU), and increased foreign corn and barley production, reduce opportunities for U.S. corn and sorghum exports. U.S. corn exports are forecast to fall from the current-year estimate to 50 million tons, but value only falls about $600 million with unit values expected to strengthen. Sorghum shipments fall largely due to lower sales to the EU. With export volume unchanged from the revised current-year estimate of 4.1 million tons, rice is forecast to reach $2.2 billion in fiscal 2009 due to higher unit values. Higher average world prices reflect continued export restrictions in Egypt and India. Higher U.S. sales to parts of Latin America and the South Pacific should be offset by decreased sales elsewhere. The fiscal 2008 forecast for grain and feed exports is raised $1.7 billion from the May estimate to a record $37 billion, with wheat accounting for the largest revision. Wheat exports are increased $1.3 billion supported by a 1.7 million-ton increase and higher unit values. Global demand, particularly from North Africa, has remained stronger than expected. Corn shipments are lowered 2 million tons, reflecting increased competition from Argentina, India, and Ukraine. However, export value is increased due to higher unit values. Rice is lowered $350 million due to lower unit values even though volume is raised with increased sales to Latin America. Despite foreign government policies initially expected to severely limit exports, trade has continued in the form of government sales. These sales have relaxed concerns over the availability of exportable supplies, allowing prices to moderate in recent months. Fiscal 2009 oilseed and product exports are forecast to reach a record $23 billion, a slight increase over this year. Soybean and product exports volumes are lower, but higher average unit values boost export value. Soybean exports are expected to rise to $15 billion with a 4-million ton decline in shipments more than offset by a 19 percent increase in average unit values. Volume is lower due to reduced U.S.
5 Outlook for U.S. Agricultural Trade/AES-59/August 28, 2008
Economic Research Service, USDA
soybean supply. Despite production increases, U.S. and global supplies remain tight given continued strong demand. Ending stocks relative to use are forecast toremain at historic lows. China’s demand for soybeans remains strong although growth will be slower in the coming year due to a rebound in domestic production. The fiscal 2008 forecast for oilseeds and products is raised $2 billion from the May estimate to a record $22.7 billion, with soybeans accounting for the largest revision. Soybean exports are raised to $14.4 billion on both higher export volume and average unit values. Stronger late-season sales, mostly to China, and record unit values led to the increase. Soybean meal and oil exports were also revised on volume and unit value increases. Soybean meal export volume is up mainly to the EU, Latin America, and Asia, while soybean oil sales growth is led by Mexico, China, and North Africa. Fiscal 2009 cotton exports are forecast at a record $5.9 billion, up $1.1 billion from the current-year estimate on equally large increases in volume and unit values. U.S. export volume is forecast to increase from the previous year to 3.3 million tons due to smaller foreign exportable supplies, and a large domestic supply supported by the largest carryover stocks in 40 years. The U.S. share of world trade is expected to rise, while U.S. ending stocks are forecast to fall by more than half from the previous year. Unit values are expected to rise as lower world production and rising import demand deplete world stocks. China remains the largest buyer and the largest source of demand growth. The fiscal 2008 forecast for cotton exports is lowered $300 million from May’s forecast to $4.8 billion, mainly due to a reduction in shipments now forecast at 3 million tons. Import demand in major U.S. markets such as China, Turkey, and Pakistan, has softened due to increased uncertainty about the global economic situation. Unit values remain firm, supported by a tighter market. Livestock, poultry, and dairy exports are forecast at a record $22.4 billion in fiscal 2009, as increased pork and beef export volumes more than offset lower dairy product sales. Pork exports are forecast up to a record 1.8 million tons valued at $4.6 billion. Most of the value gain is due to higher volume. Ample domestic supplies, a weak dollar, and competitive prices support continued expansion in key markets, namely China, Mexico, Russia, Canada, and Japan. Beef exports are forecast at 625,000 tons valued at $2.7 billion in 2009. The value increase is due to higher volumes, mostly to Mexico and Canada, which are supported by the competitive U.S. dollar. U.S. beef exports to South Korea are expected to gradually increase. Higher broiler meat unit value offsets a slight volume decrease leaving export value unchanged at $3.2 billion. U.S. poultry production slows constrained by higher feed costs, and demand from major markets could soften. Russia’s decision on import quotas will remain a factor. Following an estimated $1.5-billion export gain this year, dairy products are forecast to decline to $3.6 billion in 2009 due to both volume and unit value declines. Exportable supplies are expected to fall as the recent rapid expansion in U.S. milk production slows in response to higher feed costs. Furthermore, although dairy prices remain high by historical standards, they should moderate as milk production is expected to recover in Australia and New Zealand.
6 Outlook for U.S. Agricultural Trade/AES-59/August 28, 2008
Economic Research Service, USDA
The fiscal 2008 export estimate for livestock, poultry, and dairy products is increased $1.4 billion from the May estimate to a record $21.9 billion. This is mainly due to an upward revision for pork exports to a record $4.2 billion, and smaller increases for dairy products, broiler meat, and beef. Higher volumes, not unit values, drive increased export values. The pork export estimate is increased due to stronger than expected China import demand, driven by rising incomes and reduced domestic supplies. Based on a year-to-year comparison, the Chinese market, coupled with strong demand from traditional markets (like Japan, Mexico, Canada, and Russia), is set to boost pork exports an unprecedented 685,000 tons and $1.6 billion. Dairy exports are raised to a record $4 billion reflecting the strong pace of shipments, particularly for skimmed milk powder, butterfat, whey, and cheese. Drought in Australia and New Zealand coupled with strong demand in North American and Asian markets are key factors. Broiler exports are increased to $3.2 billion due to stronger demand from Russia, China, and Mexico, while beef exports are raised to $2.4 billion, on higher exports to Canada, Mexico, and Japan. The fiscal 2009 export forecast for horticultural products is a record $22.7 billion, $2 billion higher than the forecast for 2008, which is increased slightly since May. The increase for 2008 is mainly due to higher fresh and processed fruit and vegetable exports to Canada. The 2009 outlook assumes higher unit values will drive export value gains for some horticulture products while volumes will increase for others. Expanding demand for healthful and convenience foods in Canada, the EU, Mexico, and Japan continues to benefit U.S. horticultural exports. The growth rate is slower than in 2008, reflecting slower growth in many markets and generally stable exchange rates. Fresh fruit and vegetable exports are forecast at a record $6 billion for fiscal 2009, up $600 million from the revised 2008 estimate. Exports to Canada, and to a lesser extent Mexico and Japan, should continue to expand in terms of value and volume. Processed fruit and vegetable exports are forecast at $5.9 billion for fiscal 2009, up $600 million from the revised 2008 estimate. Exports of processed potato and tomato products to Canada, Mexico, and Japan should continue to accelerate, despite competition mainly from the EU and China. Fruit juice exports to Canada will continue to grow with little opposition, although exports to the EU and Japan face stiff competition from Brazil and China. Whole and processed tree nuts are forecast at $3.8 billion for fiscal 2009, up $300 million from the 2008 estimate. A record 2008 almond harvest is expected to support record almond export value with higher volume offsetting lower unit values. Other horticultural products, a large basket of processed products including essential oils, wine, and food preparations, account for the remaining $500-million gain for the category. Fiscal 2009 exports of sugar and tropical products, including coffee and cocoa products, are forecast at $4.2 billion, up $200 million from the revised 2008 estimate. Canada and Mexico typically account for about 60 percent of the sales for this category, and nearly all the value increase is due to higher volumes.
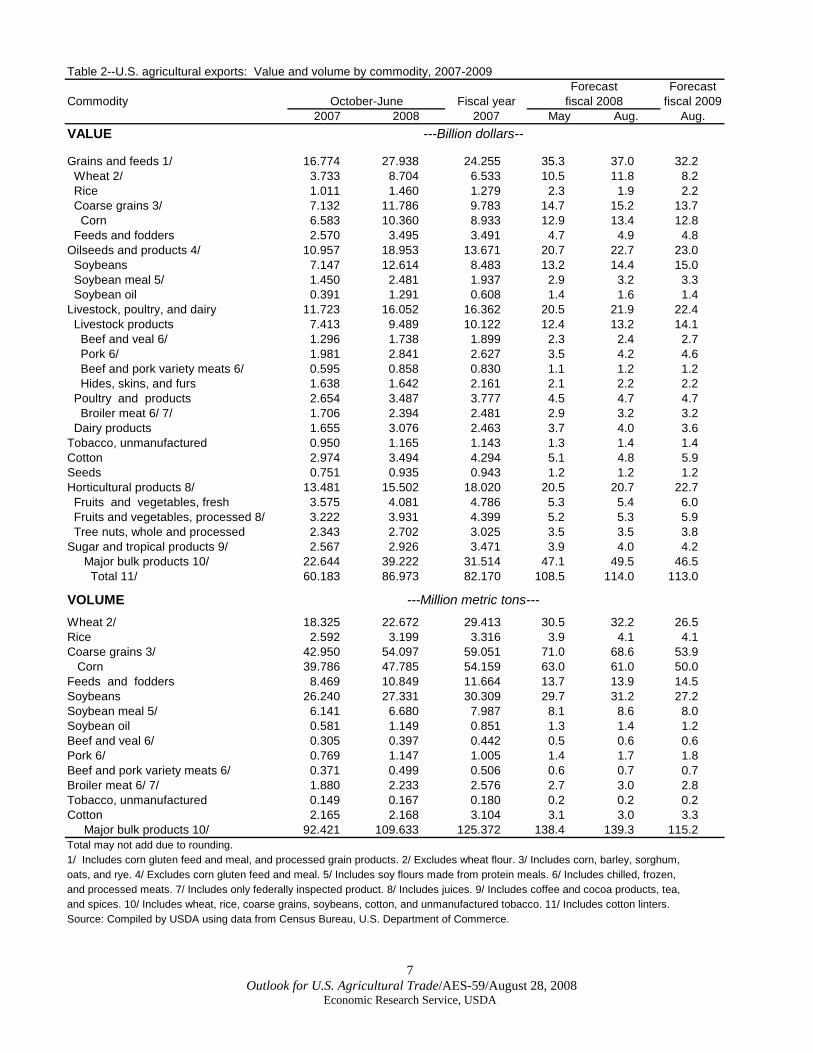
Table 2--U.S. agricultural exports: Value and volume by commodity, 2007-2009Forecast
Commodity Fiscal year fiscal 20092007 2008 2007 May Aug. Aug.
VALUE
Grains and feeds 1/ 16.774 27.938 24.255 35.3 37.0 32.2 Wheat 2/ 3.733 8.704 6.533 10.5 11.8 8.2 Rice 1.011 1.460 1.279 2.3 1.9 2.2 Coarse grains 3/ 7.132 11.786 9.783 14.7 15.2 13.7 Corn 6.583 10.360 8.933 12.9 13.4 12.8 Feeds and fodders 2.570 3.495 3.491 4.7 4.9 4.8 Oilseeds and products 4/ 10.957 18.953 13.671 20.7 22.7 23.0 Soybeans 7.147 12.614 8.483 13.2 14.4 15.0 Soybean meal 5/ 1.450 2.481 1.937 2.9 3.2 3.3 Soybean oil 0.391 1.291 0.608 1.4 1.6 1.4 Livestock, poultry, and dairy 11.723 16.052 16.362 20.5 21.9 22.4 Livestock products 7.413 9.489 10.122 12.4 13.2 14.1 Beef and veal 6/ 1.296 1.738 1.899 2.3 2.4 2.7 Pork 6/ 1.981 2.841 2.627 3.5 4.2 4.6 Beef and pork variety meats 6/ 0.595 0.858 0.830 1.1 1.2 1.2 Hides, skins, and furs 1.638 1.642 2.161 2.1 2.2 2.2 Poultry and products 2.654 3.487 3.777 4.5 4.7 4.7 Broiler meat 6/ 7/ 1.706 2.394 2.481 2.9 3.2 3.2 Dairy products 1.655 3.076 2.463 3.7 4.0 3.6 Tobacco, unmanufactured 0.950 1.165 1.143 1.3 1.4 1.4 Cotton 2.974 3.494 4.294 5.1 4.8 5.9 Seeds 0.751 0.935 0.943 1.2 1.2 1.2 Horticultural products 8/ 13.481 15.502 18.020 20.5 20.7 22.7 Fruits and vegetables, fresh 3.575 4.081 4.786 5.3 5.4 6.0 Fruits and vegetables, processed 8/ 3.222 3.931 4.399 5.2 5.3 5.9 Tree nuts, whole and processed 2.343 2.702 3.025 3.5 3.5 3.8 Sugar and tropical products 9/ 2.567 2.926 3.471 3.9 4.0 4.2 Major bulk products 10/ 22.644 39.222 31.514 47.1 49.5 46.5 Total 11/ 60.183 86.973 82.170 108.5 114.0 113.0
VOLUMEWheat 2/ 18.325 22.672 29.413 30.5 32.2 26.5 Rice 2.592 3.199 3.316 3.9 4.1 4.1 Coarse grains 3/ 42.950 54.097 59.051 71.0 68.6 53.9 Corn 39.786 47.785 54.159 63.0 61.0 50.0 Feeds and fodders 8.469 10.849 11.664 13.7 13.9 14.5 Soybeans 26.240 27.331 30.309 29.7 31.2 27.2 Soybean meal 5/ 6.141 6.680 7.987 8.1 8.6 8.0 Soybean oil 0.581 1.149 0.851 1.3 1.4 1.2 Beef and veal 6/ 0.305 0.397 0.442 0.5 0.6 0.6 Pork 6/ 0.769 1.147 1.005 1.4 1.7 1.8 Beef and pork variety meats 6/ 0.371 0.499 0.506 0.6 0.7 0.7 Broiler meat 6/ 7/ 1.880 2.233 2.576 2.7 3.0 2.8 Tobacco, unmanufactured 0.149 0.167 0.180 0.2 0.2 0.2 Cotton 2.165 2.168 3.104 3.1 3.0 3.3 Major bulk products 10/ 92.421 109.633 125.372 138.4 139.3 115.2 Total may not add due to rounding. 1/ Includes corn gluten feed and meal, and processed grain products. 2/ Excludes wheat flour. 3/ Includes corn, barley, sorghum, oats, and rye. 4/ Excludes corn gluten feed and meal. 5/ Includes soy flours made from protein meals. 6/ Includes chilled, frozen,and processed meats. 7/ Includes only federally inspected product. 8/ Includes juices. 9/ Includes coffee and cocoa products, tea,and spices. 10/ Includes wheat, rice, coarse grains, soybeans, cotton, and unmanufactured tobacco. 11/ Includes cotton linters.Source: Compiled by USDA using data from Census Bureau, U.S. Department of Commerce.
Forecastfiscal 2008October-June
---Million metric tons---
---Billion dollars--
7 Outlook for U.S. Agricultural Trade/AES-59/August 28, 2008
Economic Research Service, USDA
8 Outlook for U.S. Agricultural Trade/AES-59/August 28, 2008
Economic Research Service, USDA
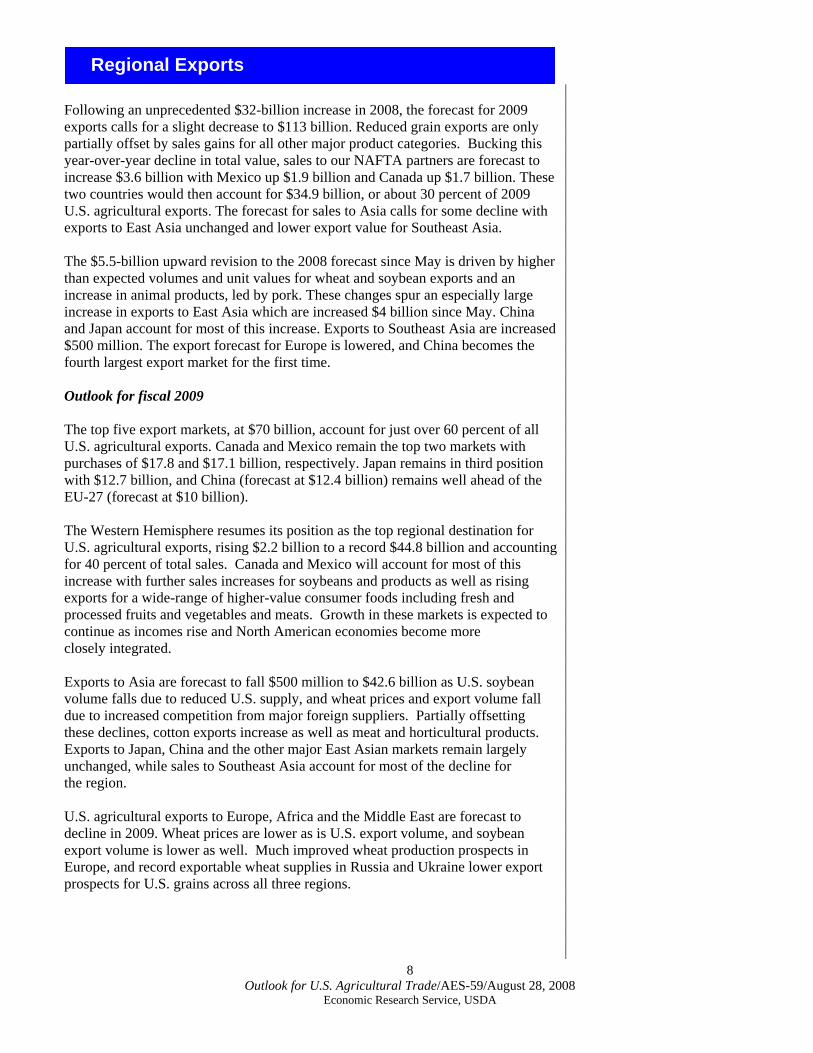
Regional Exports Following an unprecedented $32-billion increase in 2008, the forecast for 2009 exports calls for a slight decrease to $113 billion. Reduced grain exports are only partially offset by sales gains for all other major product categories. Bucking this year-over-year decline in total value, sales to our NAFTA partners are forecast to increase $3.6 billion with Mexico up $1.9 billion and Canada up $1.7 billion. These two countries would then account for $34.9 billion, or about 30 percent of 2009 U.S. agricultural exports. The forecast for sales to Asia calls for some decline with exports to East Asia unchanged and lower export value for Southeast Asia. The $5.5-billion upward revision to the 2008 forecast since May is driven by higher than expected volumes and unit values for wheat and soybean exports and an increase in animal products, led by pork. These changes spur an especially large increase in exports to East Asia which are increased $4 billion since May. China and Japan account for most of this increase. Exports to Southeast Asia are increased $500 million. The export forecast for Europe is lowered, and China becomes the fourth largest export market for the first time. Outlook for fiscal 2009 The top five export markets, at $70 billion, account for just over 60 percent of all U.S. agricultural exports. Canada and Mexico remain the top two markets with purchases of $17.8 and $17.1 billion, respectively. Japan remains in third position with $12.7 billion, and China (forecast at $12.4 billion) remains well ahead of the EU-27 (forecast at $10 billion). The Western Hemisphere resumes its position as the top regional destination for U.S. agricultural exports, rising $2.2 billion to a record $44.8 billion and accounting for 40 percent of total sales. Canada and Mexico will account for most of this increase with further sales increases for soybeans and products as well as rising exports for a wide-range of higher-value consumer foods including fresh and processed fruits and vegetables and meats. Growth in these markets is expected to continue as incomes rise and North American economies become more closely integrated. Exports to Asia are forecast to fall $500 million to $42.6 billion as U.S. soybean volume falls due to reduced U.S. supply, and wheat prices and export volume fall due to increased competition from major foreign suppliers. Partially offsetting these declines, cotton exports increase as well as meat and horticultural products. Exports to Japan, China and the other major East Asian markets remain largely unchanged, while sales to Southeast Asia account for most of the decline for the region. U.S. agricultural exports to Europe, Africa and the Middle East are forecast to decline in 2009. Wheat prices are lower as is U.S. export volume, and soybean export volume is lower as well. Much improved wheat production prospects in Europe, and record exportable wheat supplies in Russia and Ukraine lower export prospects for U.S. grains across all three regions.
9 Outlook for U.S. Agricultural Trade/AES-59/August 28, 2008
Economic Research Service, USDA
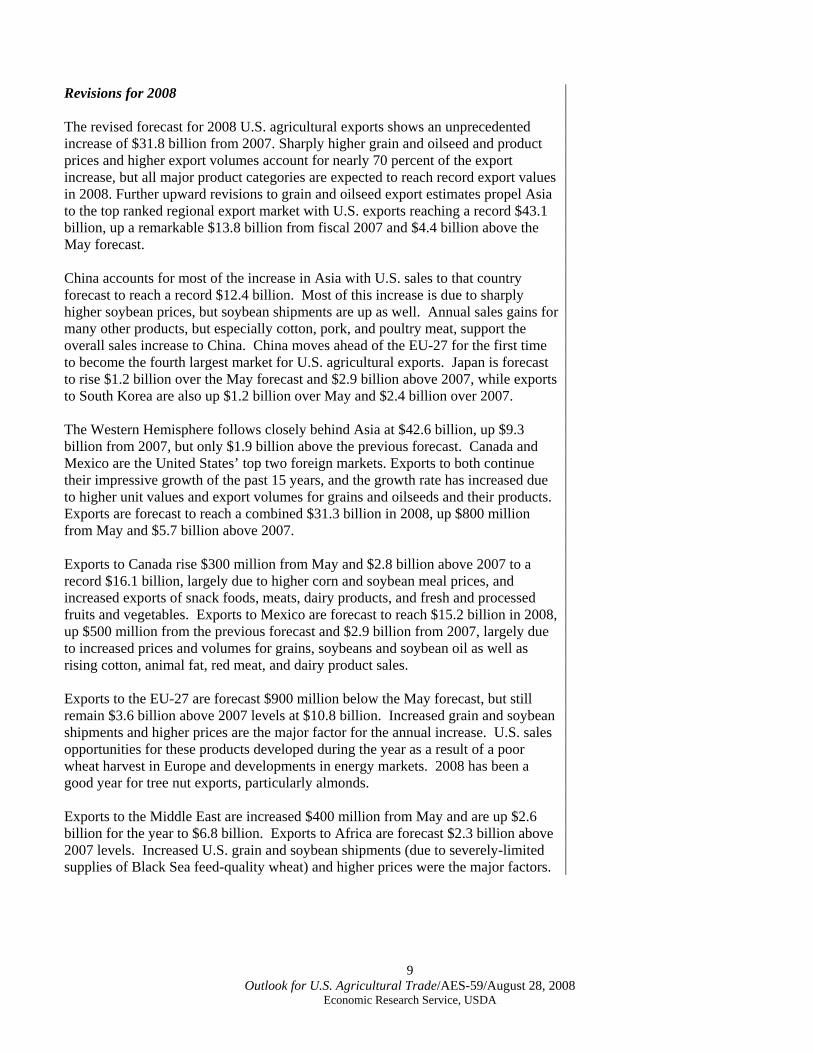
Revisions for 2008 The revised forecast for 2008 U.S. agricultural exports shows an unprecedented increase of $31.8 billion from 2007. Sharply higher grain and oilseed and product prices and higher export volumes account for nearly 70 percent of the export increase, but all major product categories are expected to reach record export values in 2008. Further upward revisions to grain and oilseed export estimates propel Asia to the top ranked regional export market with U.S. exports reaching a record $43.1 billion, up a remarkable $13.8 billion from fiscal 2007 and $4.4 billion above the May forecast. China accounts for most of the increase in Asia with U.S. sales to that country forecast to reach a record $12.4 billion. Most of this increase is due to sharply higher soybean prices, but soybean shipments are up as well. Annual sales gains for many other products, but especially cotton, pork, and poultry meat, support the overall sales increase to China. China moves ahead of the EU-27 for the first time to become the fourth largest market for U.S. agricultural exports. Japan is forecast to rise $1.2 billion over the May forecast and $2.9 billion above 2007, while exports to South Korea are also up $1.2 billion over May and $2.4 billion over 2007. The Western Hemisphere follows closely behind Asia at $42.6 billion, up $9.3 billion from 2007, but only $1.9 billion above the previous forecast. Canada and Mexico are the United States’ top two foreign markets. Exports to both continue their impressive growth of the past 15 years, and the growth rate has increased due to higher unit values and export volumes for grains and oilseeds and their products. Exports are forecast to reach a combined $31.3 billion in 2008, up $800 million from May and $5.7 billion above 2007. Exports to Canada rise $300 million from May and $2.8 billion above 2007 to a record $16.1 billion, largely due to higher corn and soybean meal prices, and increased exports of snack foods, meats, dairy products, and fresh and processed fruits and vegetables. Exports to Mexico are forecast to reach $15.2 billion in 2008, up $500 million from the previous forecast and $2.9 billion from 2007, largely due to increased prices and volumes for grains, soybeans and soybean oil as well as rising cotton, animal fat, red meat, and dairy product sales. Exports to the EU-27 are forecast $900 million below the May forecast, but still remain $3.6 billion above 2007 levels at $10.8 billion. Increased grain and soybean shipments and higher prices are the major factor for the annual increase. U.S. sales opportunities for these products developed during the year as a result of a poor wheat harvest in Europe and developments in energy markets. 2008 has been a good year for tree nut exports, particularly almonds. Exports to the Middle East are increased $400 million from May and are up $2.6 billion for the year to $6.8 billion. Exports to Africa are forecast $2.3 billion above 2007 levels. Increased U.S. grain and soybean shipments (due to severely-limited supplies of Black Sea feed-quality wheat) and higher prices were the major factors.
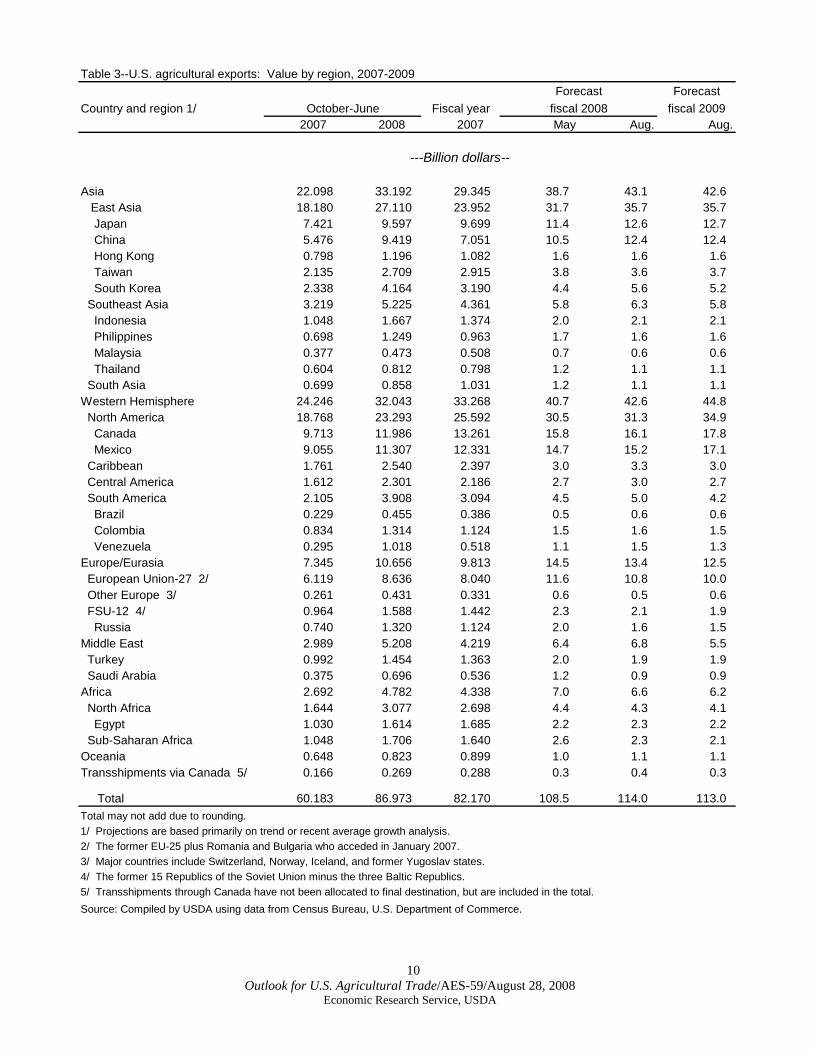
Table 3--U.S. agricultural exports: Value by region, 2007-2009Forecast
Country and region 1/ Fiscal year fiscal 20092007 2008 2007 May Aug. Aug.
Asia 22.098 33.192 29.345 38.7 43.1 42.6 East Asia 18.180 27.110 23.952 31.7 35.7 35.7 Japan 7.421 9.597 9.699 11.4 12.6 12.7 China 5.476 9.419 7.051 10.5 12.4 12.4 Hong Kong 0.798 1.196 1.082 1.6 1.6 1.6 Taiwan 2.135 2.709 2.915 3.8 3.6 3.7 South Korea 2.338 4.164 3.190 4.4 5.6 5.2 Southeast Asia 3.219 5.225 4.361 5.8 6.3 5.8 Indonesia 1.048 1.667 1.374 2.0 2.1 2.1 Philippines 0.698 1.249 0.963 1.7 1.6 1.6 Malaysia 0.377 0.473 0.508 0.7 0.6 0.6 Thailand 0.604 0.812 0.798 1.2 1.1 1.1 South Asia 0.699 0.858 1.031 1.2 1.1 1.1 Western Hemisphere 24.246 32.043 33.268 40.7 42.6 44.8 North America 18.768 23.293 25.592 30.5 31.3 34.9 Canada 9.713 11.986 13.261 15.8 16.1 17.8 Mexico 9.055 11.307 12.331 14.7 15.2 17.1 Caribbean 1.761 2.540 2.397 3.0 3.3 3.0 Central America 1.612 2.301 2.186 2.7 3.0 2.7 South America 2.105 3.908 3.094 4.5 5.0 4.2 Brazil 0.229 0.455 0.386 0.5 0.6 0.6 Colombia 0.834 1.314 1.124 1.5 1.6 1.5 Venezuela 0.295 1.018 0.518 1.1 1.5 1.3 Europe/Eurasia 7.345 10.656 9.813 14.5 13.4 12.5 European Union-27 2/ 6.119 8.636 8.040 11.6 10.8 10.0 Other Europe 3/ 0.261 0.431 0.331 0.6 0.5 0.6 FSU-12 4/ 0.964 1.588 1.442 2.3 2.1 1.9 Russia 0.740 1.320 1.124 2.0 1.6 1.5 Middle East 2.989 5.208 4.219 6.4 6.8 5.5 Turkey 0.992 1.454 1.363 2.0 1.9 1.9 Saudi Arabia 0.375 0.696 0.536 1.2 0.9 0.9 Africa 2.692 4.782 4.338 7.0 6.6 6.2 North Africa 1.644 3.077 2.698 4.4 4.3 4.1 Egypt 1.030 1.614 1.685 2.2 2.3 2.2 Sub-Saharan Africa 1.048 1.706 1.640 2.6 2.3 2.1 Oceania 0.648 0.823 0.899 1.0 1.1 1.1 Transshipments via Canada 5/ 0.166 0.269 0.288 0.3 0.4 0.3
Total 60.183 86.973 82.170 108.5 114.0 113.0 Total may not add due to rounding. 1/ Projections are based primarily on trend or recent average growth analysis.2/ The former EU-25 plus Romania and Bulgaria who acceded in January 2007.3/ Major countries include Switzerland, Norway, Iceland, and former Yugoslav states.4/ The former 15 Republics of the Soviet Union minus the three Baltic Republics.5/ Transshipments through Canada have not been allocated to final destination, but are included in the total.Source: Compiled by USDA using data from Census Bureau, U.S. Department of Commerce.
Forecastfiscal 2008October-June
---Billion dollars--
10 Outlook for U.S. Agricultural Trade/AES-59/August 28, 2008
Economic Research Service, USDA
Import Products
11 Outlook for U.S. Agricultural Trade/AES-59/August 28, 2008
Economic Research Service, USDA
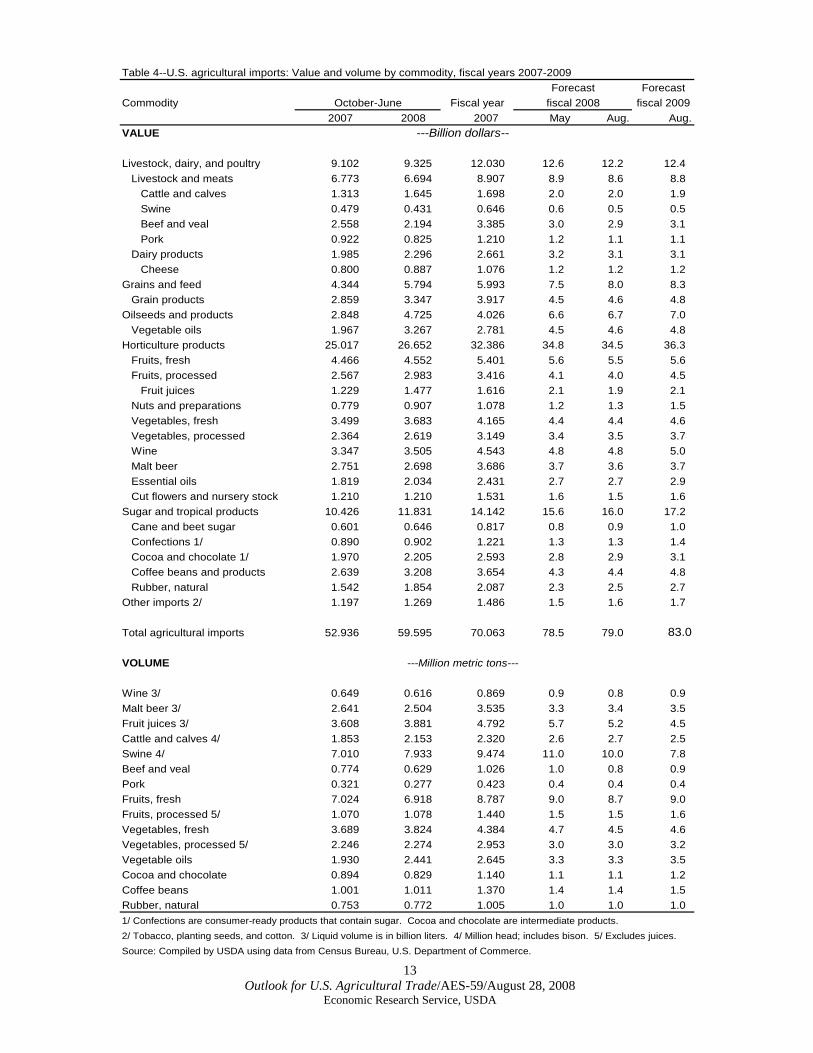
After 3 quarters in fiscal year 2008, U.S. agricultural imports are up 12.6 percent, of which 6 percent is driven by import volume and 6.6 percent is from higher import prices. This import price inflation is about the same as in 2005, but is still lower than the 10-percent inflation in 2003 and 2004 when the U.S. dollar’s exchange rate started depreciating against the currencies of U.S. suppliers. Based on year-to-date agricultural imports in 2008 relative to 2007, U.S. import value is projected to rise to $79 billion from $70.1 billion, a jump of 13 percent, of which at least 7 percent is attributed to higher import prices. Imports are not forecast to expand as sharply in 2009 as in 2008 because unit values for wheat are expected to fall, and vegetable oil prices are expected to moderate. In addition, horticultural import growth remains moderate. Total import value is forecast to climb to $83 billion, a 5-percent gain from 2008. Import demand for all products slows due to weakness in both the U.S. economy and domestic consumer spending. Prices of imported horticultural and tropical products and beverages are not anticipated to decline as world demand remains strong. Overall, imports will remain competitive with domestic agricultural products as domestic producer prices for food commodities (based on prices received by farmers) jumped by 18 percent in 2007 and are up thus far in 2008. Import unit values for horticultural products climbed only 5.5 percent in contrast to double-digit rates for most other imports. U.S. import demand for fresh and processed fruit, processed vegetables, wine, and beer has declined or was unchanged thus far in 2008. As a group, horticultural imports are up only 1 percent in volume thus far in 2008. Given that horticultural products make up 44 percent of U.S. agricultural import value, sharply lower demand (represented by volume) and slower price inflation for horticultural products helped slow down the growth of U.S. agricultural imports in 2008. Double-digit price inflation for imported processed fruits, including fruit juices, in 2007 and 2008 is the principal factor in the significantly lower import volume for processed fruit in 2008. Collectively, import volumes for fresh fruit, cut flowers, nursery stock, wine, and beer have declined thus far in 2008 despite relatively smaller price inflation. Import demand for fresh and processed vegetables, tree nuts, and essential oils shows positive growth, but this growth pales in comparison to demand for other imported crops such as bulk grains (except wheat), oilseeds and oilseed products, especially tropical vegetable oils, whose price gains are unprecedented. In 2009, imported horticultural products are forecast to grow 5 percent in value to $36.3 billion from $34.6 billion in 2008. The largest projected gains are for processed fruit and vegetables, in large part due to higher prices. Import demand for fruit juices, particularly orange, apple, and pineapple, remains strong despite double-digit price gains such as 54 percent for apple juice from China. However, import demand for fresh fruit in 2009 is projected to be weak due to boosted prices for noncitrus fruits in 2008. Higher prices for imported wine will likewise slow demand in 2009. The rapid escalation of wheat and wheat flour prices in 2007 and 2008 helped drive down demand for imported wheat and wheat products this year. Furthermore,
12 Outlook for U.S. Agricultural Trade/AES-59/August 28, 2008
Economic Research Service, USDA
higher domestic wheat production through 2009 will limit both its price and imports. Demand for rice is holding up thus far in 2008 because rice import unit values in 2007 were relatively low. Import demand for feed grains is surging in 2008 even as their prices increased at double-digit rates starting in 2007. Greater domestic and global production of oilseeds will lead to further price deterioration of vegetable oils, including tropical oils. Nevertheless, U.S. import value of vegetable oils will be up slightly in 2009 as import volume continues to expand. The 2009 forecast for livestock, dairy, and poultry imports is increased $200 million to $12.4 billion. Beef imports are expected to increase as U.S. cow slaughter declines and the U.S. dollar strengthens. Cattle and swine imports are projected down due to less exportable supplies from Canada and lower U.S. prices. Imported dairy products are unchanged in 2009 as weaker global dairy prices keep imports such as casein up, offsetting lower import value for cheese. Although the weak U.S. economy and higher world prices will slow down corresponding import demand for coffee, cocoa, rubber, and other tropical products, their import cost is still pushed up by $1.2 billion in 2009 after gaining $2 billion in 2008. Import volume gains for sugar, tea, herbs, natural drugs, and gums remained firm in 2008 as their prices have either retreated or have escalated modestly. U.S. import demand is relatively inelastic with respect to tropical and horticultural products which can neither be produced domestically nor supplied during the off-season.
13 Outlook for U.S. Agricultural Trade/AES-59/August 28, 2008
Economic Research Service, USDA
Table 4--U.S. agricultural imports: Value and volume by commodity, fiscal years 2007-2009Forecast
Commodity Fiscal year fiscal 20092007 2008 2007 May Aug. Aug.
VALUE
Livestock, dairy, and poultry 9.102 9.325 12.030 12.6 12.2 12.4 Livestock and meats 6.773 6.694 8.907 8.9 8.6 8.8 Cattle and calves 1.313 1.645 1.698 2.0 2.0 1.9 Swine 0.479 0.431 0.646 0.6 0.5 0.5 Beef and veal 2.558 2.194 3.385 3.0 2.9 3.1 Pork 0.922 0.825 1.210 1.2 1.1 1.1 Dairy products 1.985 2.296 2.661 3.2 3.1 3.1 Cheese 0.800 0.887 1.076 1.2 1.2 1.2 Grains and feed 4.344 5.794 5.993 7.5 8.0 8.3 Grain products 2.859 3.347 3.917 4.5 4.6 4.8 Oilseeds and products 2.848 4.725 4.026 6.6 6.7 7.0 Vegetable oils 1.967 3.267 2.781 4.5 4.6 4.8 Horticulture products 25.017 26.652 32.386 34.8 34.5 36.3 Fruits, fresh 4.466 4.552 5.401 5.6 5.5 5.6 Fruits, processed 2.567 2.983 3.416 4.1 4.0 4.5 Fruit juices 1.229 1.477 1.616 2.1 1.9 2.1 Nuts and preparations 0.779 0.907 1.078 1.2 1.3 1.5 Vegetables, fresh 3.499 3.683 4.165 4.4 4.4 4.6 Vegetables, processed 2.364 2.619 3.149 3.4 3.5 3.7 Wine 3.347 3.505 4.543 4.8 4.8 5.0 Malt beer 2.751 2.698 3.686 3.7 3.6 3.7 Essential oils 1.819 2.034 2.431 2.7 2.7 2.9 Cut flowers and nursery stock 1.210 1.210 1.531 1.6 1.5 1.6 Sugar and tropical products 10.426 11.831 14.142 15.6 16.0 17.2 Cane and beet sugar 0.601 0.646 0.817 0.8 0.9 1.0 Confections 1/ 0.890 0.902 1.221 1.3 1.3 1.4 Cocoa and chocolate 1/ 1.970 2.205 2.593 2.8 2.9 3.1 Coffee beans and products 2.639 3.208 3.654 4.3 4.4 4.8 Rubber, natural 1.542 1.854 2.087 2.3 2.5 2.7 Other imports 2/ 1.197 1.269 1.486 1.5 1.6 1.7
Total agricultural imports 52.936 59.595 70.063 78.5 79.0 83.0
VOLUME
Wine 3/ 0.649 0.616 0.869 0.9 0.8 0.9 Malt beer 3/ 2.641 2.504 3.535 3.3 3.4 3.5 Fruit juices 3/ 3.608 3.881 4.792 5.7 5.2 4.5 Cattle and calves 4/ 1.853 2.153 2.320 2.6 2.7 2.5 Swine 4/ 7.010 7.933 9.474 11.0 10.0 7.8 Beef and veal 0.774 0.629 1.026 1.0 0.8 0.9 Pork 0.321 0.277 0.423 0.4 0.4 0.4 Fruits, fresh 7.024 6.918 8.787 9.0 8.7 9.0 Fruits, processed 5/ 1.070 1.078 1.440 1.5 1.5 1.6 Vegetables, fresh 3.689 3.824 4.384 4.7 4.5 4.6 Vegetables, processed 5/ 2.246 2.274 2.953 3.0 3.0 3.2 Vegetable oils 1.930 2.441 2.645 3.3 3.3 3.5 Cocoa and chocolate 0.894 0.829 1.140 1.1 1.1 1.2 Coffee beans 1.001 1.011 1.370 1.4 1.4 1.5 Rubber, natural 0.753 0.772 1.005 1.0 1.0 1.0 1/ Confections are consumer-ready products that contain sugar. Cocoa and chocolate are intermediate products. 2/ Tobacco, planting seeds, and cotton. 3/ Liquid volume is in billion liters. 4/ Million head; includes bison. 5/ Excludes juices.Source: Compiled by USDA using data from Census Bureau, U.S. Department of Commerce.
---Billion dollars--
---Million metric tons---
ForecastOctober-June fiscal 2008
Regional Imports
14 Outlook for U.S. Agricultural Trade/AES-59/August 28, 2008
Economic Research Service, USDA
The 2009 forecast for $83 billion of imports is distributed by region and country according to respective import shares in 2008. After the EU, Canada, and Mexico, the top 10 suppliers of agricultural products to the U.S. are China, Brazil, Indonesia, Australia, Chile, New Zealand, Colombia, Thailand, Malaysia, and India. Each of these countries has already exported at least $1 billion of farm products to the U.S. in the first 3 quarters of fiscal 2008. U.S. agricultural imports in 2008 have grown fastest from less traditional sources and developing countries such as European countries outside the EU, from South Asia, Southeast Asia (due to vegetable oils and other tropical products), East Asia (China), and the former Soviet Union, including Central Asia (Eurasia). Among countries whose farm exports to the U.S. have expanded the most in the first 3 quarters of 2008 are India, Indonesia, Cote D’Ivoire, China, Guatemala, Thailand, Malaysia, Philippines, Vietnam, Peru, and Colombia. The suspension of the Doha Round of trade negotiations means that with respect to U.S. agricultural imports, countries with free trade agreements with the U.S. stand to benefit at the expense of countries that do not. The 21 countries that have existing or pending bilateral agreements made up about 54 percent of U.S. agricultural imports in 2008. Excluding Canada and Mexico, the other 19 free trade partners supply 17 percent of the U.S. agricultural import bill. Among these countries, the largest suppliers include countries of Central America that are signatories of the Central American Free Trade Agreement , Australia, Chile, Colombia, and Malaysia with at least $1 billion worth of products shipped to the U.S. thus far in fiscal 2008.
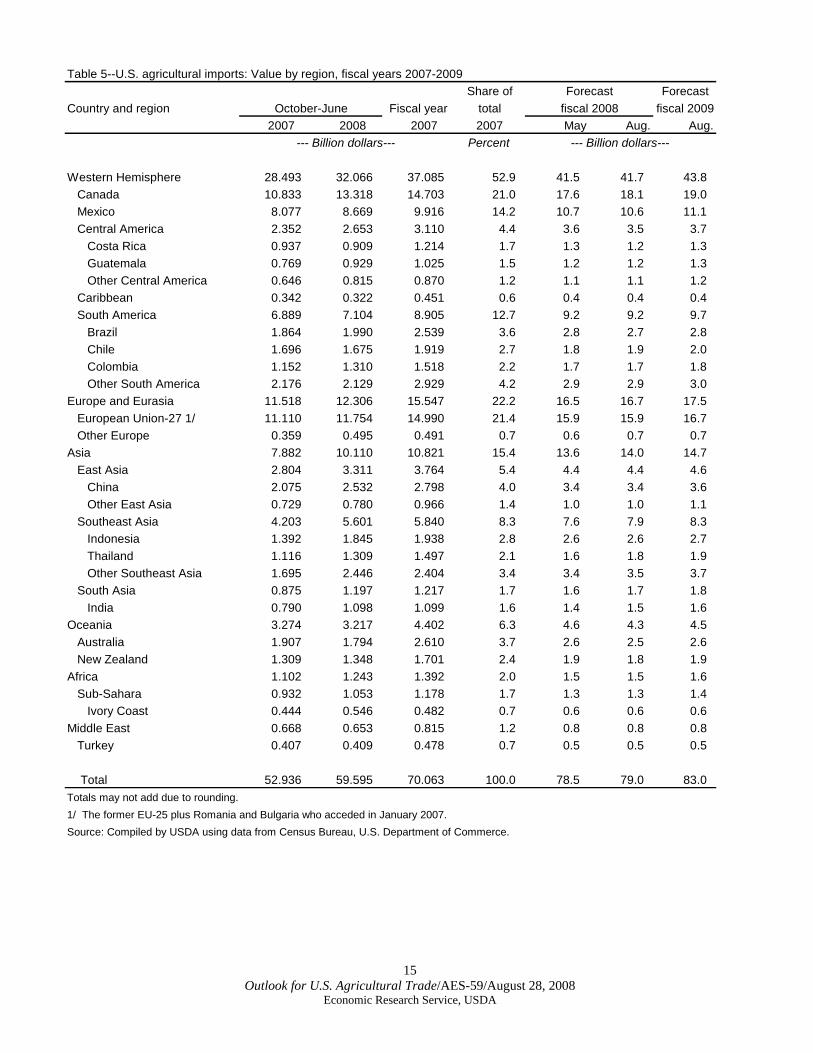
Table 5--U.S. agricultural imports: Value by region, fiscal years 2007-2009Share of Forecast
Country and region Fiscal year total fiscal 20092007 2008 2007 2007 May Aug. Aug.
Percent
Western Hemisphere 28.493 32.066 37.085 52.9 41.5 41.7 43.8 Canada 10.833 13.318 14.703 21.0 17.6 18.1 19.0 Mexico 8.077 8.669 9.916 14.2 10.7 10.6 11.1 Central America 2.352 2.653 3.110 4.4 3.6 3.5 3.7 Costa Rica 0.937 0.909 1.214 1.7 1.3 1.2 1.3 Guatemala 0.769 0.929 1.025 1.5 1.2 1.2 1.3 Other Central America 0.646 0.815 0.870 1.2 1.1 1.1 1.2 Caribbean 0.342 0.322 0.451 0.6 0.4 0.4 0.4 South America 6.889 7.104 8.905 12.7 9.2 9.2 9.7 Brazil 1.864 1.990 2.539 3.6 2.8 2.7 2.8 Chile 1.696 1.675 1.919 2.7 1.8 1.9 2.0 Colombia 1.152 1.310 1.518 2.2 1.7 1.7 1.8 Other South America 2.176 2.129 2.929 4.2 2.9 2.9 3.0 Europe and Eurasia 11.518 12.306 15.547 22.2 16.5 16.7 17.5 European Union-27 1/ 11.110 11.754 14.990 21.4 15.9 15.9 16.7 Other Europe 0.359 0.495 0.491 0.7 0.6 0.7 0.7 Asia 7.882 10.110 10.821 15.4 13.6 14.0 14.7 East Asia 2.804 3.311 3.764 5.4 4.4 4.4 4.6 China 2.075 2.532 2.798 4.0 3.4 3.4 3.6 Other East Asia 0.729 0.780 0.966 1.4 1.0 1.0 1.1 Southeast Asia 4.203 5.601 5.840 8.3 7.6 7.9 8.3 Indonesia 1.392 1.845 1.938 2.8 2.6 2.6 2.7 Thailand 1.116 1.309 1.497 2.1 1.6 1.8 1.9 Other Southeast Asia 1.695 2.446 2.404 3.4 3.4 3.5 3.7 South Asia 0.875 1.197 1.217 1.7 1.6 1.7 1.8 India 0.790 1.098 1.099 1.6 1.4 1.5 1.6 Oceania 3.274 3.217 4.402 6.3 4.6 4.3 4.5 Australia 1.907 1.794 2.610 3.7 2.6 2.5 2.6 New Zealand 1.309 1.348 1.701 2.4 1.9 1.8 1.9 Africa 1.102 1.243 1.392 2.0 1.5 1.5 1.6 Sub-Sahara 0.932 1.053 1.178 1.7 1.3 1.3 1.4 Ivory Coast 0.444 0.546 0.482 0.7 0.6 0.6 0.6 Middle East 0.668 0.653 0.815 1.2 0.8 0.8 0.8 Turkey 0.407 0.409 0.478 0.7 0.5 0.5 0.5
Total 52.936 59.595 70.063 100.0 78.5 79.0 83.0 Totals may not add due to rounding.1/ The former EU-25 plus Romania and Bulgaria who acceded in January 2007.Source: Compiled by USDA using data from Census Bureau, U.S. Department of Commerce.
ForecastOctober-June fiscal 2008
--- Billion dollars--- --- Billion dollars---
15 Outlook for U.S. Agricultural Trade/AES-59/August 28, 2008
Economic Research Service, USDA
Economic Outlook
16 Outlook for U.S. Agricultural Trade/AES-59/August 28, 2008
Economic Research Service, USDA
Imported Animal Products Still Relatively Small Share of Consumption
Of the 929 pounds per capita of animal products (excluding fish) consumed by Americans in 2006, 889 pounds were from domestic producers and only 40 pounds, or 4.4 percent, were imported. Although this share is higher than the 3.1 percent averaged from 1976 to 1997, it is the lowest among all the food groups. Among major animal products, only lamb meat had more than 50 percent import share of disappearance, beef has 15 percent (including imported live cattle for meat), and the rest had 6 percent or lower in 2006 (the latest year available). Thus, most animal products consumed by Americans, including cheese, are largely domestically produced. Americans consumed 278 billion pounds of animal products as food in 2006, of which 12 billion pounds were imported. More than half of these imports were red meats (in carcass weight, including live meat animals) and 40 percent were dairy products. Including milk, animal-based products represented 43 percent of total food disappearance, which was 2,177 pounds per capita in 2006 (not accounting for waste or spoilage beyond the farm or U.S. port of entry). Total animal product disappearance grew by an average 1.5 percent annually from 1976 to 2006, or 0.4 percent per capita—from 827 to 929 pounds. Total food disappearance expanded by 1.6 percent during the same period. Of the total quantity of food consumed by Americans, about 9 percent was meat and eggs and 28 percent was dairy products (measured from fluid milk equivalents). Among animal-derived foods, the fastest growing groups were poultry meat and cheese, whose rates of disappearance have each grown 4 percent on average since 1976. Beef disappearance averaged close to zero percent annual growth over the past 3 decades, although all red meats as a group averaged 0.4 percent growth. In terms of imports, among the fastest growing were lamb and goat, variety meats (nonpoultry), animal fats, and dairy products. Nevertheless, the import share of disappearance with respect to dairy products remains below 3 percent. Only poultry meat and eggs have lower import shares. Overall, imported animal products increased by an average 3.3 percent in volume since 1976, or 2.2 percent per capita annually. While only 11 percent of the volume of U.S. imported food is animal-based, its import value was $12 billion in 2007, or 20 percent of total food import value. The average annual growth of all imported foods into the U.S. from 1997 to 2006 was 4.2 percent in volume terms. In the same period, however, U.S. import demand for animal products increased by an average 5.5 percent annually. By contrast, the pace of disappearance of animal-based products in the U.S. was 1.9 percent during the past decade and 1.4 percent for all foods. These trends indicate that imported food’s share in the American diet is increasing over time. To estimate the amount of U.S.-consumed food that is produced by domestic farms, import volume is subtracted from total food disappearance. This amount, by supply and use balance accounting, equals total U.S. food production minus food exports. Food stocks are not accounted for in this generalized estimation. The portion of animal products in total food consumed and produced domestically equaled 49 percent in 2006, up from 47 percent on average between 1976 and 2005. This suggests that the share of animal-based foods produced and consumed domestically
Economic Outlook
17 Outlook for U.S. Agricultural Trade/AES-59/August 28, 2008
Economic Research Service, USDA
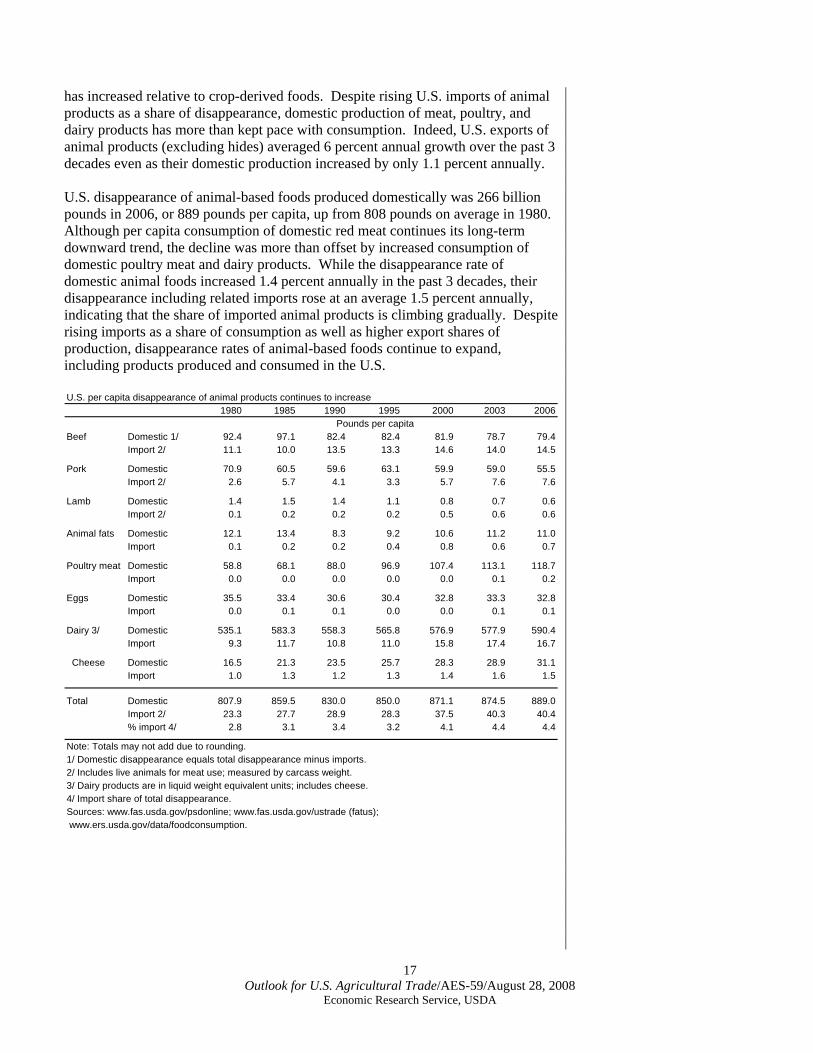
has increased relative to crop-derived foods. Despite rising U.S. imports of animal products as a share of disappearance, domestic production of meat, poultry, and dairy products has more than kept pace with consumption. Indeed, U.S. exports of animal products (excluding hides) averaged 6 percent annual growth over the past 3 decades even as their domestic production increased by only 1.1 percent annually. U.S. disappearance of animal-based foods produced domestically was 266 billion pounds in 2006, or 889 pounds per capita, up from 808 pounds on average in 1980. Although per capita consumption of domestic red meat continues its long-term downward trend, the decline was more than offset by increased consumption of domestic poultry meat and dairy products. While the disappearance rate of domestic animal foods increased 1.4 percent annually in the past 3 decades, their disappearance including related imports rose at an average 1.5 percent annually, indicating that the share of imported animal products is climbing gradually. Despite rising imports as a share of consumption as well as higher export shares of production, disappearance rates of animal-based foods continue to expand, including products produced and consumed in the U.S. U.S. per capita disappearance of animal products continues to increase
1980 1985 1990 1995 2000 2003 2006Pounds per capita
Beef Domestic 1/ 92.4 97.1 82.4 82.4 81.9 78.7 79.4Import 2/ 11.1 10.0 13.5 13.3 14.6 14.0 14.5
Pork Domestic 70.9 60.5 59.6 63.1 59.9 59.0 55.5Import 2/ 2.6 5.7 4.1 3.3 5.7 7.6 7.6
Lamb Domestic 1.4 1.5 1.4 1.1 0.8 0.7 0.6Import 2/ 0.1 0.2 0.2 0.2 0.5 0.6 0.6
Animal fats Domestic 12.1 13.4 8.3 9.2 10.6 11.2 11.0Import 0.1 0.2 0.2 0.4 0.8 0.6 0.7
Poultry meat Domestic 58.8 68.1 88.0 96.9 107.4 113.1 118.7Import 0.0 0.0 0.0 0.0 0.0 0.1 0.2
Eggs Domestic 35.5 33.4 30.6 30.4 32.8 33.3 32.8Import 0.0 0.1 0.1 0.0 0.0 0.1 0.1
Dairy 3/ Domestic 535.1 583.3 558.3 565.8 576.9 577.9 590.4Import 9.3 11.7 10.8 11.0 15.8 17.4 16.7
Cheese Domestic 16.5 21.3 23.5 25.7 28.3 28.9 31.1Import 1.0 1.3 1.2 1.3 1.4 1.6 1.5
Total Domestic 807.9 859.5 830.0 850.0 871.1 874.5 889.0Import 2/ 23.3 27.7 28.9 28.3 37.5 40.3 40.4% import 4/ 2.8 3.1 3.4 3.2 4.1 4.4 4.4
Note: Totals may not add due to rounding.1/ Domestic disappearance equals total disappearance minus imports.2/ Includes live animals for meat use; measured by carcass weight.3/ Dairy products are in liquid weight equivalent units; includes cheese.4/ Import share of total disappearance.Sources: www.fas.usda.gov/psdonline; www.fas.usda.gov/ustrade (fatus); www.ers.usda.gov/data/foodconsumption.
Reliability Tables
18 Outlook for U.S. Agricultural Trade/AES-59/August 28, 2008
Economic Research Service, USDA
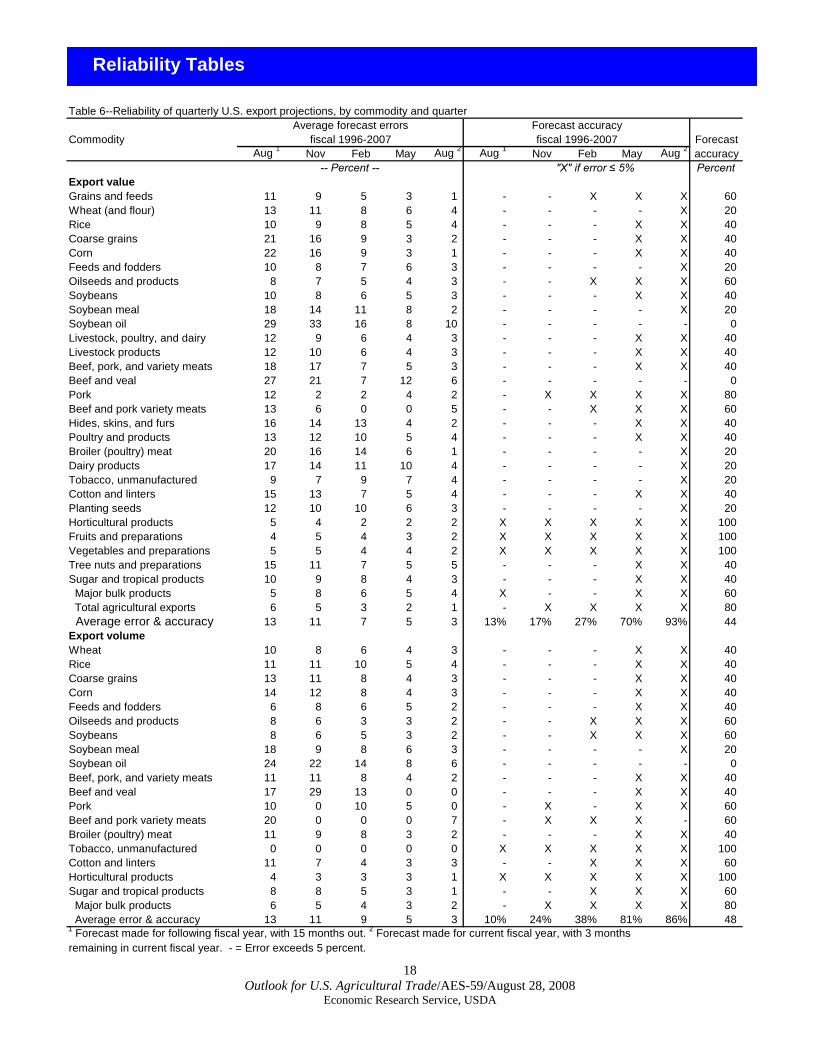
Table 6--Reliability of quarterly U.S. export projections, by commodity and quarter
Average forecast errors Forecast accuracyCommodity fiscal 1996-2007 fiscal 1996-2007 Forecast
Aug 1 Nov Feb May Aug 2 Aug 1 Nov Feb May Aug 2 accuracy-- Percent -- "X" if error ≤ 5% Percent
Export valueGrains and feeds 11 9 5 3 1 - - X X X 60Wheat (and flour) 13 11 8 6 4 - - - - X 20Rice 10 9 8 5 4 - - - X X 4Coarse grains 21 16 9 3 2 - - - X X 40Corn 22 16 9 3 1 - - - X X 40Feeds and fodders 10 8 7 6 3 - - - - X 20Oilseeds and products 8 7 5 4 3 - - X X X 60Soybeans 10 8 6 5 3 - - - X X 40Soybean meal 18 14 11 8 2 - - - - X 20Soybean oil 29 33 16 8 10 - - - - - 0Livestock, poultry, and dairy 12 9 6 4 3 - - - X X 40Livestock products 12 10 6 4 3 - - - X X 40Beef, pork, and variety meats 18 17 7 5 3 - - - X X 40Beef and veal 27 21 7 12 6 - - - - - 0Pork 12 2 2 4 2 - X X X X 8Beef and pork variety meats 13 6 0 0 5 - - X X X 60Hides, skins, and furs 16 14 13 4 2 - - - X X 40Poultry and products 13 12 10 5 4 - - - X X 40Broiler (poultry) meat 20 16 14 6 1 - - - - X 20Dairy products 17 14 11 10 4 - - - - X 20Tobacco, unmanufactured 9 7 9 7 4 - - - - X 20Cotton and linters 15 13 7 5 4 - - - X X 40Planting seeds 12 10 10 6 3 - - - - X 20Horticultural products 5 4 2 2 2 X X X X X 100Fruits and preparations 4 5 4 3 2 X X X X X 100Vegetables and preparations 5 5 4 4 2 X X X X X 100Tree nuts and preparations 15 11 7 5 5 - - - X X 40Sugar and tropical products 10 9 8 4 3 - - - X X 40 Major bulk products 5 8 6 5 4 X - - X X 60 Total agricultural exports 6 5 3 2 1 - X X X X 80 Average error & accurac
0
0
y 13 11 7 5 3 13% 17% 27% 70% 93% 44Export volumeWheat 10 8 6 4 3 - - - X X 40Rice 11 11 10 5 4 - - - X X 40Coarse grains 13 11 8 4 3 - - - X X 40Corn 14 12 8 4 3 - - - X X 40Feeds and fodders 6 8 6 5 2 - - - X X 40Oilseeds and products 8 6 3 3 2 - - X X X 60Soybeans 8 6 5 3 2 - - X X X 60Soybean meal 18 9 8 6 3 - - - - X 20Soybean oil 24 22 14 8 6 - - - - - 0Beef, pork, and variety meats 11 11 8 4 2 - - - X X 40Beef and veal 17 29 13 0 0 - - - X X 40Pork 10 0 10 5 0 - X - X X 60Beef and pork variety meats 20 0 0 0 7 - X X X - 60Broiler (poultry) meat 11 9 8 3 2 - - - X X 40Tobacco, unmanufactured 0 0 0 0 0 X X X X X 100Cotton and linters 11 7 4 3 3 - - X X X 60Horticultural products 4 3 3 3 1 X X X X X 100Sugar and tropical products 8 8 5 3 1 - - X X X 60 Major bulk products 6 5 4 3 2 - X X X X 80 Average error & accuracy 13 11 9 5 3 10% 24% 38% 81% 86% 481 Forecast made for following fiscal year, with 15 months out. 2 Forecast made for current fiscal year, with 3 monthsremaining in current fiscal year. - = Error exceeds 5 percent.
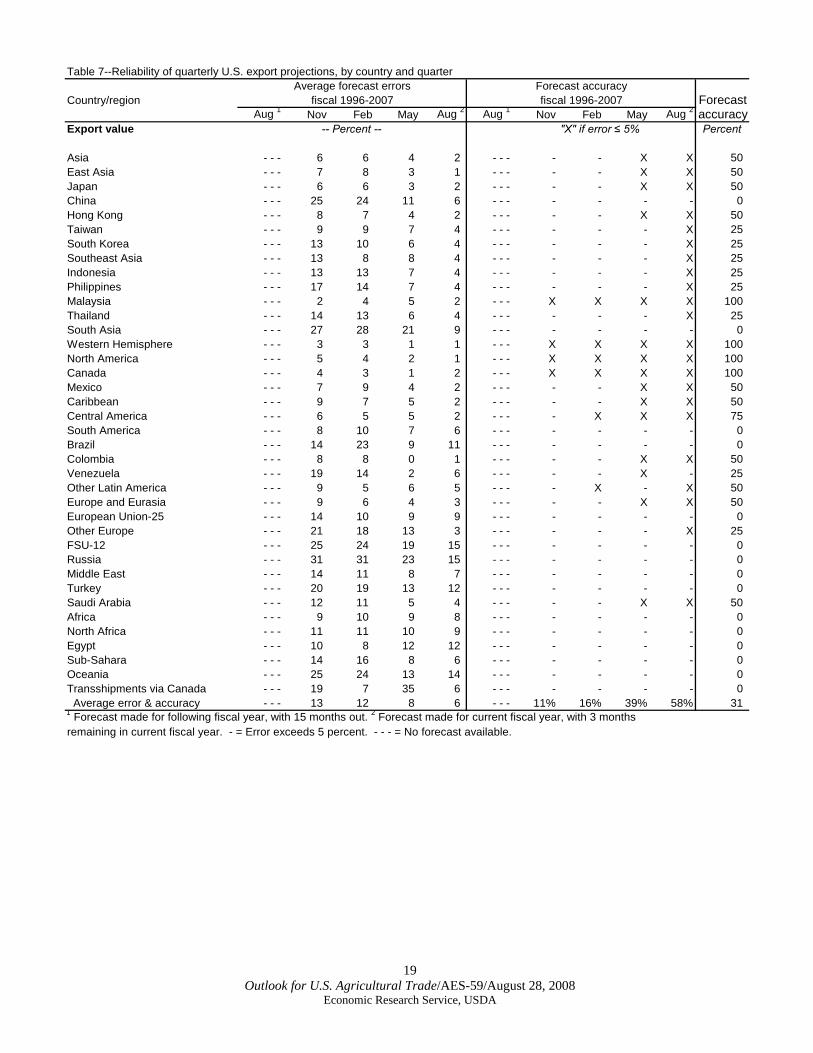
Table 7--Reliability of quarterly U.S. export projections, by country and quarterAverage forecast errors Forecast accuracy
Country/region fiscal 1996-2007 fiscal 1996-2007 ForecastAug 1 Nov Feb May Aug 2 Aug 1 Nov Feb May Aug 2 accuracy
Export value -- Percent -- "X" if error ≤ 5% Percent
Asia - - - 6 6 4 2 - - - - - X XEast Asia - - - 7 8 3 1 - - - - - X XJapan - - - 6 6 3 2 - - - - - X XChina - - - 25 24 11 6 - - - - - - -Hong Kong - - - 8 7 4 2 - - - - - X XTaiwan - - - 9 9 7 4 - - - - - - XSouth Korea - - - 13 10 6 4 - - - - - - X 25Southeast Asia - - - 13 8 8 4 - - - - - - XIndonesia - - - 13 13 7 4 - - - - - - X 25Philippines - - - 17 14 7 4 - - - - - - X 25Malaysia - - - 2 4 5 2 - - - X X X X 1Thailand - - - 14 13 6 4 - - - - - - X 25South Asia - - - 27 28 21 9 - - - - - - -Western Hemisphere - - - 3 3 1 1 - - - X X X X 1North America - - - 5 4 2 1 - - - X X X X 1Canada - - - 4 3 1 2 - - - X X X X 1Mexico - - - 7 9 4 2 - - - - - X XCaribbean - - - 9 7 5 2 - - - - - X XCentral America - - - 6 5 5 2 - - - - X X XSouth America - - - 8 10 7 6 - - - - - - -Brazil - - - 14 23 9 11 - - - - - - -Colombia - - - 8 8 0 1 - - - - - X XVenezuela - - - 19 14 2 6 - - - - - X - 25Other Latin America - - - 9 5 6 5 - - - - X - XEurope and Eurasia - - - 9 6 4 3 - - - - - X XEuropean Union-25 - - - 14 10 9 9 - - - - - - -Other Europe - - - 21 18 13 3 - - - - - - X 25FSU-12 - - - 25 24 19 15 - - - - - - -Russia - - - 31 31 23 15 - - - - - - -Middle East - - - 14 11 8 7 - - - - - - -Turkey - - - 20 19 13 12 - - - - - - -Saudi Arabia - - - 12 11 5 4 - - - - - X X 50Africa - - - 9 10 9 8 - - - - - - -North Africa - - - 11 11 10 9 - - - - - - -Egypt - - - 10 8 12 12 - - - - - - -Sub-Sahara - - - 14 16 8 6 - - - - - - -Oceania - - - 25 24 13 14 - - - - - - -Transshipments via Canada - - - 19 7 35 6 - - - - - - - Average error & accuracy - - - 13 12 8 6 - - - 11% 16% 39% 58% 31
505050
05025
25
00
0000000505075
00
50
5050
0
0000
000000
1 Forecast made for following fiscal year, with 15 months out. 2 Forecast made for current fiscal year, with 3 monthsremaining in current fiscal year. - = Error exceeds 5 percent. - - - = No forecast available.
19 Outlook for U.S. Agricultural Trade/AES-59/August 28, 2008
Economic Research Service, USDA
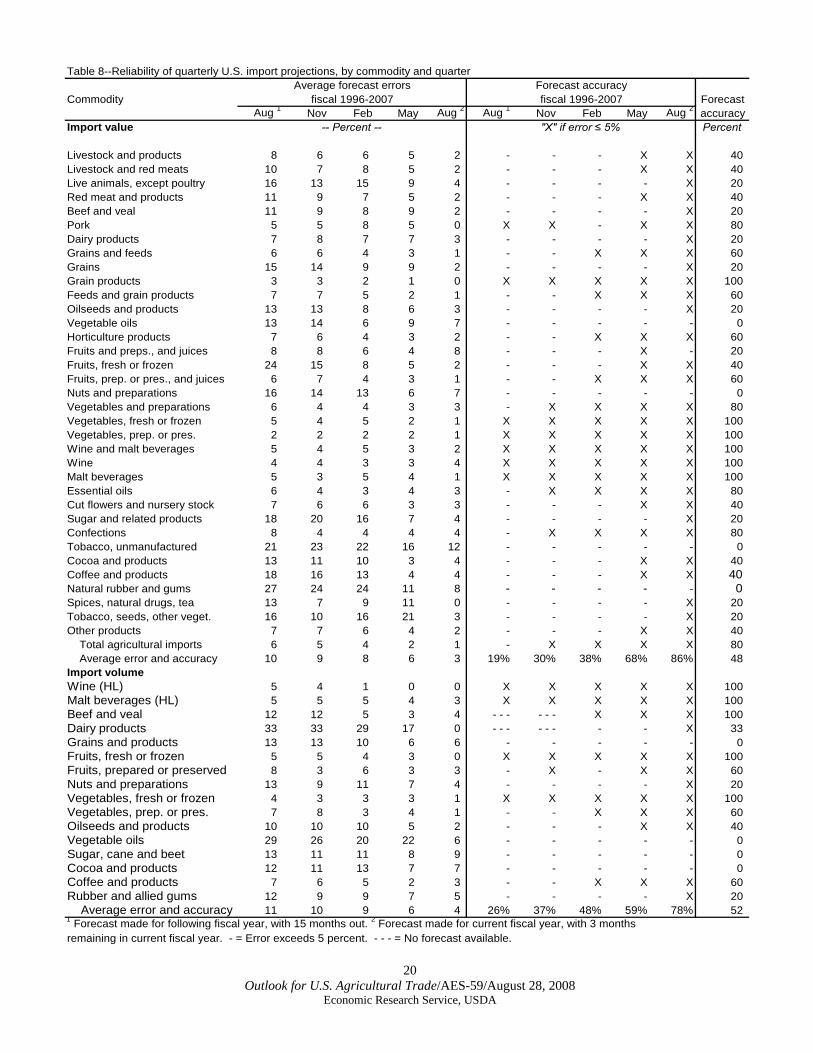
Table 8--Reliability of quarterly U.S. import projections, by commodity and quarterAverage forecast errors Forecast accuracy
Commodity fiscal 1996-2007 fiscal 1996-2007 ForecastAug 1 Nov Feb May Aug 2 Aug 1 Nov Feb May Aug 2 accuracy
Import value -- Percent -- "X" if error ≤ 5% Percent
Livestock and products 8 6 6 5 2 - - - X XLivestock and red meats 10 7 8 5 2 - - - X XLive animals, except poultry 16 13 15 9 4 - - - - X 20Red meat and products 11 9 7 5 2 - - - X XBeef and veal 11 9 8 9 2 - - - - XPork 5 5 8 5 0 X X - X XDairy products 7 8 7 7 3 - - - - XGrains and feeds 6 6 4 3 1 - - X X XGrains 15 14 9 9 2 - - - - XGrain products 3 3 2 1 0 X X X X X 10Feeds and grain products 7 7 5 2 1 - - X X XOilseeds and products 13 13 8 6 3 - - - - XVegetable oils 13 14 6 9 7 - - - - -Horticulture products 7 6 4 3 2 - - X X XFruits and preps., and juices 8 8 6 4 8 - - - X -Fruits, fresh or frozen 24 15 8 5 2 - - - X XFruits, prep. or pres., and juices 6 7 4 3 1 - - X X XNuts and preparations 16 14 13 6 7 - - - - -Vegetables and preparations 6 4 4 3 3 - X X X XVegetables, fresh or frozen 5 4 5 2 1 X X X X X 10Vegetables, prep. or pres. 2 2 2 2 1 X X X X X 10Wine and malt beverages 5 4 5 3 2 X X X X X 10Wine 4 4 3 3 4 X X X X X 10Malt beverages 5 3 5 4 1 X X X X X 10Essential oils 6 4 3 4 3 - X X X XCut flowers and nursery stock 7 6 6 3 3 - - - X XSugar and related products 18 20 16 7 4 - - - - X 20Confections 8 4 4 4 4 - X X X XTobacco, unmanufactured 21 23 22 16 12 - - - - -Cocoa and products 13 11 10 3 4 - - - X X 40Coffee and products 18 16 13 4 4 - - - X X 40Natural rubber and gums 27 24 24 11 8 - - - - - 0Spices, natural drugs, tea 13 7 9 11 0 - - - - X 20Tobacco, seeds, other veget. 16 10 16 21 3 - - - - X 20Other products 7 7 6 4 2 - - - X X Total agricultural imports 6 5 4 2 1 - X X X X Average error and accuracy 10 9 8 6 3 19% 30% 38% 68% 86%Import volumeWine (HL) 5 4 1 0 0 X X X X X 10Malt beverages (HL) 5 5 5 4 3 X X X X X 10Beef and veal 12 12 5 3 4 - - - - - - X X X 1Dairy products 33 33 29 17 0 - - - - - - - - X 33Grains and products 13 13 10 6 6 - - - - -Fruits, fresh or frozen 5 5 4 3 0 X X X X X 10Fruits, prepared or preserved 8 3 6 3 3 - X - X XNuts and preparations 13 9 11 7 4 - - - - XVegetables, fresh or frozen 4 3 3 3 1 X X X X X 10Vegetables, prep. or pres. 7 8 3 4 1 - - X X XOilseeds and products 10 10 10 5 2 - - - X X 40Vegetable oils 29 26 20 22 6 - - - - -Sugar, cane and beet 13 11 11 8 9 - - - - -Cocoa and products 12 11 13 7 7 - - - - -Coffee and products 7 6 5 2 3 - - X X XRubber and allied gums 12 9 9 7 5 - - - - X Average error and accuracy 11 10 9 6 4 26% 37% 48% 59% 78%
4040
402080206020
06020
060204060
080
00000
8040
800
408048
00
00
00
6020
060
000
602052
1 Forecast made for following fiscal year, with 15 months out. 2 Forecast made for current fiscal year, with 3 monthsremaining in current fiscal year. - = Error exceeds 5 percent. - - - = No forecast available.
20 Outlook for U.S. Agricultural Trade/AES-59/August 28, 2008
Economic Research Service, USDA
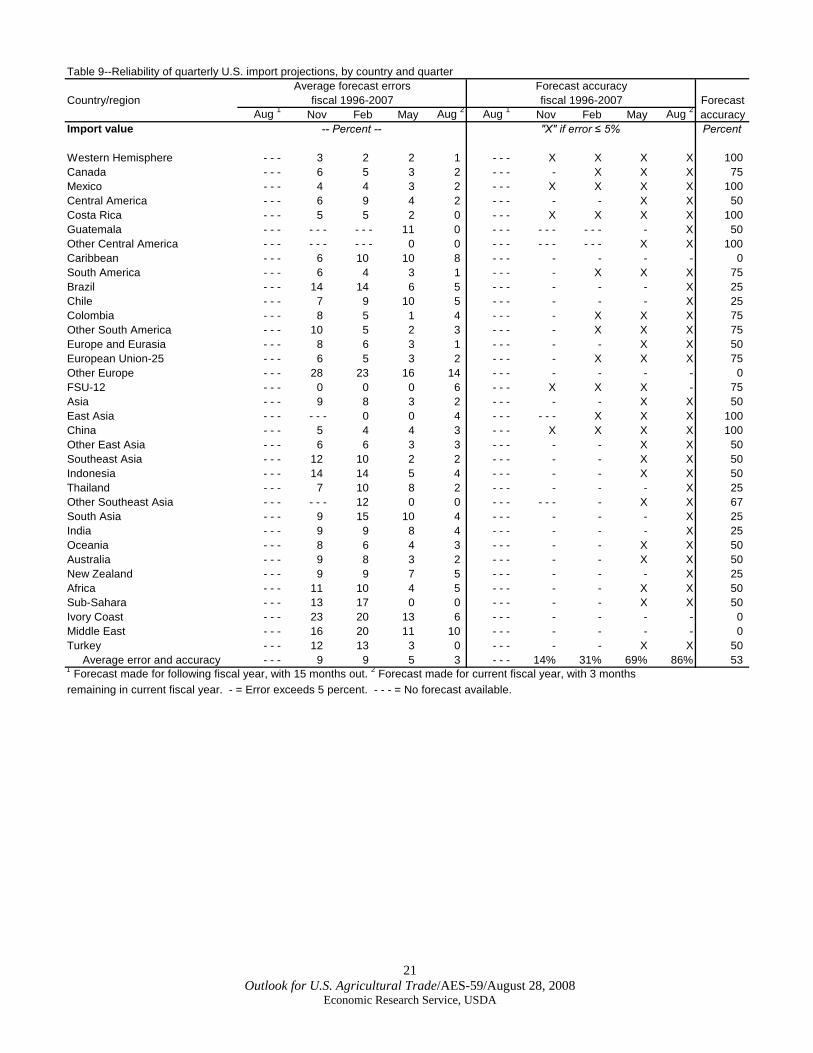
Table 9--Reliability of quarterly U.S. import projections, by country and quarterAverage forecast errors Forecast accuracy
Country/region fiscal 1996-2007 fiscal 1996-2007 ForecastAug 1 Nov Feb May Aug 2 Aug 1 Nov Feb May Aug 2 accuracy
Import value -- Percent -- "X" if error ≤ 5% Percent
Western Hemisphere - - - 3 2 2 1 - - - X X X X 1Canada - - - 6 5 3 2 - - - - X X XMexico - - - 4 4 3 2 - - - X X X X 1Central America - - - 6 9 4 2 - - - - - X XCosta Rica - - - 5 5 2 0 - - - X X X X 1Guatemala - - - - - - - - - 11 0 - - - - - - - - - - X 50Other Central America - - - - - - - - - 0 0 - - - - - - - - - X X 100Caribbean - - - 6 10 10 8 - - - - - - -South America - - - 6 4 3 1 - - - - X X XBrazil - - - 14 14 6 5 - - - - - - X 25Chile - - - 7 9 10 5 - - - - - - X 25Colombia - - - 8 5 1 4 - - - - X X XOther South America - - - 10 5 2 3 - - - - X X XEurope and Eurasia - - - 8 6 3 1 - - - - - X XEuropean Union-25 - - - 6 5 3 2 - - - - X X XOther Europe - - - 28 23 16 14 - - - - - - -FSU-12 - - - 0 0 0 6 - - - X X X -Asia - - - 9 8 3 2 - - - - - X XEast Asia - - - - - - 0 0 4 - - - - - - X X X 100China - - - 5 4 4 3 - - - X X X X 1Other East Asia - - - 6 6 3 3 - - - - - X XSoutheast Asia - - - 12 10 2 2 - - - - - X X 50Indonesia - - - 14 14 5 4 - - - - - X X 50Thailand - - - 7 10 8 2 - - - - - - X 25Other Southeast Asia - - - - - - 12 0 0 - - - - - - - X X 67South Asia - - - 9 15 10 4 - - - - - - X 25India - - - 9 9 8 4 - - - - - - XOceania - - - 8 6 4 3 - - - - - X XAustralia - - - 9 8 3 2 - - - - - X XNew Zealand - - - 9 9 7 5 - - - - - - XAfrica - - - 11 10 4 5 - - - - - X X 50Sub-Sahara - - - 13 17 0 0 - - - - - X X 50Ivory Coast - - - 23 20 13 6 - - - - - - -Middle East - - - 16 20 11 10 - - - - - - -Turkey - - - 12 13 3 0 - - - - - X X 50
Average error and accuracy - - - 9 9 5 3 - - - 14% 31% 69% 86%
0075005000
075
75755075
07550
0050
25505025
00
531 Forecast made for following fiscal year, with 15 months out. 2 Forecast made for current fiscal year, with 3 monthsremaining in current fiscal year. - = Error exceeds 5 percent. - - - = No forecast available.
21 Outlook for U.S. Agricultural Trade/AES-59/August 28, 2008
Economic Research Service, USDA
Contact Information
22 Outlook for U.S. Agricultural Trade/AES-59/August 28, 2008
Economic Research Service, USDA
Coordinators (area code 202) Nora Brooks/ERS, 694-5211, [email protected] Ernest Carter/FAS, 720-2922, [email protected] Forecast Contacts (area code 202) Nora Brooks/ERS, 694-5211, [email protected] Andy Jerardo/ERS, 694-5266, [email protected] Ernest Carter/FAS, 720-2922, [email protected] Commodity Specialist Contacts (area code 202) Grains and Feeds: Richard O’Meara/FAS, 720-4933 Coarse Grains: Marcela Rondon/FAS, 720-0929 Edward W. Allen/ERS, 694-5288 Wheat: Edward W. Allen/ERS, 694-5288 Teresa McKeivier/FAS, 720-1072 Rice: Nathan Childs/ERS, 694-5292 Debra Rubas/FAS, 720-0472 Oilseeds: Mark Ash/ERS, 694-5289 Bill George/FAS, 720-6234 Cotton: James Johnson/FAS, 690-1546 Leslie Meyer/ERS, 694-5307 Livestock, Poultry & Dairy Products: Claire Mezoughem/FAS, 720-7715 Beef & Cattle: Claire Mezoughem/FAS, 720-7715 Michael McConnell/ERS, 694-5158 Pork & Hogs: Claire Mezoughem/FAS, 720-7715 Poultry: Dave Harvey/ERS, 694-5177 Michelle DeGraaf/FAS, 720-7285 Dairy Products: Paul Kiendl/FAS, 720-8870 Horticultural & Tropical Products: Fruits & Preparations Deciduous Fresh Fruit: Shari Kosco/FAS, 720-2083 Fresh Citrus and Juices: Reed Blauer/FAS, 720-0898 Vegetables & Preparations: Shari Kosco/FAS, 720-2083 Tree Nuts: Lashonda McLeod/FAS, 720-6086 Essential Oils: Tony Halstead/FAS, 720-1592 Sugar and Tropical Products: Bob Knapp/FAS, 720-4620 Sugar: Ron Lord/FAS, 720-6939 Macroeconomics Contact (area code 202) David Torgerson/ERS, 694-5334 Special article – Imported Animal Products Still Relatively Small Share of Consumption Andy Jerardo/ERS, 694-5266 Agency Contact Information Foreign Agricultural Service homepage: http://www.fas.usda.gov/ Economic Research Service homepage: http://www.ers.usda.gov/ The U.S. Department of Agriculture (USDA) prohibits discrimination in all its programs and activities on the basis of race, color, national origin, age, disability, and, where applicable, sex, marital status, familial status, parental status, religion, sexual orientation, genetic information, political beliefs, reprisal, or because all or a part of an individual's income is derived from any public assistance program. (Not all prohibited bases apply to all programs.) Persons with disabilities who require alternative means for communication of program information (Braille, large print, audiotape, etc.) should contact USDA's TARGET Center at (202) 720-2600 (voice and TDD). To file a complaint of discrimination write to USDA, Director, Office of Civil Rights, 1400 Independence Avenue, S.W., Washington, D.C. 20250-9410 or call (800) 795-3272 (voice) or (202) 720-6382 (TDD). USDA is an equal opportunity provider and employer.
E-mail Notification Readers of ERS outlook reports have two ways they can receive an e-mail notice about release of reports and associated data. • Receive timely notification (soon after the report is posted on the web) via USDA’s Economics, Statistics and Market Information System (which is housed at Cornell University’s Mann Library). Go to http://usda.mannlib.cornell.edu/MannUsda/aboutEmailService.do and follow the instructions to receive e-mail notices about ERS, Agricultural Marketing Service, National Agricultural Statistics Service, and World Agricultural Outlook Board products. • Receive weekly notification (on Friday afternoon) via the ERS website. Go to http://www.ers.usda.gov/Updates/ and follow the instructions to receive notices about ERS outlook reports, Amber Waves magazine, and other reports and data products on specific topics. ERS also offers RSS (really simple syndication) feeds for all ERS products. Go to http://www.ers.usda.gov/rss/ to get started.