Embed Size (px)
Citation preview
Análisis de Renta Fija Actinver - Creando Ideas con Valor 1
ALSEA, S.A.B. de C.V.
Fixed Income Research
June 2015
1. Fundamentals
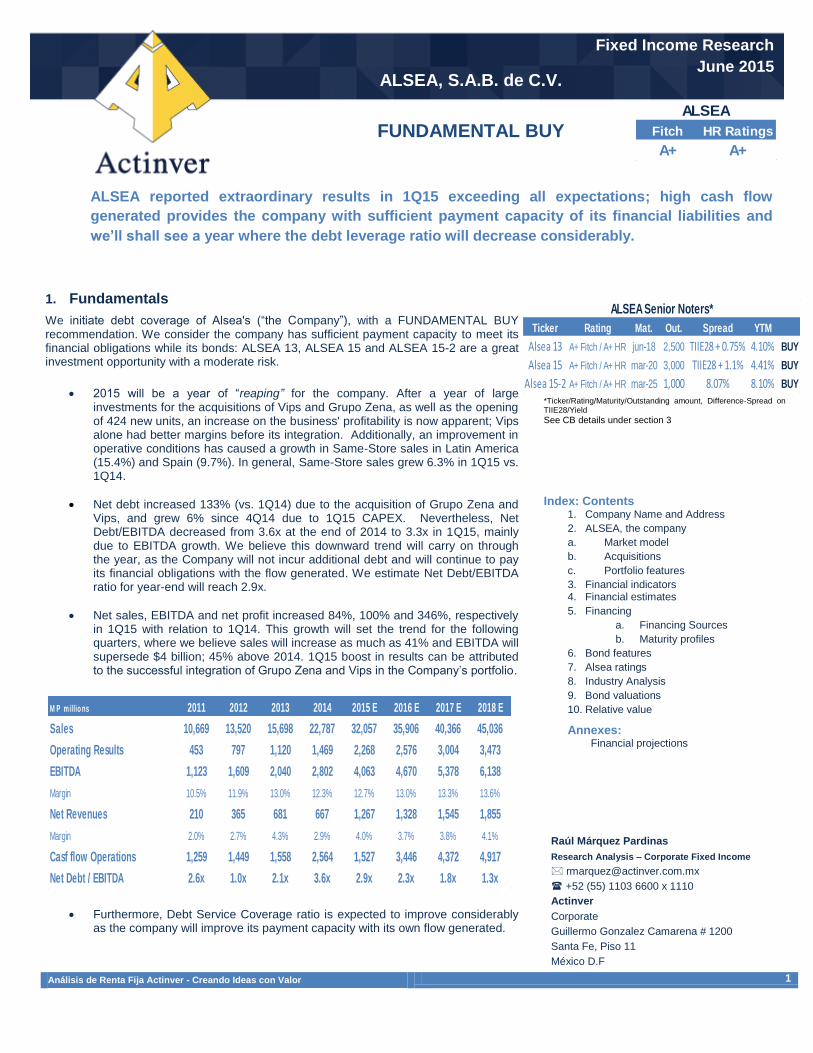
We initiate debt coverage of Alsea's (“the Company”), with a FUNDAMENTAL BUY recommendation. We consider the company has sufficient payment capacity to meet its financial obligations while its bonds: ALSEA 13, ALSEA 15 and ALSEA 15-2 are a great investment opportunity with a moderate risk.
2015 will be a year of “reaping” for the company. After a year of large investments for the acquisitions of Vips and Grupo Zena, as well as the opening of 424 new units, an increase on the business' profitability is now apparent; Vips alone had better margins before its integration. Additionally, an improvement in operative conditions has caused a growth in Same-Store sales in Latin America (15.4%) and Spain (9.7%). In general, Same-Store sales grew 6.3% in 1Q15 vs. 1Q14.
Net debt increased 133% (vs. 1Q14) due to the acquisition of Grupo Zena and Vips, and grew 6% since 4Q14 due to 1Q15 CAPEX. Nevertheless, Net Debt/EBITDA decreased from 3.6x at the end of 2014 to 3.3x in 1Q15, mainly due to EBITDA growth. We believe this downward trend will carry on through the year, as the Company will not incur additional debt and will continue to pay its financial obligations with the flow generated. We estimate Net Debt/EBITDA ratio for year-end will reach 2.9x.
Net sales, EBITDA and net profit increased 84%, 100% and 346%, respectively in 1Q15 with relation to 1Q14. This growth will set the trend for the following quarters, where we believe sales will increase as much as 41% and EBITDA will supersede $4 billion; 45% above 2014. 1Q15 boost in results can be attributed to the successful integration of Grupo Zena and Vips in the Company’s portfolio.
Furthermore, Debt Service Coverage ratio is expected to improve considerably as the company will improve its payment capacity with its own flow generated.
*Ticker/Rating/Maturity/Outstanding amount, Difference-Spread on TIIE28/Yield
See CB details under section 3
Index: Contents
1. Company Name and Address
2. ALSEA, the company
a. Market model
b. Acquisitions
c. Portfolio features
3. Financial indicators 4. Financial estimates
5. Financing
a. Financing Sources
b. Maturity profiles
6. Bond features
7. Alsea ratings
8. Industry Analysis
9. Bond valuations
10. Relative value
Annexes: Financial projections
Raúl Márquez Pardinas
Research Analysis – Corporate Fixed Income
+52 (55) 1103 6600 x 1110
Actinver
Corporate
Guillermo Gonzalez Camarena # 1200
Santa Fe, Piso 11
México D.F
M P millio ns 2011 2012 2013 2014 2015 E 2016 E 2017 E 2018 E
Sales 10,669 13,520 15,698 22,787 32,057 35,906 40,366 45,036
Operating Results 453 797 1,120 1,469 2,268 2,576 3,004 3,473
EBITDA 1,123 1,609 2,040 2,802 4,063 4,670 5,378 6,138
Margin 10.5% 11.9% 13.0% 12.3% 12.7% 13.0% 13.3% 13.6%
Net Revenues 210 365 681 667 1,267 1,328 1,545 1,855
Margin 2.0% 2.7% 4.3% 2.9% 4.0% 3.7% 3.8% 4.1%
Casf flow Operations 1,259 1,449 1,558 2,564 1,527 3,446 4,372 4,917
Net Debt / EBITDA 2.6x 1.0x 2.1x 3.6x 2.9x 2.3x 1.8x 1.3x
FUNDAMENTAL BUY
ALSEA reported extraordinary results in 1Q15 exceeding all expectations; high cash flow
generated provides the company with sufficient payment capacity of its financial liabilities and
we’ll shall see a year where the debt leverage ratio will decrease considerably.
Fitch HR Ratings
A+ A+
ALSEA
Ticker Rating Mat. Out. Spread YTM
Alsea 13 A+ Fitch / A+ HR jun-18 2,500 TIIE28 + 0.75% 4.10%
Alsea 15 A+ Fitch / A+ HR mar-20 3,000 TIIE28 + 1.1% 4.41%
Alsea 15-2 A+ Fitch / A+ HR mar-25 1,000 8.07% 8.10% BUY
ALSEA Senior Noters*
BUY
BUY
Análisis de Renta Fija Actinver - Creando Ideas con Valor 2
ALSEA, S.A.B. de C.V.
Fixed Income Research
June 2015
By 2014 end, the company reported P$130 million in extraordinary expenses related to the settlement and closure of 36 units. The company decided to enhance the business' profitability and closed all units with negative results and placed under review those that had low margins but with opportunity to improve. Alsea is in a favorable situation within the food establishment industry as it operates successful brands in all population segments it participates in.
The company operates under a business model that benefits from efficient synergies; achieving lower expenditures through the centralization of administrative and operative processes for all the brands it operates. Through this, Alsea has improved margins on those businesses it has integrated in its portfolio and in turn, has been able to report continues growth in sales and profitability.
The company has been able to integrate in an effective manner its acquisitions and new units under the company's business model, not only in Mexico, but also in Latin America and Spain.
Alsea's business volume allows a high negotiation power with suppliers and lessors or establishment owners. Also, the company has wide experience in selecting and locating commercial spaces for new developments, a vital factor to guarantee the business' continuity.
Alsea has a vertical integration through shared services centers, providing administrative and development processes, as well as a supply chain. As of today, there is low penetration of some of its products/brands in some markets it operates and therefore the company has great growth potential. The company holds a diversified portfolio in regard to sales, products, type of clients and geographical location:
Product Distribution: The Company currently holds 15 brands, 2,788 units, distributing revenues and limiting the dependence on just one product.
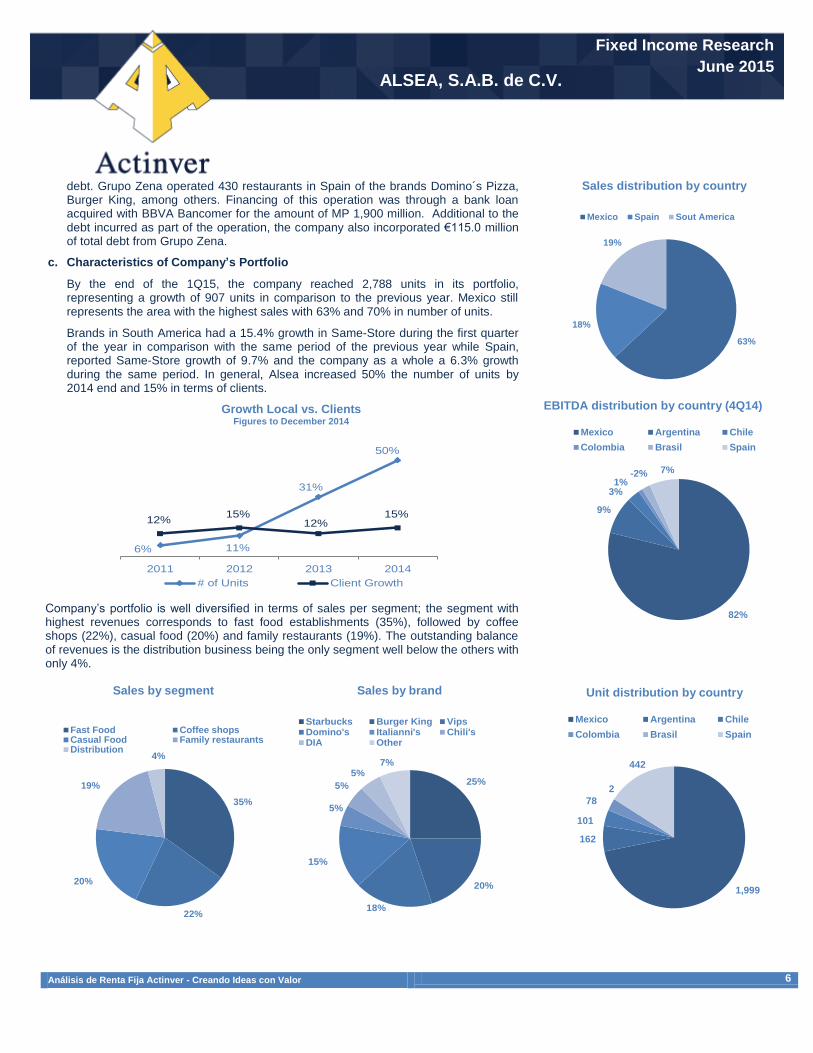
Geographical distribution: The Company’s portfolio is distributed in Mexico 63%, Latin America (Argentina, Chile, Colombia and Brazil) with 18% and Spain 19%. Mexico represents the bigger part of this portfolio, but it is also well distributed throughout the country.
Distribution by segment - The Company has several brands and sub-brands that attend different segments of the population, and therefore, reduce the risk associated focusing in just one sector of the population.
Risk associated with the company and its CB's
The company has a diversified product portfolio which means having several competitors. Food industry is highly competitive so it demands the company to maintain highest quality standards and be under contestant watch of market trends. In the past, the company's profitability was affected by certain brands, and this could happen again. Alsea requires financing for strong acquisitions (company’s business model), giving place to high leverage levels, asset sales and in some cases to merge; putting at risk the company’s payment capacity. Also, the company has certain financial limitations imposed by banks and its debt notes. This could impede future acquisitions, limiting company’s growth. In case the Company does not comply with its financial covenants, it can incur in severe penalties and financing limitations. The business continuity depends largely on the location, space and other special
Análisis de Renta Fija Actinver - Creando Ideas con Valor 3
ALSEA, S.A.B. de C.V.
Fixed Income Research
June 2015
features of the commercial establishments. The majority of these commercial spaces is leased by the company and is subject to changes in the leasing contracts. Unemployment rates could boost new independent competitors (mainly in sub-segments such as specialized coffee shops, complete service and low income kitchens) increasing competition in main urban markets. The company has a diversified portfolio; nevertheless Mexico still represents 63% of total sales. Hence, company results are highly related to Mexico’s macroeconomic situation. A highly diversified portfolio in different countries involves an exchange risk. Currency volatility can generate an additional cost for the company. For this reason the company has contracted coverage’s to mitigate exchange risks between currencies. Historically, Mexico has had recurrent economic crisis, with high inflation, exchange rate instability, high interest rates, a solid contraction of consumer demand, reduced loan availability, increase in unemployment and reduction of investors trust, among others.
2. ALSEA, the company
The company’s main business is the operation of fast food, coffee shops and casual food businesses. It operates brands such as Domino’s Pizza, Starbucks, California Pizza Kitchen and The Cheesecake Factory, and has franchises for Burger King, Chili’s Grill & Bar, P.F. Chang’s China Bistro and Pei Wei Asian Diner. Also, it recently incorporated in its portfolio the brands Vips (holding of several brands), Italianni’s and the Spanish, Grupo Zena. Brand and businesses operations are supported by a shared service center, which includes supply chain through its Distribuidora e Importadora Alsea, S.A. de C.V., real estate and development services, as well as administrative services including those related to Human Resources, Financing and Technological, among others.
a. Background and Business Model:
The company operates under a model that efficiently takes advantage of synergies and acquisitions, and mainly impacting expenses, as well as scale economies through centralization of some of the development, administrative and operative processes for all the brands it operates.
(Image on the following page)
Análisis de Renta Fija Actinver - Creando Ideas con Valor 4
ALSEA, S.A.B. de C.V.
Fixed Income Research
June 2015
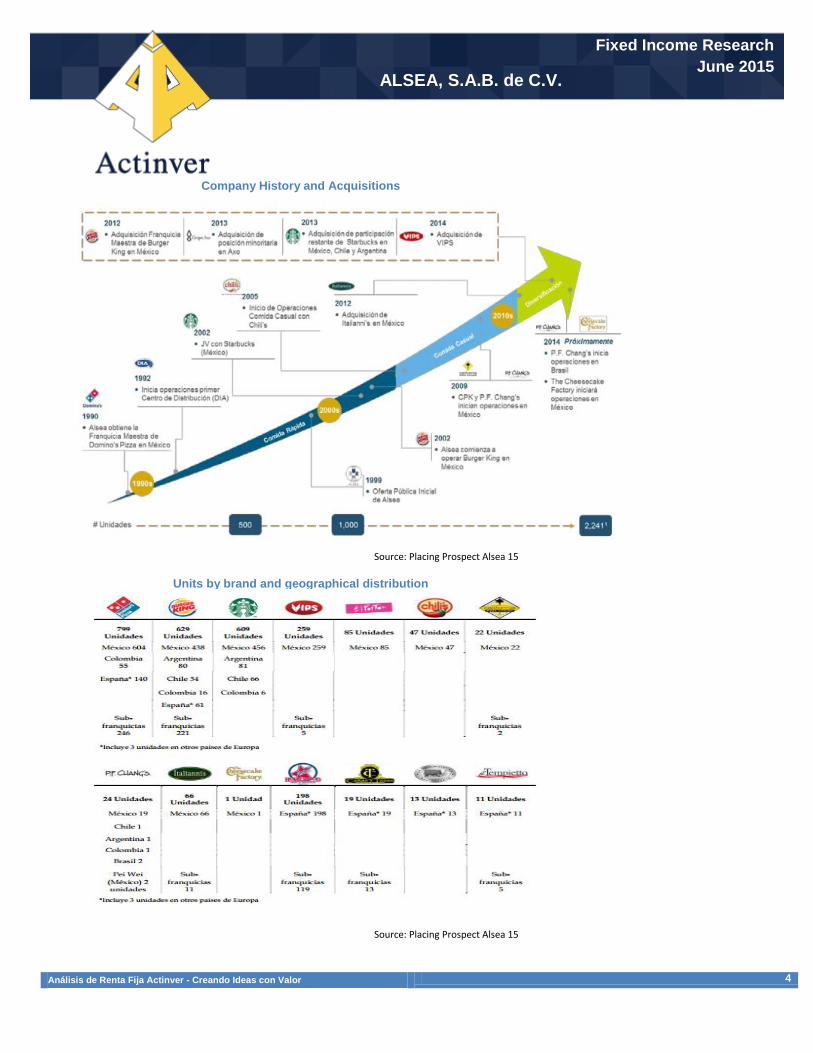
Company History and Acquisitions
Source: Placing Prospect Alsea 15
Units by brand and geographical distribution
Source: Placing Prospect Alsea 15
Análisis de Renta Fija Actinver - Creando Ideas con Valor 5
ALSEA, S.A.B. de C.V.
Fixed Income Research
June 2015
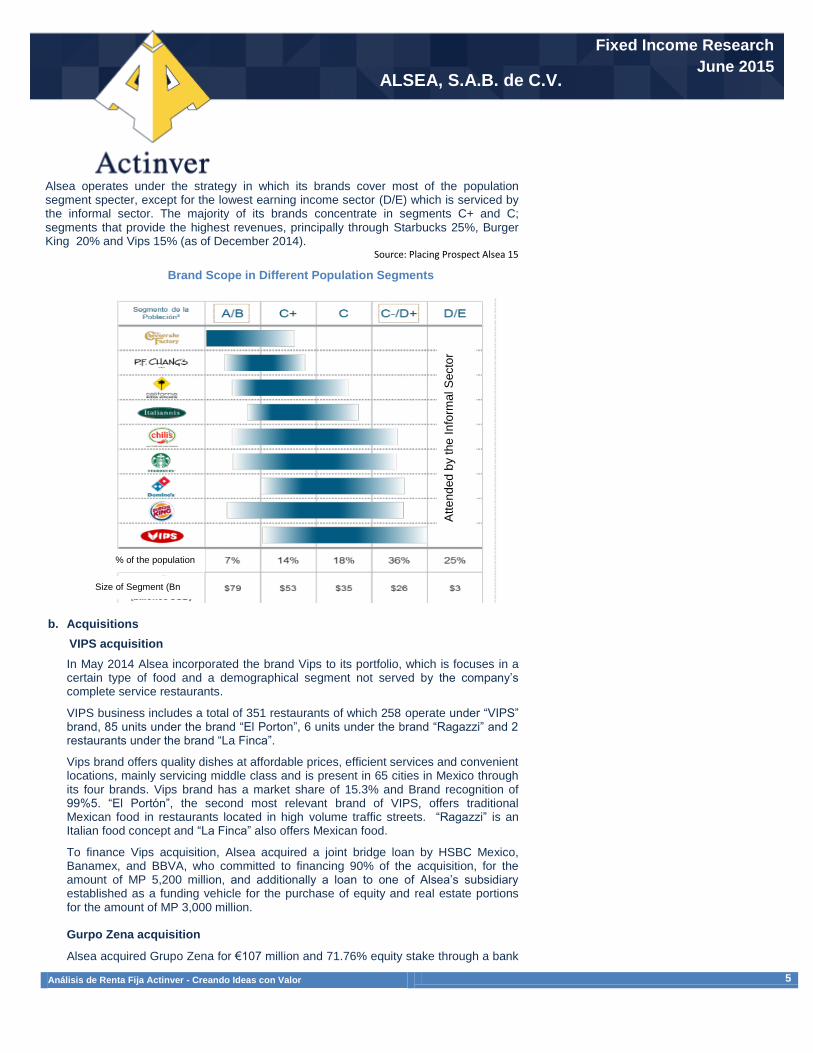
Alsea operates under the strategy in which its brands cover most of the population segment specter, except for the lowest earning income sector (D/E) which is serviced by the informal sector. The majority of its brands concentrate in segments C+ and C; segments that provide the highest revenues, principally through Starbucks 25%, Burger King 20% and Vips 15% (as of December 2014).
Source: Placing Prospect Alsea 15
Brand Scope in Different Population Segments
b. Acquisitions
VIPS acquisition
In May 2014 Alsea incorporated the brand Vips to its portfolio, which is focuses in a certain type of food and a demographical segment not served by the company’s complete service restaurants.
VIPS business includes a total of 351 restaurants of which 258 operate under “VIPS” brand, 85 units under the brand “El Porton”, 6 units under the brand “Ragazzi” and 2 restaurants under the brand “La Finca”.
Vips brand offers quality dishes at affordable prices, efficient services and convenient locations, mainly servicing middle class and is present in 65 cities in Mexico through its four brands. Vips brand has a market share of 15.3% and Brand recognition of 99%5. “El Portón”, the second most relevant brand of VIPS, offers traditional Mexican food in restaurants located in high volume traffic streets. “Ragazzi” is an Italian food concept and “La Finca” also offers Mexican food.
To finance Vips acquisition, Alsea acquired a joint bridge loan by HSBC Mexico, Banamex, and BBVA, who committed to financing 90% of the acquisition, for the amount of MP 5,200 million, and additionally a loan to one of Alsea’s subsidiary established as a funding vehicle for the purchase of equity and real estate portions for the amount of MP 3,000 million. Gurpo Zena acquisition
Alsea acquired Grupo Zena for €107 million and 71.76% equity stake through a bank
Att
en
ded
by t
he
In
form
al S
ecto
r
Size of Segment (Bn
USD)
% of the population
Análisis de Renta Fija Actinver - Creando Ideas con Valor 6
ALSEA, S.A.B. de C.V.
Fixed Income Research
June 2015
debt. Grupo Zena operated 430 restaurants in Spain of the brands Domino´s Pizza, Burger King, among others. Financing of this operation was through a bank loan acquired with BBVA Bancomer for the amount of MP 1,900 million. Additional to the debt incurred as part of the operation, the company also incorporated €115.0 million of total debt from Grupo Zena.
c. Characteristics of Company’s Portfolio
By the end of the 1Q15, the company reached 2,788 units in its portfolio, representing a growth of 907 units in comparison to the previous year. Mexico still represents the area with the highest sales with 63% and 70% in number of units.
Brands in South America had a 15.4% growth in Same-Store during the first quarter of the year in comparison with the same period of the previous year while Spain, reported Same-Store growth of 9.7% and the company as a whole a 6.3% growth during the same period. In general, Alsea increased 50% the number of units by 2014 end and 15% in terms of clients.
Growth Local vs. Clients Figures to December 2014
Company’s portfolio is well diversified in terms of sales per segment; the segment with highest revenues corresponds to fast food establishments (35%), followed by coffee shops (22%), casual food (20%) and family restaurants (19%). The outstanding balance of revenues is the distribution business being the only segment well below the others with only 4%.
Sales by segment
Sales by brand
Sales distribution by country
EBITDA distribution by country (4Q14)
Unit distribution by country
6% 11%
31%
50%
12%15%
12%15%
2011 2012 2013 2014
# of Units Client Growth
35%
22%
20%
19%
4%
Fast Food Coffee shopsCasual Food Family restaurantsDistribution
63%
18%
19%
Mexico Spain Sout America
82%
9%
3%1%
-2% 7%
Mexico Argentina Chile
Colombia Brasil Spain
1,999
162
101
78
2
442
Mexico Argentina Chile
Colombia Brasil Spain
25%
20%
18%
15%
5%
5%
5%7%
Starbucks Burger King VipsDomino's Italianni's Chili'sDIA Other
Análisis de Renta Fija Actinver - Creando Ideas con Valor 7
ALSEA, S.A.B. de C.V.
Fixed Income Research
June 2015
3. Company's Key Financial Indicators:
1Q15 Results:
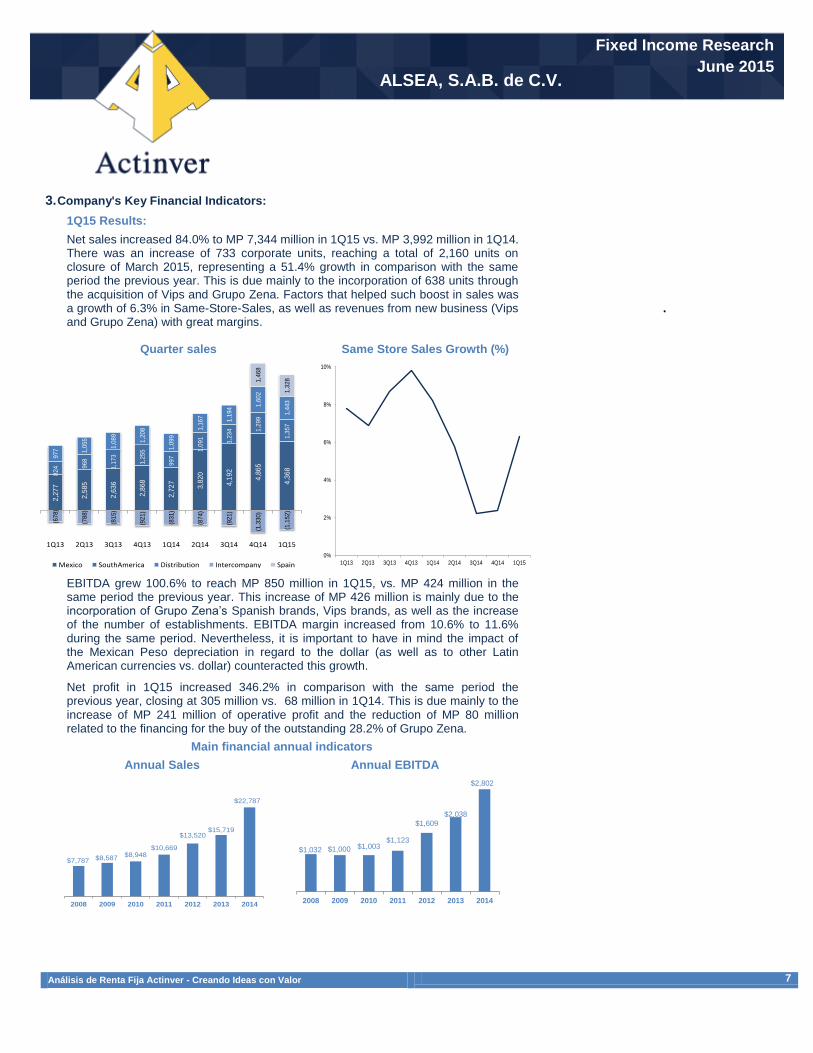
Net sales increased 84.0% to MP 7,344 million in 1Q15 vs. MP 3,992 million in 1Q14. There was an increase of 733 corporate units, reaching a total of 2,160 units on closure of March 2015, representing a 51.4% growth in comparison with the same period the previous year. This is due mainly to the incorporation of 638 units through the acquisition of Vips and Grupo Zena. Factors that helped such boost in sales was a growth of 6.3% in Same-Store-Sales, as well as revenues from new business (Vips and Grupo Zena) with great margins.
Quarter sales Same Store Sales Growth (%)
EBITDA grew 100.6% to reach MP 850 million in 1Q15, vs. MP 424 million in the same period the previous year. This increase of MP 426 million is mainly due to the incorporation of Grupo Zena’s Spanish brands, Vips brands, as well as the increase of the number of establishments. EBITDA margin increased from 10.6% to 11.6% during the same period. Nevertheless, it is important to have in mind the impact of the Mexican Peso depreciation in regard to the dollar (as well as to other Latin American currencies vs. dollar) counteracted this growth.
Net profit in 1Q15 increased 346.2% in comparison with the same period the previous year, closing at 305 million vs. 68 million in 1Q14. This is due mainly to the increase of MP 241 million of operative profit and the reduction of MP 80 million related to the financing for the buy of the outstanding 28.2% of Grupo Zena.
Main financial annual indicators
Annual Sales Annual EBITDA
.
2,2
77
2,5
85
2,6
36
2,8
68
2,7
27
3,8
20
4,1
92
4,8
65
4,3
68
824 9
68
1,1
73
1,2
55
997
1,0
91
1,2
34 1
,299
1,3
57
977 1,0
55
1,0
89
1,2
08
1,0
99
1,1
67
1,1
94
1,6
02
1,4
43
(678)
(788)
(815)
(921)
(831)
(874)
(921)
(1,3
30)
(1,1
52)
1,4
68
1,3
28
1Q13 2Q13 3Q13 4Q13 1Q14 2Q14 3Q14 4Q14 1Q15
Mexico SouthAmerica Distribution Intercompany Spain
0%
2%
4%
6%
8%
10%
1Q13 2Q13 3Q13 4Q13 1Q14 2Q14 3Q14 4Q14 1Q15
$7,787 $8,587$8,948
$10,669
$13,520$15,719
$22,787
2008 2009 2010 2011 2012 2013 2014
$1,032 $1,000 $1,003$1,123
$1,609
$2,038
$2,802
2008 2009 2010 2011 2012 2013 2014
Análisis de Renta Fija Actinver - Creando Ideas con Valor 8
ALSEA, S.A.B. de C.V.
Fixed Income Research
June 2015
ROE*
EBITDA margin
Net profit Net profit margin
Net Debt / EBITDA EBITDA / Interests
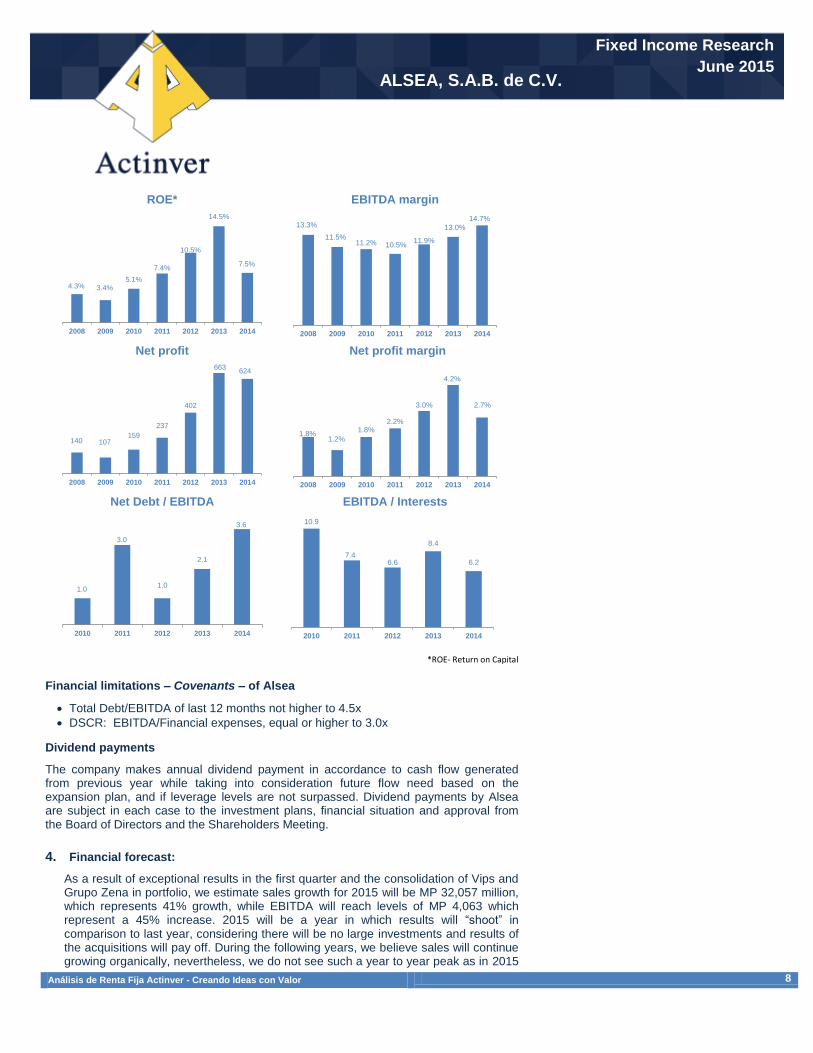
*ROE- Return on Capital
Financial limitations – Covenants – of Alsea
Total Debt/EBITDA of last 12 months not higher to 4.5x
DSCR: EBITDA/Financial expenses, equal or higher to 3.0x
Dividend payments
The company makes annual dividend payment in accordance to cash flow generated from previous year while taking into consideration future flow need based on the expansion plan, and if leverage levels are not surpassed. Dividend payments by Alsea are subject in each case to the investment plans, financial situation and approval from the Board of Directors and the Shareholders Meeting.
4. Financial forecast:
As a result of exceptional results in the first quarter and the consolidation of Vips and Grupo Zena in portfolio, we estimate sales growth for 2015 will be MP 32,057 million, which represents 41% growth, while EBITDA will reach levels of MP 4,063 which represent a 45% increase. 2015 will be a year in which results will “shoot” in comparison to last year, considering there will be no large investments and results of the acquisitions will pay off. During the following years, we believe sales will continue growing organically, nevertheless, we do not see such a year to year peak as in 2015
4.3% 3.4%5.1%
7.4%
10.5%
14.5%
7.5%
2008 2009 2010 2011 2012 2013 2014
13.3%
11.5%11.2% 10.5%
11.9%
13.0%
14.7%
2008 2009 2010 2011 2012 2013 2014
140 107159
237
402
663624
2008 2009 2010 2011 2012 2013 2014
1.8%1.2%
1.8%2.2%
3.0%
4.2%
2.7%
2008 2009 2010 2011 2012 2013 2014
1.0
3.0
1.0
2.1
3.6
2010 2011 2012 2013 2014
10.9
7.46.6
8.4
6.2
2010 2011 2012 2013 2014
Análisis de Renta Fija Actinver - Creando Ideas con Valor 9
ALSEA, S.A.B. de C.V.
Fixed Income Research
June 2015
vs. 2014.
In regard to our financial forecasts, we assume the company will not incur in additional debt and only consider interest payments; therefore cash at the end of the period will grow constantly as of 2015.
Assuming the company does not acquire additional debt from 2015 -2018
5. Financing
a. Financing Sources
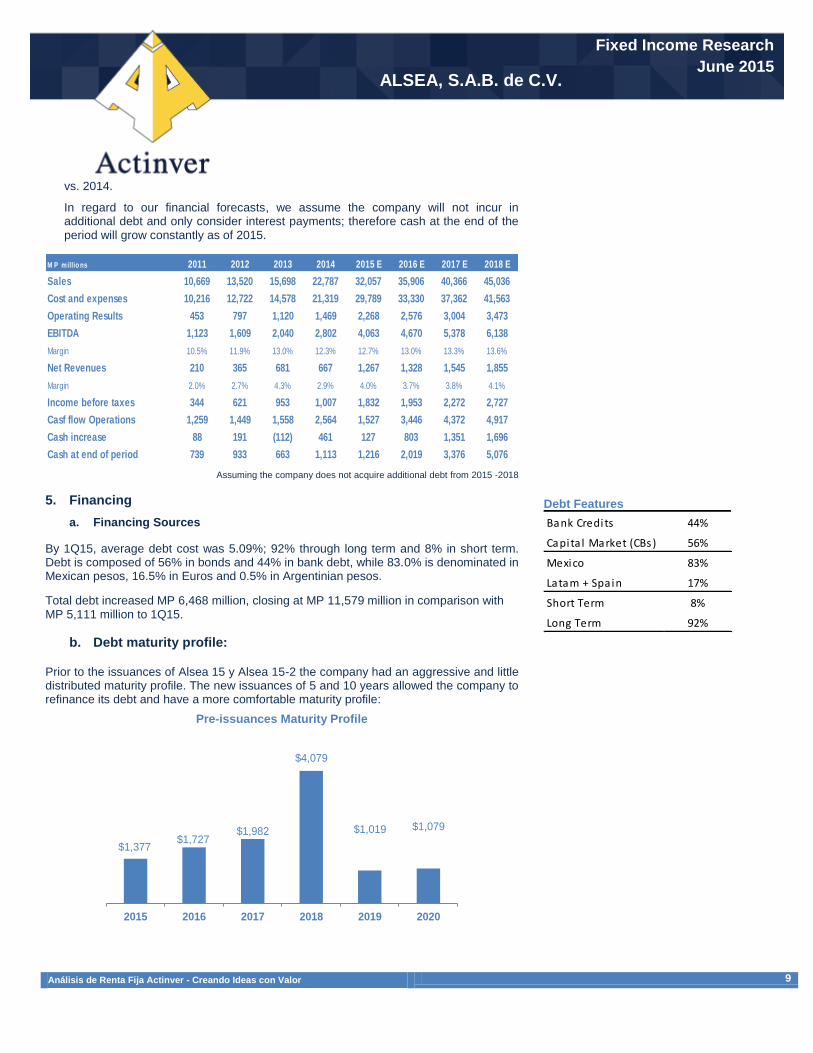
By 1Q15, average debt cost was 5.09%; 92% through long term and 8% in short term. Debt is composed of 56% in bonds and 44% in bank debt, while 83.0% is denominated in Mexican pesos, 16.5% in Euros and 0.5% in Argentinian pesos.
Total debt increased MP 6,468 million, closing at MP 11,579 million in comparison with MP 5,111 million to 1Q15.
b. Debt maturity profile:
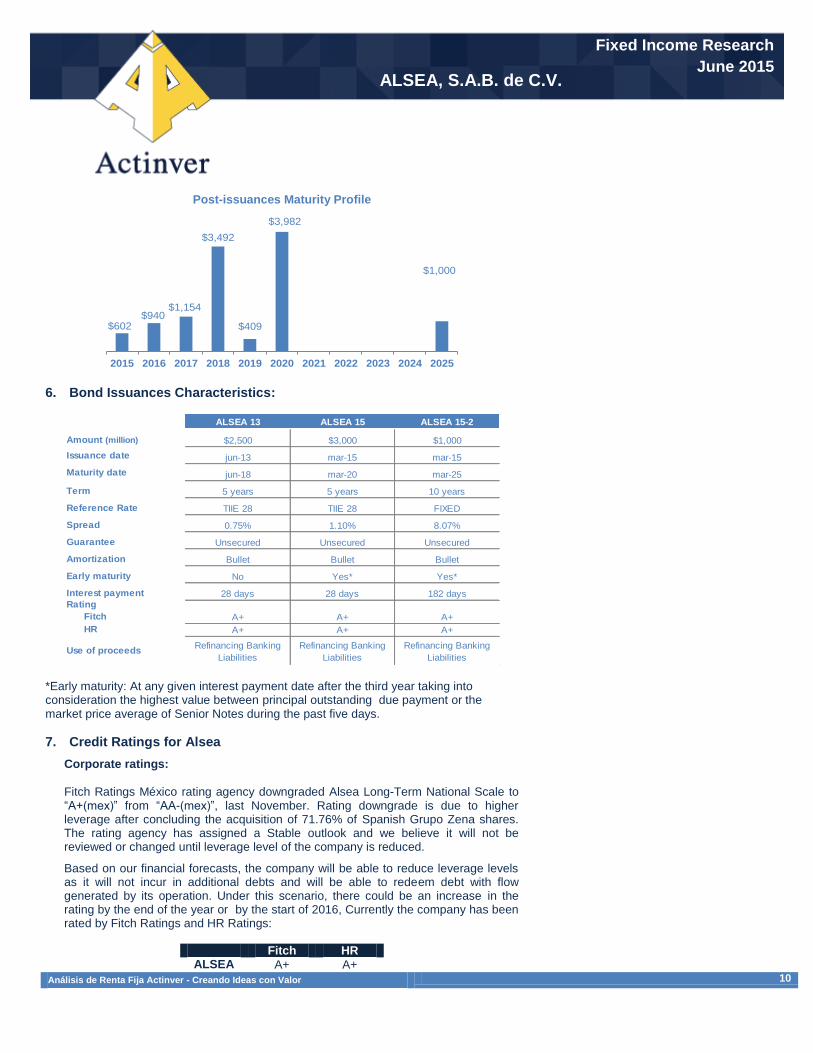
Prior to the issuances of Alsea 15 y Alsea 15-2 the company had an aggressive and little distributed maturity profile. The new issuances of 5 and 10 years allowed the company to refinance its debt and have a more comfortable maturity profile:
Pre-issuances Maturity Profile
Debt Features
M P millio ns 2011 2012 2013 2014 2015 E 2016 E 2017 E 2018 E
Sales 10,669 13,520 15,698 22,787 32,057 35,906 40,366 45,036
Cost and expenses 10,216 12,722 14,578 21,319 29,789 33,330 37,362 41,563
Operating Results 453 797 1,120 1,469 2,268 2,576 3,004 3,473
EBITDA 1,123 1,609 2,040 2,802 4,063 4,670 5,378 6,138
Margin 10.5% 11.9% 13.0% 12.3% 12.7% 13.0% 13.3% 13.6%
Net Revenues 210 365 681 667 1,267 1,328 1,545 1,855
Margin 2.0% 2.7% 4.3% 2.9% 4.0% 3.7% 3.8% 4.1%
Income before taxes 344 621 953 1,007 1,832 1,953 2,272 2,727
Casf flow Operations 1,259 1,449 1,558 2,564 1,527 3,446 4,372 4,917
Cash increase 88 191 (112) 461 127 803 1,351 1,696
Cash at end of period 739 933 663 1,113 1,216 2,019 3,376 5,076
$1,377$1,727
$1,982
$4,079
$1,019 $1,079
2015 2016 2017 2018 2019 2020
Bank Credits 44%
Capita l Market (CBs) 56%
Mexico 83%
Latam + Spain 17%
Short Term 8%
Long Term 92%
Análisis de Renta Fija Actinver - Creando Ideas con Valor 10
ALSEA, S.A.B. de C.V.
Fixed Income Research
June 2015
Post-issuances Maturity Profile
6. Bond Issuances Characteristics:
*Early maturity: At any given interest payment date after the third year taking into consideration the highest value between principal outstanding due payment or the market price average of Senior Notes during the past five days.
7. Credit Ratings for Alsea
Corporate ratings:
Fitch Ratings México rating agency downgraded Alsea Long-Term National Scale to “A+(mex)” from “AA-(mex)”, last November. Rating downgrade is due to higher leverage after concluding the acquisition of 71.76% of Spanish Grupo Zena shares. The rating agency has assigned a Stable outlook and we believe it will not be reviewed or changed until leverage level of the company is reduced.
Based on our financial forecasts, the company will be able to reduce leverage levels as it will not incur in additional debts and will be able to redeem debt with flow generated by its operation. Under this scenario, there could be an increase in the rating by the end of the year or by the start of 2016, Currently the company has been rated by Fitch Ratings and HR Ratings:
Fitch HR
ALSEA A+ A+
$602$940
$1,154
$3,492
$409
$3,982
$1,000
2015 2016 2017 2018 2019 2020 2021 2022 2023 2024 2025
ALSEA 13 ALSEA 15 ALSEA 15-2
Amount (million) $2,500 $3,000 $1,000
Issuance date jun-13 mar-15 mar-15
Maturity date jun-18 mar-20 mar-25
Term 5 years 5 years 10 years
Reference Rate TIIE 28 TIIE 28 FIXED
Spread 0.75% 1.10% 8.07%
Guarantee Unsecured Unsecured Unsecured
Amortization Bullet Bullet Bullet
Early maturity No Yes* Yes*
Interest payment 28 days 28 days 182 daysRating
Fitch A+ A+ A+
HR A+ A+ A+
Use of proceedsRefinancing Banking
Liabilities
Refinancing Banking
Liabilities
Refinancing Banking
Liabilities
Análisis de Renta Fija Actinver - Creando Ideas con Valor 11
ALSEA, S.A.B. de C.V.
Fixed Income Research
June 2015
An “A-“rating means the issuer offers acceptable security for the timely payment of debt and maintains a low loan risks facing adverse scenarios. Nevertheless, the macroeconomic volatility or bad results during a short period on behalf of the company could affect the prompt payment capacity.
Positive rating boosters considered by agencies:
VIPS and Grupo Zena acquisition has provided operative diversification for Alsea in terms of EBITDA generation.
Revenues diversification with a vast brand portfolio, in which the highest stake brand Starbucks represents 24.8% of the company’s total revenues.
Debt is distributed at a longer term; hence the company will not have demanding redemptions in the short term. This will generate a higher operative margin and be able to allocate more resources to Capex or futures acquisitions.
High levels of Capex related to the commitment on opening new units, nevertheless, the company has sufficient flow to be able to make these investments without additional debt.
CB Ratings:
Issue Fitch HR
ALSEA 13 A+ A+ ALSEA 15 A+ A+
ALSEA 15-2 A+ A+
8. Industry Analysis
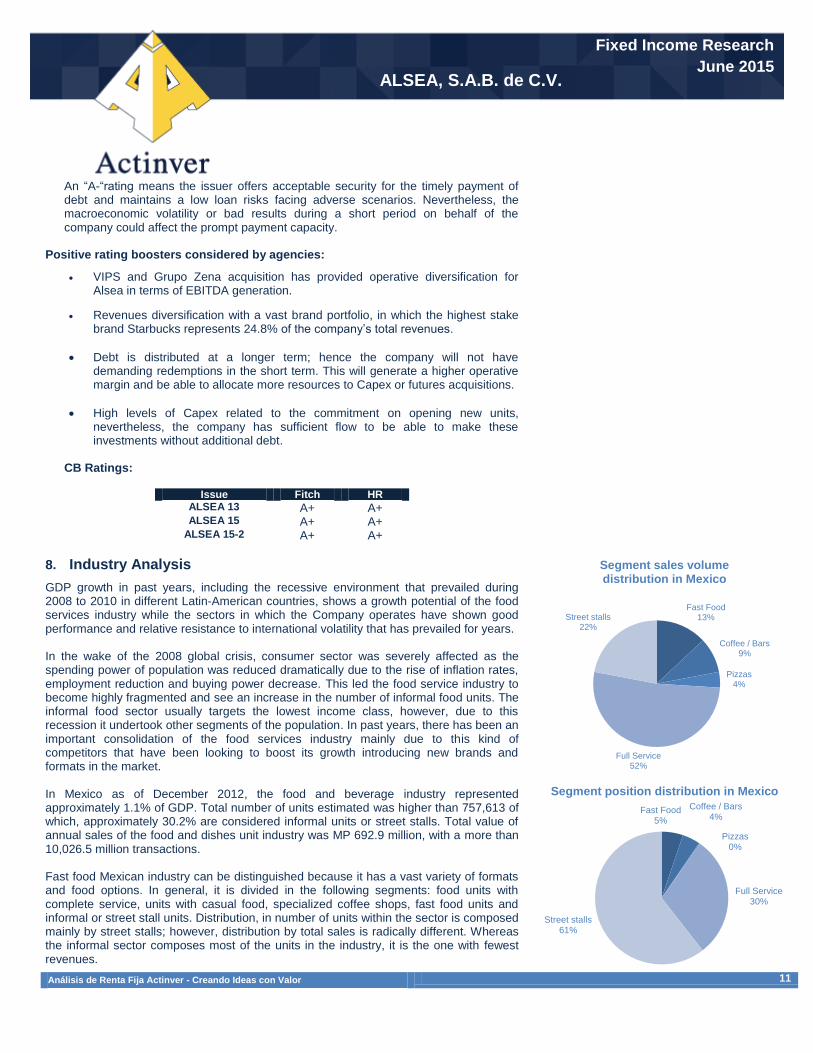
GDP growth in past years, including the recessive environment that prevailed during 2008 to 2010 in different Latin-American countries, shows a growth potential of the food services industry while the sectors in which the Company operates have shown good performance and relative resistance to international volatility that has prevailed for years. In the wake of the 2008 global crisis, consumer sector was severely affected as the spending power of population was reduced dramatically due to the rise of inflation rates, employment reduction and buying power decrease. This led the food service industry to become highly fragmented and see an increase in the number of informal food units. The informal food sector usually targets the lowest income class, however, due to this recession it undertook other segments of the population. In past years, there has been an important consolidation of the food services industry mainly due to this kind of competitors that have been looking to boost its growth introducing new brands and formats in the market. In Mexico as of December 2012, the food and beverage industry represented approximately 1.1% of GDP. Total number of units estimated was higher than 757,613 of which, approximately 30.2% are considered informal units or street stalls. Total value of annual sales of the food and dishes unit industry was MP 692.9 million, with a more than 10,026.5 million transactions. Fast food Mexican industry can be distinguished because it has a vast variety of formats and food options. In general, it is divided in the following segments: food units with complete service, units with casual food, specialized coffee shops, fast food units and informal or street stall units. Distribution, in number of units within the sector is composed mainly by street stalls; however, distribution by total sales is radically different. Whereas the informal sector composes most of the units in the industry, it is the one with fewest revenues.
Segment sales volume distribution in Mexico
Segment position distribution in Mexico
Fast Food13%
Coffee / Bars9%
Pizzas4%
Full Service52%
Street stalls22%
Fast Food5%
Coffee / Bars4%
Pizzas0%
Full Service30%
Street stalls61%
Análisis de Renta Fija Actinver - Creando Ideas con Valor 12
ALSEA, S.A.B. de C.V.
Fixed Income Research
June 2015
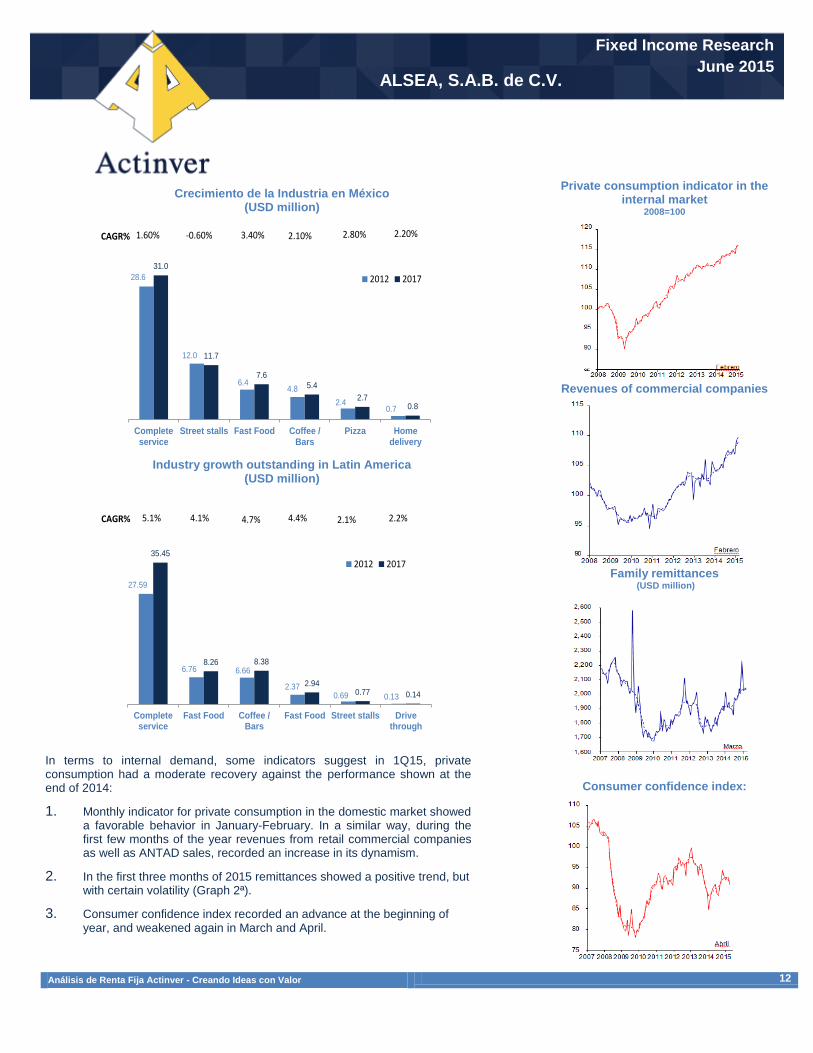
Crecimiento de la Industria en México (USD million)
Industry growth outstanding in Latin America (USD million)
In terms to internal demand, some indicators suggest in 1Q15, private consumption had a moderate recovery against the performance shown at the end of 2014:
1. Monthly indicator for private consumption in the domestic market showed a favorable behavior in January-February. In a similar way, during the first few months of the year revenues from retail commercial companies as well as ANTAD sales, recorded an increase in its dynamism.
2. In the first three months of 2015 remittances showed a positive trend, but with certain volatility (Graph 2ª).
3. Consumer confidence index recorded an advance at the beginning of year, and weakened again in March and April.
Private consumption indicator in the internal market
2008=100
Revenues of commercial companies
Family remittances
(USD million)
Consumer confidence index:
28.6
12.0
6.44.8
2.40.7
31.0
11.7
7.6
5.4
2.70.8
1.60% -0.60% 3.40% 2.10% 2.80% 2.20%
-1.00%
-0.50%
0.00%
0.50%
1.00%
1.50%
2.00%
2.50%
3.00%
3.50%
4.00%
0.0
5.0
10.0
15.0
20.0
25.0
30.0
35.0
Completeservice
Street stalls Fast Food Coffee /Bars
Pizza Homedelivery
CAGR%
2012 2017
27.59
6.76 6.66
2.370.69 0.13
35.45
8.26 8.38
2.940.77 0.14
5.1% 4.1% 4.7% 4.4% 2.1% 2.2%
0.0%
1.0%
2.0%
3.0%
4.0%
5.0%
6.0%
0
5
10
15
20
25
30
35
40
Completeservice
Fast Food Coffee /Bars
Fast Food Street stalls Drivethrough
CAGR%
2012 2017
Análisis de Renta Fija Actinver - Creando Ideas con Valor 13
ALSEA, S.A.B. de C.V.
Fixed Income Research
June 2015
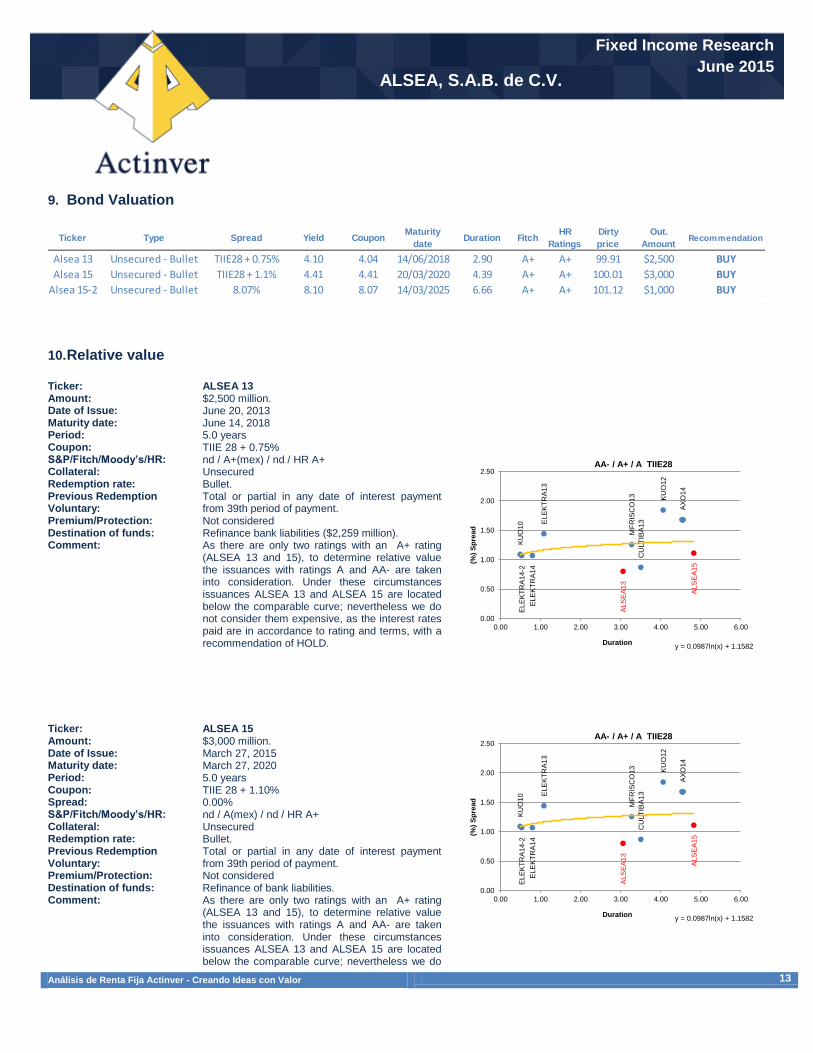
9. Bond Valuation
10. Relative value
Ticker: ALSEA 13
Amount: $2,500 million. Date of Issue: June 20, 2013 Maturity date: June 14, 2018 Period: 5.0 years Coupon: TIIE 28 + 0.75% S&P/Fitch/Moody’s/HR: nd / A+(mex) / nd / HR A+ Collateral: Unsecured Redemption rate: Bullet. Previous Redemption Voluntary:
Total or partial in any date of interest payment from 39th period of payment.
Premium/Protection: Not considered Destination of funds: Comment:
Refinance bank liabilities ($2,259 million). As there are only two ratings with an A+ rating (ALSEA 13 and 15), to determine relative value the issuances with ratings A and AA- are taken into consideration. Under these circumstances issuances ALSEA 13 and ALSEA 15 are located below the comparable curve; nevertheless we do not consider them expensive, as the interest rates paid are in accordance to rating and terms, with a recommendation of HOLD.
Ticker: ALSEA 15
Amount: $3,000 million. Date of Issue: March 27, 2015 Maturity date: March 27, 2020 Period: 5.0 years Coupon: TIIE 28 + 1.10% Spread: 0.00% S&P/Fitch/Moody’s/HR: nd / A(mex) / nd / HR A+ Collateral: Unsecured Redemption rate: Bullet. Previous Redemption Voluntary:
Total or partial in any date of interest payment from 39th period of payment.
Premium/Protection: Not considered Destination of funds: Comment:
Refinance of bank liabilities. As there are only two ratings with an A+ rating (ALSEA 13 and 15), to determine relative value the issuances with ratings A and AA- are taken into consideration. Under these circumstances issuances ALSEA 13 and ALSEA 15 are located below the comparable curve; nevertheless we do
Ticker Type Spread Yield CouponMaturity
dateDuration Fitch
HR
Ratings
Dirty
price
Out.
AmountRecommendation
Alsea 13 Unsecured - Bullet TIIE28 + 0.75% 4.10 4.04 14/06/2018 2.90 A+ A+ 99.91 $2,500 BUY
Alsea 15 Unsecured - Bullet TIIE28 + 1.1% 4.41 4.41 20/03/2020 4.39 A+ A+ 100.01 $3,000 BUY
Alsea 15-2 Unsecured - Bullet 8.07% 8.10 8.07 14/03/2025 6.66 A+ A+ 101.12 $1,000 BUY
KU
O10
KU
O12
ALS
EA
13
ELE
KT
RA
13
MF
RIS
CO
13
CU
LT
IBA
13
ELE
KT
RA
14
ELE
KT
RA
14
-2
AX
O14
ALS
EA
15
y = 0.0987ln(x) + 1.1582
0.00
0.50
1.00
1.50
2.00
2.50
0.00 1.00 2.00 3.00 4.00 5.00 6.00
(%)
Sp
rea
d
Duration
AA- / A+ / A TIIE28
KU
O10
KU
O12
ALS
EA
13
ELE
KT
RA
13
MF
RIS
CO
13
CU
LT
IBA
13
ELE
KT
RA
14
ELE
KT
RA
14
-2
AX
O14
ALS
EA
15
y = 0.0987ln(x) + 1.1582
0.00
0.50
1.00
1.50
2.00
2.50
0.00 1.00 2.00 3.00 4.00 5.00 6.00
(%)
Sp
rea
d
Duration
AA- / A+ / A TIIE28
Análisis de Renta Fija Actinver - Creando Ideas con Valor 14
ALSEA, S.A.B. de C.V.
Fixed Income Research
June 2015
not consider them expensive, as the interest rates paid are in accordance to rating and terms, with a recommendation of HOLD. .
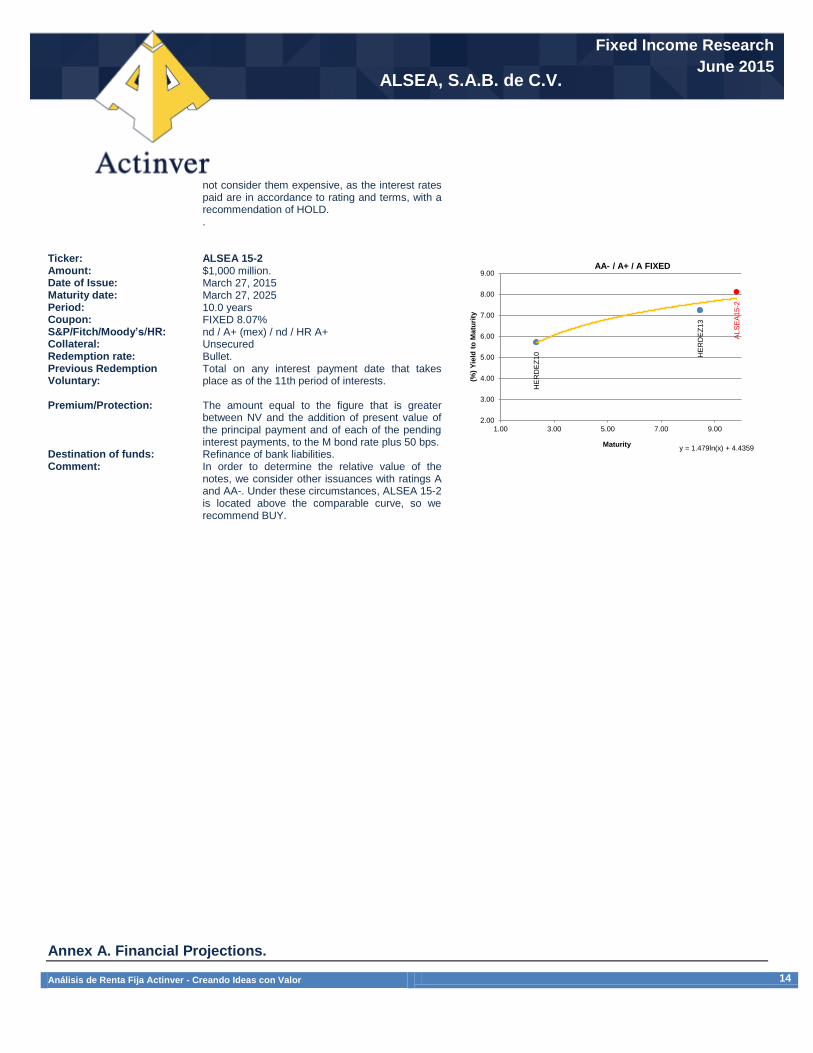
Ticker: ALSEA 15-2
Amount: $1,000 million. Date of Issue: March 27, 2015 Maturity date: March 27, 2025 Period: 10.0 years Coupon: FIXED 8.07% S&P/Fitch/Moody’s/HR: nd / A+ (mex) / nd / HR A+ Collateral: Unsecured Redemption rate: Bullet. Previous Redemption Voluntary:
Total on any interest payment date that takes place as of the 11th period of interests.
Premium/Protection: The amount equal to the figure that is greater between NV and the addition of present value of the principal payment and of each of the pending interest payments, to the M bond rate plus 50 bps.
Destination of funds: Comment:
Refinance of bank liabilities. In order to determine the relative value of the notes, we consider other issuances with ratings A and AA-. Under these circumstances, ALSEA 15-2 is located above the comparable curve, so we recommend BUY.
Annex A. Financial Projections.
HE
RD
EZ
10 HE
RD
EZ
13
ALS
EA
15
-2
y = 1.479ln(x) + 4.4359
2.00
3.00
4.00
5.00
6.00
7.00
8.00
9.00
1.00 3.00 5.00 7.00 9.00
(%)
Yie
ld t
o M
atu
rity
Maturity
AA- / A+ / A FIXED
Análisis de Renta Fija Actinver - Creando Ideas con Valor 15
ALSEA, S.A.B. de C.V.
Fixed Income Research
June 2015
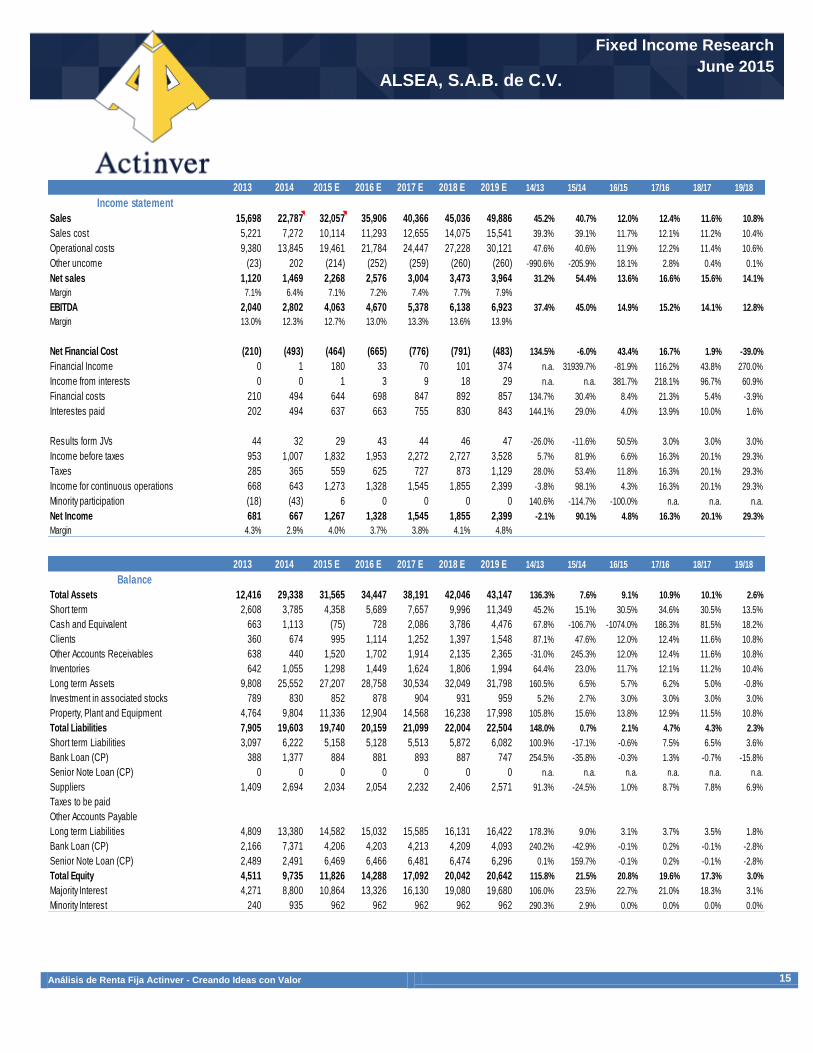
2013 2014 2015 E 2016 E 2017 E 2018 E 2019 E 14/13 15/14 16/15 17/16 18/17 19/18
Income statement
Sales 15,698 22,787 32,057 35,906 40,366 45,036 49,886 45.2% 40.7% 12.0% 12.4% 11.6% 10.8%
Sales cost 5,221 7,272 10,114 11,293 12,655 14,075 15,541 39.3% 39.1% 11.7% 12.1% 11.2% 10.4%
Operational costs 9,380 13,845 19,461 21,784 24,447 27,228 30,121 47.6% 40.6% 11.9% 12.2% 11.4% 10.6%
Other uncome (23) 202 (214) (252) (259) (260) (260) -990.6% -205.9% 18.1% 2.8% 0.4% 0.1%
Net sales 1,120 1,469 2,268 2,576 3,004 3,473 3,964 31.2% 54.4% 13.6% 16.6% 15.6% 14.1%
Margin 7.1% 6.4% 7.1% 7.2% 7.4% 7.7% 7.9%
EBITDA 2,040 2,802 4,063 4,670 5,378 6,138 6,923 37.4% 45.0% 14.9% 15.2% 14.1% 12.8%
Margin 13.0% 12.3% 12.7% 13.0% 13.3% 13.6% 13.9%
Net Financial Cost (210) (493) (464) (665) (776) (791) (483) 134.5% -6.0% 43.4% 16.7% 1.9% -39.0%
Financial Income 0 1 180 33 70 101 374 n.a. 31939.7% -81.9% 116.2% 43.8% 270.0%
Income from interests 0 0 1 3 9 18 29 n.a. n.a. 381.7% 218.1% 96.7% 60.9%
Financial costs 210 494 644 698 847 892 857 134.7% 30.4% 8.4% 21.3% 5.4% -3.9%
Interestes paid 202 494 637 663 755 830 843 144.1% 29.0% 4.0% 13.9% 10.0% 1.6%
Results form JVs 44 32 29 43 44 46 47 -26.0% -11.6% 50.5% 3.0% 3.0% 3.0%
Income before taxes 953 1,007 1,832 1,953 2,272 2,727 3,528 5.7% 81.9% 6.6% 16.3% 20.1% 29.3%
Taxes 285 365 559 625 727 873 1,129 28.0% 53.4% 11.8% 16.3% 20.1% 29.3%
Income for continuous operations 668 643 1,273 1,328 1,545 1,855 2,399 -3.8% 98.1% 4.3% 16.3% 20.1% 29.3%
Minority participation (18) (43) 6 0 0 0 0 140.6% -114.7% -100.0% n.a. n.a. n.a.
Net Income 681 667 1,267 1,328 1,545 1,855 2,399 -2.1% 90.1% 4.8% 16.3% 20.1% 29.3%
Margin 4.3% 2.9% 4.0% 3.7% 3.8% 4.1% 4.8%
2013 2014 2015 E 2016 E 2017 E 2018 E 2019 E 14/13 15/14 16/15 17/16 18/17 19/18
Balance
Total Assets 12,416 29,338 31,565 34,447 38,191 42,046 43,147 136.3% 7.6% 9.1% 10.9% 10.1% 2.6%
Short term 2,608 3,785 4,358 5,689 7,657 9,996 11,349 45.2% 15.1% 30.5% 34.6% 30.5% 13.5%
Cash and Equivalent 663 1,113 (75) 728 2,086 3,786 4,476 67.8% -106.7% -1074.0% 186.3% 81.5% 18.2%
Clients 360 674 995 1,114 1,252 1,397 1,548 87.1% 47.6% 12.0% 12.4% 11.6% 10.8%
Other Accounts Receivables 638 440 1,520 1,702 1,914 2,135 2,365 -31.0% 245.3% 12.0% 12.4% 11.6% 10.8%
Inventories 642 1,055 1,298 1,449 1,624 1,806 1,994 64.4% 23.0% 11.7% 12.1% 11.2% 10.4%
Long term Assets 9,808 25,552 27,207 28,758 30,534 32,049 31,798 160.5% 6.5% 5.7% 6.2% 5.0% -0.8%
Investment in associated stocks 789 830 852 878 904 931 959 5.2% 2.7% 3.0% 3.0% 3.0% 3.0%
Property, Plant and Equipment 4,764 9,804 11,336 12,904 14,568 16,238 17,998 105.8% 15.6% 13.8% 12.9% 11.5% 10.8%
Total Liabilities 7,905 19,603 19,740 20,159 21,099 22,004 22,504 148.0% 0.7% 2.1% 4.7% 4.3% 2.3%
Short term Liabilities 3,097 6,222 5,158 5,128 5,513 5,872 6,082 100.9% -17.1% -0.6% 7.5% 6.5% 3.6%
Bank Loan (CP) 388 1,377 884 881 893 887 747 254.5% -35.8% -0.3% 1.3% -0.7% -15.8%
Senior Note Loan (CP) 0 0 0 0 0 0 0 n.a. n.a. n.a. n.a. n.a. n.a.
Suppliers 1,409 2,694 2,034 2,054 2,232 2,406 2,571 91.3% -24.5% 1.0% 8.7% 7.8% 6.9%
Taxes to be paid
Other Accounts Payable
Long term Liabilities 4,809 13,380 14,582 15,032 15,585 16,131 16,422 178.3% 9.0% 3.1% 3.7% 3.5% 1.8%
Bank Loan (CP) 2,166 7,371 4,206 4,203 4,213 4,209 4,093 240.2% -42.9% -0.1% 0.2% -0.1% -2.8%
Senior Note Loan (CP) 2,489 2,491 6,469 6,466 6,481 6,474 6,296 0.1% 159.7% -0.1% 0.2% -0.1% -2.8%
Total Equity 4,511 9,735 11,826 14,288 17,092 20,042 20,642 115.8% 21.5% 20.8% 19.6% 17.3% 3.0%
Majority Interest 4,271 8,800 10,864 13,326 16,130 19,080 19,680 106.0% 23.5% 22.7% 21.0% 18.3% 3.1%
Minority Interest 240 935 962 962 962 962 962 290.3% 2.9% 0.0% 0.0% 0.0% 0.0%
Análisis de Renta Fija Actinver - Creando Ideas con Valor 16
ALSEA, S.A.B. de C.V.
Fixed Income Research
June 2015
Fixed Income, Equity, Economic, Quantitative Research Departments
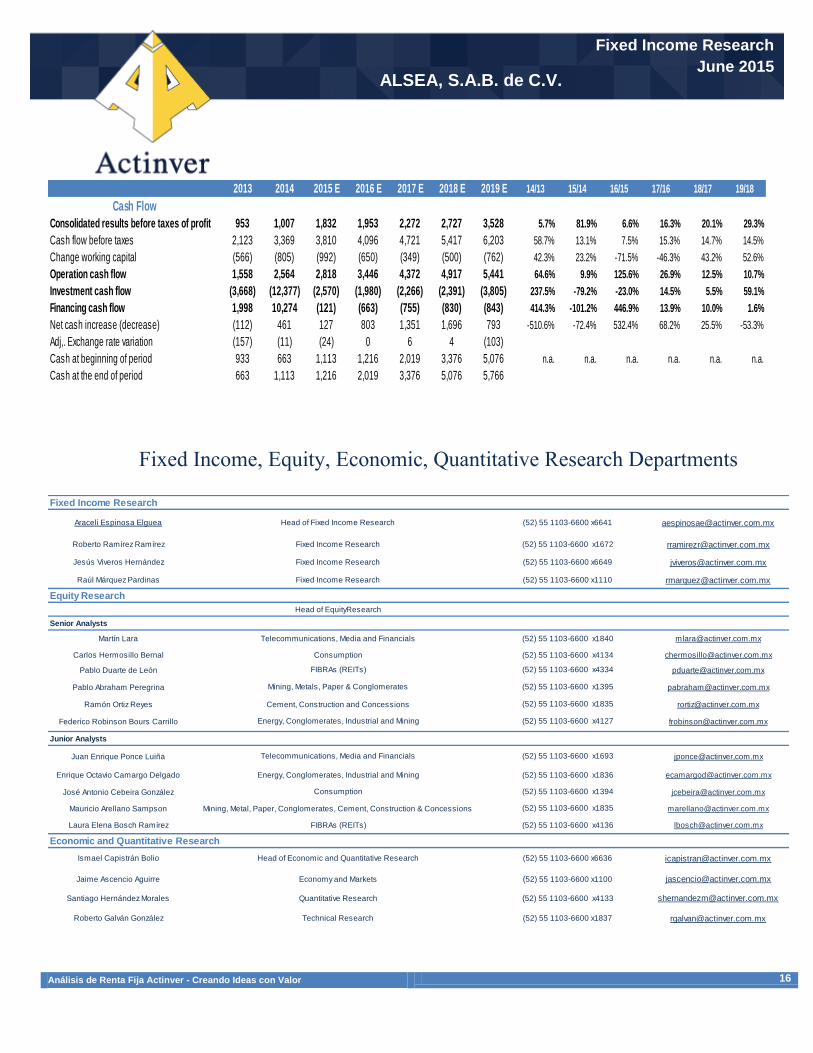
2013 2014 2015 E 2016 E 2017 E 2018 E 2019 E 14/13 15/14 16/15 17/16 18/17 19/18
Cash Flow
Consolidated results before taxes of profit 953 1,007 1,832 1,953 2,272 2,727 3,528 5.7% 81.9% 6.6% 16.3% 20.1% 29.3%
Cash flow before taxes 2,123 3,369 3,810 4,096 4,721 5,417 6,203 58.7% 13.1% 7.5% 15.3% 14.7% 14.5%
Change working capital (566) (805) (992) (650) (349) (500) (762) 42.3% 23.2% -71.5% -46.3% 43.2% 52.6%
Operation cash flow 1,558 2,564 2,818 3,446 4,372 4,917 5,441 64.6% 9.9% 125.6% 26.9% 12.5% 10.7%
Investment cash flow (3,668) (12,377) (2,570) (1,980) (2,266) (2,391) (3,805) 237.5% -79.2% -23.0% 14.5% 5.5% 59.1%
Financing cash flow 1,998 10,274 (121) (663) (755) (830) (843) 414.3% -101.2% 446.9% 13.9% 10.0% 1.6%
Net cash increase (decrease) (112) 461 127 803 1,351 1,696 793 -510.6% -72.4% 532.4% 68.2% 25.5% -53.3%
Adj,. Exchange rate variation (157) (11) (24) 0 6 4 (103)
Cash at beginning of period 933 663 1,113 1,216 2,019 3,376 5,076 n.a. n.a. n.a. n.a. n.a. n.a.
Cash at the end of period 663 1,113 1,216 2,019 3,376 5,076 5,766
Araceli Espinosa Elguea Head of Fixed Income Research [email protected]
Roberto Ramírez Ramírez Fixed Income Research [email protected]
Jesús Viveros Hernández Fixed Income Research [email protected]
Raúl Márquez Pardinas Fixed Income Research [email protected]
Martín Lara [email protected]
Carlos Hermosillo Bernal [email protected]
Pablo Duarte de León [email protected]
Pablo Abraham Peregrina [email protected]
Ramón Ortiz Reyes Cement, Construction and Concessions [email protected]
Federico Robinson Bours Carrillo [email protected]
Juan Enrique Ponce Luiña jponce@actinver,com.mx
Enrique Octavio Camargo Delgado [email protected]
José Antonio Cebeira González [email protected]
Mauricio Arellano Sampson Mining, Metal, Paper, Conglomerates, Cement, Construction & Concessions [email protected]
Laura Elena Bosch Ramírez [email protected]
Ismael Capistrán Bolio Head of Economic and Quantitative Research [email protected]
Jaime Ascencio Aguirre Economy and Markets [email protected]
Santiago Hernández Morales Quantitative Research [email protected]
Roberto Galván González Technical Research [email protected]
(52) 55 1103-6600 x6649
(52) 55 1103-6600 x1110
(52) 55 1103-6600 x4133
(52) 55 1103-6600 x1837
Economic and Quantitative Research
(52) 55 1103-6600 x6636
(52) 55 1103-6600 x1100
Consumption (52) 55 1103-6600 x4134
FIBRAs (REITs) (52) 55 1103-6600 x4334
Fixed Income Research
(52) 55 1103-6600 x6641
(52) 55 1103-6600 x1672
(52) 55 1103-6600 x1835
FIBRAs (REITs) (52) 55 1103-6600 x4136
Telecommunications, Media and Financials (52) 55 1103-6600 x1693
Energy, Conglomerates, Industrial and Mining (52) 55 1103-6600 x1836
Consumption (52) 55 1103-6600 x1394
(52) 55 1103-6600 x1835
Energy, Conglomerates, Industrial and Mining (52) 55 1103-6600 x4127
Junior Analysts
Mining, Metals, Paper & Conglomerates (52) 55 1103-6600 x1395
Equity Research
Head of EquityResearch
Senior Analysts
Telecommunications, Media and Financials (52) 55 1103-6600 x1840
Análisis de Renta Fija Actinver - Creando Ideas con Valor 17
ALSEA, S.A.B. de C.V.
Fixed Income Research
June 2015
Limit of responsibilities
Guía para recomendaciones sobre inversión en emisoras bajo cobertura que formen parte, o fuera, del Índice de
Precios y Cotizaciones (IPC)
Compra. El retorno de la acción debe ser superior al retorno total del IPC en el año en curso.
Neutral. El retorno de la acción debe ser superior al retorno total del IPC en el año en curso.
Sales El retorno de la acción debe ser superior al retorno total del IPC en el año en curso.
Important Statements
a) Of the Analysts:
"The analysts in charge of producing Analysts Reports:
Jaime Ascencio Aguirre; Mauricio Arellano Sampson; Laura Elena Bosch Ramirez, Enrique Octavio Camargo Delgado; Ismael Capistrán Bolio; José
Antonio Cebeira González, Pablo Enrique Duarte de León; Araceli Espinosa Elguea; Roberto Galván González; Carlos Hermosillo Bernal; Santiago
Hernández Morales; Martín Roberto Lara Poo; Raúl Márquez Pardinas, Ramón Ortiz Reyes; Pablo Abraham Peregrina; Juan Enrique Ponce Luiña;
Federico Robinson Bours Carrillo; Jesús Viveros Hernández, declaramos”:
1. "All points of view about the issuers under coverage exclusively to the responsible analyst and authentically reflects his vision. All recommendations made by analysts are prepared independently of any institution, including the institution where the services are provided of companies belonging to the same financial or business group. The compensation scheme is not based or related, directly or indirectly, with any specific recommendation and the remuneration is only received from the entity whom the analysts provide their services."
2. "None of the analysts with coverage of the issuers mentioned in this report holds any office, position or commission at issuers under this coverage, or any of the people who are part of the Business Group or consortium to which they belong. They have never held any position during the twelve months prior to the preparation of this report."
3. "The recommendations on issuers, made by the analyst who covers them, are based on public information and there is no guarantee of their assertiveness regarding the performance that is actually in the values objects of the recommendation."
4. "Analysts maintain investments subject to their analysis reports on the following issuers: AC, ACTINVR, ALFA, ALPEK, ALSEA, AMX, AZTECA, CEMEX, CHDRAUI, FEMSA, FIBRAMQ, FINDEP, FUNO, GENTERA, GFREGIO, GRUMA, ICA, IENOVA, KOF, LAB, LIVEPOL, MEXCHEM, OHLMEX, PEÑOLES, POCHTEC, TLEVISA, SORIANA, SPORTS, VESTA y WALMEX.
b) On Actinver Casa de Bolsa, S.A. de C.V. Grupo Financiero Actinver
1. Actinver Casa de Bolsa, S.A. de C.V. GrupoFinanciero Actinver, under any circumstance shall ensure the sense of the recommendations contained in the reports of analysis to ensure future business relationship.
2. All Actinver Casa de Bolsa, SA de C.V. GrupoFinanciero Actinver business units can explore and do business with any company mentioned in documents of analysis. All compensation for services given in the past or in the future, received by Actinver Casa de Bolsa, SA de C.V. GrupoFinanciero Actinver by any company mentioned in this report has not had and will not have any effect on the compensation paid to the analysts. However, just like any other employee of Actinver Group and its subsidiaries, the compensation being enjoyed by our analysts will be affected by the profitability gained by Actinver Group and its subsidiaries.
3. At the end of each of the previous three months, Actinver Casa de Bolsa, SA de C.V. Actinver Financial Group, has not held any investments directly or indirectly in securities or financial derivatives, whose underlying are Securities subject of the analysis reports, representing one percent or more of its portfolio of securities, investment portfolio, outstanding of the Securities or the underlying value of the question, except for the following: * AEROMEX, AXML, BOLSA A, FINN 13, FSHOP 13, SMARTRC14.
4. Certain directors and officers of Actinver Casa de Bolsa, SA de C.V. GrupoFinanciero Actinver occupy a similar position at the following issuers: AEROMEX, MASECA, AZTECA, ALSEA, FINN, MAXCOM, SPORTS, FSHOP, and FUNO.
This report will be distributed to all persons who meet the profile to acquire the type of values that is recommended in its content.
To see our analysts’ change of recommendation, click here.