Embed Size (px)
Citation preview
Magneto-Optic Kerr Effect in a Magnetized Electron Gun
Benjamin M. Hardy
Research Experience for Undergraduates Accelerator and Nuclear Physics Old Dominion University and Jefferson Laboratory
Bowling Green State University, Bowling Green
Thomas Jefferson National Accelerator Lab
Prepared in partial fulfillment of the requirement of the Department of Energy’s Office of Science, National Science Foundation, Old Dominion University, and Thomas Jefferson National Accelerator Lab under the direction of Joseph Grames in the Center for Injectors and Sources at Thomas Jefferson National Accelerator Laboratory.
Participant: __________________________________
Signature
Research Advisor: ______________________________
Signature

Outline1. Abstract2. Introduction
a. Motivation: the magnetized electron Gun i. Electron ion cooling techniques
ii. Magnetized bunched electron beamsiii. Magnetized sources and gun environment
b. Kerr effecti. Possible characteristics of polarized of light
ii. Magnetized reflection of polarized lightiii. Kerr rotation and Ellipticity
3. Methoda. Set up
i. Artificial magnetic fieldii. Permanent magnets
iii. Linear Stageiv. Magnetic field as a function of distance
b. Foil developmenti. Fe characterization as a Kerr reflector
ii. Unpolished vs polishediii. Mounted puck
c. Testing configurationsi. Fixed polarization
ii. Modulated polarization4. Results
a. Fixed Polarizationb. Modulated Polarization
5. Discussion/Conclusionsa. Solenoid Magnet Trials b. Kerr calibration
6. Acknowledgments7. References

Hardy 1
Abstract
Direct current high voltage photoguns like that of the Gun Test Stand at Jefferson Lab, successfully generate electron beams in order to advance studies in Nuclear physics. Magnetized electron beams result from electron production via photoemission within a solenoid magnetic field. As opposed to non-magnetized electron beam sources, magnetized sources have the potential to improve ion beam cooling efficiency significantly. The beam magnetization depends critically on the applied magnetic field. At the Gun Test Stand at Jefferson Lab, a solenoid magnet will be installed adjacent to the photogun to magnetize the electron beam. Due to the photocathode operating in a vacuum chamber, measuring and monitoring the magnetic field at the beam source location with conventional probes is impractical. The Magneto-Optical Kerr effect (MOKE) describes the change on polarized light by reflection from a magnetized surface. The reflection from the magnetized surface may alter the polarization direction, ellipticity, or intensity, and depends linearly upon the surface magnetization of the sample. By replacing the photocathode with a magnetized sample such as pure iron and reflecting polarized light from the sample surface we infer the magnetic field at the beam source location. A controlled MOKE system has been assembled on an optical bench to test the magnetic field on site. It consists of a low power laser, polarizers to define and analyze polarized light, a photo-elastic modulator that supplies a high frequency modulation of the laser polarization to improve the signal to noise ratio of the measurements, and a polished iron foil. Control tests using strong rare earth magnets to imitate the intended 0.15 Tesla solenoid field. Calibration of the solenoid magnet is performed at the Magnetic Measurement Facility at Jefferson Lab, by comparing the MOKE signal with magnetic field measurements. Once calibrated the “Kerr-mometer” will be available as an in-situ diagnostic of the magnetic field strength and uniformity of the photocathode within a vacuum chamber, providing an adequate description of the field at electron beam source. The report summarizes the method and results of controlled tests and calibration of the MOKE sample with the solenoid magnet field measurements.
Introduction
Motivation
The Jefferson Lab Electron Ion Collider (JLEIC) is one of the next major foci of study at the
Continuous Electron Beam Accelerator Facility. Design studies and research and development
by staff and outside sources have been continuously advancing for the more than 10 years 1.
Recently, bunched beam electron cooling has been proposed and approved as an electron cooling
technique for JLEIC2. In general, electron ion cooling is the result of a friction force between the
Hardy 2
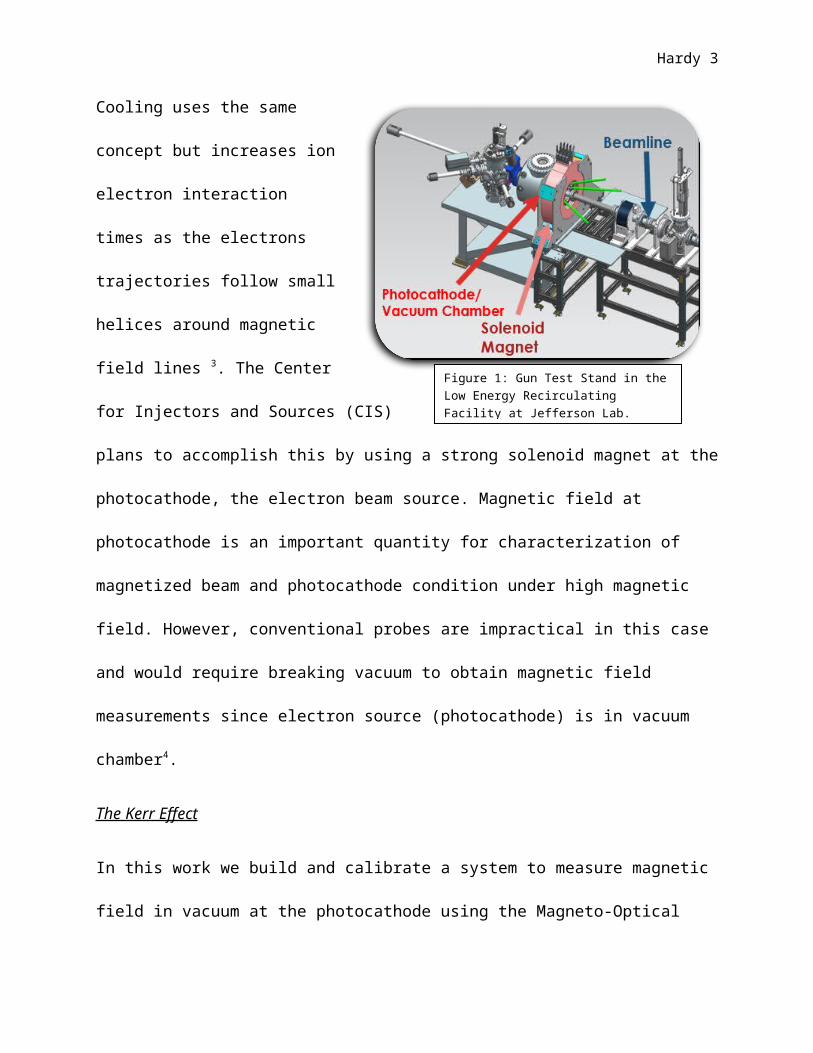
motion of an ion beam and an electron
beam where both beams are moving at
the same average velocity. A more
efficient cooling technique known as
Magnetized Electron Ion Cooling uses
the same concept but increases ion
electron interaction times as the
electrons trajectories follow small
helices around magnetic field lines 3. The Center for
Injectors and Sources (CIS) plans to accomplish
this by using a strong solenoid magnet at the photocathode, the electron beam source. Magnetic
field at photocathode is an important quantity for characterization of magnetized beam and
photocathode condition under high magnetic field. However, conventional probes are impractical
in this case and would require breaking vacuum to obtain magnetic field measurements since
electron source (photocathode) is in vacuum chamber4.
The Kerr Effect
In this work we build and calibrate a system to measure magnetic field in vacuum at the
photocathode using the Magneto-Optical Kerr Effect (MOKE). MOKE describes the induced
circular birefringence of polarized light wave by its interactions with a magnetized surface5,6.
Polarized laser light travels into the vacuum chamber, reflects off the magnetized surface of the
photocathode, and is then analyzed to extract the Kerr signal of the reflected light polarization,
ellipticity, and intensity of the reflected laser light. Three different “geometries” are included in
MOKE when it comes to magnetic field with respect to surface plane. Longitudinal MOKE

Hardy 3
describes the magnetic field as parallel to the
plane of incidence and the reflective surface.
Transverse MOKE describes magnetic field as
normal to reflective surface but only P-
Polarization shows an effect on reflection. Polar
MOKE describes magnetic field as normal to
the reflective surface and is the most studied
because it is the only geometry MOKE can be
observed at normal incidence7.
Materials and Methods
Setup
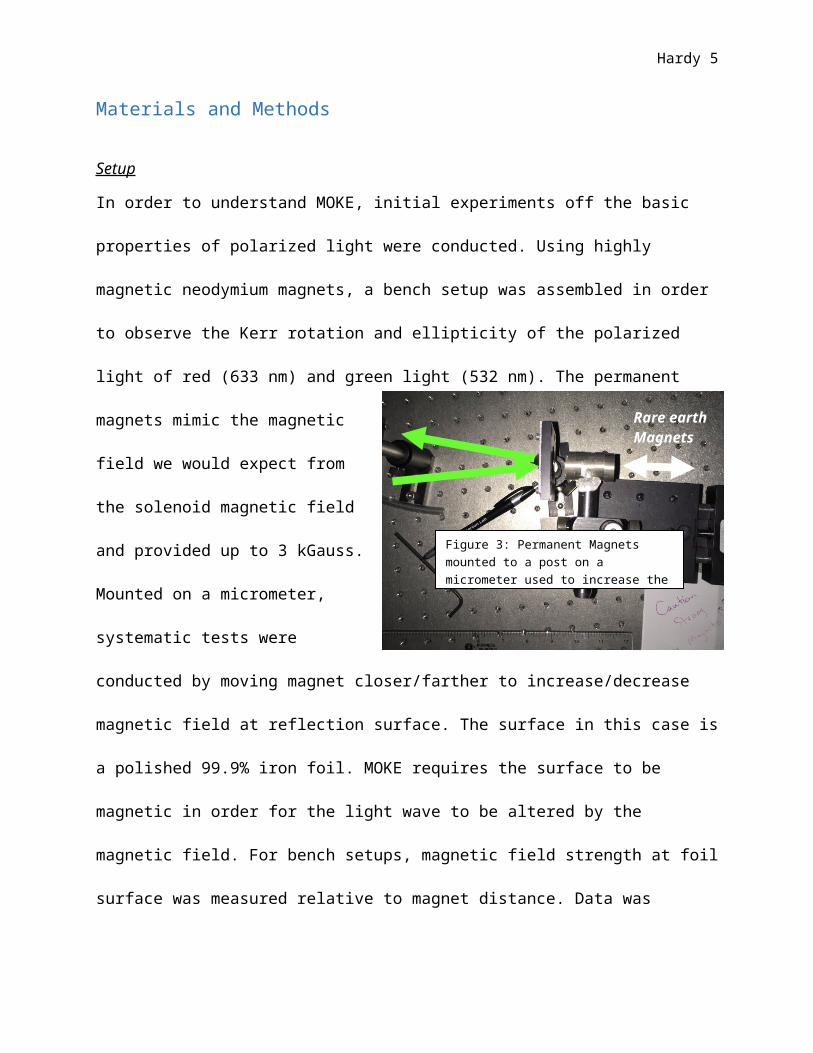
In order to understand MOKE, initial experiments off the basic properties of polarized light were
conducted. Using highly magnetic neodymium magnets, a bench setup was assembled in order to
observe the Kerr rotation and ellipticity of the polarized light of red (633 nm) and green light
(532 nm). The permanent magnets mimic the magnetic field we would expect from the solenoid
magnetic field and provided up to 3 kGauss. Mounted on a micrometer, systematic tests were
conducted by moving magnet
closer/farther to increase/decrease
magnetic field at reflection surface. The
surface in this case is a polished 99.9%
iron foil. MOKE requires the surface to
be magnetic in order for the light wave to
be altered by the magnetic field. For
Rare earth Magnets
Figure 3: Permanent Magnets mounted to a post on a micrometer used to increase the magnetic field at surface for bench tests.
Hardy 4
bench setups, magnetic field strength at foil surface was measured relative to magnet distance.
Data was plotted in order to have a fairly certain understanding of field strength in relation to
magnet distance.
0 5 10 15 20 25 30 350
0.5
1
1.5
2
2.5
3
3.5
f(x) = 0.00000010399 x⁶ − 0.0000110436 x⁵ + 0.000473815 x⁴ − 0.0106217 x³ + 0.136493 x² − 1.068 x + 5.00608R² = 0.998626599325745
Permanent Magnets: B field as a function of dis-tance
Distance from surface (mm)
B fie
ld (k
G)
Foil Development
Pure iron has been well investigated in terms of polarization and experimental data relating to
magnetism. Its saturation at 2.2 Tesla and lack of oxidization make it a feasible choice for a
ferromagnetic reflective surface for the diagnostic5.
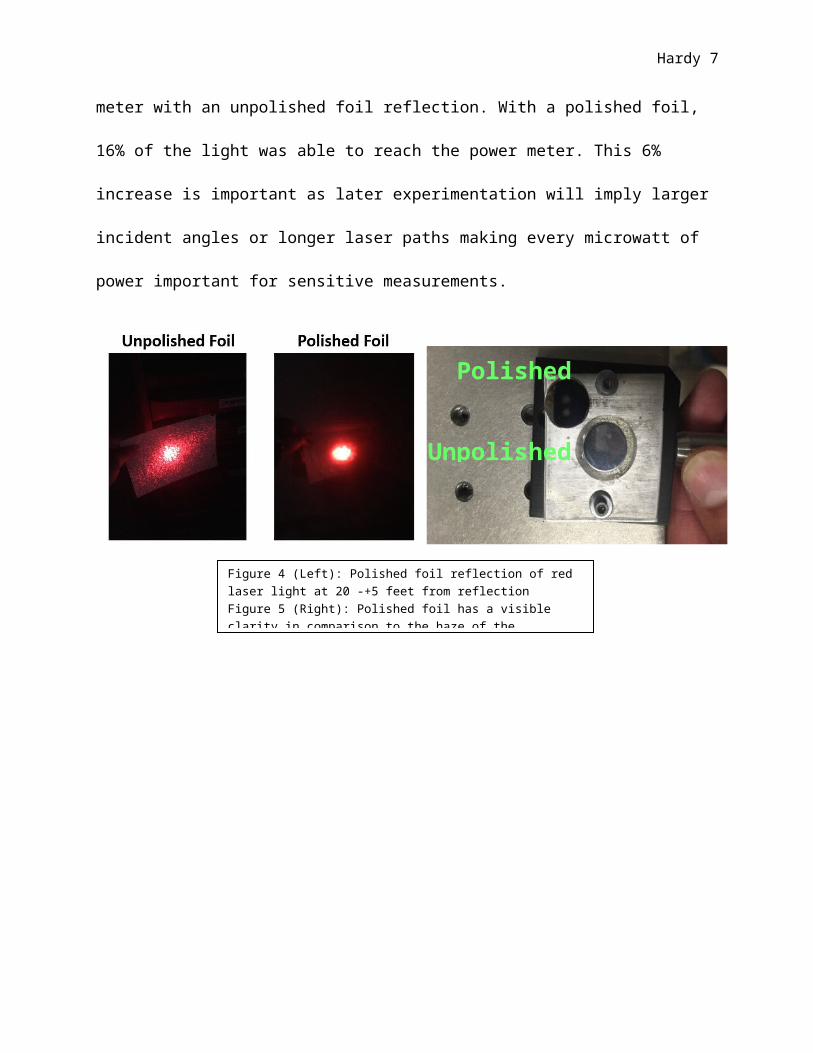
Initial bench tests used an unpolished pure iron foil. At an incident angle of 14⁰-+ .5⁰, 633 nm 5
mW laser light traversed through the bench setup. Only 10% of the light reached a power meter
with an unpolished foil reflection. With a polished foil, 16% of the light was able to reach the
power meter. This 6% increase is important as later experimentation will imply larger incident
Graph 1: A conglomeration of magnetic field data taken with a probe at different distances from surface. 0 mm is foil surface.
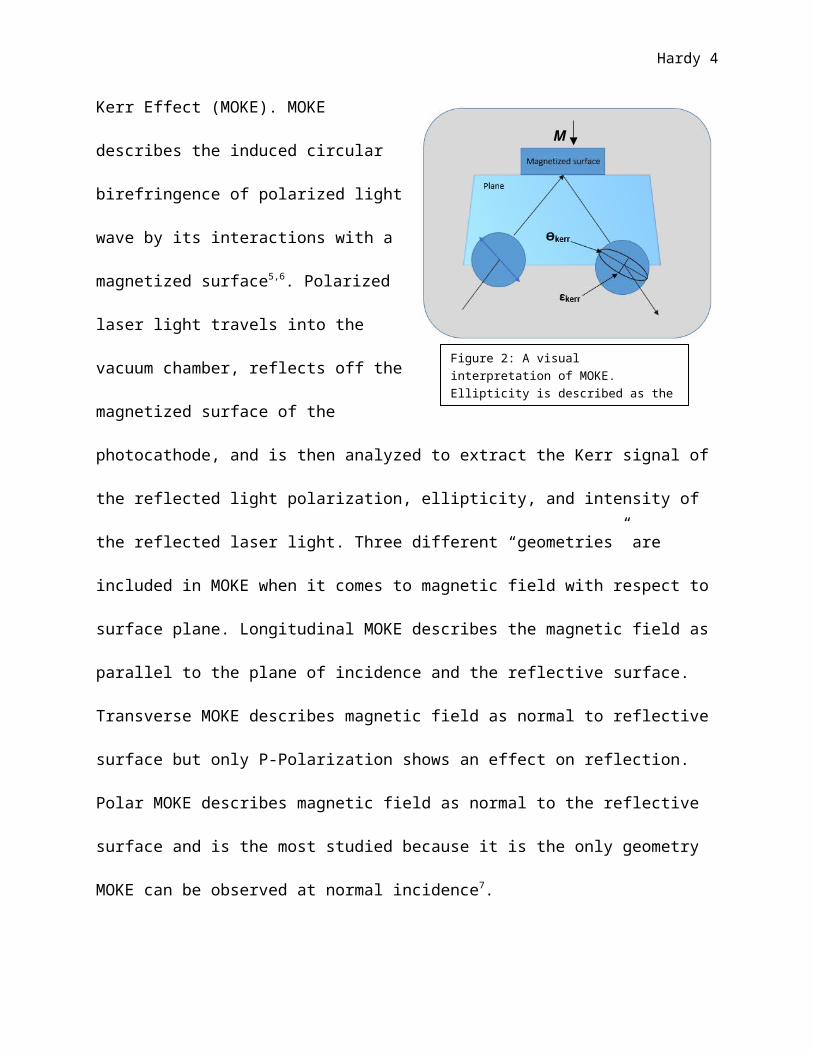
Figure 4 (Left): Polished foil reflection of red laser light at 20 -+5 feet from reflection Figure 5 (Right): Polished foil has a visible clarity in comparison to the haze of the unpolished
Hardy 5
angles or longer laser paths making every microwatt of power important for sensitive
measurements.
Polished foil
Unpolished foil
Graph 2 (Left): Mapping of magnetic field on Z-axis approaching center of puck. Steel has a noticeable peak of magnetic field at surface.
Hardy 6
The pure polished iron foil will be on a placebo photocathode within vacuum chamber. Two
types of mounts or “pucks” were investigated in order optimize magnetic field at photocathode
surface. A non-magnetic “short” molybdenum puck, and magnetic steel "tall" 1006 steel puck.
Iron foils were attached to pucks using indium foil. Then tantalum retaining rings with internal
diameter of 11mm were crimped around the inside edges of the pucks to ensure stability at
higher temperatures. In order to understand magnetic
field and the influence on magnetic field model.
Models were made with and without both pucks at
nominal photocathode location.
Molybdenum Puck
Steel Puck Pure Fe foil (polished)
0 10 20 30 40 50 60 700
500
1000
1500
2000
2500
3000
3500
Magnetic Model Moly & Steel Pucks
Molybdenum
Steel
Z (cm)
B (G
auss
)
Figure 6 (Right): Pucks after Fe foil mount
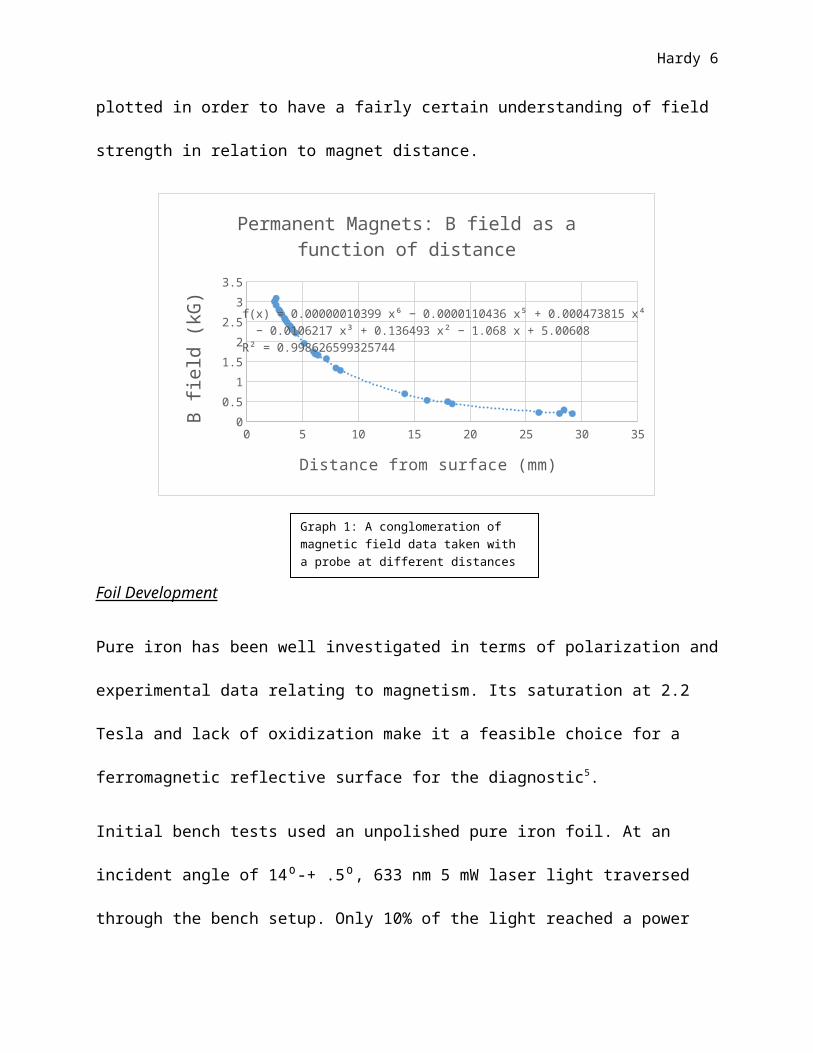
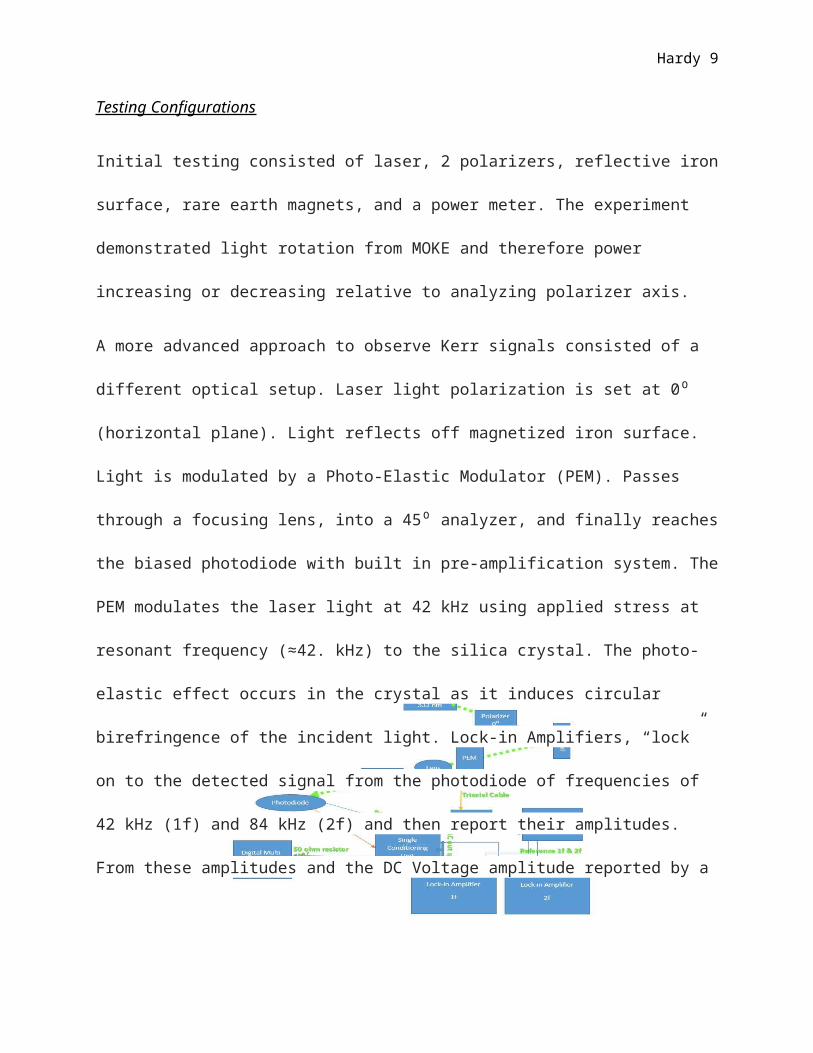
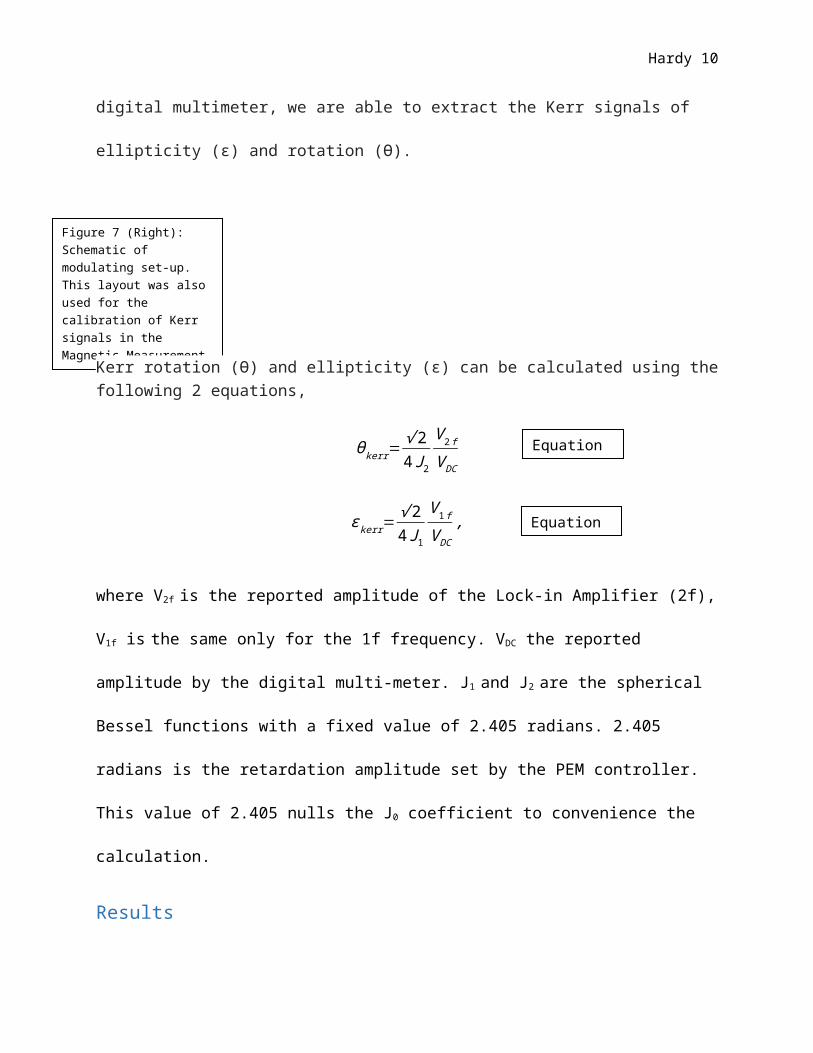
Figure 7 (Right): Schematic of modulating set-up. This layout was also used for the calibration of Kerr signals in the Magnetic Measurement Facility. Blue lines represent BNC cables. Other colored lines imply specific cables with equipment.
Equation 17, 8
Hardy 7
puck position. These were later confirmed with measurements performed at the magnetic
measurement facility.
Testing Configurations
Initial testing consisted of laser, 2 polarizers, reflective iron surface, rare earth magnets, and a
power meter. The experiment demonstrated light rotation from MOKE and therefore power
increasing or decreasing relative to analyzing polarizer axis.
A more advanced approach to observe Kerr signals consisted of a different optical setup. Laser
light polarization is set at 0⁰ (horizontal plane). Light reflects off magnetized iron surface. Light
is modulated by a Photo-Elastic Modulator (PEM). Passes through a focusing lens, into a 45⁰
analyzer, and finally reaches the biased photodiode with built in pre-amplification system. The
PEM modulates the laser light at 42 kHz using applied stress at resonant frequency (≈42. kHz) to
the silica crystal. The photo-elastic effect occurs in the crystal as it induces circular birefringence
of the incident light. Lock-in Amplifiers, “lock” on to the detected signal from the photodiode of
frequencies of 42 kHz (1f) and 84 kHz (2f) and then report their amplitudes. From these
amplitudes and the DC Voltage amplitude reported by a digital multimeter, we are able to extract
the Kerr signals of ellipticity (ε) and rotation (Ө).
Kerr rotation (Ө) and ellipticity (ε) can be calculated using the following 2 equations,
θkerr=√ 24 J 2
V 2 f
V DC
Equation 27, 8
Hardy 8
where V2f is the reported amplitude of the Lock-in Amplifier (2f), V1f is the same only for the 1f
frequency. VDC the reported amplitude by the digital multi-meter. J1 and J2 are the spherical
Bessel functions with a fixed value of 2.405 radians. 2.405 radians is the retardation amplitude
set by the PEM controller. This value of 2.405 nulls the J0 coefficient to convenience the
calculation.
Results
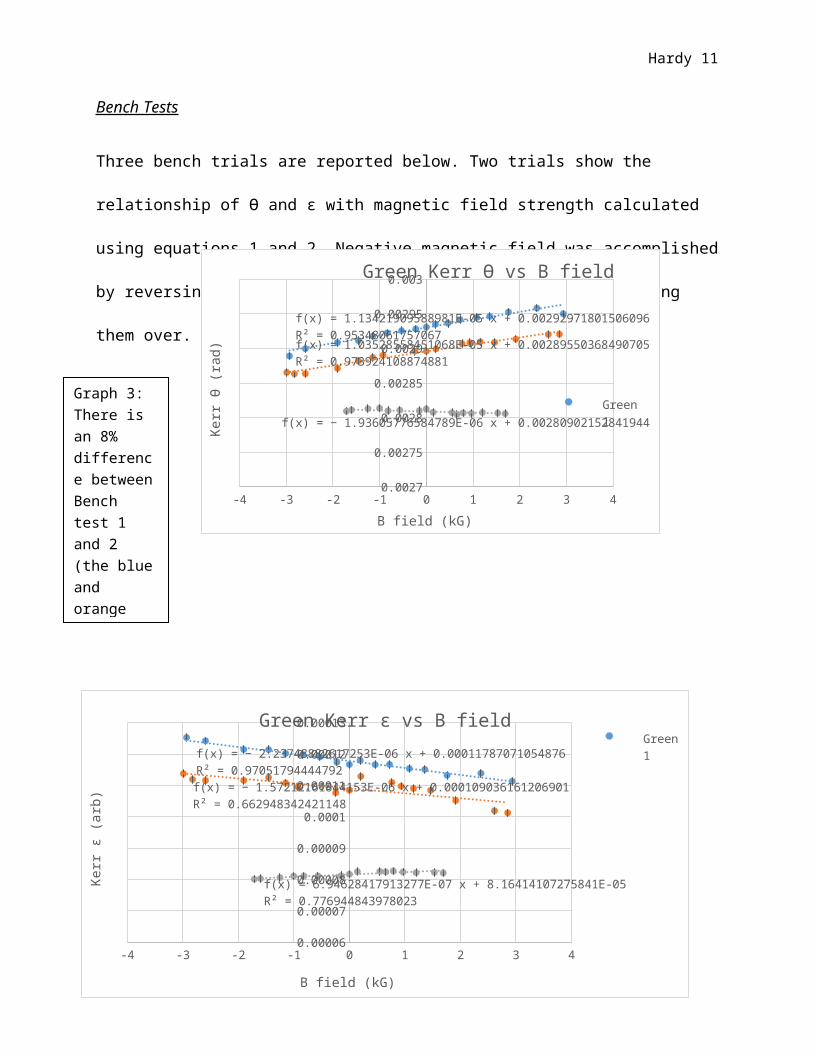
Bench Tests
Three bench trials are reported below. Two trials show the relationship of Ө and ε with magnetic
field strength calculated using equations 1 and 2. Negative magnetic field was accomplished by
reversing the polarities of the magnets by simply flipping them over.
ε kerr=√ 24J 1
V 1 f
V DC,
-4 -3 -2 -1 0 1 2 3 40.0027
0.00275
0.0028
0.00285
0.0029
0.00295
0.003
f(x) = − 1.93605776584789E-06 x + 0.00280902152841944
f(x) = 1.03528558451068E-05 x + 0.00289550368490705R² = 0.973924108874881
f(x) = 1.13421909588983E-05 x + 0.00292971801506096R² = 0.953480617570663
Green Kerr Ө vs B field
Green 1Linear (Green 1)
B field (kG)
Kerr
Ө (r
ad)
-4 -3 -2 -1 0 1 2 3 40.00006
0.00007
0.00008
0.00009
0.0001
0.00011
0.00012
0.00013
f(x) = 6.94628417913277E-07 x + 8.16414107275841E-05R² = 0.776944843978023
f(x) = − 1.57212161844153E-06 x + 0.000109036161206901R² = 0.662948342421148
f(x) = − 2.23748882617253E-06 x + 0.00011787071054876R² = 0.97051794444792
Green Kerr ε vs B fieldGreen 1
B field (kG)
Kerr
ε (a
rb)
Graph 3: There is an 8% difference between Bench test 1 and 2 (the blue and orange lines). Mirror measurement is relatively flat.

Graph 4: Error Bars in Kerr ε are quite large.
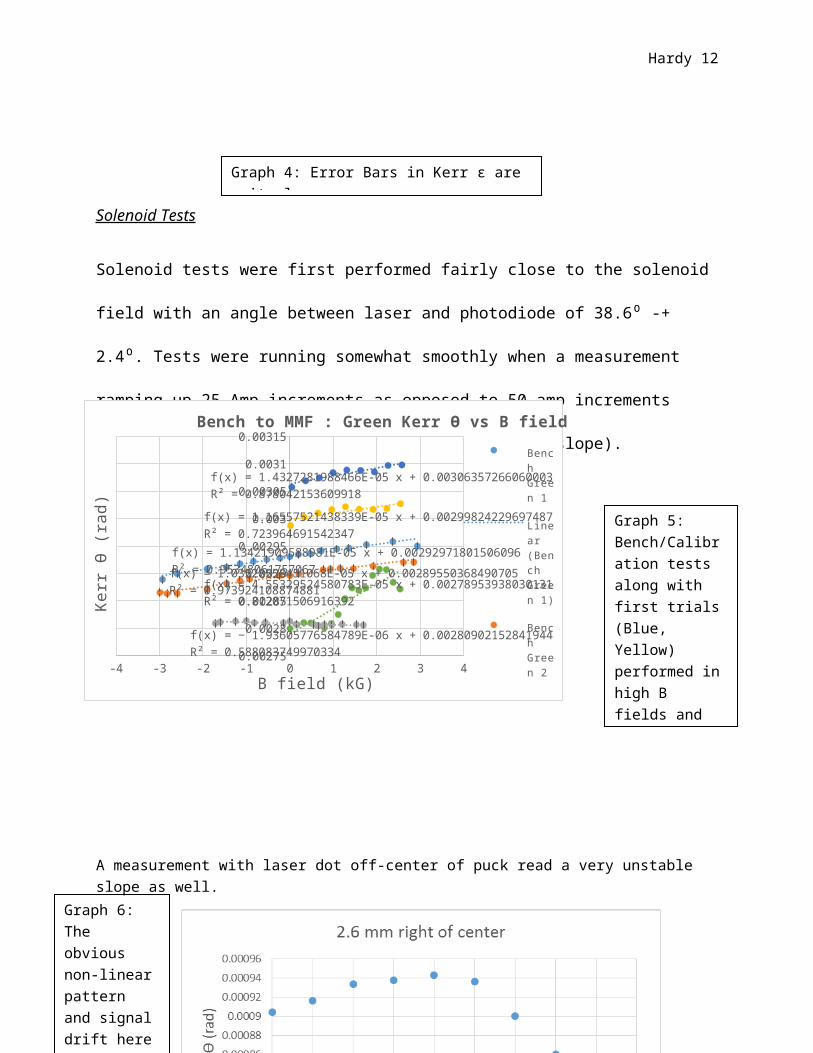
Graph 5: Bench/Calibration tests along with first trials (Blue, Yellow) performed in high B fields and ≈38.6⁰ reflection. Green plot shows instability of Kerr signal.
Graph 6: The obvious non-linear pattern and signal drift here
Hardy 9
Solenoid Tests
Solenoid tests were first performed fairly close to the solenoid field with an angle between laser
and photodiode of 38.6⁰ -+ 2.4⁰. Tests were running somewhat smoothly when a measurement
ramping up 25 Amp increments as opposed to 50 amp increments reported a significantly
different slope (Green slope).
A measurement with laser dot off-center of puck read a very unstable slope as well.
-4 -3 -2 -1 0 1 2 3 40.00006
0.00007
0.00008
0.00009
0.0001
0.00011
0.00012
0.00013
f(x) = 6.94628417913277E-07 x + 8.16414107275841E-05R² = 0.776944843978023
f(x) = − 1.57212161844153E-06 x + 0.000109036161206901R² = 0.662948342421148
f(x) = − 2.23748882617253E-06 x + 0.00011787071054876R² = 0.97051794444792
Green Kerr ε vs B fieldGreen 1
B field (kG)Ke
rr ε
(arb
)
-4 -3 -2 -1 0 1 2 3 40.00275
0.0028
0.00285
0.0029
0.00295
0.003
0.00305
0.0031
0.00315
f(x) = 4.553295245808E-05 x + 0.00278953938030131R² = 0.81207150691638
f(x) = 1.4327281988466E-05 x + 0.00306357266060003R² = 0.878042153609918
f(x) = 1.16557521438339E-05 x + 0.00299824229697487R² = 0.723964691542347
f(x) = − 1.93605776584789E-06 x + 0.00280902152841944R² = 0.588083749970334
f(x) = 1.03528558451068E-05 x + 0.00289550368490705R² = 0.973924108874881
f(x) = 1.13421909588983E-05 x + 0.00292971801506096R² = 0.953480617570663
Bench to MMF : Green Kerr Ө vs B fieldBench Green 1
Linear (Bench Green 1)
Bench Green 2
Linear (Bench Green 2)
Bench Mir-ror OffsetB field (kG)
Kerr
Ө (r
ad)
Graph 6: The obvious non-linear pattern and signal drift here
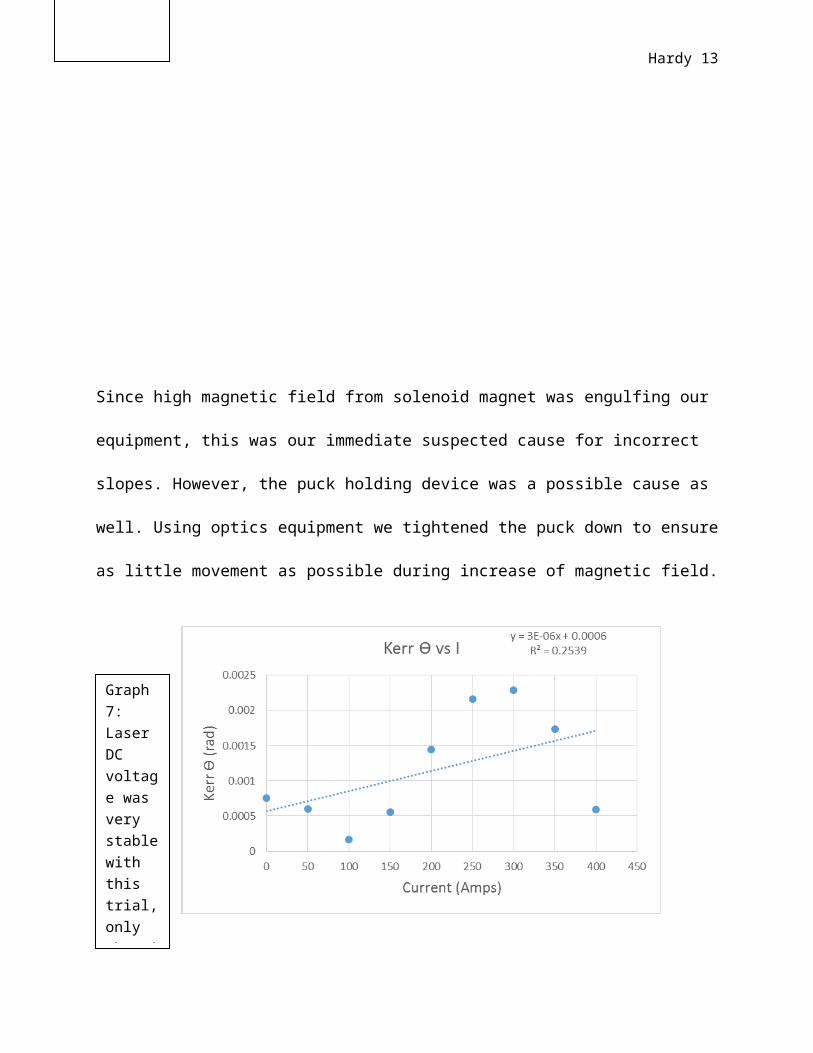
Graph 7: Laser DC voltage was very stable with this trial, only changing .2 V as opposed to 2 V in Graph 5 and 4
Hardy 10
Since high magnetic field from solenoid magnet was engulfing our equipment, this was our
immediate suspected cause for incorrect slopes. However, the puck holding device was a
possible cause as well. Using optics equipment we tightened the puck down to ensure as little
movement as possible during increase of magnetic field.
With the same puck holding device, we moved the whole optics stage far away from magnetic
fields. A seemingly more stable slope was reported. The following graphs describe the
Hardy 11
measurements performed at less than 50 Gauss of magnetic field on all equipment with an angle
of 5.31⁰ -+.45⁰ between laser and photodiode. Steel pucks, Moly pucks, and mirrors were used.
Graph 10: Arbitrary offsets are necessary to observe all the data reasonably. Slope is the only value we are concerned with.
Graph 11: Kerr ε in this case was not very consistent with expected slope values.
Hardy 12
Hardy 13
Conclusions/Discussion
Bench test Kerr signal slopes imply the experiment works within a controlled magnetic field.
From the data taken from a farther distance from the solenoid, it is possible to conclude setup
needs to be out of reach of strong magnetic fields. This is supported by graph 7. The laser moved
only enough to see a .2 change in DC voltage. With a very stable power there was still an
unusual variance in signal, with the only suspect of magnetic field. Exactly how much magnetic
field or specifically what piece of equipment needs to be free from magnetic field is still to be
found out.
Along with disturbance of equipment by magnetic field, puck stability is a very important
necessity. 5 mm diameter photodiode light acceptor doesn’t leave much space to miss the target.
puck stability is crucial in order for successful experimentation. This is supported by Graph 10
and the Steel trial 2 measurement. DC voltage changed almost 2 V as opposed to only a .2 V
change in the Steel trial 1 measurement.
Overall, the MOKE method is an extremely sensitive diagnostic and under the right conditions
could be used to quantify magnetic field at the photocathode surface and possibly even surface
uniformity of field.
Acknowledgments
All of precluding research was accomplished on site at Thomas Jefferson National Accelerator
facility. I would like to thank my mentor Joe Grames for being a friend and someone that I can
count on to push me further as a physicist. Hari Areti for his care and giving me the chance to
work at Jlab for the summer. The Center for Injectors and Sources for all of their support. Riad
Suleiman for his willingness to help. Shukui Zhang for always being available to assist in our
Hardy 14
experimentation by loaning equipment and advice. Jay Benesch for the magnetic model graph.
Matt Poelker for his encouragement. Bubba Bullard for polishing the foils. Mike Beck and Joe
Meyers for their help and enthusiasm in the MMF. Lisa Surles-Law for her energy and
encouragement. I’m also thankful for the National Science foundation and Old Dominion
University for administrating funding this Research Experience for Undergraduates.
References
1 Y. Zhang, Ya. Derbenev, D. Douglas, et al. “Advance in MEIC Cooling Studies,” Proceedings of COOL2013, Murren, Switzerland, TUAM2HA04, 68-72 (2013).2 R. Suleiman and J, Grames (private communication).3 P. Piot , Y.-E Sun, “GENERATION AND DYNAMICS OF MAGNETIZED ELECTRON BEAMS FOR HIGH-ENERGY ELECTRON COOLING,” FERMILAB, 142, (2014).4 Mammei, R. R., R. Suleiman, J. Feingold, et al. "Charge Lifetime Measurements at High Average Current Using a K 2 CsSb Photocathode inside a Dc High Voltage Photogun." Phys. Rev. ST Accel. Beams Physical Review Special Topics - Accelerators and Beams 16.3 (2013).5 Stephan Robinson, “Kerr Measurements of Electron Polarization,” Inaugural Dissertation, University of Basel, (1994).6 Matthias Loppacher, “Moller Polarimetry for CEBAF Hall C,” Inaugural Dissertation, University of Basel, (1996).7 Dr. Theodore C. Oakberg, “PhotoElastic Modulators; the Magneto-Optic Kerr Effect,” Hinds Instruments, (2000).8 Kliger, Lewis and Randall, Polarized Light in Optics and Spectroscopy, Academic Press, 1990.