Embed Size (px)
Citation preview

Filed: 2016-05-27 EB-2016-0152
Exhibit F2 Tab 4
Schedule 1 Page 1 of 9
OUTAGE OM&A – NUCLEAR 1
2
1.0 PURPOSE 3
This evidence presents nuclear operations outage OM&A costs for the period 2013 - 2021. 4
5
2.0 OVERVIEW 6
Outage OM&A costs vary year over year depending on the number and scope of outages 7
and therefore cannot be trended over time. Chart 1 below shows the cost, frequency and 8
nature of nuclear outages during the 2013 to 2021 period. The test period outage OM&A 9
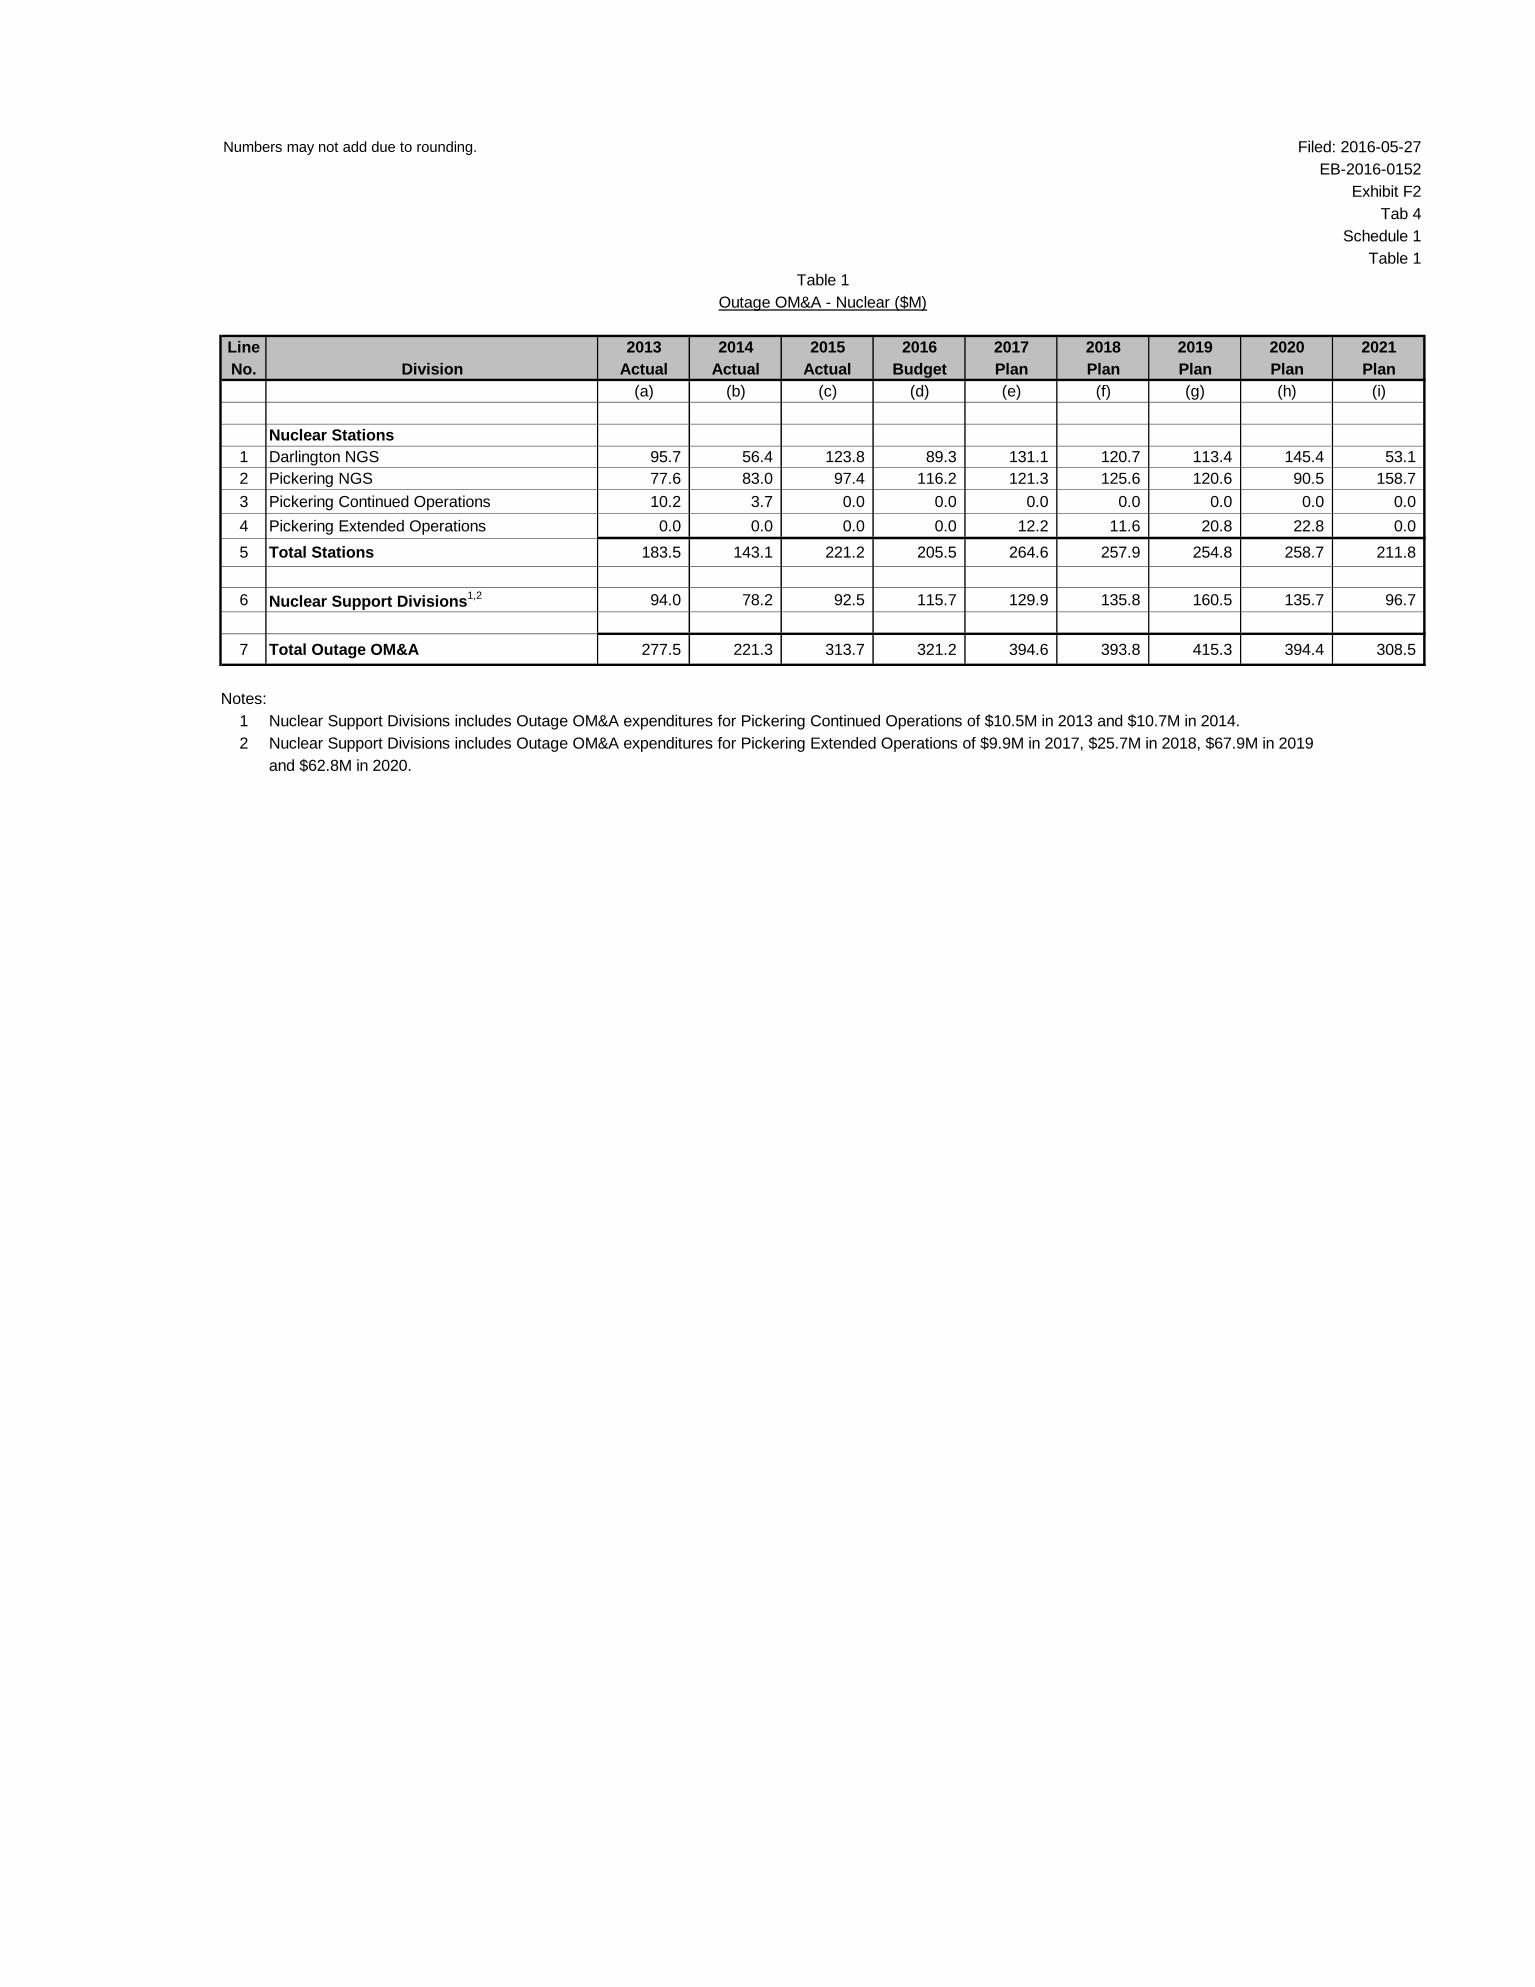
expense is $394.6M in 2017, $393.8M in 2018, $415.3M in 2019, $394.4M in 2020 and 10
$308.5M in 2021, and forms part of the OM&A expense in the nuclear revenue requirement. 11
12
Outage OM&A costs over the test period primarily reflect the following: 13
Outage OM&A costs to complete Darlington unit outages for the three year planned 14
outage schedule for routine inspection and maintenance. This includes outage costs 15
for units laid up during refurbishment (e.g., Unit 2 during 2016-2020), which will be 16
subject to inspection and maintenance activities over the period 2017-2019 17
associated with a planned outage in accordance with OPG’s aging and life cycle 18
management programs, in addition to and separate from the refurbishment of the 19
units. The outage work in 2017-2019 effectively replaces two scheduled planned 20
outages for Unit 2 in 2016 and 2019 which would otherwise have been undertaken 21
absent Unit 2 refurbishment. 22
Darlington Unit 2 is scheduled to return to service in February 2020 following 23
refurbishment. OPG has scheduled two post refurbishment mini planned outages to 24
address any issues expected to arise after the major refurbishment is complete and 25
the unit has resumed operations. 26
Outage OM&A costs to complete Pickering unit outages for the two year planned 27
outage schedule for routine inspection and maintenance. The cost for each of the 28
planned outages for the period 2017-2020 also includes the additional scope added 29
for Pickering Extended Operations which is required to enable Pickering’s operation 30
to 2022/2024. In addition, the Unit 7 outage in 2020 is being undertaken solely for 31

Filed: 2016-05-27 EB-2016-0152 Exhibit F2 Tab 4 Schedule 1 Page 2 of 9
Pickering Extended Operations. The outage OM&A costs for Pickering Extended 1
Operations are set out in Chart 2 below. 2
3
Chart 1 4
Outage Frequency and Outage Costs 2013-2021 5
2013 2014 2015 2016 2017 2018 2019 2020 2021 DESCRIPTION Actual Actual Actual Budget Plan Plan Plan Plan Plan
Darlington Unit Outages [1] Unit 2; Unit 4 Unit 1
Unit 3 &
Unbudgted
Unit 1
Unit 4 Unit 1 Unit 3 Unit 4 Unit 1 None
Darlington Station OutagesVBO
Preparation
VBO
Preparation
Units 1-4
VBO
Execution
None None None None None None
Darlington Refurbishment
OutagesNone None None Unit 2 Unit 2 Unit 2 Unit 2
Unit 2;
Unit 3
Unit 3;
Unit 1
Darlington PHT Pump
Replacement Mini Outages Unit 3
Unit 3;
Unit 4
Unit 1;
Unit 4Unit 1 Unit 4 Unit 4
Darlington Post Refurbishment
OutagesNone None None None None None None Unit 2 Unit 2
Pickering Unit Outages
Unit 1
(extended
from 2012 [2])
Unit 5, 6
Unit 4,7,8
Unit 1, 5, 6 &
Unbudgeted
Unit 1, 8
Unit 4,7,8 Unit 1,5,6 Unit 4,7,8 Unit 1,5,6Unit 4,7,8
[3]Unit 1,5,6
Pickering Station Outages None None None None None None NoneVBO
Preparation
Units 1-6
VBO
ExecutionPickering Mid-cycle Outages Unit 4 None None Unit 1 Unit 4 Unit 1 Unit 4 Unit 1 None
Outage Costs ($Millions) 277.5 221.3 313.7 321.2 394.6 393.8 415.3 394.4 308.5
[2] The Unit 1 outage was extended from 2012 into 2013 due to a fire in the Lube Oil Purifier system, resulting in the 2013
scheduled Unit 4 outage being shifted into 2014.
"typical" planned outage.
[3] The scope for the Unit 7 outage in 2020 is limited as it is solely for Pickering Extended Operations and therefore excludes
[1] Unit 2 will be subject to inspection and maintenance activities over the period 2017-2019 associated with a planned outage in
accordance with OPG’s aging and life cycle management programs, in addition to and separate from the refurbishment of the
units.
6 7
Chart 2 8
Pickering Extended Operations Outage OM&A 2017-2020 9
Line
No. Cost Item 2017 2018 2019 2020 Total Reference
(a) (b) (c) (d) (e) (f)
1 Pickering Station 12.2 11.6 20.8 22.8 Ex. F2-4-1 Table 1
2 Nuclear Support Divisions 9.9 25.7 67.9 62.8 Ex. F2-4-1 Table 1
3 Total Outage OM&A 22.1 37.3 88.7 85.6 233.7 10 11

Filed: 2016-05-27 EB-2016-0152
Exhibit F2 Tab 4
Schedule 1 Page 3 of 9
Additional details describing the drivers for the schedule provided in Chart 2 are provided in 1
section 4.1 below. 2
3
OPG continues to pursue Outage Improvement Initiatives (see Ex. F2-1-1 Section 3.5) to 4
increase the efficiency of planned outage work as part of a program to achieve the 5
production and value for money targets in the business plan. 6
7
3.0 OUTAGE OM&A PLANNING AND RESOURCING 8
Nuclear planned outages are necessary to execute inspection and maintenance work related 9
to asset management and regulatory requirements, or project work, on systems and 10
equipment where access is not possible under normal operating conditions. 11
12
Planned outages also give OPG an opportunity to perform systems and equipment 13
upgrades, configuration changes, and other improvements and modifications. 14
15
3.1 Outage Scope and Duration Planning 16
The nuclear outage OM&A budget is derived in conjunction with the development of the 17
approved generation plan and outage schedule for each station as part of the Nuclear 18
Generation and Outage Plan (“Generation Plan”), which is discussed in Ex. E2-1-1. The 19
Generation Plan, by reference to the station’s life cycle management plan, establishes the 20
number, frequency and duration of the outages for each year that are required to ensure the 21
continued safe, reliable, long-term operation of the plant and ensure that it is in compliance 22
with Canadian Nuclear Safety Commission (“CNSC”) regulatory requirements. 23
24
3.2 Outage Resource Planning 25
The Nuclear outage resource plan is established and costed on the basis of the work 26
activities required to execute each planned outage scheduled under the Generation Plan. 27
28
Work activities are planned at a detailed level, and resource requirements are identified 29
using material requirements and resource productivity information from recently-completed 30
outages. These resource costs are aggregated to determine total outage OM&A 31

Filed: 2016-05-27 EB-2016-0152 Exhibit F2 Tab 4 Schedule 1 Page 4 of 9
requirements. However, even with planning using best practices, unforeseen equipment 1
conditions discovered during outages may result in additional outage scope and cost. 2
3
The completion of specific outages requires both base resources and incremental resources. 4
OM&A base resources (i.e., regular staff labour) in the stations or in the Nuclear support 5
divisions that work on outages are captured in base OM&A. The cost of incremental 6
resources in support of outage execution, and the cost of Inspection and Maintenance 7
Services (“IMS”) regular staff labour, is captured in outage OM&A. This is because the 8
primary function of IMS is to support outage execution. 9
10
The costs associated with the completion of projects undertaken during an outage are 11
captured in either project OM&A or project capital, as applicable to the specific project. 12
13
The resource types associated with resources utilized during outages are as follows: 14
Non-Regular Labour: additional non-regular staff directly supervised by OPG staff 15
(typically construction labour or trade workers such as electricians). 16
Overtime: regular and non-regular staff working on overtime in support of outage 17
execution. 18
Augmented Staff: contractors directly supervised by OPG staff (typically engineers and 19
assessors). 20
Materials: the materials and supplies installed or consumed in outage execution. 21
Other Purchased Services: contractors performing specialized inspection and 22
maintenance work or conducting major component refurbishments. 23
24
Outage-related IMS costs are separately identified as part of outage services provided by the 25
Nuclear Support divisions. 26
27
Incremental labour is a major component in outage OM&A costs. The key consideration in 28
assessing the need for resources during an outage is the ability to optimize all available 29
base work resources and skills. Planning and executing outages is an exercise in balancing 30
regular, temporary and contractor resources. Regular staff is utilized to the greatest extent 31

Filed: 2016-05-27 EB-2016-0152
Exhibit F2 Tab 4
Schedule 1 Page 5 of 9
possible in order to execute complex work assignments while maintaining the outage 1
schedule. However, the availability of regular maintenance staff for outage work needs to be 2
assessed relative to the following: 3
the demand for regular maintenance staff to meet the ongoing maintenance 4
requirements of the operating units; and, 5
the demand and available skill set for peak staff resources to complete the outage 6
scope within the outage schedule and budget. 7
8
OPG uses staffing resources such as overtime or other purchased services (e.g., 9
contractors), where appropriate, during outages. Due to the peaking nature of outage work, it 10
is more cost effective to use incremental staffing than to maintain permanent outage staff in 11
the base organization. Overtime is particularly useful during planned outages when base 12
resources are insufficient to meet all of the scheduled work. The selection of which labour 13
resource option to employ is an ongoing resource optimization and balancing process of 14
available fleet resources and depends on the specific circumstances driving the need for 15
labour resources. Use of contractors or other temporary staff instead of overtime during an 16
outage can be constrained by collective agreements. However, the nature of the activity may 17
mandate the use of external, highly specialized contractors or original equipment 18
manufacturer expertise. 19
20
OPG’s use of staffing resources to complete outage work activities provides important 21
resource flexibility and is consistent with industry best practices. 22
23
4.0 OUTAGE OM&A COST DRIVERS 24
4.1 Factors Driving the Outage Cost Forecast for 2017-2021 25
Outage OM&A is directly impacted by outage scope and the number of outage days. 26
27
The scope of outage work varies from year to year, reflecting station-specific inspection and 28
maintenance activities as well as unit-specific requirements reflecting the operating life 29
history or specific issues for a particular unit. The cost forecast and schedule are based on 30
actual experience from previous outages and incorporation of improvements in execution 31

Filed: 2016-05-27 EB-2016-0152 Exhibit F2 Tab 4 Schedule 1 Page 6 of 9
efficiency where possible. Similar outage activities (e.g., unit shut down and start up 1
windows) are benchmarked to ensure that the benefits of process improvements and 2
efficiencies are incorporated. 3
4
Since units do not necessarily age in a uniform way or at a uniform rate, it is highly unlikely 5
that the outage scope for a particular unit in a certain year of operation will precisely match 6
the outage scope for a different unit in the same year of its operation. While there are many 7
standard elements included in the outage scope, there can also be unique activities, 8
programs or major equipment campaigns that are unit-specific. For example, the need for a 9
single fuel channel replacement or station-specific initiatives such as the extra outage work 10
required in support of Pickering Extended Operations. 11
12
Other factors that drive outage scope include: 13
The results from ongoing outage inspection and maintenance work, which could 14
influence the scope of work planned for future outages, even if the future outages 15
are at a different unit or station. 16
New or evolving CNSC regulatory requirements which may influence outage scope 17
and cost. 18
Operational information shared within the nuclear industry that provides OPG with 19
information about potential emerging issues, which necessitates additional 20
inspections in future outages to assess the the impact of the emergent issue on 21
OPG’s nuclear units. 22
23
In addition to outage scope, outage OM&A cost is impacted by the number of unit outages. 24
Chart 2 above presents the unit outages in the 2013-2021 period, and the following provides 25
further background on the nature and timing of these outages. 26
27
Darlington units are on a three year outage cycle. As a result, outage OM&A expenditures 28
reflect two planned outages in 2013 but one planned outage in 2014, in 2015, and for each 29
year during refurbishment. In addition, the units laid up during refurbishment (e.g., Unit 2 30
during 2016-2020 and Unit 3 during 2020-2021) will be subject to inspections associated with 31

Filed: 2016-05-27 EB-2016-0152
Exhibit F2 Tab 4
Schedule 1 Page 7 of 9
a planned outage (cyclical outages) in accordance with OPG’s aging and life cycle 1
management programs. These work activites and associated outage OM&A expenditures 2
are in addition to and separate from the refurbishment of the units. 3
4
Darlington’s Unit 2 is also scheduled for two abbreviated post refurbishment planned outages 5
in 2020 and 2021 following return to service. These post refurbishment outages will address 6
any issues that arise after the major refurbishment is complete and the unit has resumed 7
operations (e.g., address regulatory requirements for baseline inspections, warranty work) 8
(see Ex. E2-1-1 section 2.0). In addition, Darlington has scheduled eight mini outages during 9
2016-2021 for the purpose of Primary Heat Transport pump replacement. There were no 10
budgeted outage costs for these mini outages, as the work activities will be funded through 11
capital expenditures (Project #73566/80144 as described in Ex. D2-1-3). 12
13
Pickering units are on a two year planned outage cycle, such that there are generally three 14
units in outage each year. In addition, mid-cycle outages were added for Pickering Units 1 15
and 4 in each year from 2013 to 2021 to increase reliability. OPG does not budget outage 16
costs for mid-cycle outages, as the work activities can be undertaken by resources funded 17
within base OM&A. 18
19
Outage OM&A costs are significantly impacted by scheduled outages to inspect the station 20
negative pressure containment systems, or Vacuum Buildilng Outages (“VBO”). For 21
Pickering, a station-wide VBO is required every 11 years, with the most recent occurring in 22
2010 and the next scheduled for 2021. Pickering’s outage OM&A expenditures in 2020 23
include costs for preparatory work for the 2021 VBO and the outage OM&A forecast in 2021 24
includes expenditures associated with a six unit VBO. 25
26
For Darlington, prior to 2015 a station-wide four unit VBO was required every 12 years and a 27
Station Containment Outage (“SCO”) every six years. A SCO also requires that all four units 28
be shut down, but for a shorter duration. However, OPG was successful in obtaining CNSC 29
consent to implement a 12 year VBO/SCO cycle versus continuing with a 12 year VBO/6 30
year SCO cycle. In 2015, the Darlington VBO that was scheduled for 2021 was brought 31

Filed: 2016-05-27 EB-2016-0152 Exhibit F2 Tab 4 Schedule 1 Page 8 of 9
forward and combined with the SCO. The next VBO/SCO is scheduled in 2027, so there is 1
no VBO or SCO scheduled at Darlington during the test period or refurbishment period. In 2
addition to the positive payback by adopting a 12 year VBO/SCO cycle, the elimination of the 3
VBO in 2021 has an additional benefit when Darlington is scheduled to have two units in 4
refurbishment by reducing complexity and resource demands. The elimination of the 2021 5
Darlington VBO also minimizes potential conflicts and complications with the Pickering VBO 6
scheduled in 2021. 7
8
Pickering will be undertaking incremental outage days and work activities in 2017-2020 to 9
enable Pickering Extended Operations and ensure Pickering units are fit for service until 10
2022/2024 (see Chart 2). Outage OM&A includes expenditures for incremental planned 11
outage scope including maintenance and inspection of pressure tubes, steam generators, 12
feeders, ‘balance of plant’ components, Inspection and Maintenance Services tooling, and 13
fuel channel work (including fueling machine maintenance). Outage OM&A will also include 14
expenditures for work performed on spacer location and relocation work, additional steam 15
generator water-lancing and feeder replacements 16
17
4.2 Outage Improvement Initiatives 18
OPG continuously seeks improvement in outage planning and execution to ensure that the 19
required outage work is conducted at the lowest achievable cost. Outage Improvement is 20
one of OPG’s gap closure initiatives (see Ex. F2-1-1 section 3.5). Key areas targeted for 21
improvement are outage preparedness through improved planning and execution of outage 22
work, including the following: 23
Improve outage scheduling, operations performance and resource planning 24
Preliminary review of outage cycle at Pickering 25
Implement execution improvements within IMS 26
Life Cycle Management plan development improvements 27
Implement outage model template 28
Develop and implement a long term purchased services and vendor quality strategy 29
30
5.0 MANAGEMENT OF OUTAGE COSTS 31

Filed: 2016-05-27 EB-2016-0152
Exhibit F2 Tab 4
Schedule 1 Page 9 of 9
Treatment of outage costs varies with the nature of the costs and whether they are actual or 1
forecast costs, as described below. 2
3
5.1 Forecast Outage OM&A (Bridge Year, Test Period) 4
The outage OM&A forecast does not include a budget for forced outages, planned derates or 5
forced derates, as OPG typically does not use incremental non-regular labour or augmented 6
staff for these events. When such situations arise, base work resources are re-prioritized to 7
focus existing regular staff on returning the unit to full-power operation as quickly as possible. 8
9
5.2 Actual Outage OM&A (Historical Period) 10
Actual outage OM&A costs include the incremental costs of the planned outages. Actual 11
outage OM&A costs also include costs due to forced extensions of planned outages, planned 12
outage extensions, or unbudgeted planned outages. 13
14
Actual outage OM&A costs do not include costs incurred due to forced outages, planned 15
derates or forced derates. These costs are recorded in base OM&A. 16
17
A summary of the treatment of actual and forecast outage costs is provided in Chart 3 below. 18
19
Chart 3 20
Treatment of Outage Forecasts and Actual Costs 21
Forecast Cost Actual Cost
Planned Outages Outage OM&A Outage OM&A
Unplanned Outage Costs
Forced Extensions to Planned Outages Not in Forecast Outage OM&A
Planned outage extensions Not in Forecast Outage OM&A
Unbudgeted Planned Outages Not in Forecast Outage OM&A
Forced Outages Not in Forecast Base OM&A
Forced Derates Not in Forecast Base OM&A
Planned Derates Not in Forecast Base OM&A
22
Numbers may not add due to rounding. Filed: 2016-05-27
EB-2016-0152
Exhibit F2
Tab 4
Schedule 1
Table 1
Line 2013 2014 2015 2016 2017 2018 2019 2020 2021
No. Division Actual Actual Actual Budget Plan Plan Plan Plan Plan
(a) (b) (c) (d) (e) (f) (g) (h) (i)
Nuclear Stations
1 Darlington NGS 95.7 56.4 123.8 89.3 131.1 120.7 113.4 145.4 53.1
2 Pickering NGS 77.6 83.0 97.4 116.2 121.3 125.6 120.6 90.5 158.7
3 Pickering Continued Operations 10.2 3.7 0.0 0.0 0.0 0.0 0.0 0.0 0.0
4 Pickering Extended Operations 0.0 0.0 0.0 0.0 12.2 11.6 20.8 22.8 0.0
5 Total Stations 183.5 143.1 221.2 205.5 264.6 257.9 254.8 258.7 211.8
6 Nuclear Support Divisions1,2 94.0 78.2 92.5 115.7 129.9 135.8 160.5 135.7 96.7
7 Total Outage OM&A 277.5 221.3 313.7 321.2 394.6 393.8 415.3 394.4 308.5
Notes:
1 Nuclear Support Divisions includes Outage OM&A expenditures for Pickering Continued Operations of $10.5M in 2013 and $10.7M in 2014.
2 Nuclear Support Divisions includes Outage OM&A expenditures for Pickering Extended Operations of $9.9M in 2017, $25.7M in 2018, $67.9M in 2019
and $62.8M in 2020.
Table 1
Outage OM&A - Nuclear ($M)

Numbers may not add due to rounding. Filed: 2016-05-27
EB-2016-0152
Exhibit F2
Tab 4
Schedule 1
Table 2
Other
Line Non-Regular Augmented Purchased Total
No. Division Labour Labour Overtime Staff Materials Services Other Outage OM&A
(a) (b) (c) (d) (e) (f) (g) (h)
Budget - Year Ending December 31, 2016
Nuclear Stations:
1 Darlington NGS 0.0 11.1 14.6 3.8 19.3 40.0 0.6 89.3
2 Pickering NGS 0.0 6.6 18.7 0.0 20.6 70.3 0.0 116.2
3 Pickering Extended Operations 0.0 0.0 0.0 0.0 0.0 0.0 0.0 0.0
4 Total Stations 0.0 17.7 33.3 3.8 39.9 110.3 0.6 205.5
5 Nuclear Support Divisions 29.2 19.4 17.3 20.6 9.9 19.0 0.3 115.7
6 Total Outage OM&A 29.2 37.1 50.5 24.4 49.8 129.2 0.9 321.2
Plan - Year Ending December 31, 2017
Nuclear Stations:
7 Darlington NGS 0.0 14.3 15.8 2.5 18.5 79.9 0.0 131.1
8 Pickering NGS 0.0 12.3 21.2 0.0 22.7 65.2 0.0 121.3
9 Pickering Extended Operations 0.0 0.0 0.0 0.0 0.0 12.2 0.0 12.2
10 Total Stations 0.0 26.6 36.9 2.5 41.2 157.3 0.0 264.6
11 Nuclear Support Divisions1 28.9 16.3 17.6 20.4 7.7 38.8 0.3 129.9
12 Total Outage OM&A 28.9 42.9 54.5 22.9 48.9 196.1 0.3 394.6
Plan - Year Ending December 31, 2018
Nuclear Stations:
13 Darlington NGS 0.0 14.5 16.5 2.5 22.1 65.0 0.0 120.7
14 Pickering NGS 0.0 12.5 21.1 0.0 22.6 69.4 0.0 125.6
15 Pickering Extended Operations 0.0 0.0 0.0 0.0 0.0 11.6 0.0 11.6
16 Total Stations 0.0 27.0 37.6 2.5 44.7 146.1 0.0 257.9
17 Nuclear Support Divisions1 27.6 16.9 15.1 17.3 6.3 52.4 0.2 135.8
18 Total Outage OM&A 27.6 43.9 52.8 19.8 51.0 198.5 0.3 393.8
Plan - Year Ending December 31, 2019
Nuclear Stations:
19 Darlington NGS 0.0 14.6 15.6 2.6 19.6 61.0 0.0 113.4
20 Pickering NGS 0.0 12.6 20.2 0.0 22.6 65.2 0.0 120.6
21 Pickering Extended Operations 0.0 0.0 0.0 0.0 0.0 20.8 0.0 20.8
22 Total Stations 0.0 27.3 35.8 2.6 42.2 147.0 0.0 254.8
23 Nuclear Support Divisions1 21.0 17.5 19.8 11.5 4.7 85.5 0.5 160.5
24 Total Outage OM&A 21.0 44.8 55.6 14.1 46.9 232.5 0.5 415.3
Plan - Year Ending December 31, 2020
Nuclear Stations:
25 Darlington NGS 0.0 14.7 17.2 2.0 25.0 86.5 0.0 145.4
26 Pickering NGS 0.0 5.4 6.7 0.0 4.6 73.8 0.0 90.5
27 Pickering Extended Operations 0.0 0.0 0.0 0.0 0.0 22.8 0.0 22.8
28 Total Stations 0.0 20.1 23.9 2.0 29.6 183.0 0.0 258.7
29 Nuclear Support Divisions1 15.7 14.0 14.9 9.3 2.1 79.6 0.2 135.7
30 Total Outage OM&A 15.7 34.1 38.8 11.3 31.7 262.6 0.2 394.4
Plan - Year Ending December 31, 2021
Nuclear Stations:
31 Darlington NGS 0.0 1.0 3.3 1.2 2.9 44.8 0.0 53.1
32 Pickering NGS 0.0 12.6 8.2 0.0 9.0 128.9 0.0 158.7
33 Pickering Extended Operations 0.0 0.0 0.0 0.0 0.0 0.0 0.0 0.0
34 Total Stations 0.0 13.6 11.5 1.2 11.9 173.6 0.0 211.8
35 Nuclear Support Divisions 12.0 8.5 5.0 0.0 0.1 71.1 0.0 96.7
36 Total Outage OM&A 12.0 22.1 16.5 1.2 12.0 244.7 0.0 308.5
Notes:
1 Nuclear Support Divisions includes Outage OM&A expenditures for Pickering Extended Operations of $9.9M in 2017, $25.7M in 2018, $67.9M in 2019
and $62.8M in 2020.
Table 2
Outage OM&A by Resource Type - Nuclear ($M)
Bridge Year and Test Period

Numbers may not add due to rounding. Updated: 2016-11-10
EB-2016-0152
Exhibit F2
Tab 4
Schedule 1
Table 3
Other
Line Non-Regular Augmented Purchased Total
No. Division Labour Labour Overtime Staff Materials Services Other Outage OM&A
(a) (b) (c) (d) (e) (f) (g) (h)
Budget - Year Ending December 31, 2013
Nuclear Stations:
1 Darlington NGS 0.0 13.3 25.8 0.6 21.1 35.8 0.2 96.9
2 Pickering NGS 0.0 10.2 27.3 0.0 20.9 31.3 0.1 89.7
3 Pickering Continued Operations 0.0 0.6 1.1 0.0 5.3 1.3 0.0 8.3
4 Total Stations 0.0 24.1 54.2 0.6 47.3 68.4 0.3 194.9
5 Nuclear Support Divisions 23.1 10.2 25.1 27.2 10.7 18.2 1.5 116.1
6 Total Outage OM&A 23.1 34.4 79.3 27.8 58.0 86.6 1.8 311.0
Actual - Year Ending December 31, 2013
Nuclear Stations:
7 Darlington NGS 0.0 12.4 30.3 0.0 23.5 28.4 1.0 95.7
8 Pickering NGS 0.0 5.1 25.2 0.0 21.6 25.2 0.6 77.6
9 Pickering Continued Operations 0.0 0.4 2.1 0.0 5.9 1.8 0.0 10.2
10 Total Stations 0.0 18.0 57.6 0.0 51.0 55.4 1.6 183.5
11 Nuclear Support Divisions1 16.8 10.8 28.6 15.6 10.2 11.7 0.2 94.0
12 Total Outage OM&A 16.8 28.7 86.2 15.6 61.2 67.1 1.8 277.5
OEB Approved2 - Year Ending December 31, 2014
Nuclear Stations:
13 Darlington NGS 0.0 10.5 14.0 2.0 14.0 25.4 0.0 65.9
14 Pickering NGS 0.0 11.0 29.4 0.0 22.1 37.6 0.0 100.1
15 Pickering Continued Operations 0.0 0.4 1.2 0.0 3.8 0.8 0.0 6.2
16 Total Stations 0.0 21.9 44.6 2.0 39.9 63.9 0.0 172.3
17 Nuclear Support Divisions 21.0 8.6 19.6 18.2 9.4 12.5 1.1 90.4
18 Total Outage OM&A 21.0 30.5 64.3 20.2 49.2 76.4 1.1 262.7
Actual - Year Ending December 31, 2014
Nuclear Stations:
19 Darlington NGS 0.0 7.7 13.8 0.4 13.0 20.9 0.6 56.4
20 Pickering NGS 0.0 8.7 20.5 0.1 19.1 33.9 0.8 83.0
21 Pickering Continued Operations 0.0 0.2 0.8 0.0 2.1 0.6 0.0 3.7
22 Total Stations 0.0 16.6 35.1 0.5 34.2 55.4 1.4 143.1
23 Nuclear Support Divisions1 18.6 10.2 15.8 16.0 8.2 9.3 0.1 78.2
24 Total Outage OM&A 18.6 26.8 50.8 16.5 42.4 64.7 1.5 221.3
OEB Approved3 - Year Ending December 31, 2015
Nuclear Stations:
25 Darlington NGS 0.0 10.4 24.9 6.7 27.3 56.9 0.0 126.2
26 Pickering NGS 0.0 8.6 28.1 0.0 19.2 38.3 0.0 94.3
27 Pickering Continued Operations 0.0 0.0 0.0 0.0 0.0 0.0 0.0 0.0
28 Total Stations 0.0 19.0 53.0 6.7 46.6 95.2 0.0 220.5
29 Nuclear Support Divisions 25.3 12.4 24.4 20.9 7.8 18.4 1.1 110.3
30 Total Outage OM&A 25.3 31.4 77.4 27.6 54.3 113.6 1.1 330.7
Actual - Year Ending December 31, 2015
Nuclear Stations:
31 Darlington NGS 0.0 10.5 18.2 0.7 27.0 65.9 1.6 123.8
32 Pickering NGS 0.0 6.4 19.6 0.2 23.7 46.4 1.1 97.4
33 Pickering Continued Operations 0.0 0.0 0.0 0.0 0.0 0.0 0.0 0.0
34 Pickering Extended Operations 0.0 0.0 0.0 0.0 0.0 0.0 0.0 0.0
35 Total Stations 0.0 16.8 37.8 0.8 50.8 112.3 2.6 221.2
36 Nuclear Support Divisions 20.0 13.7 15.8 25.0 6.9 11.0 0.1 92.5
37 Total Outage OM&A 20.0 30.5 53.7 25.8 57.6 123.3 2.7 313.7
Notes:
1 Nuclear Support Divisions includes Outage OM&A expenditures for Pickering Continued Operations of $10.5M for 2013 Actual and $10.7M for 2014 Actual.
2
3
Table 3
Outage OM&A by Resource Type - Nuclear ($M)
Historic Years
As OEB Approved adjustments shown on Ex. F2-1-1 Table 2 were made at the aggregate Nuclear OM&A level, the figures presented here are 2014 Plan (from EB-2013-
0321) rather than 2014 OEB Approved.
As OEB Approved adjustments shown on Ex. F2-1-1 Table 2 were made at the aggregate Nuclear OM&A level, the figures presented here are 2015 Plan (from EB-2013-
0321) rather than 2015 OEB Approved.