Embed Size (px)
Citation preview
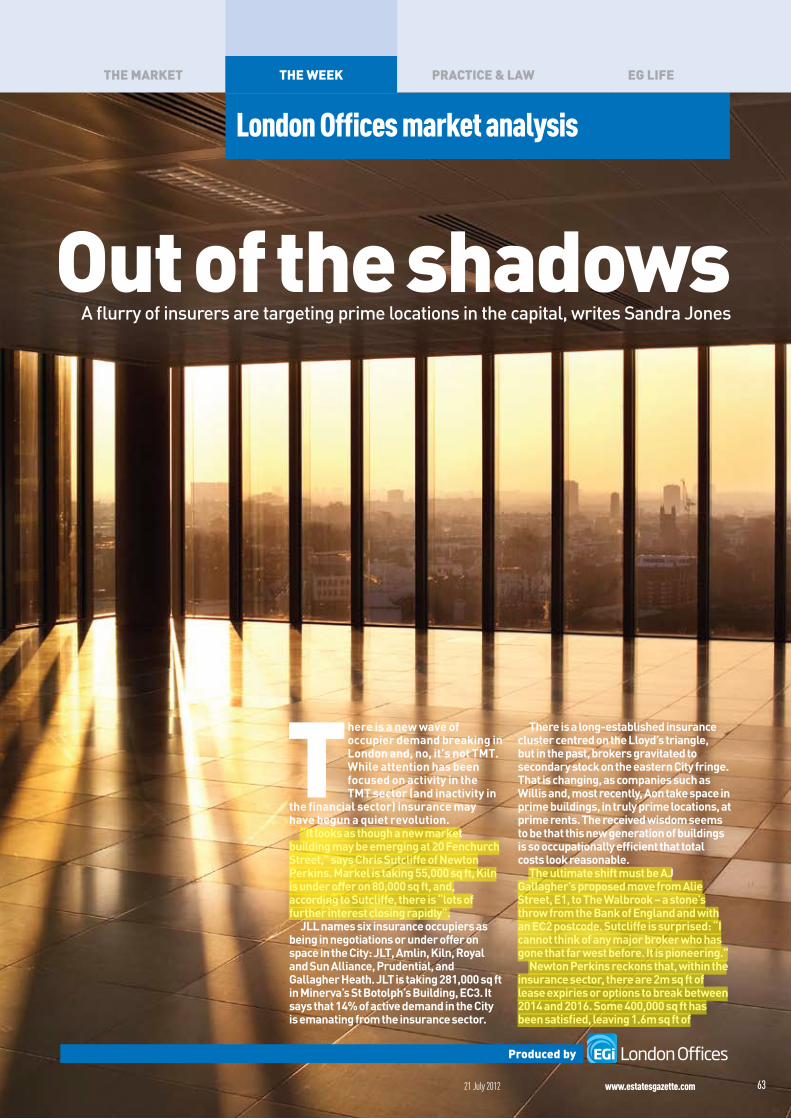
Out of the shadows
London Offices market analysis
A flurry of insurers are targeting prime locations in the capital, writes Sandra Jones
Produced by London Offices
the week Practice & Law eG Lifethe market
www.estatesgazette.com21 July 2012 63
there is a new wave of occupier demand breaking in London and, no, it’s not TMT. While attention has been focused on activity in the TMT sector (and inactivity in
the financial sector) insurance may have begun a quiet revolution.
“It looks as though a new market building may be emerging at 20 Fenchurch Street,” says Chris Sutcliffe of Newton Perkins. Markel is taking 55,000 sq ft, Kiln is under offer on 80,000 sq ft, and, according to Sutcliffe, there is “lots of further interest closing rapidly”.
JLL names six insurance occupiers as being in negotiations or under offer on space in the City: JLT, Amlin, Kiln, Royal and Sun Alliance, Prudential, and Gallagher Heath. JLT is taking 281,000 sq ft in Minerva’s St Botolph’s Building, EC3. It says that 14% of active demand in the City is emanating from the insurance sector.
There is a long-established insurance cluster centred on the Lloyd’s triangle, but in the past, brokers gravitated to secondary stock on the eastern City fringe. That is changing, as companies such as Willis and, most recently, Aon take space in prime buildings, in truly prime locations, at prime rents. The received wisdom seems to be that this new generation of buildings is so occupationally efficient that total costs look reasonable.
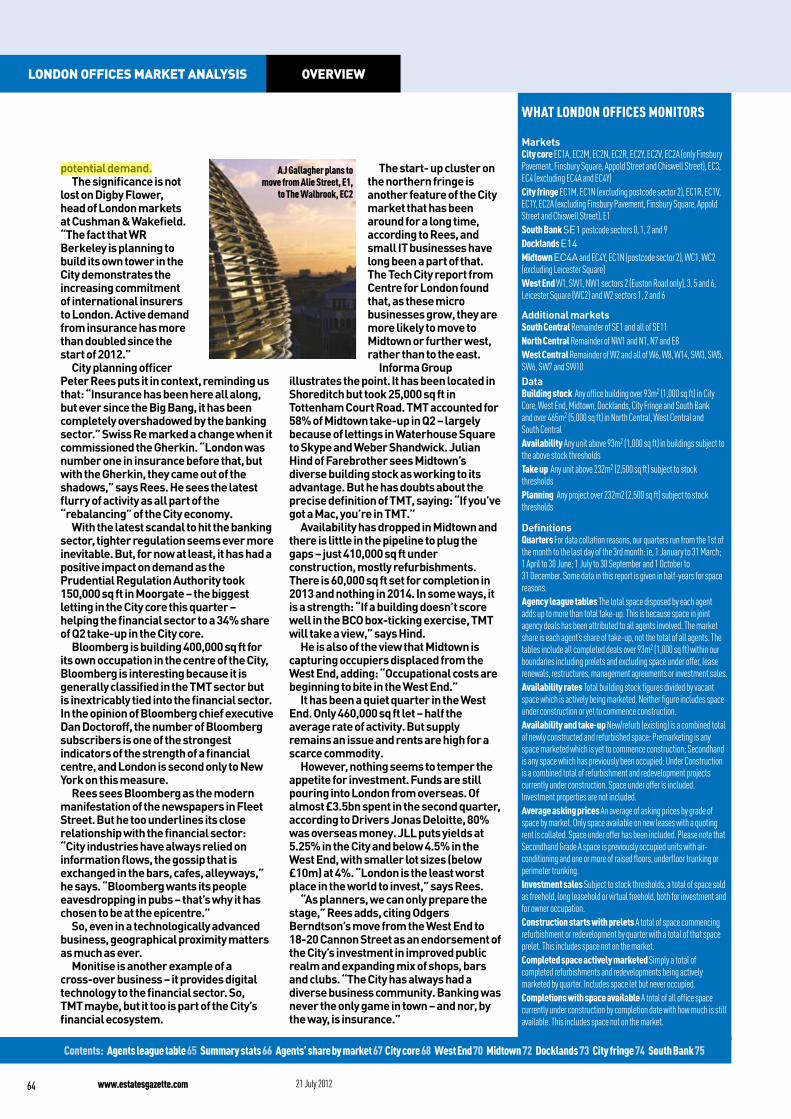
The ultimate shift must be AJ Gallagher’s proposed move from Alie Street, E1, to The Walbrook – a stone’s throw from the Bank of England and with an EC2 postcode. Sutcliffe is surprised: “I cannot think of any major broker who has gone that far west before. It is pioneering.”
Newton Perkins reckons that, within the insurance sector, there are 2m sq ft of lease expiries or options to break between 2014 and 2016. Some 400,000 sq ft has been satisfied, leaving 1.6m sq ft of
Contents: Agents league table 65 Summary stats 66 Agents’ share by market 67 City core 68 West End 70 Midtown 72 Docklands 73 City fringe 74 South Bank 75
MarketsCity core EC1A, EC2M, EC2N, EC2R, EC2Y, EC2V, EC2A (only Finsbury Pavement, Finsbury Square, Appold Street and Chiswell Street), EC3, EC4 (excluding EC4A and EC4Y)City fringe EC1M, EC1N (excluding postcode sector 2), EC1R, EC1V, EC1Y, EC2A (excluding Finsbury Pavement, Finsbury Square, Appold Street and Chiswell Street), E1South Bank SE1 postcode sectors 0, 1, 2 and 9Docklands E14Midtown EC4A and EC4Y, EC1N (postcode sector 2), WC1, WC2 (excluding Leicester Square)West End W1, SW1, NW1 sectors 2 (Euston Road only), 3, 5 and 6, Leicester Square (WC2) and W2 sectors 1, 2 and 6
Additional marketsSouth Central Remainder of SE1 and all of SE11North Central Remainder of NW1 and N1, N7 and E8West Central Remainder of W2 and all of W6, W8, W14, SW3, SW5, SW6, SW7 and SW10DataBuilding stock Any office building over 93m2 (1,000 sq ft) in City Core, West End, Midtown, Docklands, City Fringe and South Bank and over 465m2 (5,000 sq ft) in North Central, West Central and South CentralAvailability Any unit above 93m2 (1,000 sq ft) in buildings subject to the above stock thresholdsTake up Any unit above 232m2 (2,500 sq ft) subject to stock thresholdsPlanning Any project over 232m2 (2,500 sq ft) subject to stock thresholds
DefinitionsQuarters For data collation reasons, our quarters run from the 1st of the month to the last day of the 3rd month: ie, 1 January to 31 March; 1 April to 30 June; 1 July to 30 September and 1 October to 31 December. Some data in this report is given in half-years for space reasons. Agency league tables The total space disposed by each agent adds up to more than total take-up. This is because space in joint agency deals has been attributed to all agents involved. The market share is each agent’s share of take-up, not the total of all agents. The tables include all completed deals over 93m2 (1,000 sq ft) within our boundaries including prelets and excluding space under offer, lease renewals, restructures, management agreements or investment sales. Availability rates Total building stock figures divided by vacant space which is actively being marketed. Neither figure includes space under construction or yet to commence construction.Availability and take-up New/refurb (existing) is a combined total of newly constructed and refurbished space; Premarketing is any space marketed which is yet to commence construction; Secondhand is any space which has previously been occupied; Under Construction is a combined total of refurbishment and redevelopment projects currently under construction. Space under offer is included. Investment properties are not included.Average asking prices An average of asking prices by grade of space by market. Only space available on new leases with a quoting rent is collated. Space under offer has been included. Please note that Secondhand Grade A space is previously occupied units with air-conditioning and one or more of raised floors, underfloor trunking or perimeter trunking. Investment sales Subject to stock thresholds, a total of space sold as freehold, long leasehold or virtual freehold, both for investment and for owner occupation.Construction starts with prelets A total of space commencing refurbishment or redevelopment by quarter with a total of that space prelet. This includes space not on the market. Completed space actively marketed Simply a total of completed refurbishments and redevelopments being actively marketed by quarter. Includes space let but never occupied. Completions with space available A total of all office space currently under construction by completion date with how much is still available. This includes space not on the market.
WhAT LONDON OffICES MONITOrS
potential demand. The significance is not
lost on Digby Flower, head of London markets at Cushman & Wakefield. “The fact that WR Berkeley is planning to build its own tower in the City demonstrates the increasing commitment of international insurers to London. Active demand from insurance has more than doubled since the start of 2012.”
City planning officer Peter Rees puts it in context, reminding us that: “Insurance has been here all along, but ever since the Big Bang, it has been completely overshadowed by the banking sector.” Swiss Re marked a change when it commissioned the Gherkin. “London was number one in insurance before that, but with the Gherkin, they came out of the shadows,” says Rees. He sees the latest flurry of activity as all part of the “rebalancing” of the City economy.
With the latest scandal to hit the banking sector, tighter regulation seems ever more inevitable. But, for now at least, it has had a positive impact on demand as the Prudential Regulation Authority took 150,000 sq ft in Moorgate – the biggest letting in the City core this quarter – helping the financial sector to a 34% share of Q2 take-up in the City core.
Bloomberg is building 400,000 sq ft for its own occupation in the centre of the City, Bloomberg is interesting because it is generally classified in the TMT sector but is inextricably tied into the financial sector. In the opinion of Bloomberg chief executive Dan Doctoroff, the number of Bloomberg subscribers is one of the strongest indicators of the strength of a financial centre, and London is second only to New York on this measure.
Rees sees Bloomberg as the modern manifestation of the newspapers in Fleet Street. But he too underlines its close relationship with the financial sector: “City industries have always relied on information flows, the gossip that is exchanged in the bars, cafes, alleyways,” he says. “Bloomberg wants its people eavesdropping in pubs – that’s why it has chosen to be at the epicentre.”
So, even in a technologically advanced business, geographical proximity matters as much as ever.
Monitise is another example of a cross-over business – it provides digital technology to the financial sector. So, TMT maybe, but it too is part of the City’s financial ecosystem.
The start- up cluster on the northern fringe is another feature of the City market that has been around for a long time, according to Rees, and small IT businesses have long been a part of that. The Tech City report from Centre for London found that, as these micro businesses grow, they are more likely to move to Midtown or further west, rather than to the east.
Informa Group illustrates the point. It has been located in Shoreditch but took 25,000 sq ft in Tottenham Court Road. TMT accounted for 58% of Midtown take-up in Q2 – largely because of lettings in Waterhouse Square to Skype and Weber Shandwick. Julian Hind of Farebrother sees Midtown’s diverse building stock as working to its advantage. But he has doubts about the precise definition of TMT, saying: “If you’ve got a Mac, you’re in TMT.”
Availability has dropped in Midtown and there is little in the pipeline to plug the gaps – just 410,000 sq ft under construction, mostly refurbishments. There is 60,000 sq ft set for completion in 2013 and nothing in 2014. In some ways, it is a strength: “If a building doesn’t score well in the BCO box-ticking exercise, TMT will take a view,” says Hind.
He is also of the view that Midtown is capturing occupiers displaced from the West End, adding: “Occupational costs are beginning to bite in the West End.”
It has been a quiet quarter in the West End. Only 460,000 sq ft let – half the average rate of activity. But supply remains an issue and rents are high for a scarce commodity.
However, nothing seems to temper the appetite for investment. Funds are still pouring into London from overseas. Of almost £3.5bn spent in the second quarter, according to Drivers Jonas Deloitte, 80% was overseas money. JLL puts yields at 5.25% in the City and below 4.5% in the West End, with smaller lot sizes (below £10m) at 4%. “London is the least worst place in the world to invest,” says Rees.
“As planners, we can only prepare the stage,” Rees adds, citing Odgers Berndtson’s move from the West End to 18-20 Cannon Street as an endorsement of the City’s investment in improved public realm and expanding mix of shops, bars and clubs. “The City has always had a diverse business community. Banking was never the only game in town – and nor, by the way, is insurance.”
64 www.estatesgazette.com 21 July 2012
OverviewLOndOn Offices market anaLysis
AJ Gallagher plans to move from Alie Street, E1,
to The Walbrook, EC2
Rank Agent City WestEnd
No of disposals
1 Jones Lang LaSalle 40 28 12
2 CBRE 35 25 10
3 Knight Frank 30 9 21
4= Savills 27 20 7
4= DTZ 27 23 4
6= Anton Page 24 24
6= Cushman & Wakefield 24 13 11
8 EA Shaw 21 21
9= Edward Charles & Partners 17 17
9= Hatton Real Estate 17 17
11= Drivers Jonas Deloitte 16 8 8
11= GVA 16 11 5
13 Newton Perkins 14 14
14 Monmouth Dean 13 13
15= Strutt & Parker 12 4 8
15= Allsop 12 12
17 Frost Meadowcroft 11 11
18 BNP Paribas Real Estate 10 6 4
19 H2SO 9 9
20= Colliers International 8 3 5
20= Crossland Otter Hunt 8 8
20= Thompson Yates 8 8
20= Hall Kemp 8 8
20= Ingleby Trice 8 8
25= Dron & Wright 7 6 1
25= Tuckerman 7 7
25= BDG Sparkes Porter 7 7
To download an electronic version of this report, or to access the archive of previous reports, go to www. estatesgazette.com/london-offices
Only 26,000 sq ft separated the top three agents this quarter. Jones Lang LaSalle took first place with 22% of the market, in just under 484,000 sq ft, in 40 transactions. CBRE was second, having acted on 21% of the space let in 35 deals, and DTZ was third with 20% in 27 deals. Once again, these three agents dominated central London letting activity, with almost twice the square footage let by fourth-placed Cushman & Wakefield. CBRE, DTZ and JLL have occupied the top three positions in this table for eight of the past 10 quarters. The only other two agents to have been in the top three during that time were Cushman & Wakefield and Knight Frank.
In Q2 2012, Cushman & Wakefield, Savills and Knight Frank were clustered in fourth, fifth and sixth positions respectively, with similar volumes of activity, and there was a wide gulf between them and the next band, led by Drivers Jonas Deloitte in seventh place.
JLL was instrumental in securing the largest transaction this quarter at 20 Moorgate, EC2, (152,000 sq ft), together with DTZ and Cushman & Wakefield. On this occasion, JLL was not one of the joint marketing agents but its role in securing approval from freeholder IVG, in this tripartite deal, was acknowledged by the team as integral to the letting process. The next largest transaction was in Friars House, Blackfriars Road, SE1, where DTZ let 93,400 sq ft to the Practical Law Company.
The top10 this quarter was dominated by the large agents, with the exception of Edward Charles & Partners, which came in at 10 and has been in the list for six of the past 10 quarters, consistently acting on 3% or more of the space let.
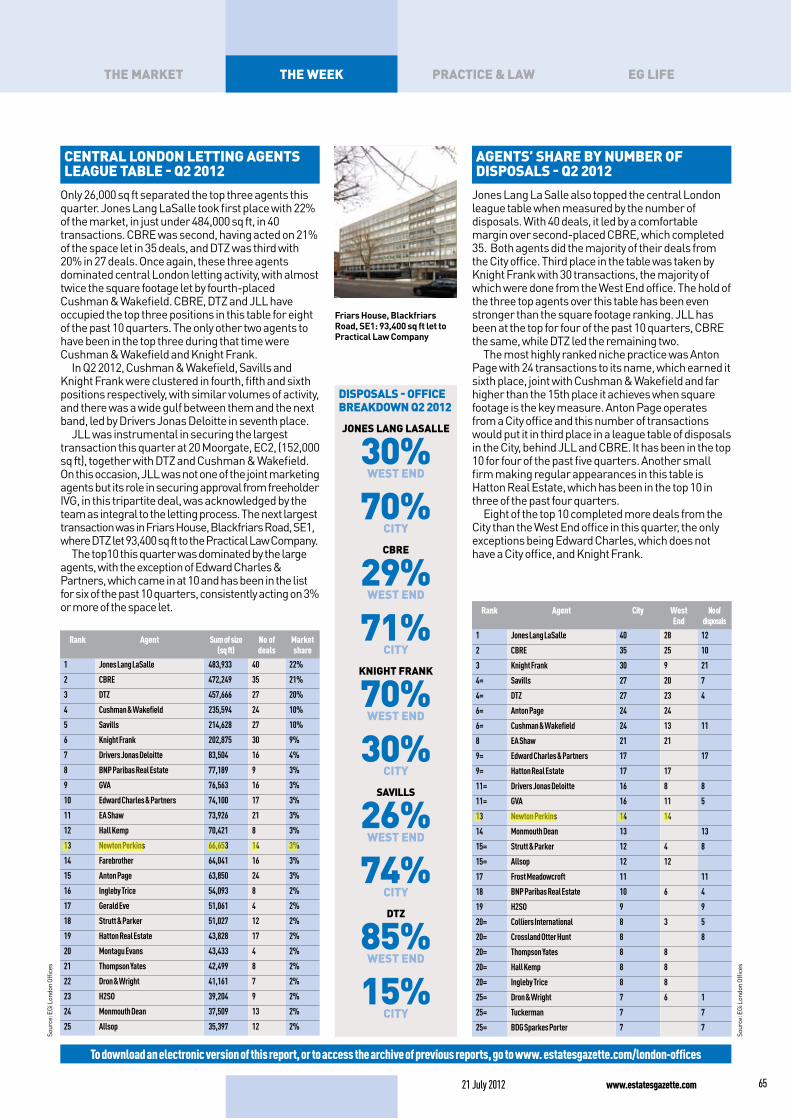
Jones Lang La Salle also topped the central London league table when measured by the number of disposals. With 40 deals, it led by a comfortable margin over second-placed CBRE, which completed 35. Both agents did the majority of their deals from the City office. Third place in the table was taken by Knight Frank with 30 transactions, the majority of which were done from the West End office. The hold of the three top agents over this table has been even stronger than the square footage ranking. JLL has been at the top for four of the past 10 quarters, CBRE the same, while DTZ led the remaining two.
The most highly ranked niche practice was Anton Page with 24 transactions to its name, which earned it sixth place, joint with Cushman & Wakefield and far higher than the 15th place it achieves when square footage is the key measure. Anton Page operates from a City office and this number of transactions would put it in third place in a league table of disposals in the City, behind JLL and CBRE. It has been in the top 10 for four of the past five quarters. Another small firm making regular appearances in this table is Hatton Real Estate, which has been in the top 10 in three of the past four quarters.
Eight of the top 10 completed more deals from the City than the West End office in this quarter, the only exceptions being Edward Charles, which does not have a City office, and Knight Frank.
Agents’ shAre by number of disposAls - Q2 2012
CentrAl london letting Agents leAgue tAble - Q2 2012
disposAls - offiCe breAkdown Q2 2012
Jones lAng lAsAlle
30%west end
70%City
Cbre
29%west end
71%City
knight frAnk
70%west end
30%City
sAvills
26%west end
74%City
dtZ
85%west end
15%City
Sour
ce: E
Gi L
ondo
n Of
fices
Sour
ce: E
Gi L
ondo
n Of
fices
www.estatesgazette.com21 July 2012 65
the week prACtiCe & lAw eg lifethe mArket
Rank Agent Sum of size (sq ft)
No of deals
Market share
1 Jones Lang LaSalle 483,933 40 22%
2 CBRE 472,249 35 21%
3 DTZ 457,666 27 20%
4 Cushman & Wakefield 235,594 24 10%
5 Savills 214,628 27 10%
6 Knight Frank 202,875 30 9%
7 Drivers Jonas Deloitte 83,504 16 4%
8 BNP Paribas Real Estate 77,189 9 3%
9 GVA 76,563 16 3%
10 Edward Charles & Partners 74,100 17 3%
11 EA Shaw 73,926 21 3%
12 Hall Kemp 70,421 8 3%
13 Newton Perkins 66,653 14 3%
14 Farebrother 64,041 16 3%
15 Anton Page 63,850 24 3%
16 Ingleby Trice 54,093 8 2%
17 Gerald Eve 51,061 4 2%
18 Strutt & Parker 51,027 12 2%
19 Hatton Real Estate 43,828 17 2%
20 Montagu Evans 43,433 4 2%
21 Thompson Yates 42,499 8 2%
22 Dron & Wright 41,161 7 2%
23 H2SO 39,204 9 2%
24 Monmouth Dean 37,509 13 2%
25 Allsop 35,397 12 2%
Friars House, Blackfriars Road, SE1: 93,400 sq ft let to Practical Law Company
For any data queries, please contact [email protected] or call 020 7911 1878
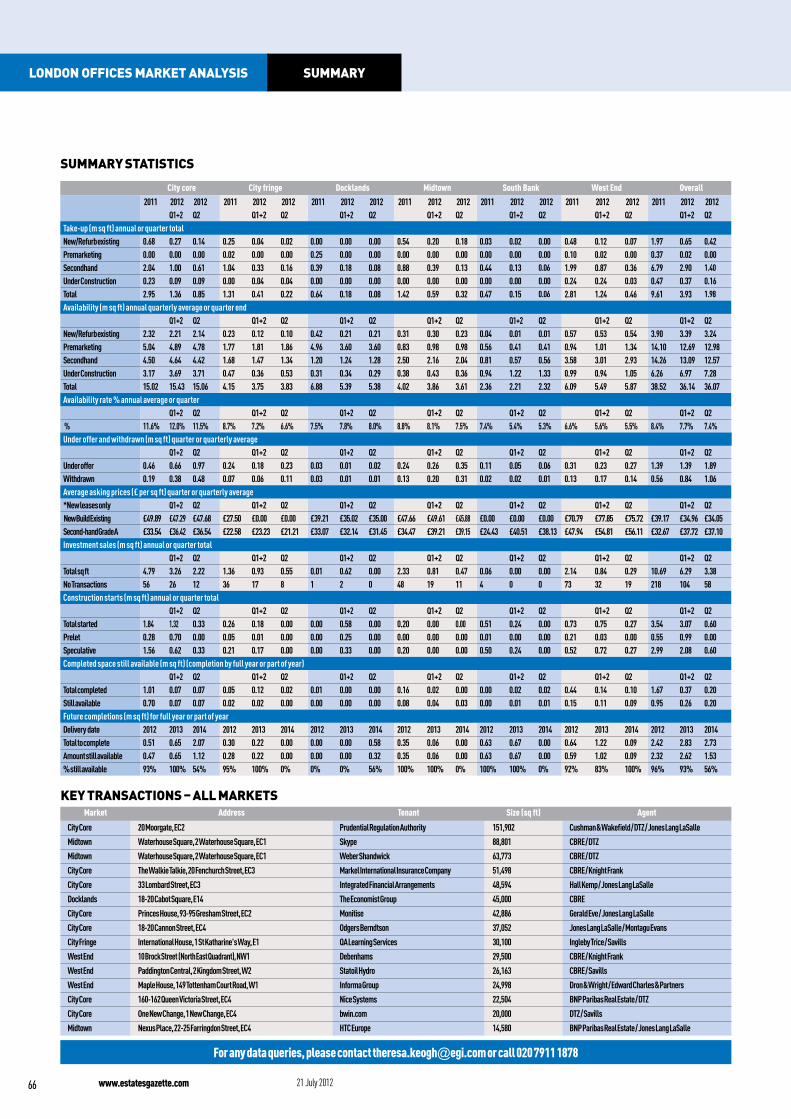
summary statistics
City core City fringe Docklands Midtown South Bank West End Overall2011 2012 2012 2011 2012 2012 2011 2012 2012 2011 2012 2012 2011 2012 2012 2011 2012 2012 2011 2012 2012
Q1+2 Q2 Q1+2 Q2 Q1+2 Q2 Q1+2 Q2 Q1+2 Q2 Q1+2 Q2 Q1+2 Q2Take-up (m sq ft) annual or quarter totalNew/Refurb existing 0.68 0.27 0.14 0.25 0.04 0.02 0.00 0.00 0.00 0.54 0.20 0.18 0.03 0.02 0.00 0.48 0.12 0.07 1.97 0.65 0.42Premarketing 0.00 0.00 0.00 0.02 0.00 0.00 0.25 0.00 0.00 0.00 0.00 0.00 0.00 0.00 0.00 0.10 0.02 0.00 0.37 0.02 0.00Secondhand 2.04 1.00 0.61 1.04 0.33 0.16 0.39 0.18 0.08 0.88 0.39 0.13 0.44 0.13 0.06 1.99 0.87 0.36 6.79 2.90 1.40
Under Construction 0.23 0.09 0.09 0.00 0.04 0.04 0.00 0.00 0.00 0.00 0.00 0.00 0.00 0.00 0.00 0.24 0.24 0.03 0.47 0.37 0.16Total 2.95 1.36 0.85 1.31 0.41 0.22 0.64 0.18 0.08 1.42 0.59 0.32 0.47 0.15 0.06 2.81 1.24 0.46 9.61 3.93 1.98
Availability (m sq ft) annual quarterly average or quarter endQ1+2 Q2 Q1+2 Q2 Q1+2 Q2 Q1+2 Q2 Q1+2 Q2 Q1+2 Q2 Q1+2 Q2
New/Refurb existing 2.32 2.21 2.14 0.23 0.12 0.10 0.42 0.21 0.21 0.31 0.30 0.23 0.04 0.01 0.01 0.57 0.53 0.54 3.90 3.39 3.24Premarketing 5.04 4.89 4.78 1.77 1.81 1.86 4.96 3.60 3.60 0.83 0.98 0.98 0.56 0.41 0.41 0.94 1.01 1.34 14.10 12.69 12.98Secondhand 4.50 4.64 4.42 1.68 1.47 1.34 1.20 1.24 1.28 2.50 2.16 2.04 0.81 0.57 0.56 3.58 3.01 2.93 14.26 13.09 12.57Under Construction 3.17 3.69 3.71 0.47 0.36 0.53 0.31 0.34 0.29 0.38 0.43 0.36 0.94 1.22 1.33 0.99 0.94 1.05 6.26 6.97 7.28Total 15.02 15.43 15.06 4.15 3.75 3.83 6.88 5.39 5.38 4.02 3.86 3.61 2.36 2.21 2.32 6.09 5.49 5.87 38.52 36.14 36.07Availability rate % annual average or quarter
Q1+2 Q2 Q1+2 Q2 Q1+2 Q2 Q1+2 Q2 Q1+2 Q2 Q1+2 Q2 Q1+2 Q2 % 11.6% 12.0% 11.5% 8.7% 7.2% 6.6% 7.5% 7.8% 8.0% 8.8% 8.1% 7.5% 7.4% 5.4% 5.3% 6.6% 5.6% 5.5% 8.4% 7.7% 7.4%Under offer and withdrawn (m sq ft) quarter or quarterly average
Q1+2 Q2 Q1+2 Q2 Q1+2 Q2 Q1+2 Q2 Q1+2 Q2 Q1+2 Q2 Q1+2 Q2Under offer 0.46 0.66 0.97 0.24 0.18 0.23 0.03 0.01 0.02 0.24 0.26 0.35 0.11 0.05 0.06 0.31 0.23 0.27 1.39 1.39 1.89Withdrawn 0.19 0.38 0.48 0.07 0.06 0.11 0.03 0.01 0.01 0.13 0.20 0.31 0.02 0.02 0.01 0.13 0.17 0.14 0.56 0.84 1.06Average asking prices (£ per sq ft) quarter or quarterly average*New leases only Q1+2 Q2 Q1+2 Q2 Q1+2 Q2 Q1+2 Q2 Q1+2 Q2 Q1+2 Q2 Q1+2 Q2 New Build Existing £49.89 £47.29 £47.68 £27.50 £0.00 £0.00 £39.21 £35.02 £35.00 £47.66 £49.61 £45.88 £0.00 £0.00 £0.00 £70.79 £77.85 £75.72 £39.17 £34.96 £34.05Second-hand Grade A £33.54 £36.42 £36.54 £22.58 £23.23 £21.21 £33.07 £32.14 £31.45 £34.47 £39.21 £39.15 £24.43 £40.51 £38.13 £47.94 £54.81 £56.11 £32.67 £37.72 £37.10Investment sales (m sq ft) annual or quarter total
Q1+2 Q2 Q1+2 Q2 Q1+2 Q2 Q1+2 Q2 Q1+2 Q2 Q1+2 Q2 Q1+2 Q2Total sq ft 4.79 3.26 2.22 1.36 0.93 0.55 0.01 0.62 0.00 2.33 0.81 0.47 0.06 0.00 0.00 2.14 0.84 0.29 10.69 6.29 3.38No Transactions 56 26 12 36 17 8 1 2 0 48 19 11 4 0 0 73 32 19 218 104 58Construction starts (m sq ft) annual or quarter total
Q1+2 Q2 Q1+2 Q2 Q1+2 Q2 Q1+2 Q2 Q1+2 Q2 Q1+2 Q2 Q1+2 Q2Total started 1.84 1.32 0.33 0.26 0.18 0.00 0.00 0.58 0.00 0.20 0.00 0.00 0.51 0.24 0.00 0.73 0.75 0.27 3.54 3.07 0.60Prelet 0.28 0.70 0.00 0.05 0.01 0.00 0.00 0.25 0.00 0.00 0.00 0.00 0.01 0.00 0.00 0.21 0.03 0.00 0.55 0.99 0.00Speculative 1.56 0.62 0.33 0.21 0.17 0.00 0.00 0.33 0.00 0.20 0.00 0.00 0.50 0.24 0.00 0.52 0.72 0.27 2.99 2.08 0.60Completed space still available (m sq ft) (completion by full year or part of year)
Q1+2 Q2 Q1+2 Q2 Q1+2 Q2 Q1+2 Q2 Q1+2 Q2 Q1+2 Q2 Q1+2 Q2Total completed 1.01 0.07 0.07 0.05 0.12 0.02 0.01 0.00 0.00 0.16 0.02 0.00 0.00 0.02 0.02 0.44 0.14 0.10 1.67 0.37 0.20Still available 0.70 0.07 0.07 0.02 0.02 0.00 0.00 0.00 0.00 0.08 0.04 0.03 0.00 0.01 0.01 0.15 0.11 0.09 0.95 0.26 0.20Future completions (m sq ft) for full year or part of yearDelivery date 2012 2013 2014 2012 2013 2014 2012 2013 2014 2012 2013 2014 2012 2013 2014 2012 2013 2014 2012 2013 2014Total to complete 0.51 0.65 2.07 0.30 0.22 0.00 0.00 0.00 0.58 0.35 0.06 0.00 0.63 0.67 0.00 0.64 1.22 0.09 2.42 2.83 2.73Amount still available 0.47 0.65 1.12 0.28 0.22 0.00 0.00 0.00 0.32 0.35 0.06 0.00 0.63 0.67 0.00 0.59 1.02 0.09 2.32 2.62 1.53% still available 93% 100% 54% 95% 100% 0% 0% 0% 56% 100% 100% 0% 100% 100% 0% 92% 83% 100% 96% 93% 56%
Market Address Tenant Size (sq ft) Agent
City Core 20 Moorgate, EC2 Prudential Regulation Authority 151,902 Cushman & Wakefield / DTZ / Jones Lang LaSalle
Midtown Waterhouse Square, 2 Waterhouse Square, EC1 Skype 88,801 CBRE / DTZ
Midtown Waterhouse Square, 2 Waterhouse Square, EC1 Weber Shandwick 63,773 CBRE / DTZ
City Core The Walkie Talkie, 20 Fenchurch Street, EC3 Markel International Insurance Company 51,498 CBRE / Knight Frank
City Core 33 Lombard Street, EC3 Integrated Financial Arrangements 48,594 Hall Kemp / Jones Lang LaSalle
Docklands 18-20 Cabot Square, E14 The Economist Group 45,000 CBRE
City Core Princes House, 93-95 Gresham Street, EC2 Monitise 42,886 Gerald Eve / Jones Lang LaSalle
City Core 18-20 Cannon Street, EC4 Odgers Berndtson 37,052 Jones Lang LaSalle / Montagu Evans
City Fringe International House, 1 St Katharine's Way, E1 QA Learning Services 30,100 Ingleby Trice / Savills
West End 10 Brock Street (North East Quadrant), NW1 Debenhams 29,500 CBRE / Knight Frank
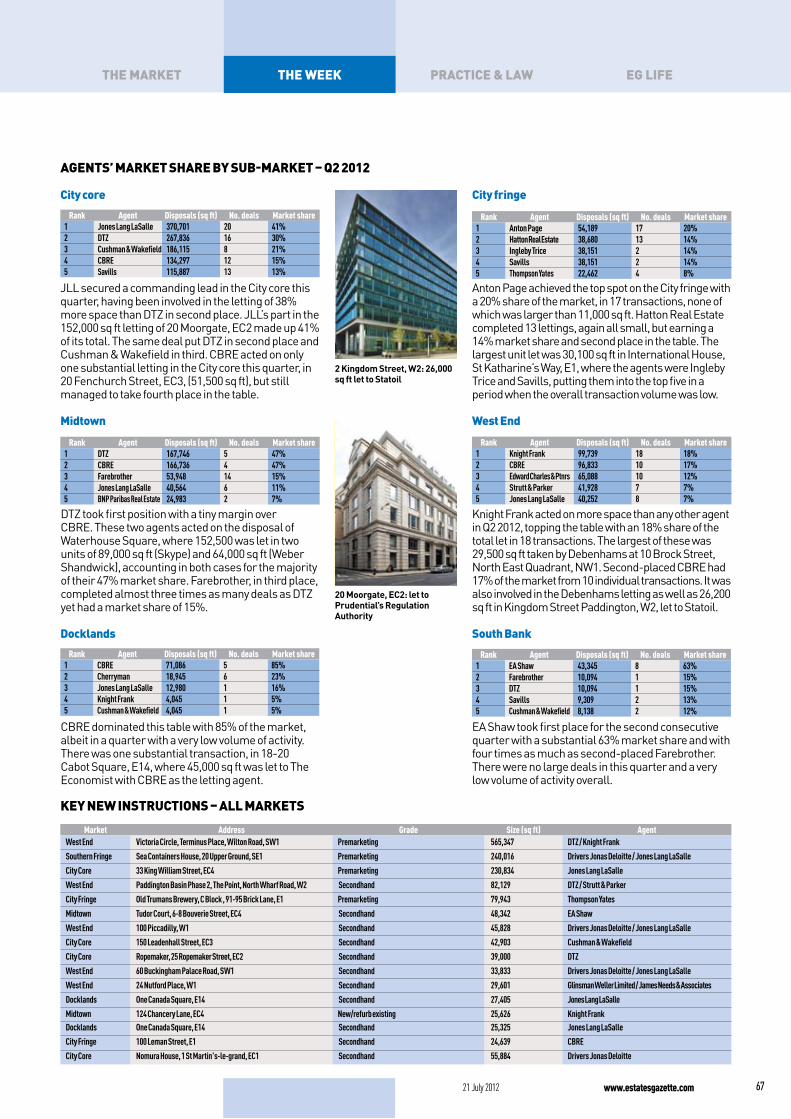
West End Paddington Central, 2 Kingdom Street, W2 Statoil Hydro 26,163 CBRE / Savills
West End Maple House, 149 Tottenham Court Road, W1 Informa Group 24,998 Dron & Wright / Edward Charles & Partners
City Core 160-162 Queen Victoria Street, EC4 Nice Systems 22,504 BNP Paribas Real Estate / DTZ
City Core One New Change, 1 New Change, EC4 bwin.com 20,000 DTZ / Savills
Midtown Nexus Place, 22-25 Farringdon Street, EC4 HTC Europe 14,580 BNP Paribas Real Estate / Jones Lang LaSalle
Key transactions – all marKets
66 www.estatesgazette.com 21 July 2012
summarylondon offices marKet analysis
the week practice & Law eG Lifethe market
aGents’ market share by sub-market – Q2 2012
Market Address Grade Size (sq ft) AgentWest End Victoria Circle, Terminus Place, Wilton Road, SW1 Premarketing 565,347 DTZ / Knight Frank
Southern Fringe Sea Containers House, 20 Upper Ground, SE1 Premarketing 240,016 Drivers Jonas Deloitte / Jones Lang LaSalle
City Core 33 King William Street, EC4 Premarketing 230,834 Jones Lang LaSalle
West End Paddington Basin Phase 2, The Point, North Wharf Road, W2 Secondhand 82,129 DTZ / Strutt & Parker
City Fringe Old Trumans Brewery, C Block , 91-95 Brick Lane, E1 Premarketing 79,943 Thompson Yates
Midtown Tudor Court, 6-8 Bouverie Street, EC4 Secondhand 48,342 EA Shaw
West End 100 Piccadilly, W1 Secondhand 45,828 Drivers Jonas Deloitte / Jones Lang LaSalle
City Core 150 Leadenhall Street, EC3 Secondhand 42,903 Cushman & Wakefield
City Core Ropemaker, 25 Ropemaker Street, EC2 Secondhand 39,000 DTZ
West End 60 Buckingham Palace Road, SW1 Secondhand 33,833 Drivers Jonas Deloitte / Jones Lang LaSalle
West End 24 Nutford Place, W1 Secondhand 29,601 Glinsman Weller Limited / James Needs & Associates
Docklands One Canada Square, E14 Secondhand 27,405 Jones Lang LaSalle
Midtown 124 Chancery Lane, EC4 New/refurb existing 25,626 Knight FrankDocklands One Canada Square, E14 Secondhand 25,325 Jones Lang LaSalle
City Fringe 100 Leman Street, E1 Secondhand 24,639 CBRE
City Core Nomura House, 1 St Martin's-le-grand, EC1 Secondhand 55,884 Drivers Jonas Deloitte
key new instructions – aLL markets
city core city fringe
midtown west end
Docklands south bank
JLL secured a commanding lead in the City core this quarter, having been involved in the letting of 38% more space than DTZ in second place. JLL’s part in the 152,000 sq ft letting of 20 Moorgate, EC2 made up 41% of its total. The same deal put DTZ in second place and Cushman & Wakefield in third. CBRE acted on only one substantial letting in the City core this quarter, in 20 Fenchurch Street, EC3, (51,500 sq ft), but still managed to take fourth place in the table.
DTZ took first position with a tiny margin over CBRE. These two agents acted on the disposal of Waterhouse Square, where 152,500 was let in two units of 89,000 sq ft (Skype) and 64,000 sq ft (Weber Shandwick), accounting in both cases for the majority of their 47% market share. Farebrother, in third place, completed almost three times as many deals as DTZ yet had a market share of 15%.
CBRE dominated this table with 85% of the market, albeit in a quarter with a very low volume of activity. There was one substantial transaction, in 18-20 Cabot Square, E14, where 45,000 sq ft was let to The Economist with CBRE as the letting agent.
Rank Agent Disposals (sq ft) No. deals Market share1 Jones Lang LaSalle 370,701 20 41%2 DTZ 267,836 16 30%3 Cushman & Wakefield 186,115 8 21%4 CBRE 134,297 12 15%5 Savills 115,887 13 13%
Rank Agent Disposals (sq ft) No. deals Market share1 DTZ 167,746 5 47%2 CBRE 166,736 4 47%3 Farebrother 53,948 14 15%4 Jones Lang LaSalle 40,564 6 11%5 BNP Paribas Real Estate 24,983 2 7%
Rank Agent Disposals (sq ft) No. deals Market share1 CBRE 71,086 5 85%2 Cherryman 18,945 6 23%3 Jones Lang LaSalle 12,980 1 16%4 Knight Frank 4,045 1 5%5 Cushman & Wakefield 4,045 1 5%
2 Kingdom Street, W2: 26,000 sq ft let to Statoil
20 Moorgate, EC2: let to Prudential’s Regulation Authority
Anton Page achieved the top spot on the City fringe with a 20% share of the market, in 17 transactions, none of which was larger than 11,000 sq ft. Hatton Real Estate completed 13 lettings, again all small, but earning a 14% market share and second place in the table. The largest unit let was 30,100 sq ft in International House, St Katharine’s Way, E1, where the agents were Ingleby Trice and Savills, putting them into the top five in a period when the overall transaction volume was low.
Knight Frank acted on more space than any other agent in Q2 2012, topping the table with an 18% share of the total let in 18 transactions. The largest of these was 29,500 sq ft taken by Debenhams at 10 Brock Street, North East Quadrant, NW1. Second-placed CBRE had 17% of the market from 10 individual transactions. It was also involved in the Debenhams letting as well as 26,200 sq ft in Kingdom Street Paddington, W2, let to Statoil.
EA Shaw took first place for the second consecutive quarter with a substantial 63% market share and with four times as much as second-placed Farebrother. There were no large deals in this quarter and a very low volume of activity overall.
Rank Agent Disposals (sq ft) No. deals Market share1 Anton Page 54,189 17 20%2 Hatton Real Estate 38,680 13 14%3 Ingleby Trice 38,151 2 14%4 Savills 38,151 2 14%5 Thompson Yates 22,462 4 8%
Rank Agent Disposals (sq ft) No. deals Market share1 Knight Frank 99,739 18 18%2 CBRE 96,833 10 17%3 Edward Charles & Ptnrs 65,088 10 12%4 Strutt & Parker 41,928 7 7%5 Jones Lang LaSalle 40,252 8 7%
Rank Agent Disposals (sq ft) No. deals Market share1 EA Shaw 43,345 8 63%2 Farebrother 10,094 1 15%3 DTZ 10,094 1 15%4 Savills 9,309 2 13%5 Cushman & Wakefield 8,138 2 12%
www.estatesgazette.com21 July 2012 67
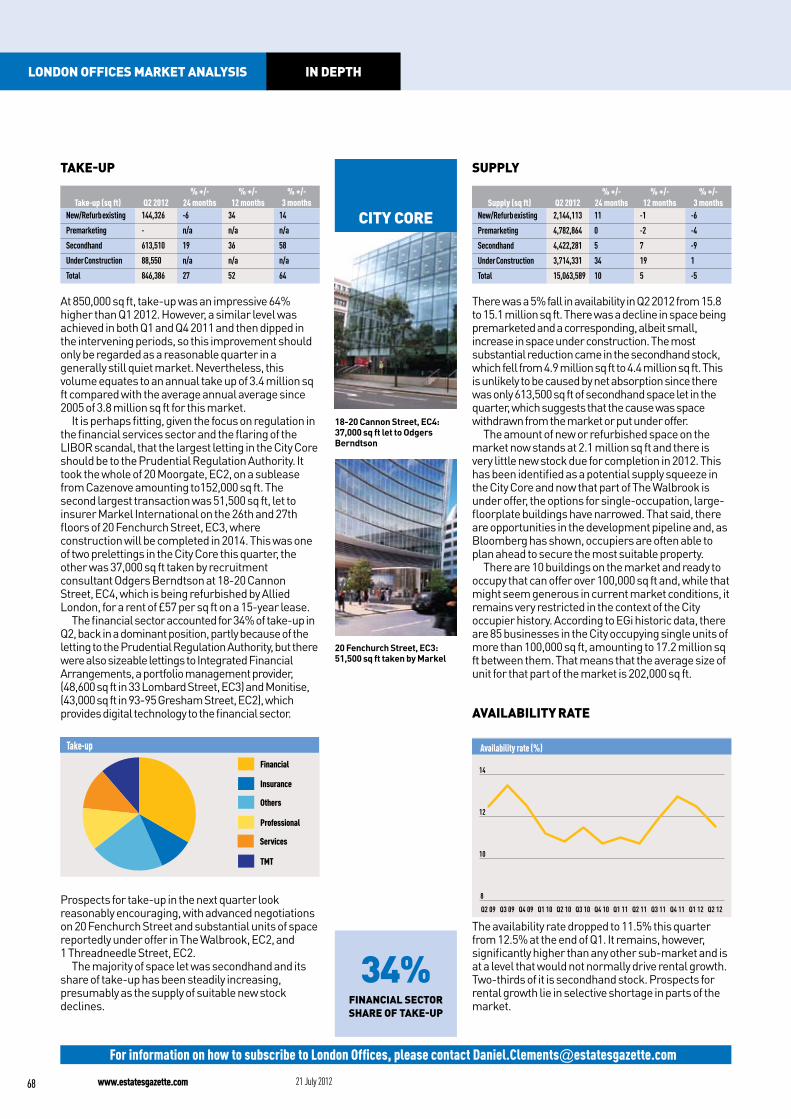
18-20 Cannon Street, EC4: 37,000 sq ft let to Odgers Berndtson
20 Fenchurch Street, EC3: 51,500 sq ft taken by Markel
city core
34% Financial sector share oF take-up
For information on how to subscribe to London Offices, please contact [email protected]
take-up
% +/- % +/- % +/-Take-up (sq ft) Q2 2012 24 months 12 months 3 months
New/Refurb existing 144,326 -6 34 14
Premarketing - n/a n/a n/a
Secondhand 613,510 19 36 58
Under Construction 88,550 n/a n/a n/a
Total 846,386 27 52 64
At 850,000 sq ft, take-up was an impressive 64% higher than Q1 2012. However, a similar level was achieved in both Q1 and Q4 2011 and then dipped in the intervening periods, so this improvement should only be regarded as a reasonable quarter in a generally still quiet market. Nevertheless, this volume equates to an annual take up of 3.4 million sq ft compared with the average annual average since 2005 of 3.8 million sq ft for this market.
It is perhaps fitting, given the focus on regulation in the financial services sector and the flaring of the LIBOR scandal, that the largest letting in the City Core should be to the Prudential Regulation Authority. It took the whole of 20 Moorgate, EC2, on a sublease from Cazenove amounting to152,000 sq ft. The second largest transaction was 51,500 sq ft, let to insurer Markel International on the 26th and 27th floors of 20 Fenchurch Street, EC3, where construction will be completed in 2014. This was one of two prelettings in the City Core this quarter, the other was 37,000 sq ft taken by recruitment consultant Odgers Berndtson at 18-20 Cannon Street, EC4, which is being refurbished by Allied London, for a rent of £57 per sq ft on a 15-year lease.
The financial sector accounted for 34% of take-up in Q2, back in a dominant position, partly because of the letting to the Prudential Regulation Authority, but there were also sizeable lettings to Integrated Financial Arrangements, a portfolio management provider, (48,600 sq ft in 33 Lombard Street, EC3) and Monitise, (43,000 sq ft in 93-95 Gresham Street, EC2), which provides digital technology to the financial sector.
TMT
TMT
Services
Services
Professional
Professional Others
Others
Insurance
Insurance
Financial
Financial
Take-up
Prospects for take-up in the next quarter look reasonably encouraging, with advanced negotiations on 20 Fenchurch Street and substantial units of space reportedly under offer in The Walbrook, EC2, and 1 Threadneedle Street, EC2.
The majority of space let was secondhand and its share of take-up has been steadily increasing, presumably as the supply of suitable new stock declines.
supply
% +/- % +/- % +/-Supply (sq ft) Q2 2012 24 months 12 months 3 months
New/Refurb existing 2,144,113 11 -1 -6
Premarketing 4,782,864 0 -2 -4
Secondhand 4,422,281 5 7 -9
Under Construction 3,714,331 34 19 1
Total 15,063,589 10 5 -5
There was a 5% fall in availability in Q2 2012 from 15.8 to 15.1 million sq ft. There was a decline in space being premarketed and a corresponding, albeit small, increase in space under construction. The most substantial reduction came in the secondhand stock, which fell from 4.9 million sq ft to 4.4 million sq ft. This is unlikely to be caused by net absorption since there was only 613,500 sq ft of secondhand space let in the quarter, which suggests that the cause was space withdrawn from the market or put under offer.
The amount of new or refurbished space on the market now stands at 2.1 million sq ft and there is very little new stock due for completion in 2012. This has been identified as a potential supply squeeze in the City Core and now that part of The Walbrook is under offer, the options for single-occupation, large-floorplate buildings have narrowed. That said, there are opportunities in the development pipeline and, as Bloomberg has shown, occupiers are often able to plan ahead to secure the most suitable property.
There are 10 buildings on the market and ready to occupy that can offer over 100,000 sq ft and, while that might seem generous in current market conditions, it remains very restricted in the context of the City occupier history. According to EGi historic data, there are 85 businesses in the City occupying single units of more than 100,000 sq ft, amounting to 17.2 million sq ft between them. That means that the average size of unit for that part of the market is 202,000 sq ft.
availability rate
Availability rate (%)
8
10
12
14
Q2 12Q1 12Q4 11Q3 11Q2 11Q1 11Q4 10Q3 10Q2 10Q1 10Q4 09Q3 09Q2 09
The availability rate dropped to 11.5% this quarter from 12.5% at the end of Q1. It remains, however, significantly higher than any other sub-market and is at a level that would not normally drive rental growth. Two-thirds of it is secondhand stock. Prospects for rental growth lie in selective shortage in parts of the market.
68 www.estatesgazette.com 21 July 2012
in depthlondon oFFices market analysis
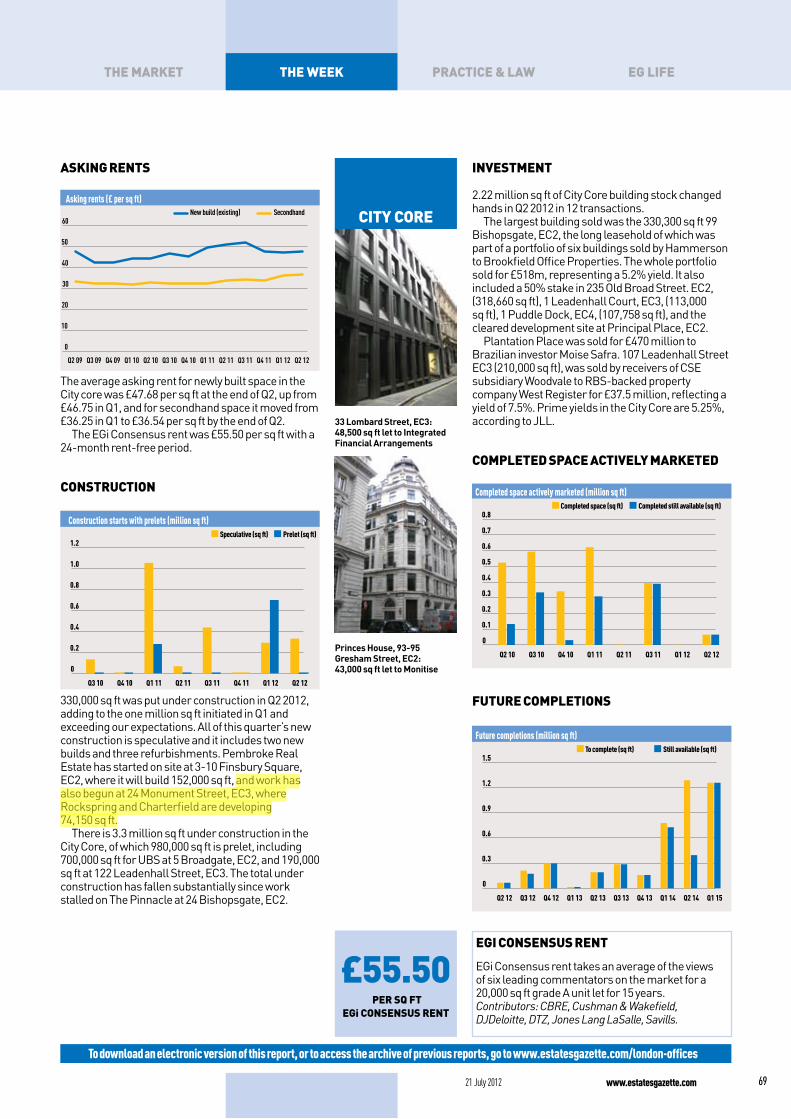
33 Lombard Street, EC3: 48,500 sq ft let to Integrated Financial Arrangements
Princes House, 93-95 Gresham Street, EC2: 43,000 sq ft let to Monitise
city core
£55.50 per sq Ft
eGi consensus rent
askinG rents
Asking rents (£ per sq ft)
0
10
20
30
40
50
60
Q2 12Q1 12Q4 11Q3 11Q2 11Q1 11Q4 10Q3 10Q2 10Q1 10Q4 09Q3 09Q2 09
SecondhandNew build (existing)
The average asking rent for newly built space in the City core was £47.68 per sq ft at the end of Q2, up from £46.75 in Q1, and for secondhand space it moved from £36.25 in Q1 to £36.54 per sq ft by the end of Q2.
The EGi Consensus rent was £55.50 per sq ft with a 24-month rent-free period.
construction
Construction starts with prelets (million sq ft)
0
0.2
0.4
0.6
0.8
1.0
1.2
Q2 12Q1 12Q4 11Q3 11Q2 11Q1 11Q4 10Q3 10
Prelet (sq ft)Speculative (sq ft)
330,000 sq ft was put under construction in Q2 2012, adding to the one million sq ft initiated in Q1 and exceeding our expectations. All of this quarter’s new construction is speculative and it includes two new builds and three refurbishments. Pembroke Real Estate has started on site at 3-10 Finsbury Square, EC2, where it will build 152,000 sq ft, and work has also begun at 24 Monument Street, EC3, where Rockspring and Charterfield are developing 74,150 sq ft.
There is 3.3 million sq ft under construction in the City Core, of which 980,000 sq ft is prelet, including 700,000 sq ft for UBS at 5 Broadgate, EC2, and 190,000 sq ft at 122 Leadenhall Street, EC3. The total under construction has fallen substantially since work stalled on The Pinnacle at 24 Bishopsgate, EC2.
To download an electronic version of this report, or to access the archive of previous reports, go to www.estatesgazette.com/london-offices
investment
2.22 million sq ft of City Core building stock changed hands in Q2 2012 in 12 transactions.
The largest building sold was the 330,300 sq ft 99 Bishopsgate, EC2, the long leasehold of which was part of a portfolio of six buildings sold by Hammerson to Brookfield Office Properties. The whole portfolio sold for £518m, representing a 5.2% yield. It also included a 50% stake in 235 Old Broad Street. EC2, (318,660 sq ft), 1 Leadenhall Court, EC3, (113,000 sq ft), 1 Puddle Dock, EC4, (107,758 sq ft), and the cleared development site at Principal Place, EC2.
Plantation Place was sold for £470 million to Brazilian investor Moise Safra. 107 Leadenhall Street EC3 (210,000 sq ft), was sold by receivers of CSE subsidiary Woodvale to RBS-backed property company West Register for £37.5 million, reflecting a yield of 7.5%. Prime yields in the City Core are 5.25%, according to JLL.
completed space actively marketed
Completed space actively marketed (million sq ft)
0
0.1
0.2
0.3
0.4
0.5
0.6
0.7
0.8
Q2 12Q1 12Q3 11Q2 11Q1 11Q4 10Q3 10Q2 10
Completed still available (sq ft)Completed space (sq ft)
Future completions
Future completions (million sq ft)
0
0.3
0.6
0.9
1.2
1.5
Q1 15Q2 14Q1 14Q4 13Q3 13Q2 13Q1 13Q4 12Q3 12Q2 12
Still available (sq ft)To complete (sq ft)
www.estatesgazette.com21 July 2012 69
the week practice & law eG liFethe market
eGi consensus rent
EGi Consensus rent takes an average of the views of six leading commentators on the market for a 20,000 sq ft grade A unit let for 15 years. Contributors: CBRE, Cushman & Wakefield, DJDeloitte, DTZ, Jones Lang LaSalle, Savills.
23 Savile Row, W1: 8,900 sq ft let to Sapinda UK at £110 per sq ft
west end
42% decline in take-up
since Q1
To download an electronic version of this report, or to access the archive of previous reports, go to www.estatesgazette.com/london-offices
take-up
% +/- % +/- % +/-Take-up (sq ft) Q2 2012 24 months 12 months 3 months
New/Refurb existing 72,373 -60 -25.19 64
Premarketing - n/a -100.00 -100
Secondhand 355,894 -52 -12.10 -31
Under Construction 29,500 n/a n/a -86
Total 457,767 -50 -22.16 -41
Take-up dipped in Q2 to just 460,000 sq ft, barely more than half the average quarterly total of 800,000 sq ft. There were no large lettings to boost the total and the total number of transactions was down too, at 77 in Q2, compared with 87 in Q1 2012. The difference in units over 10,000 sq ft was most marked; there were 17 in Q1 and only eight in Q2.
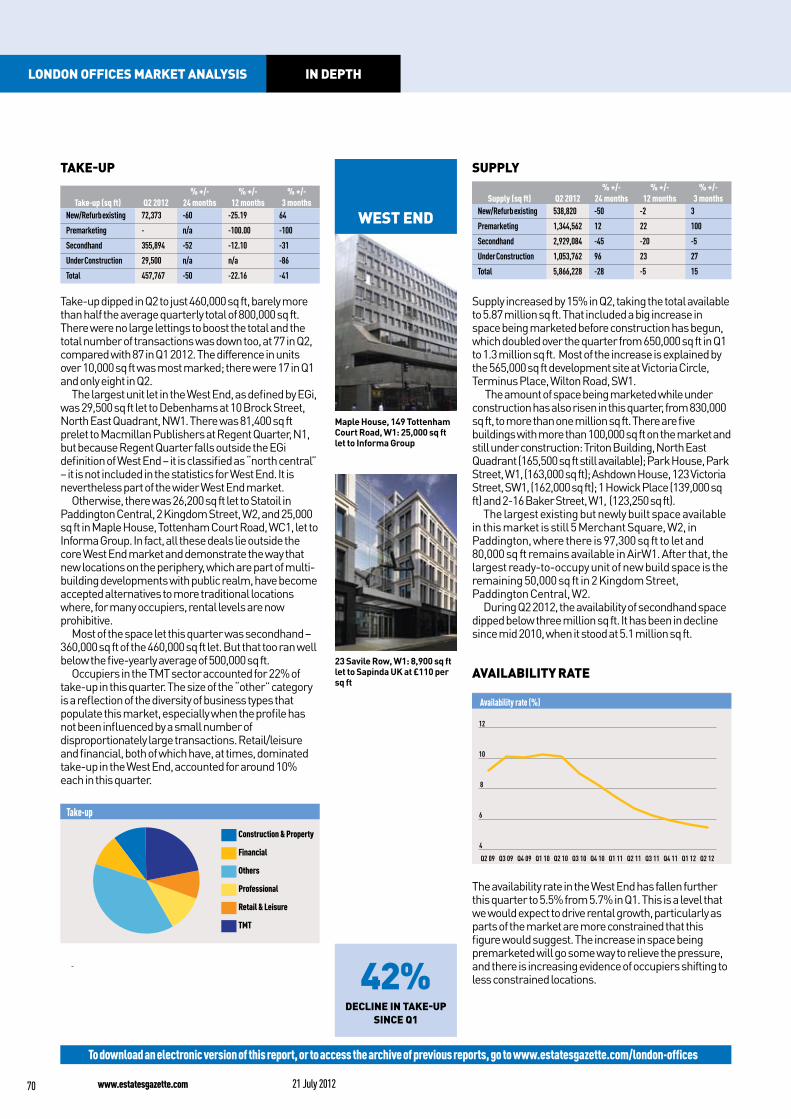
The largest unit let in the West End, as defined by EGi, was 29,500 sq ft let to Debenhams at 10 Brock Street, North East Quadrant, NW1. There was 81,400 sq ft prelet to Macmillan Publishers at Regent Quarter, N1, but because Regent Quarter falls outside the EGi definition of West End – it is classified as “north central” – it is not included in the statistics for West End. It is nevertheless part of the wider West End market.
Otherwise, there was 26,200 sq ft let to Statoil in Paddington Central, 2 Kingdom Street, W2, and 25,000 sq ft in Maple House, Tottenham Court Road, WC1, let to Informa Group. In fact, all these deals lie outside the core West End market and demonstrate the way that new locations on the periphery, which are part of multi-building developments with public realm, have become accepted alternatives to more traditional locations where, for many occupiers, rental levels are now prohibitive.
Most of the space let this quarter was secondhand – 360,000 sq ft of the 460,000 sq ft let. But that too ran well below the five-yearly average of 500,000 sq ft.
Occupiers in the TMT sector accounted for 22% of take-up in this quarter. The size of the “other” category is a reflection of the diversity of business types that populate this market, especially when the profile has not been influenced by a small number of disproportionately large transactions. Retail/leisure and financial, both of which have, at times, dominated take-up in the West End, accounted for around 10% each in this quarter.
Take-up
Construction & Property
Financial
Others
Professional
Retail & Leisure
TMT
supply% +/- % +/- % +/-
Supply (sq ft) Q2 2012 24 months 12 months 3 monthsNew/Refurb existing 538,820 -50 -2 3
Premarketing 1,344,562 12 22 100
Secondhand 2,929,084 -45 -20 -5
Under Construction 1,053,762 96 23 27
Total 5,866,228 -28 -5 15
Supply increased by 15% in Q2, taking the total available to 5.87 million sq ft. That included a big increase in space being marketed before construction has begun, which doubled over the quarter from 650,000 sq ft in Q1 to 1.3 million sq ft. Most of the increase is explained by the 565,000 sq ft development site at Victoria Circle, Terminus Place, Wilton Road, SW1.
The amount of space being marketed while under construction has also risen in this quarter, from 830,000 sq ft, to more than one million sq ft. There are five buildings with more than 100,000 sq ft on the market and still under construction: Triton Building, North East Quadrant (165,500 sq ft still available); Park House, Park Street, W1, (163,000 sq ft); Ashdown House, 123 Victoria Street, SW1, (162,000 sq ft); 1 Howick Place (139,000 sq ft) and 2-16 Baker Street, W1, (123,250 sq ft).
The largest existing but newly built space available in this market is still 5 Merchant Square, W2, in Paddington, where there is 97,300 sq ft to let and 80,000 sq ft remains available in AirW1. After that, the largest ready-to-occupy unit of new build space is the remaining 50,000 sq ft in 2 Kingdom Street, Paddington Central, W2.
During Q2 2012, the availability of secondhand space dipped below three million sq ft. It has been in decline since mid 2010, when it stood at 5.1 million sq ft.
availability rate
Availability rate (%)
4
6
8
10
12
Q2 12Q1 12Q4 11Q3 11Q2 11Q1 11Q4 10Q3 10Q2 10Q1 10Q4 09Q3 09Q2 09
The availability rate in the West End has fallen further this quarter to 5.5% from 5.7% in Q1. This is a level that we would expect to drive rental growth, particularly as parts of the market are more constrained that this figure would suggest. The increase in space being premarketed will go some way to relieve the pressure, and there is increasing evidence of occupiers shifting to less constrained locations.
70 www.estatesgazette.com 21 July 2012
in depthlondon offices market analysis
Maple House, 149 Tottenham Court Road, W1: 25,000 sq ft let to Informa Group
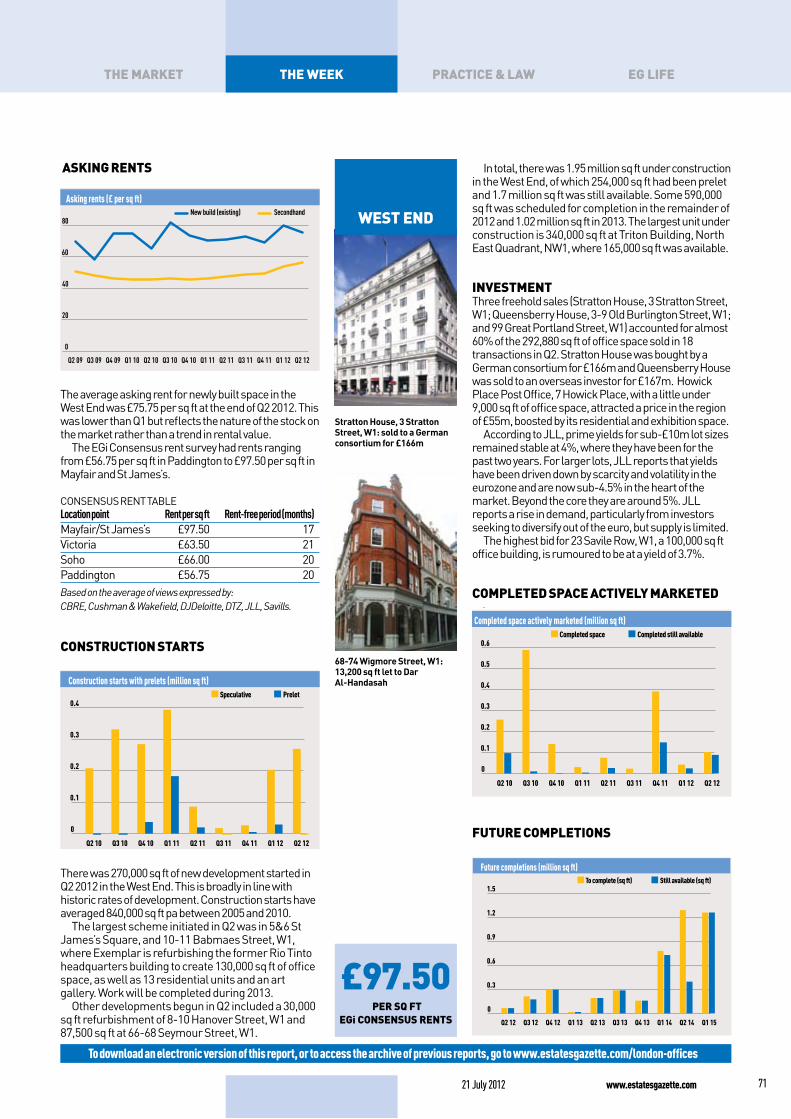
Stratton House, 3 Stratton Street, W1: sold to a German consortium for £166m
£97.50 per sQ ft
eGi consensus rents
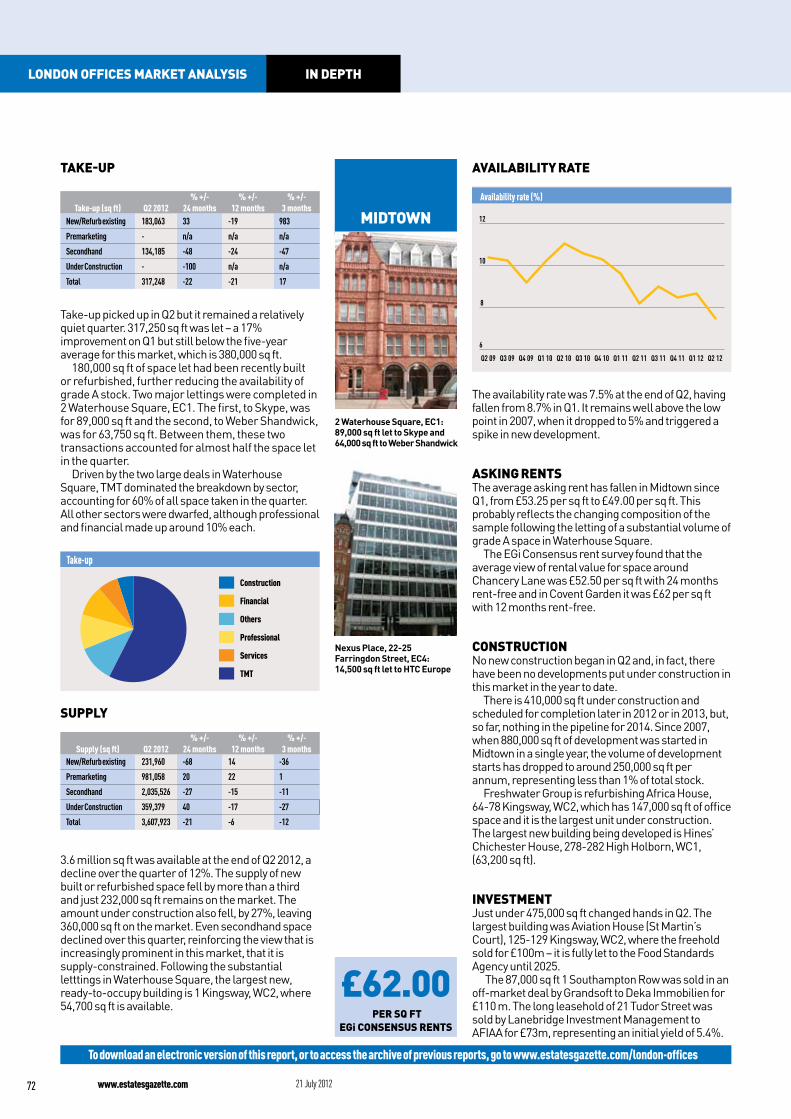
68-74 Wigmore Street, W1: 13,200 sq ft let to Dar Al-Handasah
askinG rents
Asking rents (£ per sq ft)
0
20
40
60
80
Q2 12Q1 12Q4 11Q3 11Q2 11Q1 11Q4 10Q3 10Q2 10Q1 10Q4 09Q3 09Q2 09
SecondhandNew build (existing)
The average asking rent for newly built space in the West End was £75.75 per sq ft at the end of Q2 2012. This was lower than Q1 but reflects the nature of the stock on the market rather than a trend in rental value.
The EGi Consensus rent survey had rents ranging from £56.75 per sq ft in Paddington to £97.50 per sq ft in Mayfair and St James’s.
CONSENSuS RENT TABlELocation point Rent per sq ft Rent-free period (months)Mayfair/St James’s £97.50 17Victoria £63.50 21Soho £66.00 20Paddington £56.75 20Based on the average of views expressed by: CBRE, Cushman & Wakefield, DJDeloitte, DTZ, JLL, Savills.
construction starts
Construction starts with prelets (million sq ft)
0
0.1
0.2
0.3
0.4
Q2 12Q1 12Q4 11Q3 11Q2 11Q1 11Q4 10Q3 10Q2 10
Prelet Speculative
There was 270,000 sq ft of new development started in Q2 2012 in the West End. This is broadly in line with historic rates of development. Construction starts have averaged 840,000 sq ft pa between 2005 and 2010.
The largest scheme initiated in Q2 was in 5&6 St James’s Square, and 10-11 Babmaes Street, W1, where Exemplar is refurbishing the former Rio Tinto headquarters building to create 130,000 sq ft of office space, as well as 13 residential units and an art gallery. Work will be completed during 2013.
Other developments begun in Q2 included a 30,000 sq ft refurbishment of 8-10 Hanover Street, W1 and 87,500 sq ft at 66-68 Seymour Street, W1.
In total, there was 1.95 million sq ft under construction in the West End, of which 254,000 sq ft had been prelet and 1.7 million sq ft was still available. Some 590,000 sq ft was scheduled for completion in the remainder of 2012 and 1.02 million sq ft in 2013. The largest unit under construction is 340,000 sq ft at Triton Building, North East Quadrant, NW1, where 165,000 sq ft was available.
investment Three freehold sales (Stratton House, 3 Stratton Street, W1; Queensberry House, 3-9 Old Burlington Street, W1; and 99 Great Portland Street, W1) accounted for almost 60% of the 292,880 sq ft of office space sold in 18 transactions in Q2. Stratton House was bought by a German consortium for £166m and Queensberry House was sold to an overseas investor for £167m. Howick Place Post Office, 7 Howick Place, with a little under 9,000 sq ft of office space, attracted a price in the region of £55m, boosted by its residential and exhibition space.
According to Jll, prime yields for sub-£10m lot sizes remained stable at 4%, where they have been for the past two years. For larger lots, Jll reports that yields have been driven down by scarcity and volatility in the eurozone and are now sub-4.5% in the heart of the market. Beyond the core they are around 5%. Jll reports a rise in demand, particularly from investors seeking to diversify out of the euro, but supply is limited.
The highest bid for 23 Savile Row, W1, a 100,000 sq ft office building, is rumoured to be at a yield of 3.7%.
completed space actively marketed
Completed space actively marketed (million sq ft)
0
0.1
0.2
0.3
0.4
0.5
0.6
Q2 12Q1 12Q4 11Q3 11Q2 11Q1 11Q4 10Q3 10Q2 10
Completed still availableCompleted space
www.estatesgazette.com21 July 2012 71
the week practice & law eG lifethe market
To download an electronic version of this report, or to access the archive of previous reports, go to www.estatesgazette.com/london-offices
future completions
Future completions (million sq ft)
0
0.3
0.6
0.9
1.2
1.5
Q1 15Q2 14Q1 14Q4 13Q3 13Q2 13Q1 13Q4 12Q3 12Q2 12
Still available (sq ft)To complete (sq ft)
west end
2 Waterhouse Square, EC1: 89,000 sq ft let to Skype and 64,000 sq ft to Weber Shandwick
Nexus Place, 22-25 Farringdon Street, EC4: 14,500 sq ft let to HTC Europe
midtown
£62.00 per sq ft
eGi consensus rents
To download an electronic version of this report, or to access the archive of previous reports, go to www.estatesgazette.com/london-offices
take-up
% +/- % +/- % +/-Take-up (sq ft) Q2 2012 24 months 12 months 3 months
New/Refurb existing 183,063 33 -19 983
Premarketing - n/a n/a n/a
Secondhand 134,185 -48 -24 -47
Under Construction - -100 n/a n/a
Total 317,248 -22 -21 17
Take-up picked up in Q2 but it remained a relatively quiet quarter. 317,250 sq ft was let – a 17% improvement on Q1 but still below the five-year average for this market, which is 380,000 sq ft.
180,000 sq ft of space let had been recently built or refurbished, further reducing the availability of grade A stock. Two major lettings were completed in 2 Waterhouse Square, EC1. The first, to Skype, was for 89,000 sq ft and the second, to Weber Shandwick, was for 63,750 sq ft. Between them, these two transactions accounted for almost half the space let in the quarter.
Driven by the two large deals in Waterhouse Square, TMT dominated the breakdown by sector, accounting for 60% of all space taken in the quarter. All other sectors were dwarfed, although professional and financial made up around 10% each.
Take-up
Construction
Financial
Others
Professional
Services
TMT
supply
% +/- % +/- % +/-Supply (sq ft) Q2 2012 24 months 12 months 3 months
New/Refurb existing 231,960 -68 14 -36
Premarketing 981,058 20 22 1
Secondhand 2,035,526 -27 -15 -11
Under Construction 359,379 40 -17 -27
Total 3,607,923 -21 -6 -12
3.6 million sq ft was available at the end of Q2 2012, a decline over the quarter of 12%. The supply of new built or refurbished space fell by more than a third and just 232,000 sq ft remains on the market. The amount under construction also fell, by 27%, leaving 360,000 sq ft on the market. Even secondhand space declined over this quarter, reinforcing the view that is increasingly prominent in this market, that it is supply-constrained. Following the substantial letttings in Waterhouse Square, the largest new, ready-to-occupy building is 1 Kingsway, WC2, where 54,700 sq ft is available.
availability rate
Availability rate (%)
6
8
10
12
Q2 12Q1 12Q4 11Q3 11Q2 11Q1 11Q4 10Q3 10Q2 10Q1 10Q4 09Q3 09Q2 09
The availability rate was 7.5% at the end of Q2, having fallen from 8.7% in Q1. It remains well above the low point in 2007, when it dropped to 5% and triggered a spike in new development.
askinG rentsThe average asking rent has fallen in Midtown since Q1, from £53.25 per sq ft to £49.00 per sq ft. This probably reflects the changing composition of the sample following the letting of a substantial volume of grade A space in Waterhouse Square.
The EGi Consensus rent survey found that the average view of rental value for space around Chancery Lane was £52.50 per sq ft with 24 months rent-free and in Covent Garden it was £62 per sq ft with 12 months rent-free.
constructionNo new construction began in Q2 and, in fact, there have been no developments put under construction in this market in the year to date.
There is 410,000 sq ft under construction and scheduled for completion later in 2012 or in 2013, but, so far, nothing in the pipeline for 2014. Since 2007, when 880,000 sq ft of development was started in Midtown in a single year, the volume of development starts has dropped to around 250,000 sq ft per annum, representing less than 1% of total stock.
Freshwater Group is refurbishing Africa House, 64-78 Kingsway, WC2, which has 147,000 sq ft of office space and it is the largest unit under construction. The largest new building being developed is Hines’ Chichester House, 278-282 High Holborn, WC1, (63,200 sq ft).
investmentJust under 475,000 sq ft changed hands in Q2. The largest building was Aviation House (St Martin’s Court), 125-129 Kingsway, WC2, where the freehold sold for £100m – it is fully let to the Food Standards Agency until 2025.
The 87,000 sq ft 1 Southampton Row was sold in an off-market deal by Grandsoft to Deka Immobilien for £110 m. The long leasehold of 21 Tudor Street was sold by Lanebridge Investment Management to AFIAA for £73m, representing an initial yield of 5.4%.
72 www.estatesgazette.com 21 July 2012
in depthlondon offices market analysis
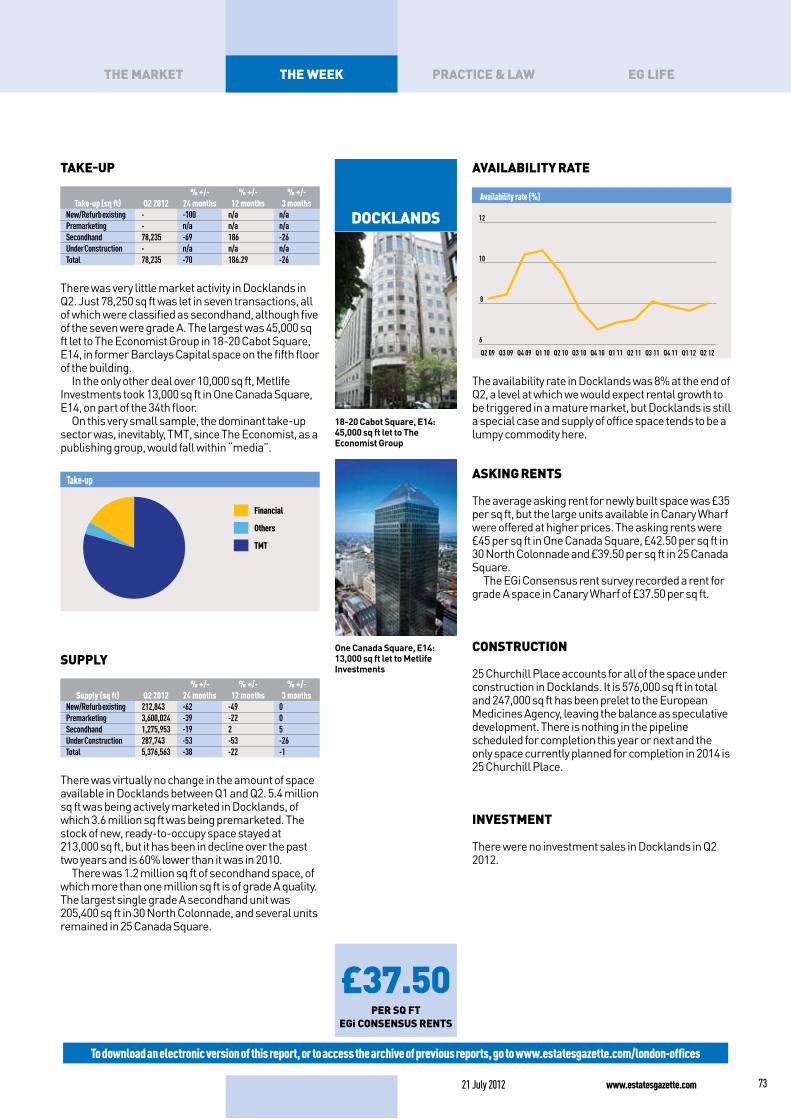
18-20 Cabot Square, E14: 45,000 sq ft let to The Economist Group
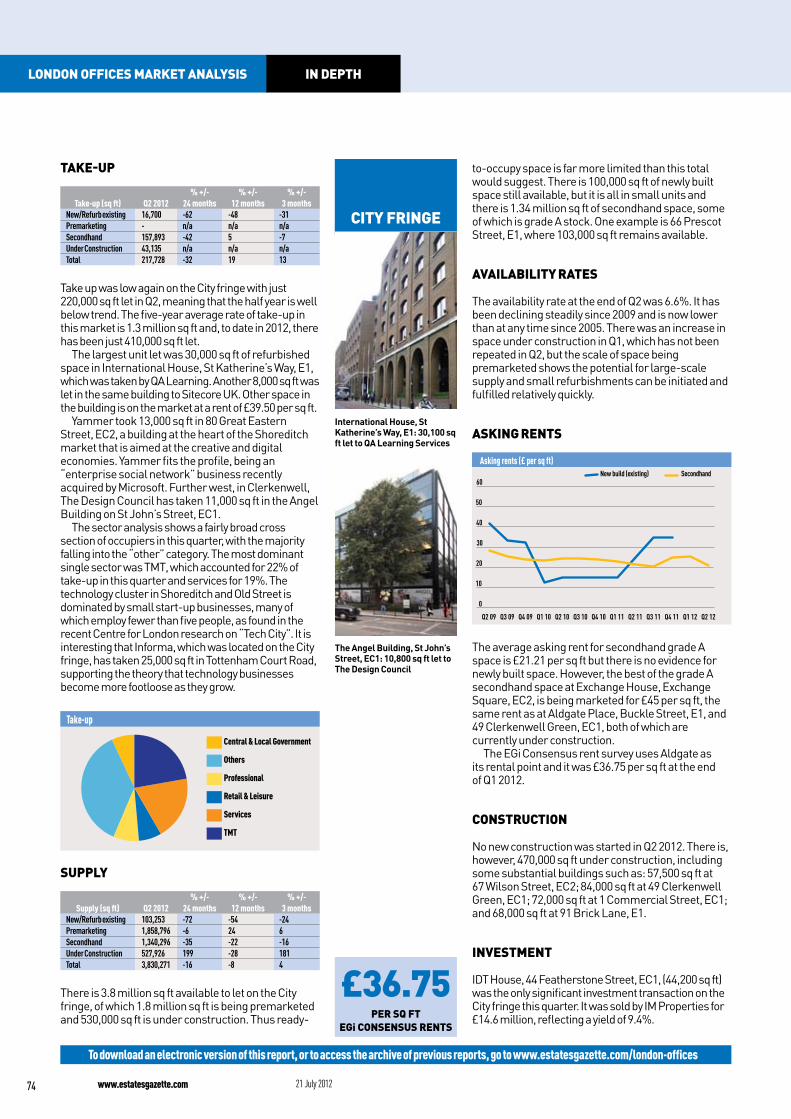
One Canada Square, E14: 13,000 sq ft let to Metlife Investments
docklands
£37.50 per sq ft
eGi consensus rents
take-up
% +/- % +/- % +/-Take-up (sq ft) Q2 2012 24 months 12 months 3 months
New/Refurb existing - -100 n/a n/aPremarketing - n/a n/a n/aSecondhand 78,235 -69 186 -26Under Construction - n/a n/a n/aTotal 78,235 -70 186.29 -26
There was very little market activity in Docklands in Q2. Just 78,250 sq ft was let in seven transactions, all of which were classified as secondhand, although five of the seven were grade A. The largest was 45,000 sq ft let to The Economist Group in 18-20 Cabot Square, E14, in former Barclays Capital space on the fifth floor of the building.
In the only other deal over 10,000 sq ft, Metlife Investments took 13,000 sq ft in One Canada Square, E14, on part of the 34th floor.
On this very small sample, the dominant take-up sector was, inevitably, TMT, since The Economist, as a publishing group, would fall within “media”.
Take-up
Financial
Others
TMT
supply
% +/- % +/- % +/-Supply (sq ft) Q2 2012 24 months 12 months 3 months
New/Refurb existing 212,843 -62 -49 0Premarketing 3,600,024 -39 -22 0Secondhand 1,275,953 -19 2 5Under Construction 287,743 -53 -53 -26Total 5,376,563 -38 -22 -1
There was virtually no change in the amount of space available in Docklands between Q1 and Q2. 5.4 million sq ft was being actively marketed in Docklands, of which 3.6 million sq ft was being premarketed. The stock of new, ready-to-occupy space stayed at 213,000 sq ft, but it has been in decline over the past two years and is 60% lower than it was in 2010.
There was 1.2 million sq ft of secondhand space, of which more than one million sq ft is of grade A quality. The largest single grade A secondhand unit was 205,400 sq ft in 30 North Colonnade, and several units remained in 25 Canada Square.
availability rate
Availability rate (%)
6
8
10
12
Q2 12Q1 12Q4 11Q3 11Q2 11Q1 11Q4 10Q3 10Q2 10Q1 10Q4 09Q3 09Q2 09
The availability rate in Docklands was 8% at the end of Q2, a level at which we would expect rental growth to be triggered in a mature market, but Docklands is still a special case and supply of office space tends to be a lumpy commodity here.
askinG rents
The average asking rent for newly built space was £35 per sq ft, but the large units available in Canary Wharf were offered at higher prices. The asking rents were £45 per sq ft in One Canada Square, £42.50 per sq ft in 30 North Colonnade and £39.50 per sq ft in 25 Canada Square.
The EGi Consensus rent survey recorded a rent for grade A space in Canary Wharf of £37.50 per sq ft.
construction
25 Churchill Place accounts for all of the space under construction in Docklands. It is 576,000 sq ft in total and 247,000 sq ft has been prelet to the European Medicines Agency, leaving the balance as speculative development. There is nothing in the pipeline scheduled for completion this year or next and the only space currently planned for completion in 2014 is 25 Churchill Place.
investment
There were no investment sales in Docklands in Q2 2012.
To download an electronic version of this report, or to access the archive of previous reports, go to www.estatesgazette.com/london-offices
www.estatesgazette.com21 July 2012 73
the week practice & law eG lifethe market
International House, St Katherine’s Way, E1: 30,100 sq ft let to QA Learning Services
The Angel Building, St John’s Street, EC1: 10,800 sq ft let to The Design Council
City fringe
£36.75 per sq ft
egi Consensus rents
To download an electronic version of this report, or to access the archive of previous reports, go to www.estatesgazette.com/london-offices
take-up
% +/- % +/- % +/-Take-up (sq ft) Q2 2012 24 months 12 months 3 months
New/Refurb existing 16,700 -62 -48 -31Premarketing - n/a n/a n/aSecondhand 157,893 -42 5 -7Under Construction 43,135 n/a n/a n/aTotal 217,728 -32 19 13
Take up was low again on the City fringe with just 220,000 sq ft let in Q2, meaning that the half year is well below trend. The five-year average rate of take-up in this market is 1.3 million sq ft and, to date in 2012, there has been just 410,000 sq ft let.
The largest unit let was 30,000 sq ft of refurbished space in International House, St Katherine’s Way, E1, which was taken by QA Learning. Another 8,000 sq ft was let in the same building to Sitecore UK. Other space in the building is on the market at a rent of £39.50 per sq ft.
Yammer took 13,000 sq ft in 80 Great Eastern Street, EC2, a building at the heart of the Shoreditch market that is aimed at the creative and digital economies. Yammer fits the profile, being an “enterprise social network” business recently acquired by Microsoft. Further west, in Clerkenwell, The Design Council has taken 11,000 sq ft in the Angel Building on St John’s Street, EC1.
The sector analysis shows a fairly broad cross section of occupiers in this quarter, with the majority falling into the “other” category. The most dominant single sector was TMT, which accounted for 22% of take-up in this quarter and services for 19%. The technology cluster in Shoreditch and Old Street is dominated by small start-up businesses, many of which employ fewer than five people, as found in the recent Centre for London research on “Tech City”. It is interesting that Informa, which was located on the City fringe, has taken 25,000 sq ft in Tottenham Court Road, supporting the theory that technology businesses become more footloose as they grow.
Take-up
Central & Local Government
Others
Professional
Retail & Leisure
Services
TMT
supply
% +/- % +/- % +/-Supply (sq ft) Q2 2012 24 months 12 months 3 months
New/Refurb existing 103,253 -72 -54 -24Premarketing 1,858,796 -6 24 6Secondhand 1,340,296 -35 -22 -16Under Construction 527,926 199 -28 181Total 3,830,271 -16 -8 4
There is 3.8 million sq ft available to let on the City fringe, of which 1.8 million sq ft is being premarketed and 530,000 sq ft is under construction. Thus ready-
to-occupy space is far more limited than this total would suggest. There is 100,000 sq ft of newly built space still available, but it is all in small units and there is 1.34 million sq ft of secondhand space, some of which is grade A stock. One example is 66 Prescot Street, E1, where 103,000 sq ft remains available.
availability rates
The availability rate at the end of Q2 was 6.6%. It has been declining steadily since 2009 and is now lower than at any time since 2005. There was an increase in space under construction in Q1, which has not been repeated in Q2, but the scale of space being premarketed shows the potential for large-scale supply and small refurbishments can be initiated and fulfilled relatively quickly.
asking rents
Asking rents (£ per sq ft)
0
10
20
30
40
50
60
Q2 12Q1 12Q4 11Q3 11Q2 11Q1 11Q4 10Q3 10Q2 10Q1 10Q4 09Q3 09Q2 09
SecondhandNew build (existing)
The average asking rent for secondhand grade A space is £21.21 per sq ft but there is no evidence for newly built space. However, the best of the grade A secondhand space at Exchange House, Exchange Square, EC2, is being marketed for £45 per sq ft, the same rent as at Aldgate Place, Buckle Street, E1, and 49 Clerkenwell Green, EC1, both of which are currently under construction.
The EGi Consensus rent survey uses Aldgate as its rental point and it was £36.75 per sq ft at the end of Q1 2012.
ConstruCtion
No new construction was started in Q2 2012. There is, however, 470,000 sq ft under construction, including some substantial buildings such as: 57,500 sq ft at 67 Wilson Street, EC2; 84,000 sq ft at 49 Clerkenwell Green, EC1; 72,000 sq ft at 1 Commercial Street, EC1; and 68,000 sq ft at 91 Brick Lane, E1.
investment
IDT House, 44 Featherstone Street, EC1, (44,200 sq ft) was the only significant investment transaction on the City fringe this quarter. It was sold by IM Properties for £14.6 million, reflecting a yield of 9.4%.
74 www.estatesgazette.com 21 July 2012
in depthlondon offiCes market analysis
South Bank
£45.00per Sq ft
eGi ConSenSuS rent
take-up
% +/- % +/- % +/-Take-up (sq ft) Q2 2012 24 months 12 months 3 months
New/Refurb existing - -100 -100 -100Premarketing - n/a n/a n/aSecondhand 62,450 80 10 -5Under Construction - n/a n/a n/aTotal 62,450 62 -11 -27
There was just 62,500 sq ft let on the South Bank in Q2 2012, taking the total for the year to date to 150,000 sq ft – well down on the five-year annual average of 630,000 sq ft per annum and similar to the level recorded in 2009. But this is a relatively immature office market which effectively operates on two levels - much of the stock is small-scale and grade B or refurbished historic buildings, but the statistics can be transformed by transactions in the zone of large grade A buildings fronting the river.
In this quarter, just 11,000 sq ft of the 62,500 sq ft let was classified as grade A and the balance was grade B. The largest transaction was the freehold sale of the 13,300 sq ft Francis House, 9 King’s Head Yard, SE1, which was sold to Trustees of Guys & St Thomas’s Charitable Foundation for their own occupation and has potential for extension. REC International took 10,100 sq ft in Dorset House, Stamford Street, SE1,
It is rumoured that Sellar Properties is close to agreeing a deal with Al-Jazeera for 30,000 sq ft in The Shard, SE1.
Take-up
Construction
Financial
Others
Professional
Property
TMT
Supply
% +/- % +/- % +/-Supply (sq ft) Q2 2012 24 months 12 months 3 months
New/Refurb existing 13,350 -83 -70 -11Premarketing 412,893 -52 -13 0Secondhand 562,741 -45 -48 -2Under Construction 1,332,243 289 30 21Total 2,321,227 1 -12 10
There was 2.3 million sq ft available at the end of Q2 2012 on the South Bank, but most of it was not available to occupy. 1.3 million sq ft was under construction and 413,000 sq ft was being premarketed at King’s Reach Tower on Stamford Street, SE1.
560,00 sq ft is secondhand space, including 165,000 sq ft at 1 London Bridge and The Cotton Centre at London Bridge City, which was offered in several separate units.
Dorset House, 27-45 Stamford Street, EC1: 10,100 sq ft let to REC International
Francis House, 9 King’s Head Yard, SE1: 13,300 sq ft let to Trustees of Guys & St Thomas’s Charitable Foundation
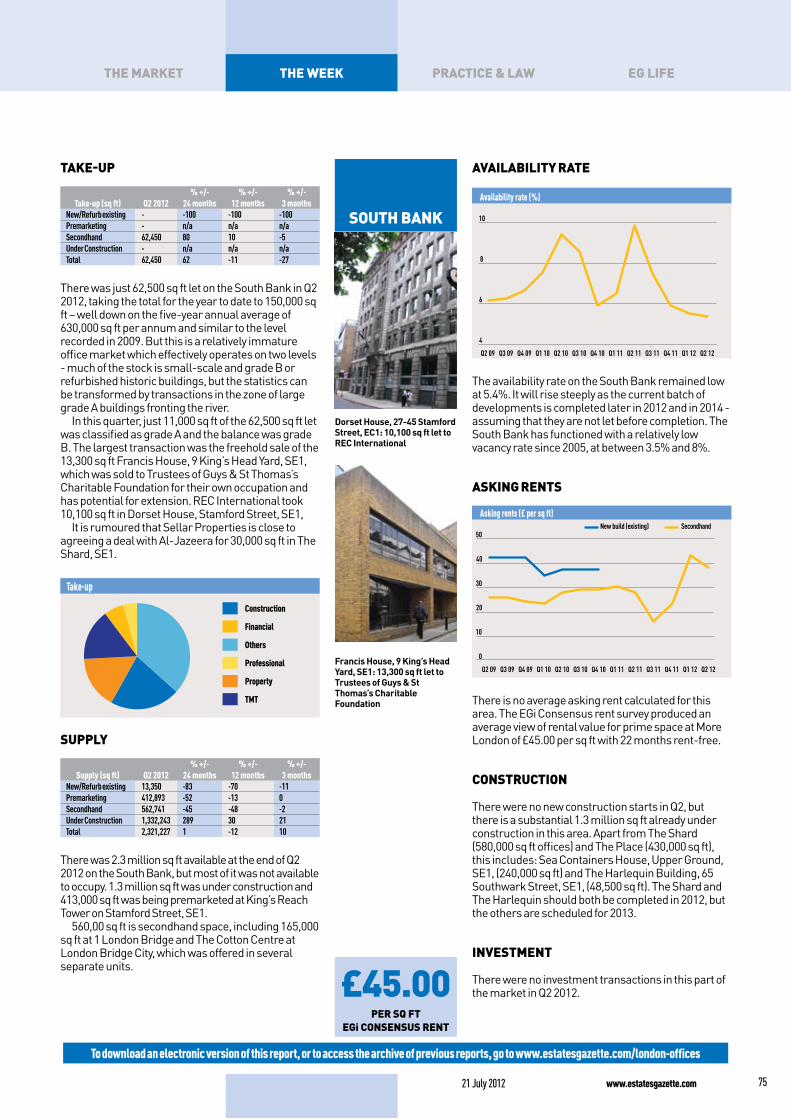
availaBility rate
Availability rate (%)
4
6
8
10
Q2 12Q1 12Q4 11Q3 11Q2 11Q1 11Q4 10Q3 10Q2 10Q1 10Q4 09Q3 09Q2 09
The availability rate on the South Bank remained low at 5.4%. It will rise steeply as the current batch of developments is completed later in 2012 and in 2014 - assuming that they are not let before completion. The South Bank has functioned with a relatively low vacancy rate since 2005, at between 3.5% and 8%.
aSkinG rentS
Asking rents (£ per sq ft)
0
10
20
30
40
50
Q2 12Q1 12Q4 11Q3 11Q2 11Q1 11Q4 10Q3 10Q2 10Q1 10Q4 09Q3 09Q2 09
SecondhandNew build (existing)
There is no average asking rent calculated for this area. The EGi Consensus rent survey produced an average view of rental value for prime space at More London of £45.00 per sq ft with 22 months rent-free.
ConStruCtion
There were no new construction starts in Q2, but there is a substantial 1.3 million sq ft already under construction in this area. Apart from The Shard (580,000 sq ft offices) and The Place (430,000 sq ft), this includes: Sea Containers House, Upper Ground, SE1, (240,000 sq ft) and The Harlequin Building, 65 Southwark Street, SE1, (48,500 sq ft). The Shard and The Harlequin should both be completed in 2012, but the others are scheduled for 2013.
inveStment
There were no investment transactions in this part of the market in Q2 2012.
To download an electronic version of this report, or to access the archive of previous reports, go to www.estatesgazette.com/london-offices
www.estatesgazette.com21 July 2012 75
the week praCtiCe & law eG lifethe market