Embed Size (px)
Citation preview
AN ANALYTICAL METHOD TO IDENTIFY REINFORCED CONCRETE WALLS PRONE TO OUT-OF-PLANE SHEAR-AXIAL FAILURE
A. NIROOMANDI1, S. PAMPANIN2, R.P. DHAKAL3, M. SOLEYMANI ASHTIANI4
1 Structural Engineer, WSP-Opus. 2 Professor, Department of Structural and Geotechnical Engineering, University of Roma ”La Sapienza”; Adjunct Professor, Department of Civil and Natural Resources Engineering, University of Canterbury. 3 Professor, Department of Civil and Natural Resources Engineering, University of Canterbury. 4 PhD, Supervisor from Industry, Department of Civil and Natural Resources Engineering, University of Canterbury. SUMMARY: One of the failure modes that got the attention of researchers in the 2011 February Christchurch earthquake was the collapse of a key supporting structural wall of Grand Chancellor Hotel in Christchurch which failed in a brittle manner. However, until now this failure mode has been a bit of a mystery for the researchers in the field of structural engineering. Moreover, there is no method to identify, assess and design the walls prone to such failure mode. Following the recent break through regarding the mechanism of this failure mode (out-of-plane shear-axial failure) based on experimental observations, a numerical model that can capture this failure mode was developed using the finite element (FE) software DIANA. A comprehensive numerical parametric study was conducted to identify the key parameters contributing to the development of out-of-plane shear-axial failure in reinforced concrete (RC) walls. Based on the earthquake observations, experimental and numerical studies conducted by the authors of this paper, an analytical method to identify walls prone to out-of-plane shear-axial failure is proposed. The method is developed based on the key parameters affecting the seismic performance of RC walls prone to out-of-plane shear-axial failure. The proposed method can be used as a first level check for both design and assessment purposes.
1. INTRODUCTION
The performance of RC structural wall buildings in earthquakes has generally been robust, and complete collapse under even extreme seismic excitation is rare (Priestley et al. 2007). However, following the two earthquakes in 2010 and 2011 in Chile and New Zealand, respectively, some peculiar failure modes were observed in RC structural walls that researchers did not expect (Dunning Thornton 2011, Kam et al. 2011, Elwood et al. 2012, Elwood 2013, NIST 2014). One of these failure modes was the collapse of Wall D5-6 from Grand Chancellor Hotel in the 2011 February earthquake in Christchurch, New Zealand (Figure 1). Different explanations were suggested by researchers for the failure mode observed in this wall including a lateral instability failure, a pure product of axial load and a failure derived from bi-directional loading. Kam et al. (2011) and Niroomandi et al. (2018b) showed that the earthquake loading pattern of the February 2011 earthquake (with 6.2 Magnitude) was a skewed loading with a strong directionality towards the out-of-plane of Wall D5-6 suggesting a strong involvement of bi-directional loading in the failure of the wall (Figure 2). The fact that
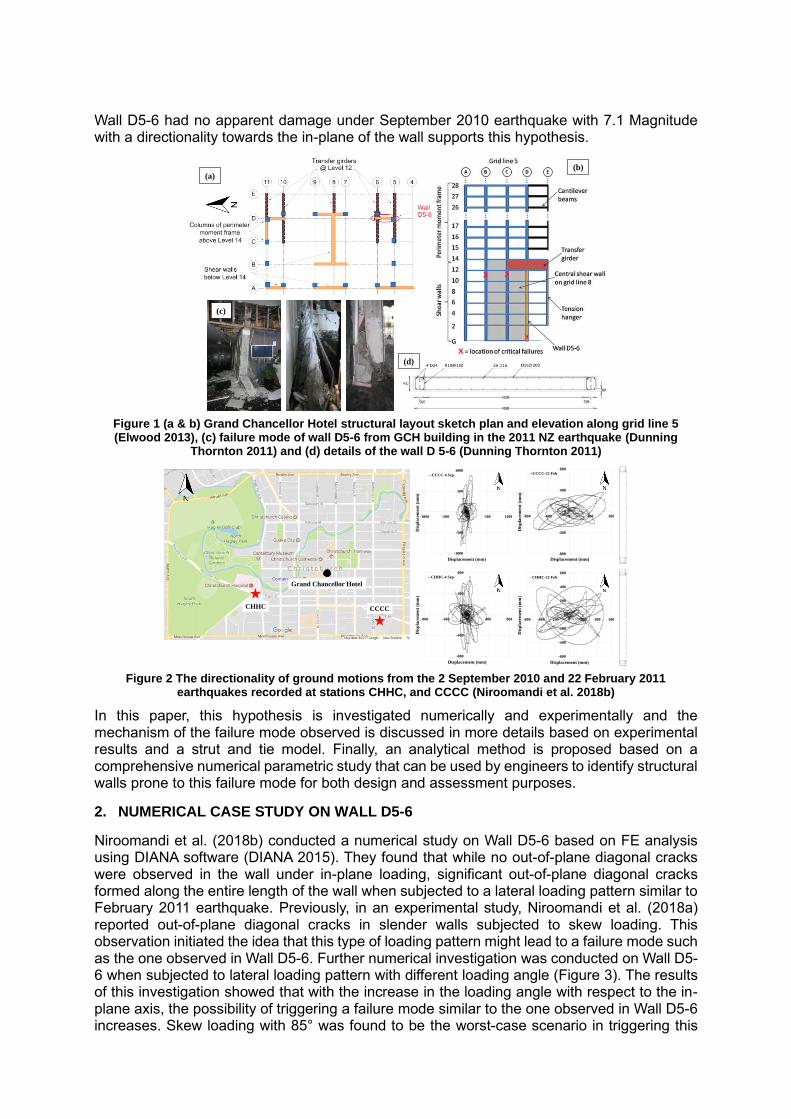
Wall D5-6 had no apparent damage under September 2010 earthquake with 7.1 Magnitude with a directionality towards the in-plane of the wall supports this hypothesis.
Figure 1 (a & b) Grand Chancellor Hotel structural layout sketch plan and elevation along grid line 5 (Elwood 2013), (c) failure mode of wall D5-6 from GCH building in the 2011 NZ earthquake (Dunning
Thornton 2011) and (d) details of the wall D 5-6 (Dunning Thornton 2011)
Figure 2 The directionality of ground motions from the 2 September 2010 and 22 February 2011
earthquakes recorded at stations CHHC, and CCCC (Niroomandi et al. 2018b)
In this paper, this hypothesis is investigated numerically and experimentally and the mechanism of the failure mode observed is discussed in more details based on experimental results and a strut and tie model. Finally, an analytical method is proposed based on a comprehensive numerical parametric study that can be used by engineers to identify structural walls prone to this failure mode for both design and assessment purposes.
2. NUMERICAL CASE STUDY ON WALL D5-6
Niroomandi et al. (2018b) conducted a numerical study on Wall D5-6 based on FE analysis using DIANA software (DIANA 2015). They found that while no out-of-plane diagonal cracks were observed in the wall under in-plane loading, significant out-of-plane diagonal cracks formed along the entire length of the wall when subjected to a lateral loading pattern similar to February 2011 earthquake. Previously, in an experimental study, Niroomandi et al. (2018a) reported out-of-plane diagonal cracks in slender walls subjected to skew loading. This observation initiated the idea that this type of loading pattern might lead to a failure mode such as the one observed in Wall D5-6. Further numerical investigation was conducted on Wall D5-6 when subjected to lateral loading pattern with different loading angle (Figure 3). The results of this investigation showed that with the increase in the loading angle with respect to the in-plane axis, the possibility of triggering a failure mode similar to the one observed in Wall D5-6 increases. Skew loading with 85° was found to be the worst-case scenario in triggering this
(c)
(a)(b)
(d)
-800
-400
0
400
800
-800 -400 0 400 800
Dis
pla
cem
ent
(mm
)
Displacement (mm)
CHHC-4 Sep
-600
-400
-200
0
200
400
600
-600 -400 -200 0 200 400 600
Dis
pla
cem
ent
(mm
)
Displacement (mm)
CHHC-22 Feb
-1000
-500
0
500
1000
-1000 -500 0 500 1000
Dis
pla
cem
ent
(mm
)
Displacement (mm)
CCCC-4 Sep
-800
-400
0
400
800
-800 -400 0 400 800D
isp
lace
men
t (m
m)
Displacement (mm)
CCCC-22 Feb
CCCCCHHC
Grand Chancellor Hotel
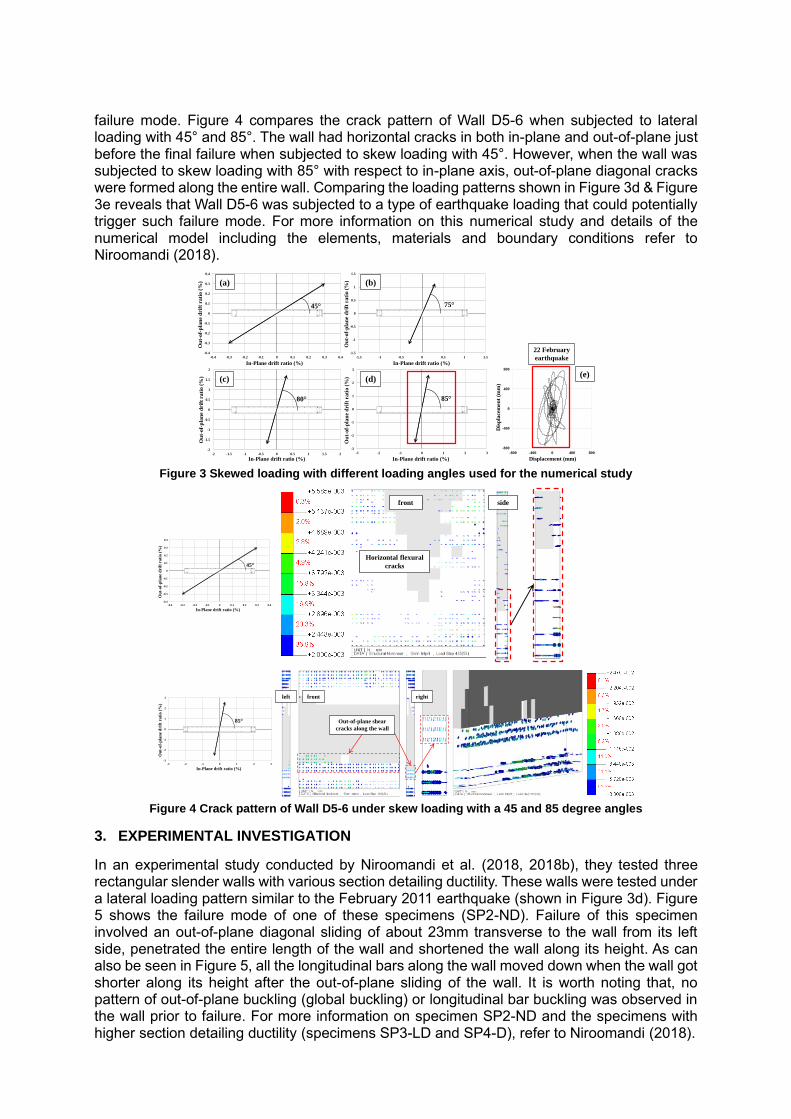
failure mode. Figure 4 compares the crack pattern of Wall D5-6 when subjected to lateral loading with 45° and 85°. The wall had horizontal cracks in both in-plane and out-of-plane just before the final failure when subjected to skew loading with 45°. However, when the wall was subjected to skew loading with 85° with respect to in-plane axis, out-of-plane diagonal cracks were formed along the entire wall. Comparing the loading patterns shown in Figure 3d & Figure 3e reveals that Wall D5-6 was subjected to a type of earthquake loading that could potentially trigger such failure mode. For more information on this numerical study and details of the numerical model including the elements, materials and boundary conditions refer to Niroomandi (2018).
Figure 3 Skewed loading with different loading angles used for the numerical study
Figure 4 Crack pattern of Wall D5-6 under skew loading with a 45 and 85 degree angles
3. EXPERIMENTAL INVESTIGATION
In an experimental study conducted by Niroomandi et al. (2018, 2018b), they tested three rectangular slender walls with various section detailing ductility. These walls were tested under a lateral loading pattern similar to the February 2011 earthquake (shown in Figure 3d). Figure 5 shows the failure mode of one of these specimens (SP2-ND). Failure of this specimen involved an out-of-plane diagonal sliding of about 23mm transverse to the wall from its left side, penetrated the entire length of the wall and shortened the wall along its height. As can also be seen in Figure 5, all the longitudinal bars along the wall moved down when the wall got shorter along its height after the out-of-plane sliding of the wall. It is worth noting that, no pattern of out-of-plane buckling (global buckling) or longitudinal bar buckling was observed in the wall prior to failure. For more information on specimen SP2-ND and the specimens with higher section detailing ductility (specimens SP3-LD and SP4-D), refer to Niroomandi (2018).
-2
-1.5
-1
-0.5
0
0.5
1
1.5
2
-2 -1.5 -1 -0.5 0 0.5 1 1.5 2
Ou
t-o
f-p
lan
e d
rift
ra
tio
(%
)
In-Plane drift ratio (%)
80
-1.5
-1
-0.5
0
0.5
1
1.5
-1.5 -1 -0.5 0 0.5 1 1.5
Ou
t -o
f-p
lan
e d
rift
ra
tio
(%
)
In-Plane drift ratio (%)
75
-3
-2
-1
0
1
2
3
-3 -2 -1 0 1 2 3
Ou
t-o
f-p
lan
e d
rift
ra
tio
(%
)
In-Plane drift ratio (%)
85
-0.4
-0.3
-0.2
-0.1
0
0.1
0.2
0.3
0.4
-0.4 -0.3 -0.2 -0.1 0 0.1 0.2 0.3 0.4
Ou
t-o
f-p
lan
e d
rift
ra
tio
(%
)
In-Plane drift ratio (%)
45
(a) (b)
(c) (d)
-800
-400
0
400
800
-800 -400 0 400 800
Dis
pla
cem
ent
(mm
)
Displacement (mm)
22 February
earthquake
(e)
front side
Horizontal flexural
cracks
frontleft right
Out-of-plane shear
cracks along the wall
-0.4
-0.3
-0.2
-0.1
0
0.1
0.2
0.3
0.4
-0.4 -0.3 -0.2 -0.1 0 0.1 0.2 0.3 0.4
Ou
t-o
f-p
lan
e d
rift
ra
tio
(%
)
In-Plane drift ratio (%)
45
-3
-2
-1
0
1
2
3
-3 -2 -1 0 1 2 3
Ou
t-o
f-p
lan
e d
rift
rati
o (
%)
In-Plane drift ratio (%)
85
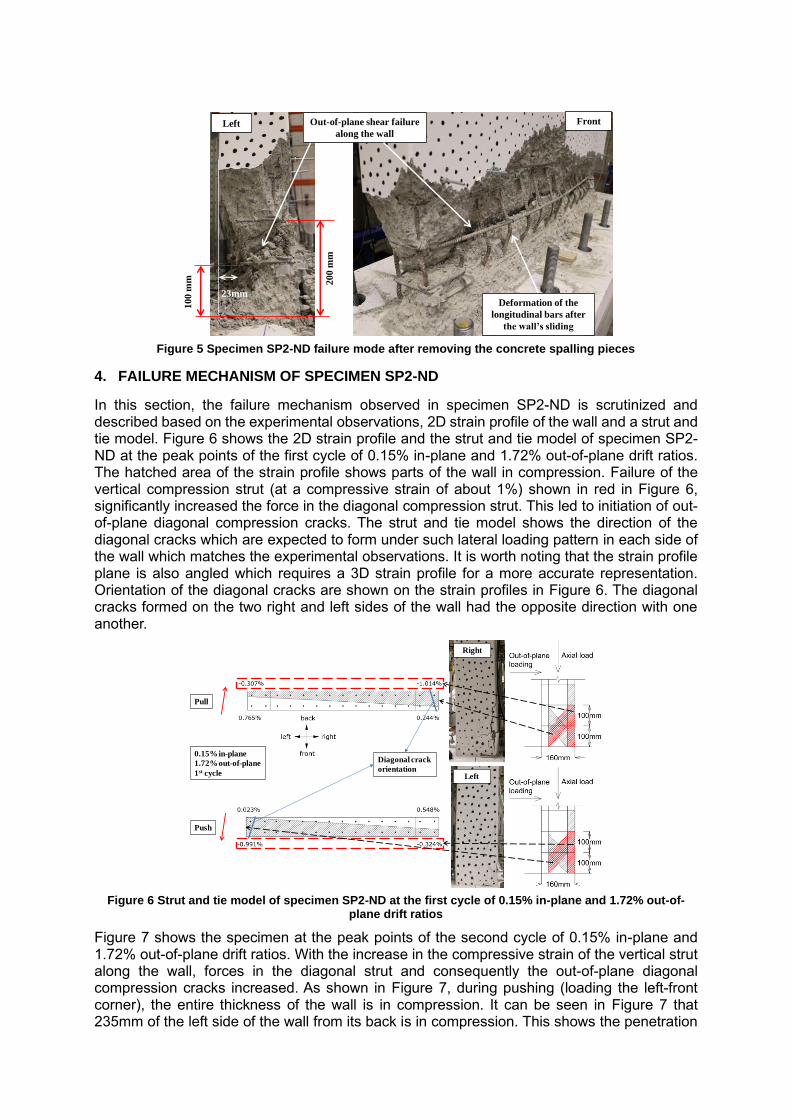
Figure 5 Specimen SP2-ND failure mode after removing the concrete spalling pieces
4. FAILURE MECHANISM OF SPECIMEN SP2-ND
In this section, the failure mechanism observed in specimen SP2-ND is scrutinized and described based on the experimental observations, 2D strain profile of the wall and a strut and tie model. Figure 6 shows the 2D strain profile and the strut and tie model of specimen SP2-ND at the peak points of the first cycle of 0.15% in-plane and 1.72% out-of-plane drift ratios. The hatched area of the strain profile shows parts of the wall in compression. Failure of the vertical compression strut (at a compressive strain of about 1%) shown in red in Figure 6, significantly increased the force in the diagonal compression strut. This led to initiation of out-of-plane diagonal compression cracks. The strut and tie model shows the direction of the diagonal cracks which are expected to form under such lateral loading pattern in each side of the wall which matches the experimental observations. It is worth noting that the strain profile plane is also angled which requires a 3D strain profile for a more accurate representation. Orientation of the diagonal cracks are shown on the strain profiles in Figure 6. The diagonal cracks formed on the two right and left sides of the wall had the opposite direction with one another.
Figure 6 Strut and tie model of specimen SP2-ND at the first cycle of 0.15% in-plane and 1.72% out-of-
plane drift ratios
Figure 7 shows the specimen at the peak points of the second cycle of 0.15% in-plane and 1.72% out-of-plane drift ratios. With the increase in the compressive strain of the vertical strut along the wall, forces in the diagonal strut and consequently the out-of-plane diagonal compression cracks increased. As shown in Figure 7, during pushing (loading the left-front corner), the entire thickness of the wall is in compression. It can be seen in Figure 7 that 235mm of the left side of the wall from its back is in compression. This shows the penetration
FrontLeft
23mm
Out-of-plane shear failure
along the wall
200 m
m
100 m
m
Deformation of the
longitudinal bars after
the wall’s sliding
Left
Right
Pull
Push
0.15% in-plane
1.72% out-of-plane
1st cycle
Diagonal crack
orientation
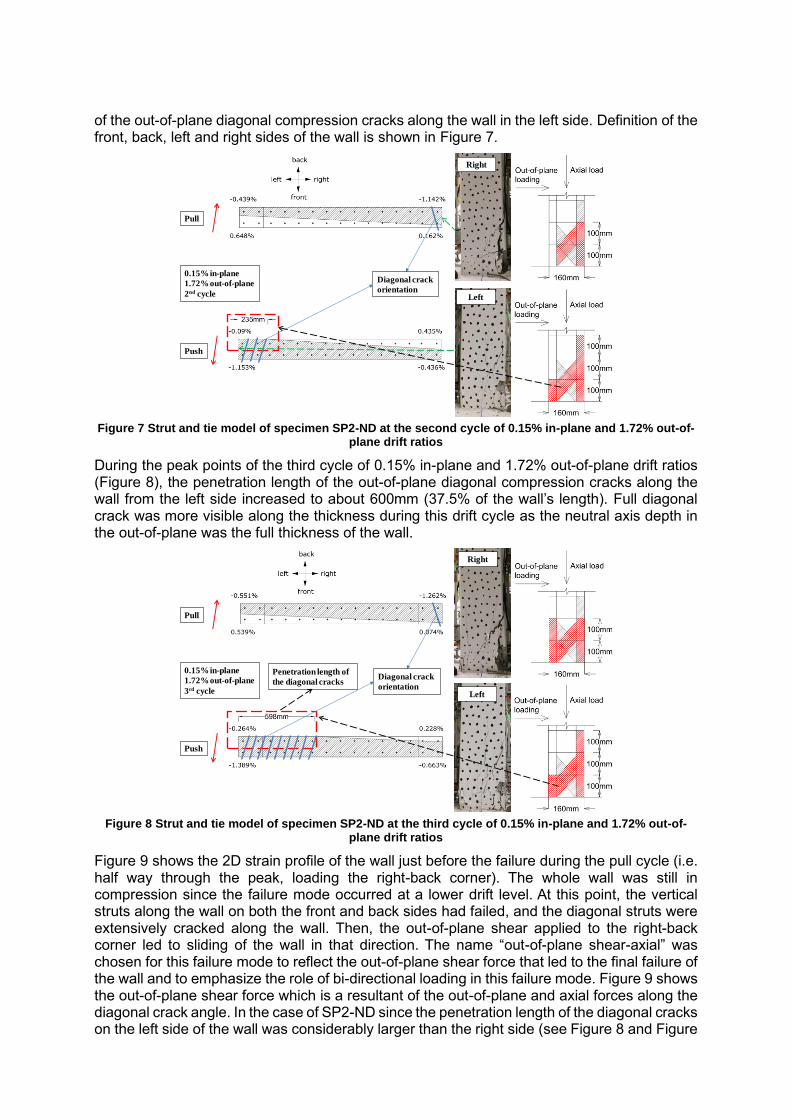
of the out-of-plane diagonal compression cracks along the wall in the left side. Definition of the front, back, left and right sides of the wall is shown in Figure 7.
Figure 7 Strut and tie model of specimen SP2-ND at the second cycle of 0.15% in-plane and 1.72% out-of-
plane drift ratios
During the peak points of the third cycle of 0.15% in-plane and 1.72% out-of-plane drift ratios (Figure 8), the penetration length of the out-of-plane diagonal compression cracks along the wall from the left side increased to about 600mm (37.5% of the wall’s length). Full diagonal crack was more visible along the thickness during this drift cycle as the neutral axis depth in the out-of-plane was the full thickness of the wall.
Figure 8 Strut and tie model of specimen SP2-ND at the third cycle of 0.15% in-plane and 1.72% out-of-
plane drift ratios
Figure 9 shows the 2D strain profile of the wall just before the failure during the pull cycle (i.e. half way through the peak, loading the right-back corner). The whole wall was still in compression since the failure mode occurred at a lower drift level. At this point, the vertical struts along the wall on both the front and back sides had failed, and the diagonal struts were extensively cracked along the wall. Then, the out-of-plane shear applied to the right-back corner led to sliding of the wall in that direction. The name “out-of-plane shear-axial” was chosen for this failure mode to reflect the out-of-plane shear force that led to the final failure of the wall and to emphasize the role of bi-directional loading in this failure mode. Figure 9 shows the out-of-plane shear force which is a resultant of the out-of-plane and axial forces along the diagonal crack angle. In the case of SP2-ND since the penetration length of the diagonal cracks on the left side of the wall was considerably larger than the right side (see Figure 8 and Figure
0.15% in-plane
1.72% out-of-plane
2nd cycle
Pull
Push
Left
Right
Diagonal crack
orientation
0.15% in-plane
1.72% out-of-plane
3rd cycle
Pull
Push
Left
Right
Penetration length of
the diagonal cracksDiagonal crack
orientation
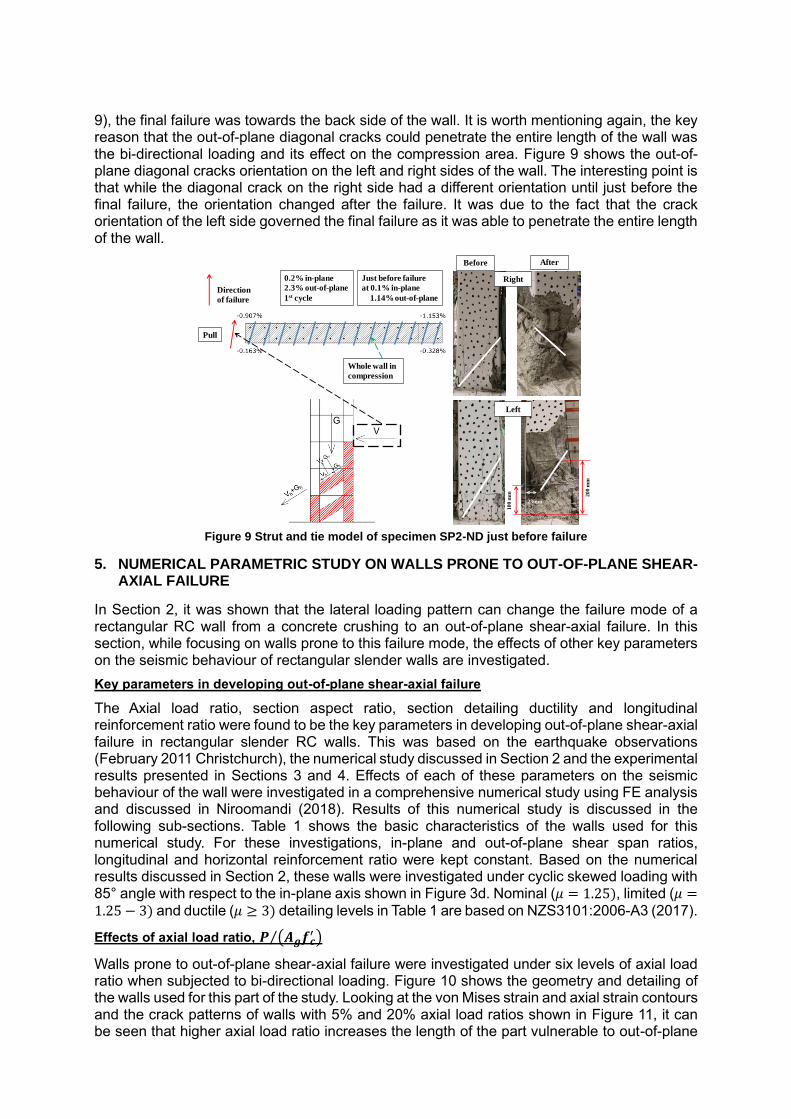
9), the final failure was towards the back side of the wall. It is worth mentioning again, the key reason that the out-of-plane diagonal cracks could penetrate the entire length of the wall was the bi-directional loading and its effect on the compression area. Figure 9 shows the out-of-plane diagonal cracks orientation on the left and right sides of the wall. The interesting point is that while the diagonal crack on the right side had a different orientation until just before the final failure, the orientation changed after the failure. It was due to the fact that the crack orientation of the left side governed the final failure as it was able to penetrate the entire length of the wall.
Figure 9 Strut and tie model of specimen SP2-ND just before failure
5. NUMERICAL PARAMETRIC STUDY ON WALLS PRONE TO OUT-OF-PLANE SHEAR-AXIAL FAILURE
In Section 2, it was shown that the lateral loading pattern can change the failure mode of a rectangular RC wall from a concrete crushing to an out-of-plane shear-axial failure. In this section, while focusing on walls prone to this failure mode, the effects of other key parameters on the seismic behaviour of rectangular slender walls are investigated.
Key parameters in developing out-of-plane shear-axial failure
The Axial load ratio, section aspect ratio, section detailing ductility and longitudinal reinforcement ratio were found to be the key parameters in developing out-of-plane shear-axial failure in rectangular slender RC walls. This was based on the earthquake observations (February 2011 Christchurch), the numerical study discussed in Section 2 and the experimental results presented in Sections 3 and 4. Effects of each of these parameters on the seismic behaviour of the wall were investigated in a comprehensive numerical study using FE analysis and discussed in Niroomandi (2018). Results of this numerical study is discussed in the following sub-sections. Table 1 shows the basic characteristics of the walls used for this numerical study. For these investigations, in-plane and out-of-plane shear span ratios, longitudinal and horizontal reinforcement ratio were kept constant. Based on the numerical results discussed in Section 2, these walls were investigated under cyclic skewed loading with 85° angle with respect to the in-plane axis shown in Figure 3d. Nominal (𝜇 = 1.25), limited (𝜇 =1.25 − 3) and ductile (𝜇 ≥ 3) detailing levels in Table 1 are based on NZS3101:2006-A3 (2017).
Effects of axial load ratio, 𝑷 (𝑨𝒈𝒇𝒄′ )⁄
Walls prone to out-of-plane shear-axial failure were investigated under six levels of axial load ratio when subjected to bi-directional loading. Figure 10 shows the geometry and detailing of the walls used for this part of the study. Looking at the von Mises strain and axial strain contours and the crack patterns of walls with 5% and 20% axial load ratios shown in Figure 11, it can be seen that higher axial load ratio increases the length of the part vulnerable to out-of-plane
0.2% in-plane
2.3% out-of-plane
1st cycle
Whole wall in
compression
Pull
Just before failure
at 0.1% in-plane
1.14% out-of-planeDirection
of failure
23mm
200 m
m
10
0 m
m
Right
Left
Before After
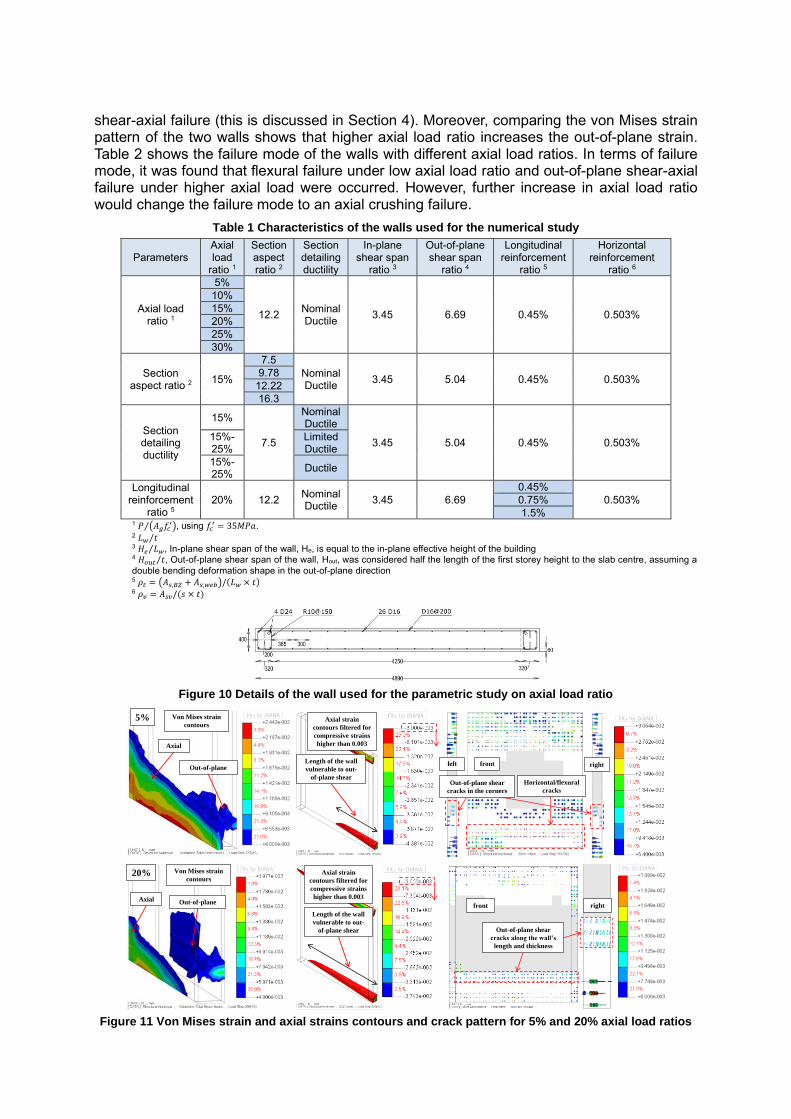
shear-axial failure (this is discussed in Section 4). Moreover, comparing the von Mises strain pattern of the two walls shows that higher axial load ratio increases the out-of-plane strain. Table 2 shows the failure mode of the walls with different axial load ratios. In terms of failure mode, it was found that flexural failure under low axial load ratio and out-of-plane shear-axial failure under higher axial load were occurred. However, further increase in axial load ratio would change the failure mode to an axial crushing failure.
Table 1 Characteristics of the walls used for the numerical study
Parameters Axial load
ratio 1
Section aspect ratio 2
Section detailing ductility
In-plane shear span
ratio 3
Out-of-plane shear span
ratio 4
Longitudinal reinforcement
ratio 5
Horizontal reinforcement
ratio 6
Axial load ratio 1
5%
12.2 Nominal Ductile
3.45 6.69 0.45% 0.503%
10%
15%
20%
25%
30%
Section aspect ratio 2
15%
7.5
Nominal Ductile
3.45 5.04 0.45% 0.503% 9.78
12.22
16.3
Section detailing ductility
15%
7.5
Nominal Ductile
3.45 5.04 0.45% 0.503% 15%-25%
Limited Ductile
15%-25%
Ductile
Longitudinal reinforcement
ratio 5 20% 12.2
Nominal Ductile
3.45 6.69
0.45%
0.503% 0.75%
1.5% 1 𝑃 (𝐴𝑔𝑓𝑐
′)⁄ , using 𝑓𝑐′ = 35𝑀𝑃𝑎.
2 𝐿𝑤 𝑡⁄ 3 𝐻𝑒 𝐿𝑤⁄ , In-plane shear span of the wall, He, is equal to the in-plane effective height of the building 4 𝐻𝑜𝑢𝑡 𝑡⁄ , Out-of-plane shear span of the wall, Hout, was considered half the length of the first storey height to the slab centre, assuming a
double bending deformation shape in the out-of-plane direction 5 𝜌𝑡 = (𝐴𝑠,𝐵𝑍 + 𝐴𝑠,𝑤𝑒𝑏)/(𝐿𝑤 × 𝑡) 6 𝜌𝑣 = 𝐴𝑠𝑣/(𝑠 × 𝑡)
Figure 10 Details of the wall used for the parametric study on axial load ratio
Figure 11 Von Mises strain and axial strains contours and crack pattern for 5% and 20% axial load ratios
Von Mises strain
contours
Axial
Out-of-plane
Axial strain
contours filtered for
compressive strains
higher than 0.003
Length of the wall
vulnerable to out-
of-plane shear
Von Mises strain
contours
Axial Out-of-plane
Length of the wall
vulnerable to out-
of-plane shear
Axial strain
contours filtered for
compressive strains
higher than 0.003
5%
20%
frontleft right
Horizontal/flexural
cracks
Out-of-plane shear
cracks in the corners
rightfront
Out-of-plane shear
cracks along the wall’s
length and thickness
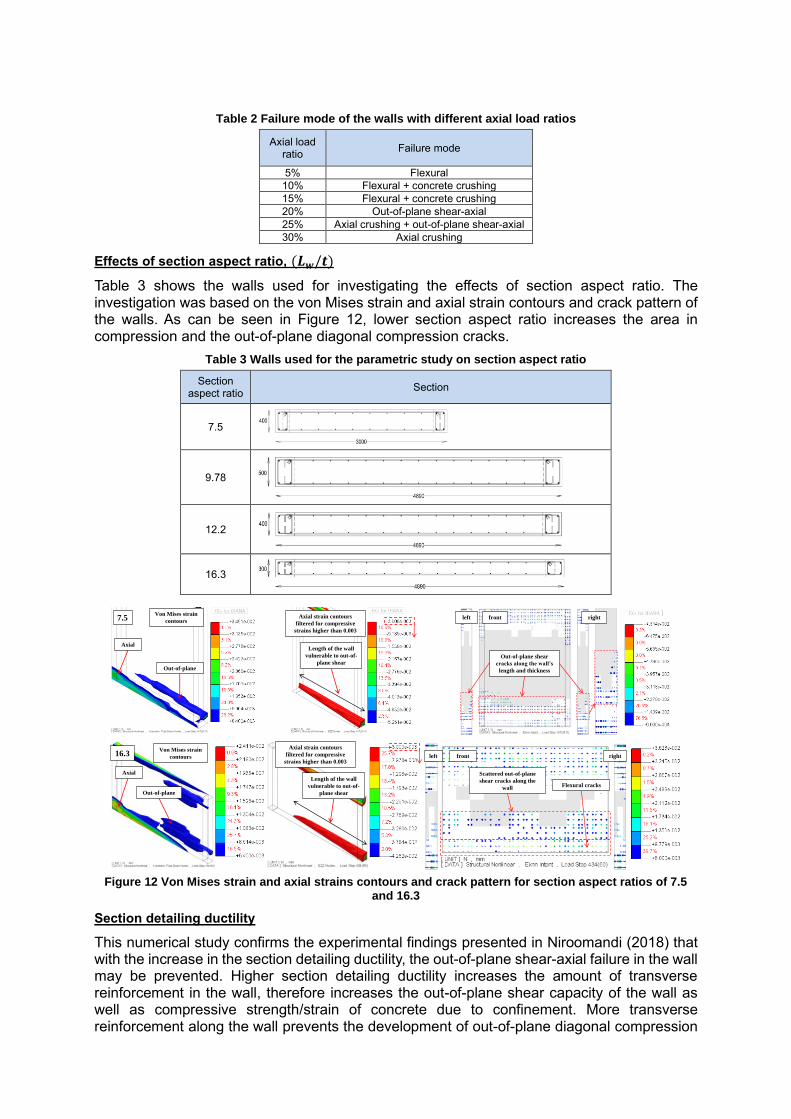
Table 2 Failure mode of the walls with different axial load ratios
Axial load ratio
Failure mode
5% Flexural
10% Flexural + concrete crushing
15% Flexural + concrete crushing
20% Out-of-plane shear-axial
25% Axial crushing + out-of-plane shear-axial
30% Axial crushing
Effects of section aspect ratio, (𝑳𝒘/𝒕)
Table 3 shows the walls used for investigating the effects of section aspect ratio. The investigation was based on the von Mises strain and axial strain contours and crack pattern of the walls. As can be seen in Figure 12, lower section aspect ratio increases the area in compression and the out-of-plane diagonal compression cracks.
Table 3 Walls used for the parametric study on section aspect ratio
Section aspect ratio
Section
7.5
9.78
12.2
16.3
Figure 12 Von Mises strain and axial strains contours and crack pattern for section aspect ratios of 7.5
and 16.3
Section detailing ductility
This numerical study confirms the experimental findings presented in Niroomandi (2018) that with the increase in the section detailing ductility, the out-of-plane shear-axial failure in the wall may be prevented. Higher section detailing ductility increases the amount of transverse reinforcement in the wall, therefore increases the out-of-plane shear capacity of the wall as well as compressive strength/strain of concrete due to confinement. More transverse reinforcement along the wall prevents the development of out-of-plane diagonal compression
Axial
Out-of-plane
Von Mises strain
contours
Length of the wall
vulnerable to out-of-
plane shear
Axial strain contours
filtered for compressive
strains higher than 0.003
frontleft right
Out-of-plane shear
cracks along the wall’s
length and thickness
Axial
Out-of-plane
Von Mises strain
contours
Length of the wall
vulnerable to out-of-
plane shear
Axial strain contours
filtered for compressive
strains higher than 0.003left front right
Scattered out-of-plane
shear cracks along the
wallFlexural cracks
7.5
16.3
cracks in the case of walls designed for limited and ductile levels. Definition of each of these ductility levels were described in Section 0. Numerical results of this part of the study are not presented in this paper and can be found in Niroomandi (2018).
Longitudinal reinforcement ratio, 𝝆𝒕 = (𝑨𝒔,𝑩𝒁 + 𝑨𝒔,𝒘𝒆𝒃)/(𝑳𝒘 × 𝒕)
Comparing the failure mode observed in Wall D5-6 (Figure 1c) with experimental results of specimen SP2-ND as well as the numerical results conducted by Niroomandi (2018), it can be concluded that higher longitudinal reinforced ratio might not prevent out-of-plane shear-axial failure. Numerical results of this part of the study are not presented in this paper and can be found in Niroomandi (2018).
6. ANALYTICAL METHOD FOR IDENTIFYING WALLS PRONE TO OUT-OF-PLANE SHEAR-AXIAL FAILURE
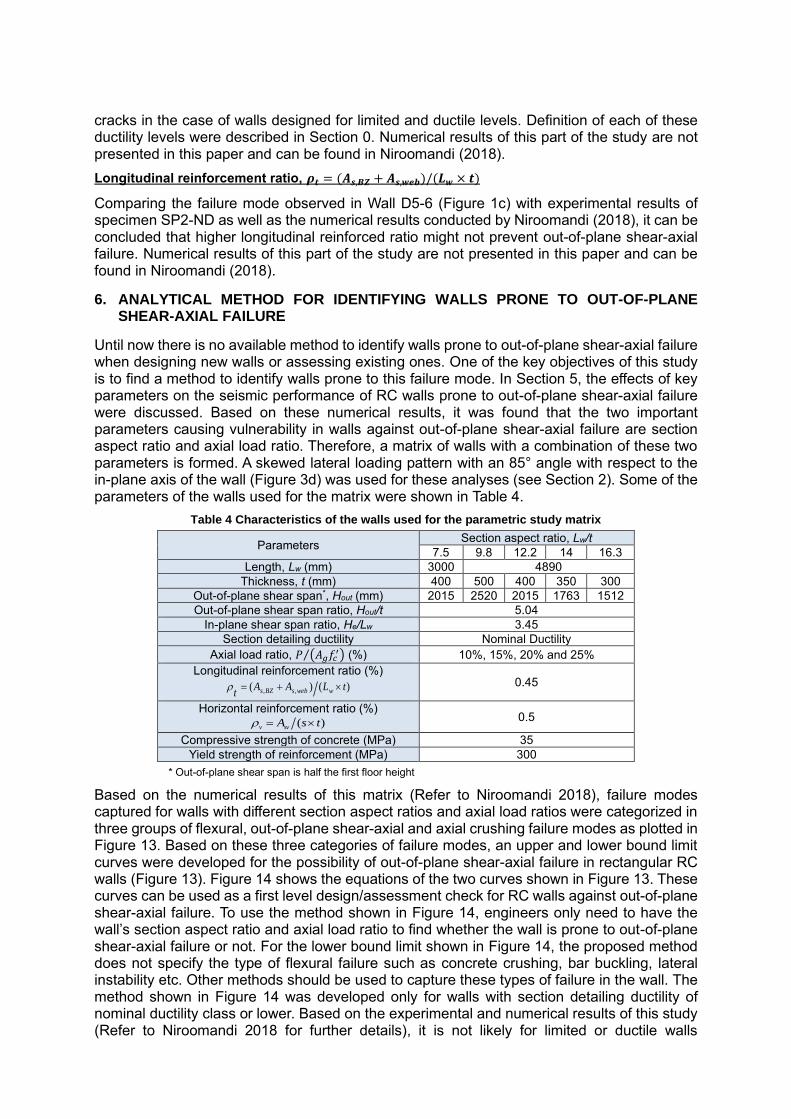
Until now there is no available method to identify walls prone to out-of-plane shear-axial failure when designing new walls or assessing existing ones. One of the key objectives of this study is to find a method to identify walls prone to this failure mode. In Section 5, the effects of key parameters on the seismic performance of RC walls prone to out-of-plane shear-axial failure were discussed. Based on these numerical results, it was found that the two important parameters causing vulnerability in walls against out-of-plane shear-axial failure are section aspect ratio and axial load ratio. Therefore, a matrix of walls with a combination of these two parameters is formed. A skewed lateral loading pattern with an 85° angle with respect to the in-plane axis of the wall (Figure 3d) was used for these analyses (see Section 2). Some of the parameters of the walls used for the matrix were shown in Table 4.
Table 4 Characteristics of the walls used for the parametric study matrix
Parameters Section aspect ratio, Lw/t
7.5 9.8 12.2 14 16.3
Length, Lw (mm) 3000 4890
Thickness, t (mm) 400 500 400 350 300
Out-of-plane shear span*, Hout (mm) 2015 2520 2015 1763 1512
Out-of-plane shear span ratio, Hout/t 5.04
In-plane shear span ratio, He/Lw 3.45
Section detailing ductility Nominal Ductility
Axial load ratio, 𝑃 (𝐴𝑔𝑓𝑐′)⁄ (%) 10%, 15%, 20% and 25%
Longitudinal reinforcement ratio (%)
)()( ,, tLAAt wwebsBZs += 0.45
Horizontal reinforcement ratio (%) )( tsAsvv = 0.5
Compressive strength of concrete (MPa) 35
Yield strength of reinforcement (MPa) 300
* Out-of-plane shear span is half the first floor height
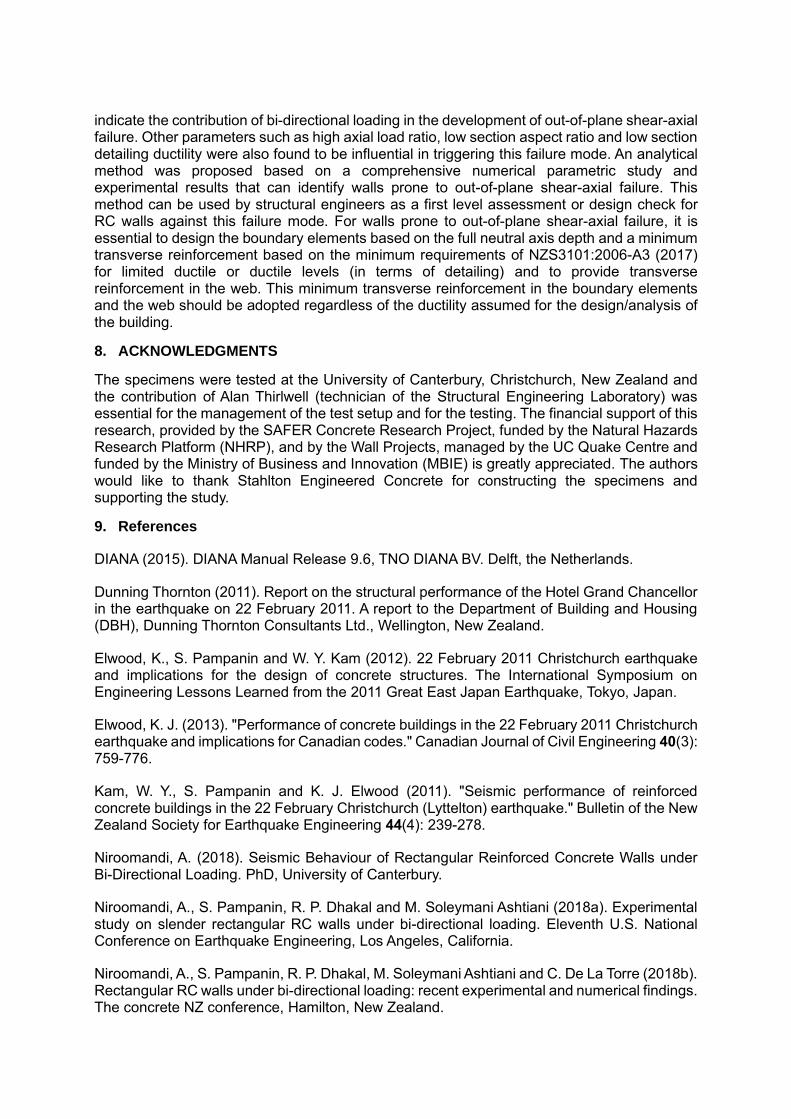
Based on the numerical results of this matrix (Refer to Niroomandi 2018), failure modes captured for walls with different section aspect ratios and axial load ratios were categorized in three groups of flexural, out-of-plane shear-axial and axial crushing failure modes as plotted in Figure 13. Based on these three categories of failure modes, an upper and lower bound limit curves were developed for the possibility of out-of-plane shear-axial failure in rectangular RC walls (Figure 13). Figure 14 shows the equations of the two curves shown in Figure 13. These curves can be used as a first level design/assessment check for RC walls against out-of-plane shear-axial failure. To use the method shown in Figure 14, engineers only need to have the wall’s section aspect ratio and axial load ratio to find whether the wall is prone to out-of-plane shear-axial failure or not. For the lower bound limit shown in Figure 14, the proposed method does not specify the type of flexural failure such as concrete crushing, bar buckling, lateral instability etc. Other methods should be used to capture these types of failure in the wall. The method shown in Figure 14 was developed only for walls with section detailing ductility of nominal ductility class or lower. Based on the experimental and numerical results of this study (Refer to Niroomandi 2018 for further details), it is not likely for limited or ductile walls
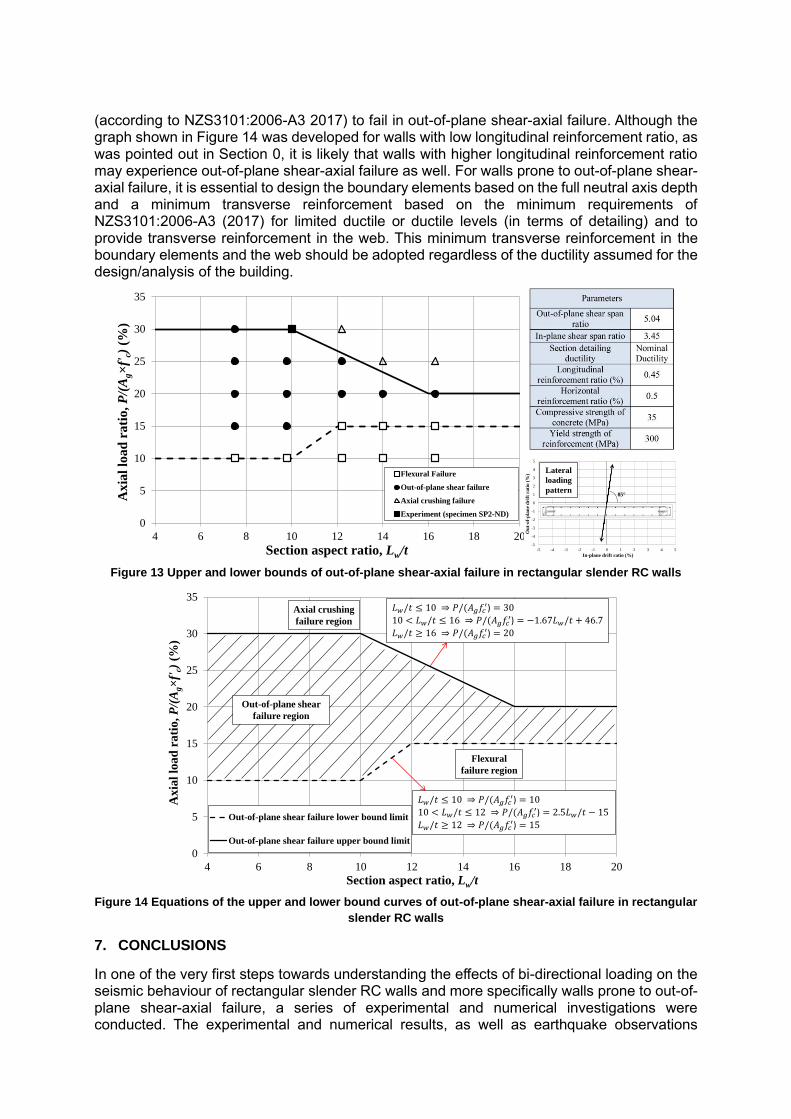
(according to NZS3101:2006-A3 2017) to fail in out-of-plane shear-axial failure. Although the graph shown in Figure 14 was developed for walls with low longitudinal reinforcement ratio, as was pointed out in Section 0, it is likely that walls with higher longitudinal reinforcement ratio may experience out-of-plane shear-axial failure as well. For walls prone to out-of-plane shear-axial failure, it is essential to design the boundary elements based on the full neutral axis depth and a minimum transverse reinforcement based on the minimum requirements of NZS3101:2006-A3 (2017) for limited ductile or ductile levels (in terms of detailing) and to provide transverse reinforcement in the web. This minimum transverse reinforcement in the boundary elements and the web should be adopted regardless of the ductility assumed for the design/analysis of the building.
Figure 13 Upper and lower bounds of out-of-plane shear-axial failure in rectangular slender RC walls
Figure 14 Equations of the upper and lower bound curves of out-of-plane shear-axial failure in rectangular
slender RC walls
7. CONCLUSIONS
In one of the very first steps towards understanding the effects of bi-directional loading on the seismic behaviour of rectangular slender RC walls and more specifically walls prone to out-of-plane shear-axial failure, a series of experimental and numerical investigations were conducted. The experimental and numerical results, as well as earthquake observations
0
5
10
15
20
25
30
35
4 6 8 10 12 14 16 18 20
Axia
l lo
ad
rati
o,
P/(
Ag
f'c)
(%
)
Section aspect ratio, Lw/t
Flexural Failure
Out-of-plane shear failure
Axial crushing failure
Experiment (specimen SP2-ND)
-5
-4
-3
-2
-1
0
1
2
3
4
5
-5 -4 -3 -2 -1 0 1 2 3 4 5
Ou
t-of-
pla
ne
dri
ft r
ati
o (
%)
In-plane drift ratio (%)
85
Lateral
loading
pattern
0
5
10
15
20
25
30
35
4 6 8 10 12 14 16 18 20
Ax
ial
loa
d r
ati
o, P
/(A
g
f'c)
(%
)
Section aspect ratio, Lw/t
Out-of-plane shear failure lower bound limit
Out-of-plane shear failure upper bound limit
Flexural
failure region
Axial crushing
failure region
Out-of-plane shear
failure region
indicate the contribution of bi-directional loading in the development of out-of-plane shear-axial failure. Other parameters such as high axial load ratio, low section aspect ratio and low section detailing ductility were also found to be influential in triggering this failure mode. An analytical method was proposed based on a comprehensive numerical parametric study and experimental results that can identify walls prone to out-of-plane shear-axial failure. This method can be used by structural engineers as a first level assessment or design check for RC walls against this failure mode. For walls prone to out-of-plane shear-axial failure, it is essential to design the boundary elements based on the full neutral axis depth and a minimum transverse reinforcement based on the minimum requirements of NZS3101:2006-A3 (2017) for limited ductile or ductile levels (in terms of detailing) and to provide transverse reinforcement in the web. This minimum transverse reinforcement in the boundary elements and the web should be adopted regardless of the ductility assumed for the design/analysis of the building.
8. ACKNOWLEDGMENTS
The specimens were tested at the University of Canterbury, Christchurch, New Zealand and the contribution of Alan Thirlwell (technician of the Structural Engineering Laboratory) was essential for the management of the test setup and for the testing. The financial support of this research, provided by the SAFER Concrete Research Project, funded by the Natural Hazards Research Platform (NHRP), and by the Wall Projects, managed by the UC Quake Centre and funded by the Ministry of Business and Innovation (MBIE) is greatly appreciated. The authors would like to thank Stahlton Engineered Concrete for constructing the specimens and supporting the study.
9. References
DIANA (2015). DIANA Manual Release 9.6, TNO DIANA BV. Delft, the Netherlands.
Dunning Thornton (2011). Report on the structural performance of the Hotel Grand Chancellor in the earthquake on 22 February 2011. A report to the Department of Building and Housing (DBH), Dunning Thornton Consultants Ltd., Wellington, New Zealand.
Elwood, K., S. Pampanin and W. Y. Kam (2012). 22 February 2011 Christchurch earthquake and implications for the design of concrete structures. The International Symposium on Engineering Lessons Learned from the 2011 Great East Japan Earthquake, Tokyo, Japan.
Elwood, K. J. (2013). "Performance of concrete buildings in the 22 February 2011 Christchurch earthquake and implications for Canadian codes." Canadian Journal of Civil Engineering 40(3): 759-776.
Kam, W. Y., S. Pampanin and K. J. Elwood (2011). "Seismic performance of reinforced concrete buildings in the 22 February Christchurch (Lyttelton) earthquake." Bulletin of the New Zealand Society for Earthquake Engineering 44(4): 239-278.
Niroomandi, A. (2018). Seismic Behaviour of Rectangular Reinforced Concrete Walls under Bi-Directional Loading. PhD, University of Canterbury.
Niroomandi, A., S. Pampanin, R. P. Dhakal and M. Soleymani Ashtiani (2018a). Experimental study on slender rectangular RC walls under bi-directional loading. Eleventh U.S. National Conference on Earthquake Engineering, Los Angeles, California.
Niroomandi, A., S. Pampanin, R. P. Dhakal, M. Soleymani Ashtiani and C. De La Torre (2018b). Rectangular RC walls under bi-directional loading: recent experimental and numerical findings. The concrete NZ conference, Hamilton, New Zealand.
NIST (2014). Recommendations for Seismic Design of Reinforced Concrete Wall Buildings Based on Studies of the 2010 Maule, Chile Earthquake.
NZS3101:2006-A3 (2017). Code of Practice for the Design of Concrete Structures, Standards Association of New Zealand.
Priestley, M. J. N., M. C. Calvi and M. J. Kowalsky (2007). Displacement-Based Seismic Design of Structures. IUSS Press, Pavia, Italy.


![Analytical Solutions to General Anti-Plane Shear Problems ... · arXiv:1402.6025v2 [math.AP] 5 May 2014 Analytical Solutions to General Anti-Plane Shear Problems In Finite Elasticity](https://img.pdfslide.us/doc/110x75/5ead21f2e7a104141c6e1a1c/analytical-solutions-to-general-anti-plane-shear-problems-arxiv14026025v2.jpg)