Embed Size (px)
Citation preview
Our transport
assets delivering
more for Victoria
Annual Report 2015-16
15 September 2016
The Hon Jacinta Allan MP
Level 20, 1 Spring Street
Melbourne VIC 3000
The Hon Timothy Pallas MP
Level 4, 1 Treasury Place
East Melbourne VIC 3002
Dear Ministers
I am pleased to submit to you for presentation to Parliament the VicTrack
2015-16 Annual Report for the period 1 July 2015 to 30 June 2016.
Yours sincerely
John Lenders
VicTrack Chair
Letter to the
Ministers
4 2015-16 Highlights
6 2015-16 Performance
8 Our asset portfolio
Section 1
About VicTrack
10 VicTrack overview
12 Business groups
Section 2
Outcomes report
14 Chair's report
16 Chief Executive report
18 Strengthening the network
24 Revitalising transport precincts
28 Reinvesting in communities
Section 3
Statutory & financial reporting
34 Statutory information
49 Independent auditor’s report
51 Statutory statement
52 Financial performance
54 Comprehensive operating statement
55 Balance sheet
56 Statement of changes in equity
58 Cashflow statement
59 Notes to financial statement
30 June 2016
118 Disclosure index
Appendices
120 Board members
Annual Report
2015-16
Contents
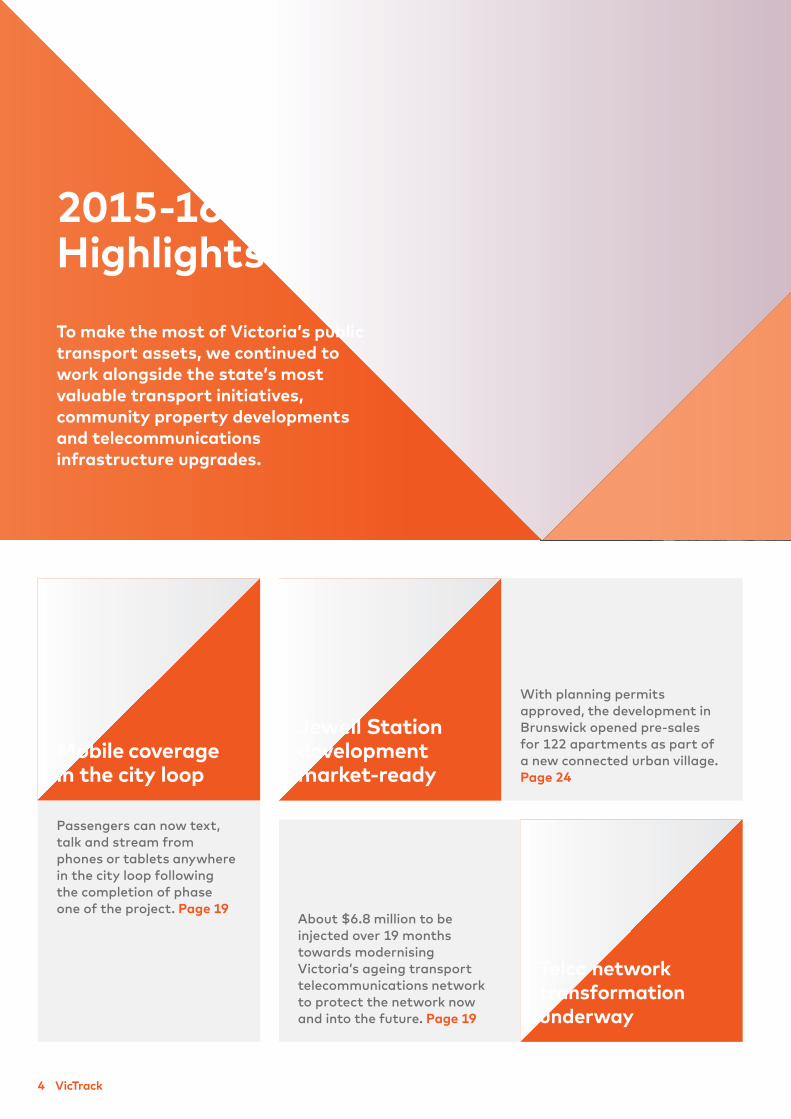
2015-16
Highlights
To make the most of Victoria’s public
transport assets, we continued to
work alongside the state’s most
valuable transport initiatives,
community property developments
and telecommunications
infrastructure upgrades.
Passengers can now text,
talk and stream from
phones or tablets anywhere
in the city loop following
the completion of phase
one of the project. Page 19About $6.8 million to be
injected over 19 months
towards modernising
Victoria’s ageing transport
telecommunications network
to protect the network now
and into the future. Page 19
With planning permits
approved, the development in
Brunswick opened pre-sales
for 122 apartments as part of
a new connected urban village.
Page 24
Jewell Station
development
market-ready
Telco network
transformation
underway
Mobile coverage
in the city loop
4 VicTrack
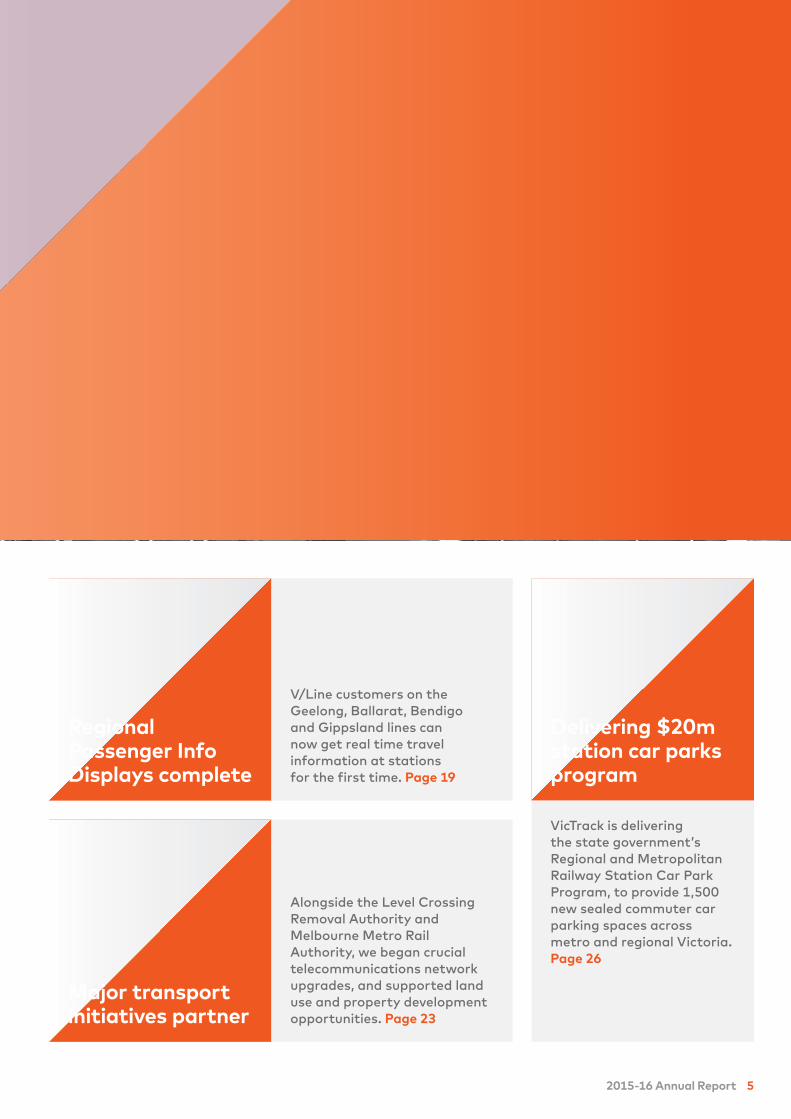
VicTrack is delivering
the state government’s
Regional and Metropolitan
Railway Station Car Park
Program, to provide 1,500
new sealed commuter car
parking spaces across
metro and regional Victoria.
Page 26
V/Line customers on the
Geelong, Ballarat, Bendigo
and Gippsland lines can
now get real time travel
information at stations
for the first time. Page 19
Alongside the Level Crossing
Removal Authority and
Melbourne Metro Rail
Authority, we began crucial
telecommunications network
upgrades, and supported land
use and property development
opportunities. Page 23
Regional
Passenger Info
Displays complete
Major transport
initiatives partner
Delivering $20m
station car parks
program
2015-16 Annual Report 5
6 VicTrack
2015-16
Performance
Strong commercial results
supported even greater
transport investment
in 2015-16, as we
continued to support the
state's most significant
transport initiatives.
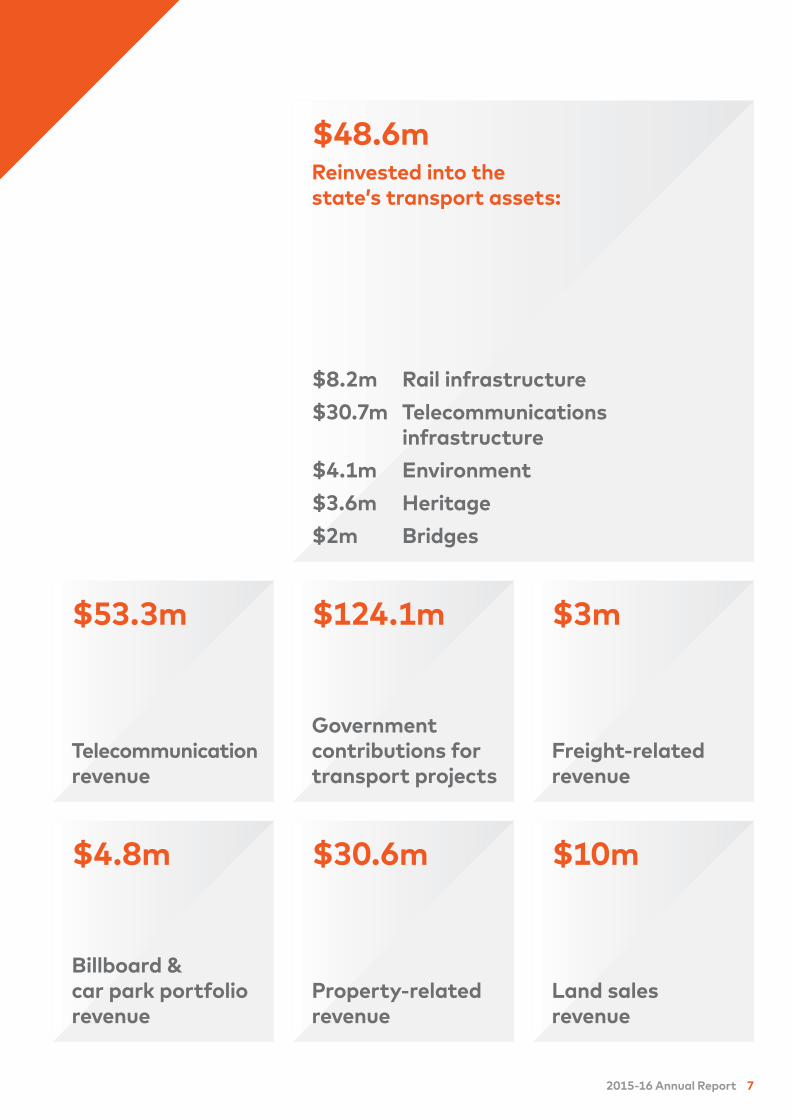
$124.1m
Government
contributions for
transport projects
$30.6m
Property-related
revenue
$10m
Land sales
revenue
$3m
Freight-related
revenue
$53.3m
Telecommunication
revenue
$48.6m
$8.2m Rail infrastructure
$30.7m Telecommunications
infrastructure
$4.1m Environment
$3.6m Heritage
$2m Bridges
Reinvested into the
state’s transport assets:
$4.8m
Billboard &
car park portfolio
revenue
2015-16 Annual Report 7
8 VicTrack
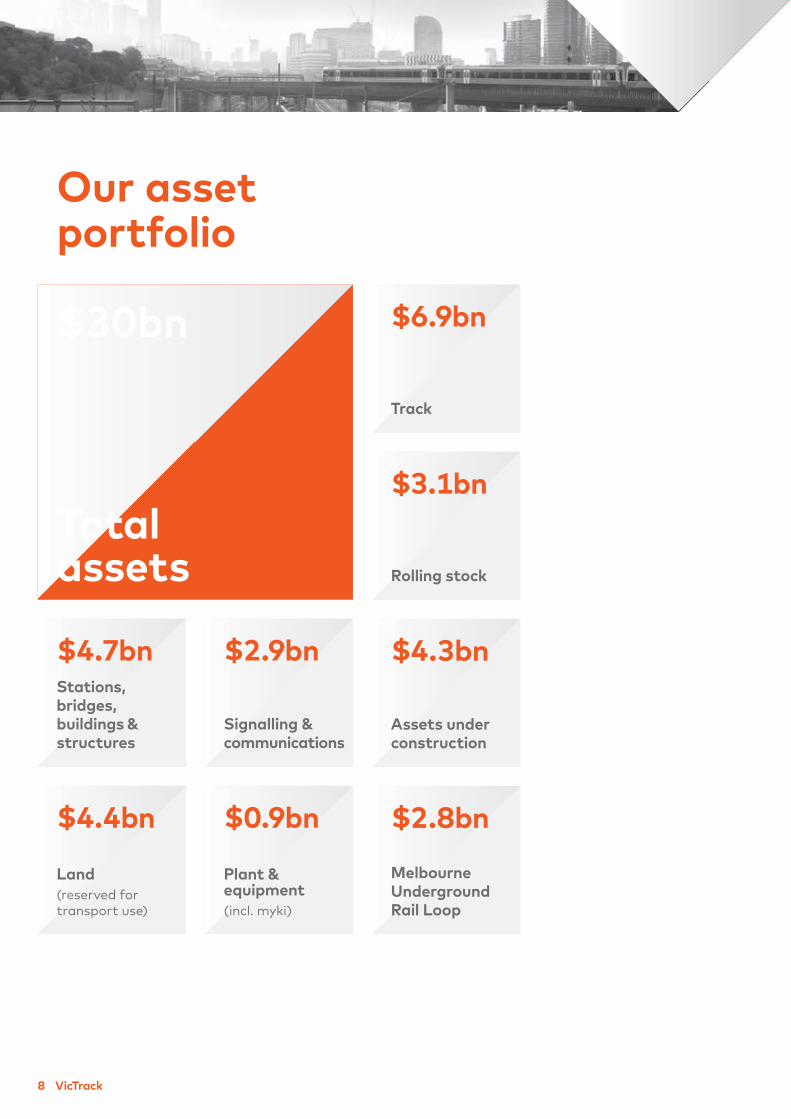
Our asset
portfolio
$4.7bn
Stations,
bridges,
buildings &
structures
$4.4bn
Land
(reserved for
transport use)
$3.1bn
Rolling stock
$4.3bn
Assets under
construction
$2.8bn
Melbourne
Underground
Rail Loop
$6.9bn
Track
$2.9bn
Signalling &
communications
Total
assets
$30bn
$0.9bn
Plant &
equipment
(incl. myki)
Section 1
About VicTrack
2015-16 Annual Report 9
VicTrack owns Victoria’s
public transport land,
assets and infrastructure
and works to protect and
grow the value of the
portfolio, to support a
thriving transport system,
and make travel and living
better for Victorians.
10 VicTrack
VicTrack
overview
Our role in transport
With much of the asset portfolio dedicated to
transport – our land, infrastructure, trams and
trains, and telecommunication networks – our focus
is strategic asset management and supporting the
delivery of better transport solutions.
Whether we’re planning and managing the use of
transport land, upgrading the telecommunication
network or partnering on major infrastructure
projects – our job is to ensure the state’s assets
continue to serve Victoria now and into the future.
With a strong commercial focus, we drive even
greater investment back to transport and
communities, and support other non-commercial
activities like community projects and environmental
and heritage preservation.
Our core functions
Victoria’s Transport Integration Act 2010 sets out
the objectives for each transport sector agency.
As the asset owners, our role is to manage the
assets consistent with transport system objectives.
Our core functions include:
• telecommunication services and network
infrastructure that supports public transport;
• managers of land set aside for transport
purposes, including the development and sale
of land no longer required for transport;
• project management and civil engineering
services for rail infrastructure upgrades; and
• transport facilities and asset management,
including the open access Dynon Rail Freight
Terminal and heritage, buildings and
environmental preservation.
Our partners
We work on behalf of the Victorian Government led by
Transport for Victoria (TFV), and as a service provider
and project partner to Public Transport Victoria (PTV),
Metro Trains Melbourne (MTM), Yarra Trams, and
V/Line. We report to the Minister for Public Transport
and the Treasurer, and work closely with the Department
of Economic Development, Jobs, Transport and
Resources (DEDJTR) and the Department of Treasury
and Finance (DTF).
We also work with a wide range of other government
departments, agencies, authorities, community
organisations and private sector partners.
Section 1 About VicTrack
Vision
To grow as a commercially sustainable corporation
that supports the delivery of government policy
and achieves triple bottom line outcomes through
a strong commercial focus and environmental
sensitivity and provides a range of social benefits
to Victorian communities.
Mission
To improve the value of assets that VicTrack manages
for the state and deliver a range of commercial
services and projects that improve Victoria’s transport
system and contribute to the state’s liveability and
sustainable economic development.
Our values
Respect
We will show respect to each other by appreciating
differences and actively listening; being courteous and
considerate; communicating openly and with empathy.
Achievement
We will show achievement by being accountable
for doing what we say we will do; proactively
solving problems; appreciating each other’s
outcomes, progress and efforts.
Professionalism
We will show professionalism by delivering high-
quality and timely work, communicating effectively
and with positivity; being prepared.
One team
We will show teamwork to each other by being
collaborative, cooperative and inclusive; sharing
information, knowledge and expertise; supporting
others to solve problems and achieve common goals.
2015-16 Annual Report 11
12 VicTrack
Our business is made up of three specialist delivery
groups including Property, Telecommunications and
Project Delivery, which are supported by Corporate
Affairs and Business Services. Each delivery group
provides various disciplines in asset management
and service delivery.
Telecommunications
As a licensed telecommunication provider and
with network infrastructure that spans the state,
we provide a full suite of telecommunications
services to the transport sector. Our networks
provide the backbone to public transport customer
information, myki ticketing, driver communications
and other network critical systems, such as signalling.
We also provide 24 hour network monitoring, and
planned and emergency repair and maintenance,
to ensure the highest standards of reliability for the
transport system.
As partner to almost every transport
project in Victoria and provider of core
services to the sector, our operational
structure works to support various
roles and functions we fulfil.
Business groups
Property
As land owner, our role is to ensure our land best serves
the transport sector and Victorian communities. With
vast land parcels that span the state and air rights
throughout the public transport corridor, we work
across all land use matters impacting on transport
land, including land sales and acquisition, property
development, commercial leasing, land use and access,
infrastructure and facilities management and heritage
and environmental preservation.
Project Delivery
Whether we’re actively upgrading the infrastructure
or working alongside Victoria’s major transport
initiatives, our Project Delivery Group provides
expertise across all disciplines that impact rail land,
infrastructure and telecommunications networks.
Our services include project management and project
delivery in both infrastructure and telecommunications
projects, as well as safety and technical services.
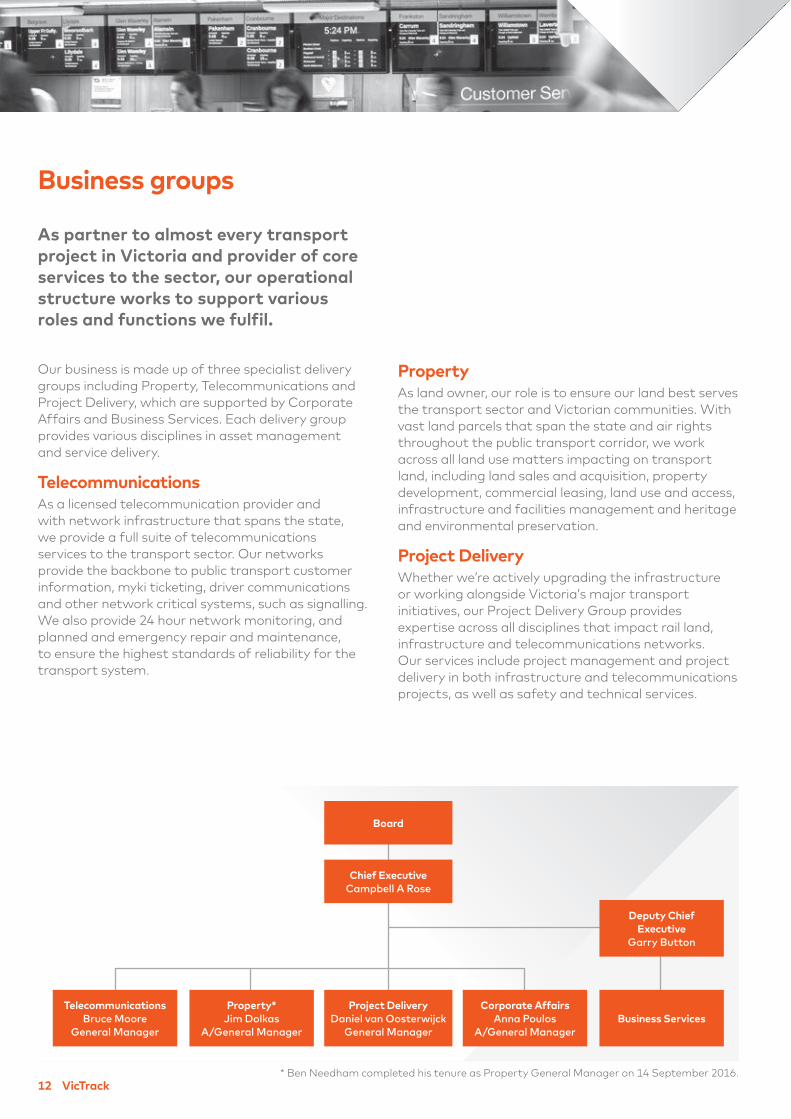
Project Delivery
Daniel van Oosterwijck
General Manager
Telecommunications
Bruce Moore
General Manager
Property*
Jim Dolkas
A/General Manager
Corporate Affairs
Anna Poulos
A/General Manager
Deputy Chief
Executive
Garry Button
Business Services
Board
Chief Executive
Campbell A Rose
* Ben Needham completed his tenure as Property General Manager on 14 September 2016.
2015-16 Annual Report 13
Section 2
Outcomes report
The year marked a major shift in focus as the Victorian
Government announced a new transport agency
known as Transport for Victoria (TFV) to act across all
transport modes. The state’s major public transport
initiatives also gathered momentum, including the
Level Crossing Removal Project and Metro Tunnel.
In recognition of the fast evolving demands on the
network assets, the Board endorsed a number of
significant changes, including a shift to five year
forecasting in our corporate planning process and
longer term asset management plans. Providing
certainty over time to our transport partners was
recognised as critical for the success of VicTrack and
wider sector outcomes.
VicTrack consulted early in the strategic planning
cycle, to ensure close alignment with the state's
transport objectives. Collaboration also informed
discussions over the refranchising process, which
is set to be finalised in 2017, with VicTrack focussed
on ensuring our assets are best deployed to serve
the transport sector.
A new organisational structure was established
during 2015-16 to improve VicTrack’s effectiveness
in supporting the government’s transport agenda.
The newly formed Project Delivery Group was
established to ensure a consistent project approach
on infrastructure and telecommunications projects,
and improve efficiencies in delivery for partners
and customers.
Chair's report
As the state government
strengthened its
commitment to transport
during 2015-16, VicTrack
continued its focus on core
transport services and set
in place longer term asset
management strategies
to better serve the sector.
14 VicTrack
Our role in redeveloping Victoria’s ageing
telecommunications infrastructure was also clearly
recognised, as we began work alongside the Level
Crossing Removal Authority (LXRA) and Melbourne
Metro Rail Authority (MMRA) to redesign the network
to meet current and future demands. As part of the
larger Network Transformation Program (refer page
19), the work helped reduce immediate risks to the
transport network and provide design and support
for transport initiatives.
Working with the Office of the National Rail Safety
Regulator we also enhanced the security of the
network, as we moved to gain telecommunications
trunk infrastructure accreditation – which would
improve safety conditions for all individuals working
on the rail corridor, not only VicTrack employees.
Strengthening safety at VicTrack and reducing risk
across the business was a major focus this year, which
included the Board approving risk appetite statements,
as part of our renewed risk management framework.
At the close of a positive year, I would like to thank all
our sector partners and those who have worked with
us this year towards a more unified and strengthened
transport system delivering more for Victorians.
Particular thanks to Minister for Public Transport
Jacinta Allan and Treasurer Tim Pallas for their
ongoing commitment to transport through major
transport initiatives and strong industry leadership
through the newly formed TFV, which was jointly
announced with Minister for Roads Luke Donnellan.
These moves will continue to help Victoria to thrive
though jobs creation, economic investment and a
better public transport system to meet the demands
of our growing population.
I would like to acknowledge my fellow Board
members for setting a clear strategic direction for
VicTrack, where core transport services and strategic
asset management remained the primary focus of
the business.
Thanks particularly to Sam Andersen who retired
in March 2016 after 12 years service to VicTrack,
including as Chair of the Audit and Risk Management
Committee, and welcome to Paula Allen, who joined
the Board in April 2016.
Under the leadership of Chief Executive Cam Rose,
we have further strengthened relationships with our
transport sector partners, which has provided me with
even greater confidence moving forward. At this crucial
time for Victorian transport, Cam has ensured the
management of transport assets has remained central
to ongoing discussions with the sector, and VicTrack’s
collaborative approach has been recognised by all.
I look forward to the progress of our sector under TFV,
as we continue to work alongside all other transport
bodies and with the Department of Economic
Development, Jobs, Transport and Resources to
ensure our transport assets are put to work to help
Victoria thrive.
John Lenders
Chairman
Section 2 Outcomes report
2015-16 Annual Report 15
Chief Executive report
As the asset owners, VicTrack has worked alongside
the Victorian Government and transport authorities
to deliver new infrastructure and also plan towards
a more resilient transport future.
The announcement late in the 2015-16 year of a
new overarching transport authority, to be known as
TFV, cemented the new unified outlook for Victorian
transport. It strengthened opportunities for VicTrack
to continue close collaboration with our transport
partners and build on the successes delivered
throughout 2015-16.
Consolidating the structure of our business and
building longer-term asset management plans were
major steps by VicTrack in supporting the sector.
The formation of a single Project Delivery Group
(PDG) in October provided for more consistency
in the management and delivery of projects, while
extending asset management plans aimed to enable
better forward planning for the sector.
Our role in major transport initiatives, including the
Level Crossing Removal Project and Metro Tunnel,
has been critical this year – with our network
engineers delivering telecommunication solutions
that meet the demands now, but also secure the
network into the future.
The work has formed part of VicTrack’s broader
Network Transformation Project, which gained
further support from the Board with $5.8 million set
aside for the project in recognition that we have a
primary role in modernising Victoria’s ageing transport
telecommunications network.
The 2015-16 year has
delivered landmark results
for Victorian commuters,
as some of the state’s
largest transport initiatives
were delivered and others
got underway.
16 VicTrack
The delivery of mobile phone services in the Melbourne
city loop was another major achievement for our
telecommunications business. We’re proud to help
deliver Melbourne mobile carrier coverage that’s
equivalent to the world’s best alongside Hong Kong,
Singapore and Montreal and ahead of many other
capital cities around the world.
Our property business also led important opportunities
alongside major transport projects through seeking
value capture prospects, to support development
of well serviced and better connected commuter
transport hubs. The work follows on from previous
station precinct revitalisation successes, including
IKON Glen Waverley, which received further awards
during the year.
This year our property team also progressed Jewell
Station precinct and St Albans Station retail precinct
to market alongside our development partners, and
continued to build on a strong pipeline of opportunities.
The sale of air rights over Windsor Station precinct has
been particularly exciting as a way to maximise value
for the portfolio and the community.
Delivering on the state’s $20 million Regional and
Metropolitan Railway Station Car Parking Program
was a strong outcome for the business, which also
led an impressive program for the year that included
finalising regional rail communications network works,
Bendigo Bus Interchange Passenger Information
Displays and Geelong Wyndham bus infrastructure,
among others.
Strengthening the safety performance of the business
was another priority this year. We have worked
alongside the Office of the National Rail Safety
Regulator (ONRSR) to extend existing accreditations
to include telecommunications trunk infrastructure
accreditation. Once finalised, VicTrack would be the
only metropolitan accredited agency of its kind in
Victoria – ensuring greater safety for all suppliers,
contractors, partners and employees working in the
rail corridor.
At the close of a year that I trust has built a strong
platform for future successes, I would like to thank the
Board for clear and decisive leadership at time of great
change for our sector.
As we’ve worked to consolidate our business, my
thanks also goes to my Executive Team for their
support and leadership throughout. Determination
to position our assets and business to best serve
Victorian transport and communities has delivered
results the group can feel proud of.
Thanks also to all VicTrack employees, who work
together each day, alongside our many sector partners
and stakeholders to accomplish a significant amount
of work – this year was testament to your efforts.
Finally, thanks to our many sector partners for
the ongoing collaborative efforts between our
organisations. We look forward to another successful
year ahead as we work towards our shared agenda
under TFV.
Campbell A Rose
Chief Executive
Section 2 Outcomes report
2015-16 Annual Report 17
Strengthening
the network
As the transport asset
owners, supporting network
performance remained core
business at VicTrack during
2015-16, as we continued
to deliver network services
and projects that help
make transport and the
portfolio stronger.
18 VicTrack
Mobile coverage in the city loop
Mobile phone coverage in Melbourne’s city loop was
officially launched by the Hon Jacinta Allan, Minister
for Public Transport in October 2015, giving passengers
the ability to text, talk and stream from phones or
tablets anywhere in the city loop for the first time.
The new mobile phone service was considered among
the best in the world, with service that emulated
mobile carrier coverage in the Hong Kong, Singapore
and Montreal underground rail systems, and exceeded
the quality of coverage found in many other capital
cities around the world.
The project was delivered over three years by VicTrack
in partnership with Optus, Vodafone and Telstra.
It has provided Melbourne train passengers with
access to high-quality 3G voice, 3G data and limited
4G data coverage throughout the city’s 12 kilometres
of rail tunnels and underground stations.
The launch marked phase one of the project, with
subsequent works rolled out during 2016 to enhance
the 3G and 4G signal strengths. Phase two of the
project has been planned for late 2016 to make
additional 4G data services available throughout
the entire precinct.
Network Transformation Project
The first stages of the Network Transformation
Project for Victoria’s ageing telecommunications
infrastructure began during 2015-16, with VicTrack
undertaking two key projects.
As part of the larger Integrated Transport Network
(ITN) program, the work aims to reduce any immediate
risks to the transport network and provide design and
support for the state’s major transport initiatives –
including the Level Crossing Removal Project and the
Metro Tunnel.
Capital investment for both projects combined
is approximately $6.8 million in total for work
over 19 months to September 2017.
The first project includes a new analogue gateway
device that has been approved to transport
Operational Control System (OCS) applications over
an IP network instead of over the legacy network.
It will also assist VicTrack transitioning into the
full ITN program.
The second is the development and delivery of an
IP/MPLS reference architecture design for ITN and
proof of concept testing of the design and supporting
materials. The work validated ITN could meet key
criteria now and for future transport applications.
Regional passenger information displays
In 2015-16, VicTrack delivered new technology to allow
V/Line customers on the Geelong, Ballarat, Bendigo
and Gippsland lines to experience real time travel
information at stations for the first time.
The new customer information system comprising
new electronic displays, Customer Help Points and
automated public address announcements was rolled
out at 33 V/Line stations to provide passengers with
automated, accurate and timely information about
train times, service changes and platform alterations.
Customers with hearing and visual impairments
would also benefit, with the information being
provided in both audio and visual formats.
The $7 million project was delivered on behalf of
PTV, with works carried out under VicTrack by
contractors 4Tel, Axent, Metromatics and Linktech.
Systems were installed on the Bendigo, Gippsland,
Geelong and Ballarat lines.
Project snapshot
• Phase 1 introduced 12 repeater sites in the
city loop to provide coverage for the carriers
and DTRS system.
• Phase 2 would add about 20 repeater
sites to enhance 4G data coverage.
• Coverage stemmed from leaky coax feeder
cables that radiate amplified radio signals
for the mobile coverage within the four city
loop tunnels.
• Distributed antenna system (DAS) provided
for coverage to underground stations.
• The system provided train control DTRS
mobile coverage for the Metro network.
• The system required protected AC power,
fibre cabling and distribution, specialised
coax cabling and distribution, radio filtering
equipment and radio repeater/amplifiers.
Section 2 Outcomes report
2015-16 Annual Report 19
20 VicTrack
Dynon S gate project
As the state government’s open-access rail freight
provider, in 2015 we completed major traffic
intersection signal and security gate works at the
Dynon Rail Freight Terminal (DRFT) in West Melbourne.
The $594,000 upgrade allowed High Performance
Freight Vehicles to have 24/7 direct connectivity
between the DRFT and the Port of Melbourne.
The work involved:
• installing traffic lights and signals
on Dynon Road (S-gate);
• road works such as asphalting and road marking;
• installing state-of-the-art remote control gates
at the entry points on Dynon Road (S and T gates)
and from Lloyd Street (T and U gates); and
• new fencing and traffic signage.
The works enabled larger capacity trucks to access
the DRFT directly without time restrictions, and
provided opportunities to further grow the terminal
and gain new business, with greatest potential from
regional Victoria.
Geelong Wyndham bus infrastructure
VicTrack managed the roll out of 449 new bus stops
across the cities of Greater Geelong and Wyndham
during 2015-16.
The project was part of wider PTV efforts to improve
bus and train service connectivity following the
redevelopment of timetables as Regional Rail Link
services got underway. The multi-billion dollar project
that separated regional and metro trains with new
infrastructure led to timetable restructure across
Greater Geelong and Wyndham, and a commitment
by PTV to provide bus stops approximately every
400 metres.
VicTrack managed the decommissioning old bus stops
and design and construction of bus indent bays and
concrete hardstands, along with the construction
of new concrete bus stop hardstands based on PTV
provided standard drawings.
VicTrack appointed Summerhill Maintenance Services
to manage updating the timetable signage and bus
stop flags at more than 3,000 locations.
VicTrack also appointed Civilex to manage the design
and civil construction under the project involving the
completion of 364 standard bus stops and 85 bus
indent bays.
Strengthening the network
Telecommunications trunk
infrastructure accreditation
Major milestones were reached in VicTrack’s drive
to improve safety across the Melbourne rail network
during 2015-16 – with significant progress made
on efforts to become the primary TTI accredited
transport agency.
The additional accreditation extends existing safety
accreditation to include management of VicTrack’s
telecommunications infrastructure in the metropolitan
rail network.
As a new requirement of ONRSR, the project has
involved VicTrack updating asset management plans
and safety procedures, and documenting relevant staff
roles under a Competency Management Framework.
During the first half of 2016, VicTrack worked through
the compliance stage of the accreditation. Employees
were also asked to review safety documents, with
telecommunication employees expected to be assessed
under the new Competency Management Framework.
Once completed, the accreditation gives
VicTrack a licence to operate for carrying out our
telecommunications works and managing the
telecommunications infrastructure in an operational
rail environment. It also defines how we work safely
with our transport partners.
Bendigo bus interchange PIDs
As part of a $3.8 million upgrade to Bendigo’s
Mitchell Street bus interchange, VicTrack installed new
passenger information displays (PIDs) and customer
help units (CHPs), along with the transmission
network and software to deliver real time bus
information to commuters.
The $900,000 PIDs project was funded by PTV,
who work with the City of Greater Bendigo in a bid
to improve passenger amenities, accessibility and
servicing at the bus interchange.
It followed an initial trial project where VicTrack was
nominated as the vendor, along with its contractors
4Tel, Axent and PCMobile Welding.
VicTrack installed three PIDs and CHPs at the
Hargreaves Street Mall site (Mitchell Street stop)
and also completed civil works to install the
supporting poles, casing and screens. VicTrack also
provided the transmission network and software
required to deliver the real time information,
layouts and audio for the PIDs and CHPs.
Regional rail communications network
The implementation of new digital radio systems to
replace V/Line’s existing obsolete Non-Urban Train Radio
system, neared completion during 2015-16 – well ahead
of the original planned 2018 project completion date.
Most V/Line trains were fitted with the new digital
radio systems, and completion is expected to be as
early as 2017.
Deployment of train controller capabilities were
advanced to testing and acceptance of network
infrastructure was underway. The installation onto
the majority of the train passenger fleet was almost
finished, and all 59 VLocity trains had been completed.
Sprinter locomotives and high rail maintenance
vehicle deployment were also planned.
The aged non-urban train radio (NUTR) system has
continued to be turned off in stages, as regional rail
communications network (RRCN) capability replaced old
systems on trains and infrastructure in regional areas.
The 2016-17 State Budget included a further $8.638m
to deliver the upgrade of the NUTR.
Strategic asset management plans
Over the past 12 months, VicTrack has focussed on
the development of a business-wide strategic asset
management plan, supported by Property Group and
Telecommunications Group plans to set the framework
for asset management across the organisation.
In recognition of its role under the Transport
Integration Act 2010 (Vic), VicTrack worked to clarify
its longer-term strategy on the state’s transport-
related land, infrastructure and assets, which must
be developed and used primarily to support the
transport system, under the Act.
The Strategic Asset Management Plan has set
the framework for asset management across the
organisation, ensuring VicTrack was aligned to
the requirements of the Department of Treasury
and Finance’s Asset Management Accountability
Framework to which we were required to demonstrate
compliance with, including public attestation from the
2017-18 Annual Report and beyond.
VicTrack recognised the need to ensure consolidated,
comprehensive and efficient decision making and
reporting across the business to drive sound investment
planning, and replacement of ageing infrastructure.
The Strategic Asset Management Plan also ensured
business groups aligned asset management plans with
international best practice as defined in ISO 55001.
Section 2 Outcomes report
2015-16 Annual Report 21
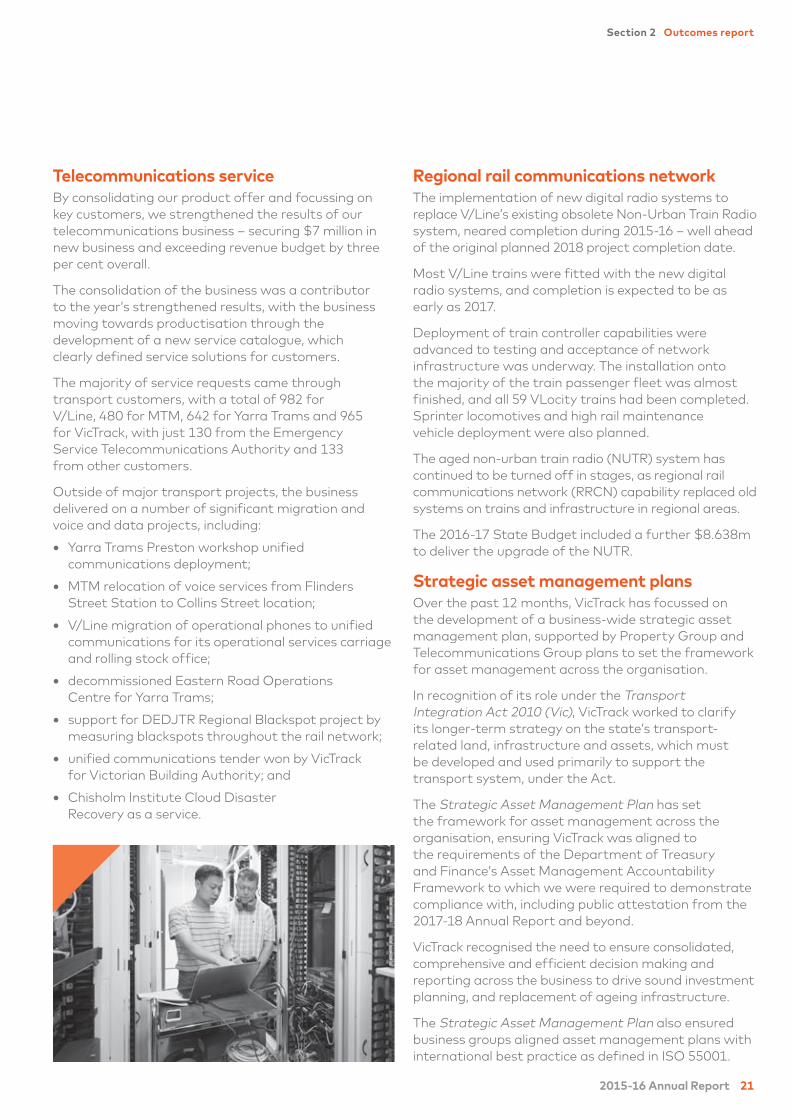
Telecommunications service
By consolidating our product offer and focussing on
key customers, we strengthened the results of our
telecommunications business – securing $7 million in
new business and exceeding revenue budget by three
per cent overall.
The consolidation of the business was a contributor
to the year’s strengthened results, with the business
moving towards productisation through the
development of a new service catalogue, which
clearly defined service solutions for customers.
The majority of service requests came through
transport customers, with a total of 982 for
V/Line, 480 for MTM, 642 for Yarra Trams and 965
for VicTrack, with just 130 from the Emergency
Service Telecommunications Authority and 133
from other customers.
Outside of major transport projects, the business
delivered on a number of significant migration and
voice and data projects, including:
• Yarra Trams Preston workshop unified
communications deployment;
• MTM relocation of voice services from Flinders
Street Station to Collins Street location;
• V/Line migration of operational phones to unified
communications for its operational services carriage
and rolling stock office;
• decommissioned Eastern Road Operations
Centre for Yarra Trams;
• support for DEDJTR Regional Blackspot project by
measuring blackspots throughout the rail network;
• unified communications tender won by VicTrack
for Victorian Building Authority; and
• Chisholm Institute Cloud Disaster
Recovery as a service.
22 VicTrack
Commercial property
Positive results for VicTrack’s commercial
property and land sales during 2015-16
continued to drive investment back to
transport and Victorian communities,
and strengthened the asset portfolio.
Land sales program
As part of VicTrack’s role in releasing land no longer
required for transport, we completed 22 sales in
our 2015-16 land sales program at locations across
metropolitan and regional Victoria.
The sales delivered almost $10 million in revenue
to support VicTrack’s wider portfolio obligations,
and unlocked significant land parcels ready for
redevelopment. Significant opportunities were
secured at Ringwood, Hawthorn, Healesville, Kilmore,
Maryborough and Wodonga.
The land will now be transformed by the private
sector into a mix of residential and commercial
developments, to stimulate the property market
and improve local communities.
Commercial leases
The commercial leasing portfolio achieved gains in
2015-16 under the ongoing management of Brookfield
Global Integrated Solutions (BGIS), which took on the
portfolio in the previous year.
Uplift in revenue to $26 million was reached this year,
which was an increase of $1.8 million compared to the
same period last year, despite a number of significant
leases being terminated due to major transport projects.
The partnership between VicTrack and BGIS – which
includes 1400 commercial leases – also identified further
opportunities to grow the portfolio to maximise revenue
and build a sustainable asset base that continues to
support VicTrack’s non-commercial responsibilities.
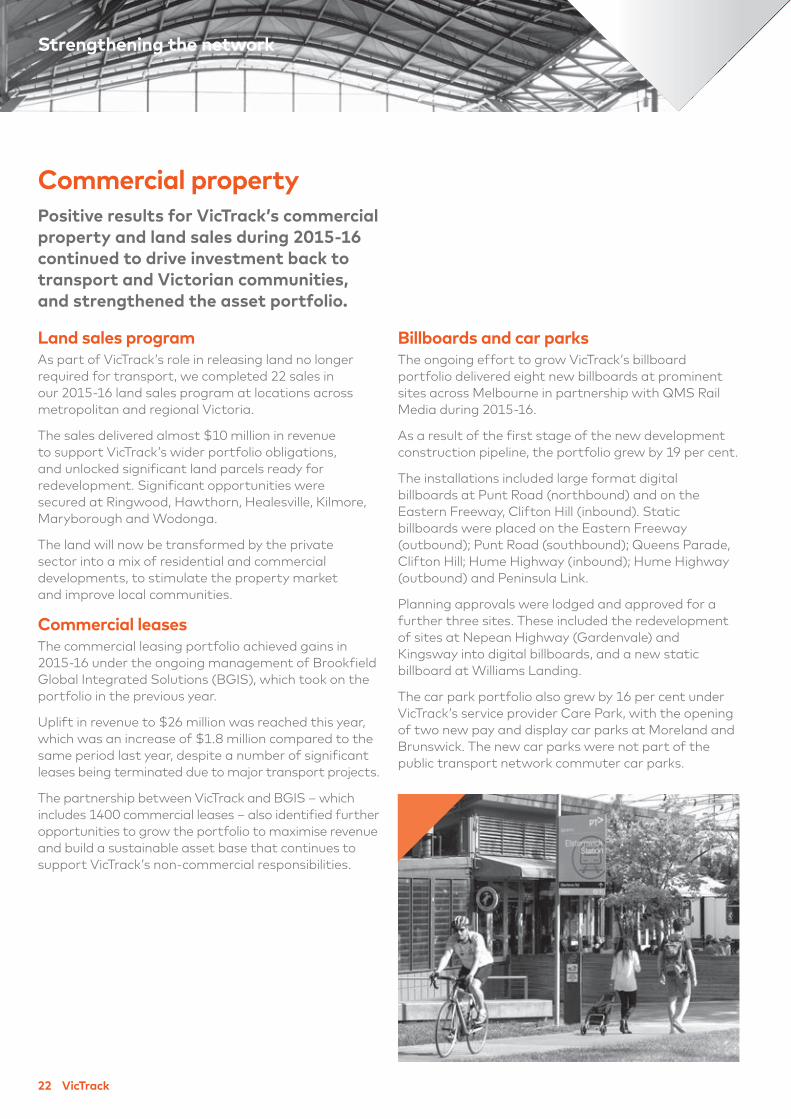
Billboards and car parks
The ongoing effort to grow VicTrack’s billboard
portfolio delivered eight new billboards at prominent
sites across Melbourne in partnership with QMS Rail
Media during 2015-16.
As a result of the first stage of the new development
construction pipeline, the portfolio grew by 19 per cent.
The installations included large format digital
billboards at Punt Road (northbound) and on the
Eastern Freeway, Clifton Hill (inbound). Static
billboards were placed on the Eastern Freeway
(outbound); Punt Road (southbound); Queens Parade,
Clifton Hill; Hume Highway (inbound); Hume Highway
(outbound) and Peninsula Link.
Planning approvals were lodged and approved for a
further three sites. These included the redevelopment
of sites at Nepean Highway (Gardenvale) and
Kingsway into digital billboards, and a new static
billboard at Williams Landing.
The car park portfolio also grew by 16 per cent under
VicTrack’s service provider Care Park, with the opening
of two new pay and display car parks at Moreland and
Brunswick. The new car parks were not part of the
public transport network commuter car parks.
Strengthening the network
$10.9bn Metro Tunnel
VicTrack has been engaged to ensure the
telecommunications network meets the design
requirements of the Metro Tunnel, which will deliver
a new rail tunnel and stations to Melbourne’s CBD.
Our role has also included ensuring designs meet the
needs of any future developments under the wider
ITN (see pg 19).
During 2016, works got underway around existing
telecommunications infrastructure, with VicTrack
network engineers providing advice on the preparation
of the project scope and technical requirements.
As the project continues, our role will include extending
and upgrading the VicTrack telecommunications
network and delivering infrastructure to support mobile
carrier services in the underground tunnels, as well as
land and environmental advice and support.
Other major projects
$5.5bn Western Distributor Project
Advice on land, rail assets and supporting
affected leaseholders.
$100m Flinders Street Station Revitalisation Project
On the steering committee and project working group.
$416m Murray Basin Freight Infrastructure Project
Research and advice on services located along rail lines.
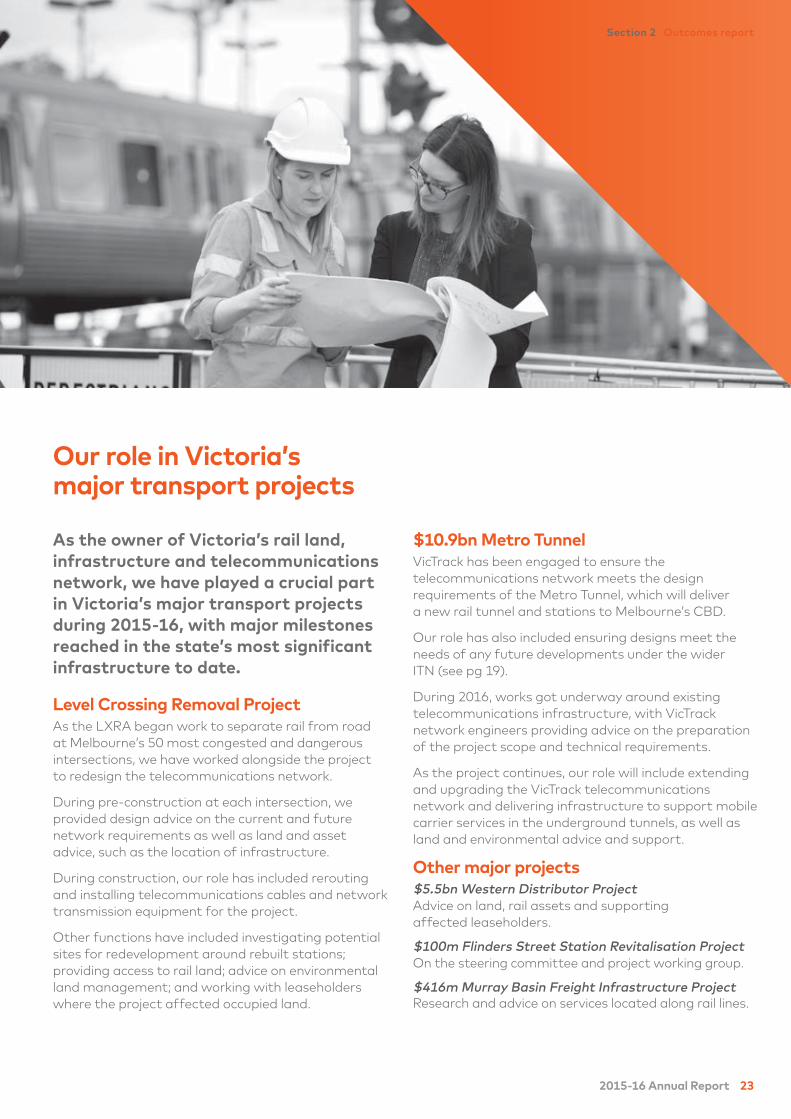
Our role in Victoria’s
major transport projects
As the owner of Victoria’s rail land,
infrastructure and telecommunications
network, we have played a crucial part
in Victoria’s major transport projects
during 2015-16, with major milestones
reached in the state’s most significant
infrastructure to date.
Level Crossing Removal Project
As the LXRA began work to separate rail from road
at Melbourne’s 50 most congested and dangerous
intersections, we have worked alongside the project
to redesign the telecommunications network.
During pre-construction at each intersection, we
provided design advice on the current and future
network requirements as well as land and asset
advice, such as the location of infrastructure.
During construction, our role has included rerouting
and installing telecommunications cables and network
transmission equipment for the project.
Other functions have included investigating potential
sites for redevelopment around rebuilt stations;
providing access to rail land; advice on environmental
land management; and working with leaseholders
where the project affected occupied land.
2015-16 Annual Report 23
Section 2 Outcomes report
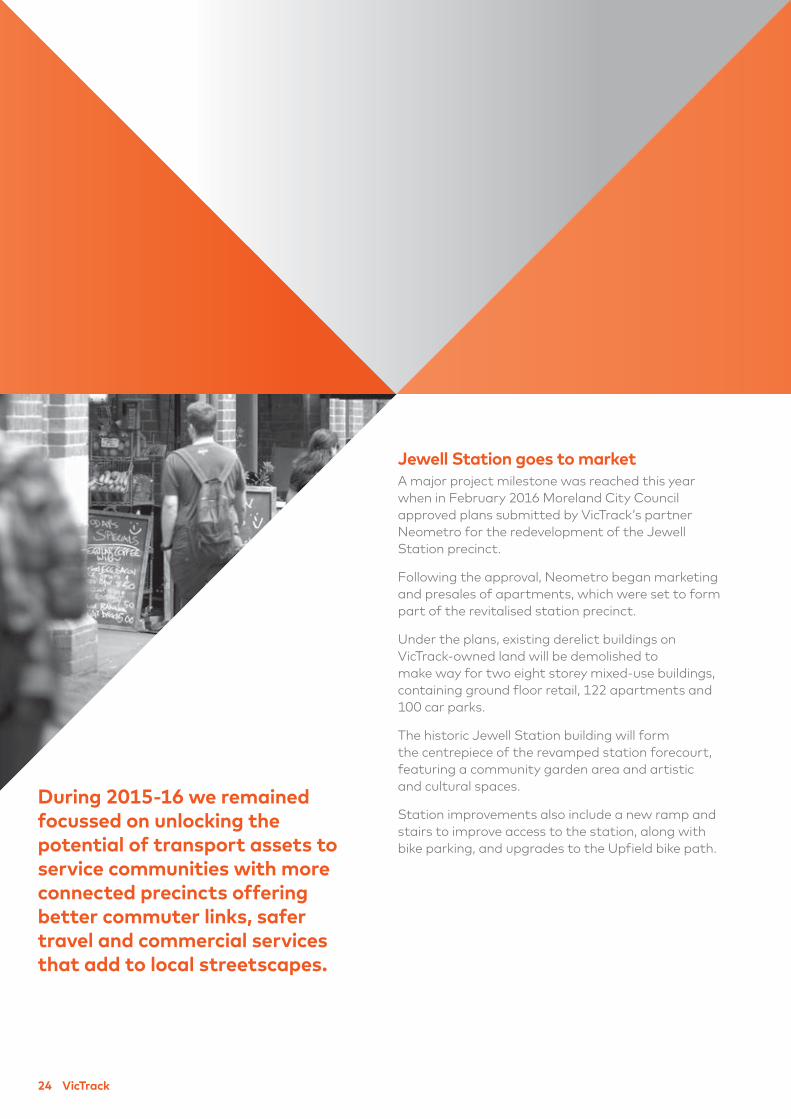
Jewell Station goes to market
A major project milestone was reached this year
when in February 2016 Moreland City Council
approved plans submitted by VicTrack’s partner
Neometro for the redevelopment of the Jewell
Station precinct.
Following the approval, Neometro began marketing
and presales of apartments, which were set to form
part of the revitalised station precinct.
Under the plans, existing derelict buildings on
VicTrack-owned land will be demolished to
make way for two eight storey mixed-use buildings,
containing ground floor retail, 122 apartments and
100 car parks.
The historic Jewell Station building will form
the centrepiece of the revamped station forecourt,
featuring a community garden area and artistic
and cultural spaces.
Station improvements also include a new ramp and
stairs to improve access to the station, along with
bike parking, and upgrades to the Upfield bike path.
During 2015-16 we remained
focussed on unlocking the
potential of transport assets to
service communities with more
connected precincts offering
better commuter links, safer
travel and commercial services
that add to local streetscapes.
24 VicTrack
Revitalising transport precincts
Elsternwick rifle range
The transformation of the former Caulfield City Rifle
Club into an iconic eatery and bar in Elsternwick got
underway during 2015-16.
VicTrack began demolition works at the old disused
VicTrack building in March 2016 and construction
commenced on 31 March 2016.
The building will be restored to ensure the preservation
of its heritage facade and also provide a base building
shell for the future tenants.
When completed, the venue will be run by the
Riverland Group, a private hospitality organisation
with experience in successfully building and operating
venues such as Riverland Bar and Pilgrim Bar at
Federation Square, the Boatbuilders Yard at South
Wharf and The Wye River General Store in Wye River.
Refurbishment works were expected to be completed
by August 2016, with the tenant fit out works
scheduled for the end of October 2016.
New Glen Waverley award
In June 2016 the Glen Waverley Station precinct
won the national award for ‘Government
Leadership’ at the Property Council of Australia’s
Innovation and Excellence Awards.
It added to awards for planning excellence
From Plan to Place from the Planning Institute
of Australia’s (PIA) Victorian awards, and a
commendation for the same category at the
PIA National Awards.
St Albans retail precinct
Expressions of interest for a new 700 square metre
premium retail precinct at St Albans Station went
to market during 2015-16.
It followed the signing of a Memorandum of
Understanding with VicRoads and the LXRA, as part
of removal of the level crossing at Main Road and the
rebuild of the station.
Suitable tenants were being sought for retail and
commercial spaces surrounding the station, with
the campaign receiving a strong response in its
initial stages.
Coupled with the removal of the level crossing at
Main Road, the retail development is expected
to improve connections between the station and
the rest of St Albans and enhance the safety of
the station and new bus interchange.
Real estate agents Knight Frank were chosen
to manage the expression of interest process
to find tenants.
Section 2 Outcomes report
2015-16 Annual Report 25
26 VicTrack
Revitalising transport precincts
Hampton Station precinct
The revitalisation of the Hampton Station precinct
progressed during 2015-16, as we continued to work
with development partners epc.Pacific and the
Department of Health and Human Services (DHHS)
to transform the area.
Bayside City Council approved a traffic management
solution that would support the local community at
its April 2016 council meeting.
The decision enabled the developer to commence
design work towards lodgement of the town
planning application.
The project aims to create a safer, more accessible
commuter hub, funded through adjoining mixed-use
development – with some proceeds used for station
upgrades, such as a new station forecourt and
improved bus interchange and parking facilities.
Donnybrook Station car park upgrade
Donnybrook’s car park extension and upgrade neared
completion in 2015-16 as VicTrack managed the works
funded by PTV as part of the $8.7 million Regional
Station Access and Modal Interchange Program.
The reconstruction of the intersection, left turn lane and
related road works was the final stage of the project,
which aimed to improve access, amenity, car parking
and transport connections at Donnybrook Station.
The car park expansion included the addition of a new
car parking area in previously vacant VicTrack land,
bringing the total number of spaces at the station
to 112. The original gravel car park was formalised
with asphalt pavement, line markings, lighting and
bike racks to improve the overall station precinct.
The car park entrance point was also relocated to
Springs Road in order to improve safety and reduce
traffic congestion on Donnybrook Road.
The final station car park entrance and road works
were expected to be completed September 2016.
Ballarat Station precinct
Through the latter part of 2015, VicTrack completed
a detailed due diligence investigation on the proposed
development site at Ballarat Station prior to
commencement of the procurement process.
When complete, the $25 million government-funded
Ballarat Station precinct is expected to provide a
thriving precinct for locals, commuters and visitors,
including a refurbishment of the currently disused
heritage goods shed to create an integrated hotel
and exhibition/convention centre.
VicTrack has continued to work in partnership with
Regional Development Victoria (RDV) as they lead
the project, which also included Ballarat City Council
and DEDJTR.
Windsor air rights development
The first high density air rights residential development
over rail in Melbourne reached a significant milestone
this year, with the signing of the development deed in
December 2015.
The agreement with developer SMA Projects included
the air rights over Chapel Street in Windsor, with
the project intended to deliver a mixed-use retail
and residential development constructed on a deck
spanning over the rail cutting.
The town planning application for the landmark
development would be lodged for town planning
later in 2016.
$20m station car park program
VicTrack began pre-delivery and planning for the
$20 million Regional and Metropolitan Railway
Station Car Park Program late in 2015-16 following
a state government announcement for the funding
in its 2016-17 Budget.
With VicTrack engaged to deliver the program, the
funding was allocated to provide more car parking
spaces at stations. The unlocked land at railway
stations is expected to provide up to 1,500 new
sealed commuter car parking spaces – largely in outer
metropolitan and regional areas. It would also improve
accessibility and safety through new lighting, CCTV
and signage.
VicTrack was preparing to release tenders
at the end of the 2015-16 financial year.

Restored rail buildings
for rural communities
Five more rural communities benefitted from rail
buildings being refurbished for community use during
2015-16 as the four-year state government funded
Community Use of Vacant Rail Buildings Program
came to a close.
The program worked to revitalise disused heritage
railway buildings to provide affordable spaces to
enable greater community engagement and activity.
This year the towns of Birchip, Clunes, Trafalgar,
Gordon and Dunkeld had buildings restored after
years of disuse to enable the state’s historic railway
buildings to be reopened to local people and the
wider community.
Section 2 Outcomes report
2015-16 Annual Report 27
The program delivered repurposed station buildings at:
Birchip – permanent community event, exhibition
and display space in use by The Lions Club, Birchip
Landcare Group and Birchip Historical Society.
Clunes – a community based cultural hub with
office and meeting spaces in use by Creative Clunes.
Trafalgar – arts and community space in use
by Baw Baw Arts Alliance.
Gordon – a multi-purpose small group meeting and
activity space in use by the Australian Railway Historical
Society Victorian division and wider community.
Dunkeld – a flexible studio space for local professional
and amateur artists as well as a gallery and exhibition
space for community under Rails Dunkeld Inc.

Safer bridges for emergency services
A pilot scheme to name 40 Victorian bridges
currently at high risk of natural disaster was
launched in November 2015 to assist Victoria’s
emergency services.
Working with the Office of Geographic Names,
Emergency Services Telecommunications Authority,
local council and local emergency and heritage
groups, VicTrack began a process of online
community engagement under the pilot Bridge
Naming Competition.
The scheme recognised the need to determine
precise locations during emergency events and
natural disaster responses, which were currently
hindered by dozens of unnamed bridges.
The first location was the Huntly-Fosterville
Road Bridge, located north of Bendigo, where the
surrounding community was asked to submit names
based on cultural and historical significance.
A shortlist was then put out for public vote,
which was yet to be decided at the end of
2015-16. However, the Office of Geographic
Names had approved the use of an online
competition to extend the scheme to the other
high risk bridges.
With a strong commercial
focus we continued to drive
investment back to transport
and communities, and support
other non-commercial
activities like community
projects and environmental
and heritage preservation.
28 VicTrack
Heritage and bridge
rehabilitation programs
Heritage preservation
In April 2016, VicTrack commenced restoration works
at Maldon goods shed, as part of its ongoing $1 million
annual Heritage Program to preserve heritage-listed
rail assets.
The $400,000 restoration project aimed to return
the 130 year-old heritage-listed building to its former
glory, with work including restumping of the goods
shed and external platforms, repairing the damaged
floor, wall and roof, and installing a new galvanised
roof. A new platform extension to replicate the original
platform on the goods shed would also be built as
part of the project.
The works were completed in June 2016 and support
the Victorian Goldfields Railway line heritage tourist
railway, which also received $30,000 from the Victorian
Government to replace 1,000 sleepers and more than
two kilometres of track – with the rail used in the
upgrade donated by VicTrack.
VicTrack spent a further $100,000 at Serviceston
Station on timbering, plastering, repointing and flashing
works. The remaining $500,000 of the Heritage
Program went on completing restorations that
began the previous year at Kaniva, Patchewollock and
Manangatang stations and Wycheproof goods shed.
Bridge rehabilitation
VicTrack also completed $1.5 million in bridge
rehabilitation works during 2015-16 year, which was
a continuation of the ongoing commitment to the
Bridge Rehabilitation Program.
The various projects included re-decking, strengthening
works and safety barrier upgrades, which were carried
out Drouin (Lardners Track, road bridge), Wangaratta
(Green Street, road bridge), Stawell (Napier Street,
road bridge) and Ouyen (Mitchell Street, footbridge).
Fire restoration at Newport
and Maryborough
During 2015-16, VicTrack managed fire rectification
works following two disastrous fires at the historic
Newport railway workshops in March and August
2015. The areas were leased to tourist and railway
operators, with several priceless rail carriages and
other heritage assets lost in the fires.
The multi-million rectification works involved recovery
and remediation works, including propping damaged
walls and buildings structures and later reinstatement
of buildings structures.
As part of VicTrack’s ongoing role in maintaining the
state’s rail assets and infrastructure, VicTrack has
overseen a $2 million upgrade of fire protection services
over the past two years at the Newport railway
workshops, in liaison with the Melbourne Fire Brigade.
In 2016, fire safety protection works were also
completed at Maryborough Station and plans are
underway for other works to be completed this year
at the Gemco rail workshops at South Dynon.
Section 2 Outcomes report
2015-16 Annual Report 29
Reinvesting in communities
30 VicTrack
Reinvesting in communities
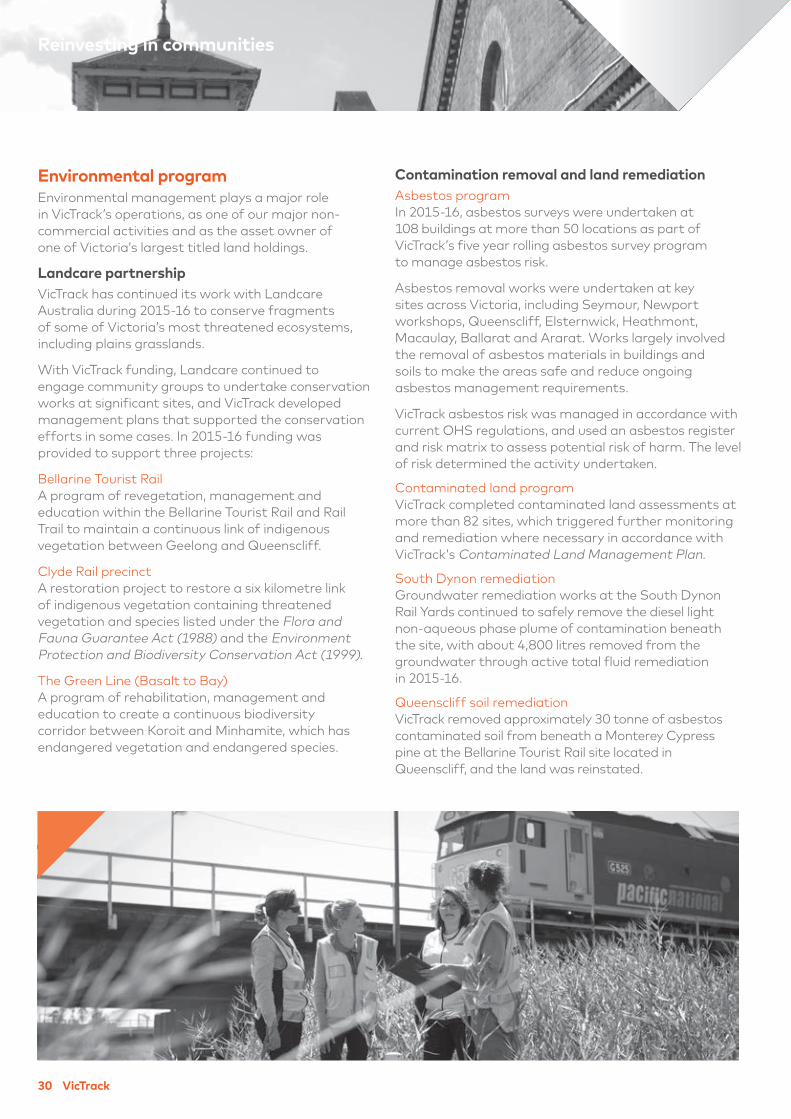
Environmental program
Environmental management plays a major role
in VicTrack’s operations, as one of our major non-
commercial activities and as the asset owner of
one of Victoria’s largest titled land holdings.
Landcare partnership
VicTrack has continued its work with Landcare
Australia during 2015-16 to conserve fragments
of some of Victoria’s most threatened ecosystems,
including plains grasslands.
With VicTrack funding, Landcare continued to
engage community groups to undertake conservation
works at significant sites, and VicTrack developed
management plans that supported the conservation
efforts in some cases. In 2015-16 funding was
provided to support three projects:
Bellarine Tourist Rail
A program of revegetation, management and
education within the Bellarine Tourist Rail and Rail
Trail to maintain a continuous link of indigenous
vegetation between Geelong and Queenscliff.
Clyde Rail precinct
A restoration project to restore a six kilometre link
of indigenous vegetation containing threatened
vegetation and species listed under the Flora and
Fauna Guarantee Act (1988) and the Environment
Protection and Biodiversity Conservation Act (1999).
The Green Line (Basalt to Bay)
A program of rehabilitation, management and
education to create a continuous biodiversity
corridor between Koroit and Minhamite, which has
endangered vegetation and endangered species.
Contamination removal and land remediation
Asbestos program
In 2015-16, asbestos surveys were undertaken at
108 buildings at more than 50 locations as part of
VicTrack’s five year rolling asbestos survey program
to manage asbestos risk.
Asbestos removal works were undertaken at key
sites across Victoria, including Seymour, Newport
workshops, Queenscliff, Elsternwick, Heathmont,
Macaulay, Ballarat and Ararat. Works largely involved
the removal of asbestos materials in buildings and
soils to make the areas safe and reduce ongoing
asbestos management requirements.
VicTrack asbestos risk was managed in accordance with
current OHS regulations, and used an asbestos register
and risk matrix to assess potential risk of harm. The level
of risk determined the activity undertaken.
Contaminated land program
VicTrack completed contaminated land assessments at
more than 82 sites, which triggered further monitoring
and remediation where necessary in accordance with
VicTrack’s Contaminated Land Management Plan.
South Dynon remediation
Groundwater remediation works at the South Dynon
Rail Yards continued to safely remove the diesel light
non-aqueous phase plume of contamination beneath
the site, with about 4,800 litres removed from the
groundwater through active total fluid remediation
in 2015-16.
Queenscliff soil remediation
VicTrack removed approximately 30 tonne of asbestos
contaminated soil from beneath a Monterey Cypress
pine at the Bellarine Tourist Rail site located in
Queenscliff, and the land was reinstated.
2015-16 Annual Report 31
Safer level and pedestrian crossings
VicTrack delivered a total of 14 level and pedestrian
crossing upgrades in 2015-16, including 11 under the
State Level Crossings Upgrade Program and three
under the Fix Country Crossing Program – with savings
achieved by VicTrack providing for upgrades of an
additional priority location at Goulds Lane, Middle Creek.
VicTrack also supported early design works for the
$50 million Safer Country Crossing Program, which
was set to upgrade 52 priority road and 25 priority
pedestrian locations carrying high-speed passenger
trains or a high number of heavy vehicles.
In 2016, VicTrack was also selected to deliver
construction works for 10 road and four pedestrian
safety upgrades during the first year of the program.
The works are to be delivered in 2016-17.
Most locations to be upgraded were on the Australian
Rail Track Corporation (ARTC) network, with a smaller
number of shared ARTC and V/Line locations. PTV
also asked VicTrack to complete the pedestrian design
works for year two of the program in order to assist
government in fast tracking works.
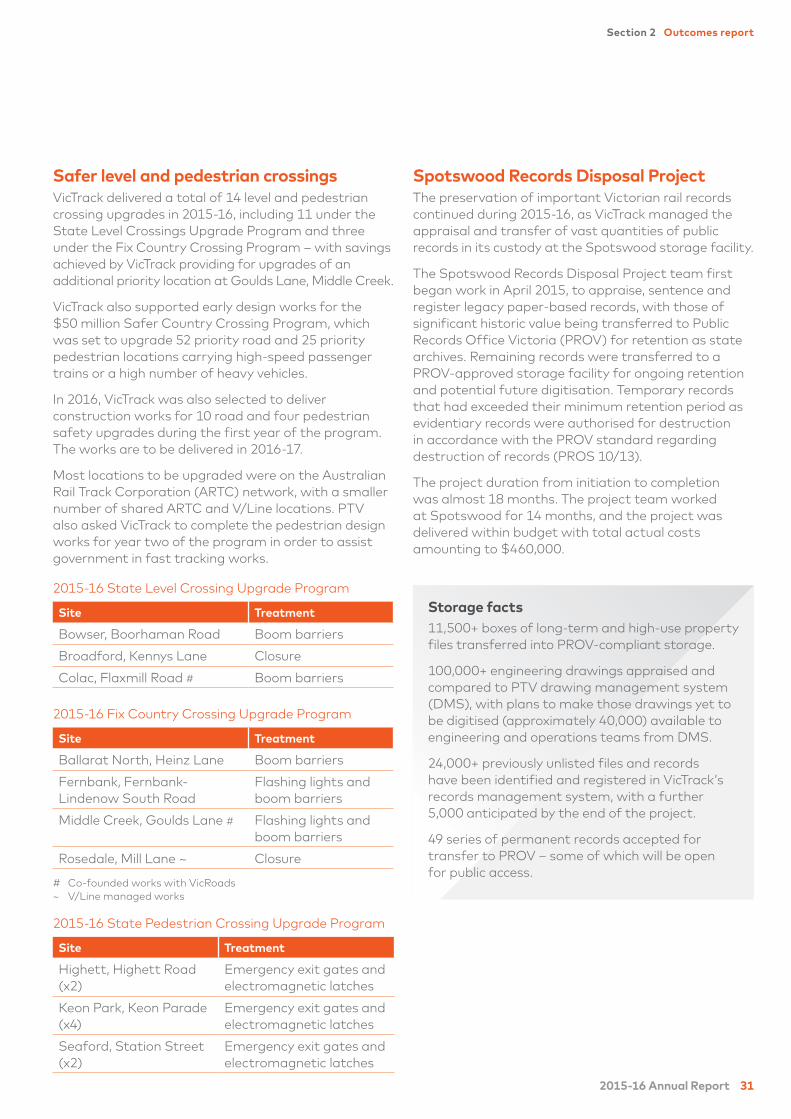
2015-16 State Level Crossing Upgrade Program
Site Treatment
Bowser, Boorhaman Road Boom barriers
Broadford, Kennys Lane Closure
Colac, Flaxmill Road # Boom barriers
2015-16 Fix Country Crossing Upgrade Program
Site Treatment
Ballarat North, Heinz Lane Boom barriers
Fernbank, Fernbank-
Lindenow South Road
Flashing lights and
boom barriers
Middle Creek, Goulds Lane # Flashing lights and
boom barriers
Rosedale, Mill Lane ~ Closure
# Co-founded works with VicRoads
~ V/Line managed works
2015-16 State Pedestrian Crossing Upgrade Program
Site Treatment
Highett, Highett Road
(x2)
Emergency exit gates and
electromagnetic latches
Keon Park, Keon Parade
(x4)
Emergency exit gates and
electromagnetic latches
Seaford, Station Street
(x2)
Emergency exit gates and
electromagnetic latches
Spotswood Records Disposal Project
The preservation of important Victorian rail records
continued during 2015-16, as VicTrack managed the
appraisal and transfer of vast quantities of public
records in its custody at the Spotswood storage facility.
The Spotswood Records Disposal Project team first
began work in April 2015, to appraise, sentence and
register legacy paper-based records, with those of
significant historic value being transferred to Public
Records Office Victoria (PROV) for retention as state
archives. Remaining records were transferred to a
PROV-approved storage facility for ongoing retention
and potential future digitisation. Temporary records
that had exceeded their minimum retention period as
evidentiary records were authorised for destruction
in accordance with the PROV standard regarding
destruction of records (PROS 10/13).
The project duration from initiation to completion
was almost 18 months. The project team worked
at Spotswood for 14 months, and the project was
delivered within budget with total actual costs
amounting to $460,000.
Storage facts
11,500+ boxes of long-term and high-use property
files transferred into PROV-compliant storage.
100,000+ engineering drawings appraised and
compared to PTV drawing management system
(DMS), with plans to make those drawings yet to
be digitised (approximately 40,000) available to
engineering and operations teams from DMS.
24,000+ previously unlisted files and records
have been identified and registered in VicTrack’s
records management system, with a further
5,000 anticipated by the end of the project.
49 series of permanent records accepted for
transfer to PROV – some of which will be open
for public access.
Section 2 Outcomes report
32 VicTrack
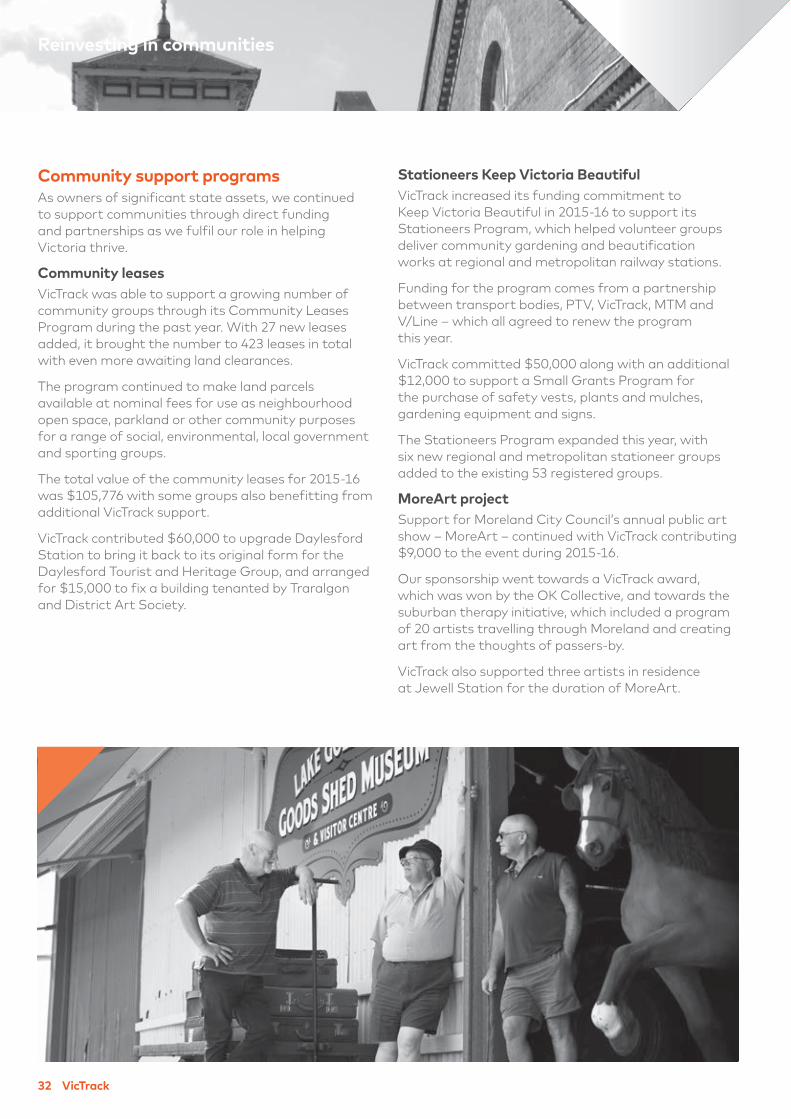
Community support programs
As owners of significant state assets, we continued
to support communities through direct funding
and partnerships as we fulfil our role in helping
Victoria thrive.
Community leases
VicTrack was able to support a growing number of
community groups through its Community Leases
Program during the past year. With 27 new leases
added, it brought the number to 423 leases in total
with even more awaiting land clearances.
The program continued to make land parcels
available at nominal fees for use as neighbourhood
open space, parkland or other community purposes
for a range of social, environmental, local government
and sporting groups.
The total value of the community leases for 2015-16
was $105,776 with some groups also benefitting from
additional VicTrack support.
VicTrack contributed $60,000 to upgrade Daylesford
Station to bring it back to its original form for the
Daylesford Tourist and Heritage Group, and arranged
for $15,000 to fix a building tenanted by Traralgon
and District Art Society.
Stationeers Keep Victoria Beautiful
VicTrack increased its funding commitment to
Keep Victoria Beautiful in 2015-16 to support its
Stationeers Program, which helped volunteer groups
deliver community gardening and beautification
works at regional and metropolitan railway stations.
Funding for the program comes from a partnership
between transport bodies, PTV, VicTrack, MTM and
V/Line – which all agreed to renew the program
this year.
VicTrack committed $50,000 along with an additional
$12,000 to support a Small Grants Program for
the purchase of safety vests, plants and mulches,
gardening equipment and signs.
The Stationeers Program expanded this year, with
six new regional and metropolitan stationeer groups
added to the existing 53 registered groups.
MoreArt project
Support for Moreland City Council’s annual public art
show – MoreArt – continued with VicTrack contributing
$9,000 to the event during 2015-16.
Our sponsorship went towards a VicTrack award,
which was won by the OK Collective, and towards the
suburban therapy initiative, which included a program
of 20 artists travelling through Moreland and creating
art from the thoughts of passers-by.
VicTrack also supported three artists in residence
at Jewell Station for the duration of MoreArt.
Reinvesting in communities
2015-16 Annual Report 33
Meeting the highest standards of
governance and financial management
are critical to our success, to ensure
we are equipped to meet the growing
demands on Victorian transport, and
make the most of VicTrack assets.
Section 3
Statutory
and financial
reporting
34 VicTrack
VicTrack is committed to high standards
of corporate governance because this
is in the best interests of VicTrack, the
Victorian Government, the Victorian
public and other stakeholders.
To achieve this, VicTrack has developed corporate
governance policies and structures having regard to
applicable statutory requirements and relevant best
practice recommendations.
Board role and responsibilities
The VicTrack Board of Directors is responsible for
the strategic oversight of VicTrack’s affairs, including
corporate governance practices and overall business
performance. The Directors are appointed by the
Governor-in-Council and are accountable to both
the Minister for Public Transport and the Treasurer.
The role and responsibilities of the Board are set out
in a formal Board Charter.
Each subsidiary company within the Rolling Stock
Holdings group of companies also has the same Board
of Directors with responsibility for the relevant company.
Board composition
At year end, the Board comprised eight independent,
non-executive Directors: John Lenders (Chair), Yehudi
Blacher (Deputy Chair), Brian Bulluss, David Hunter,
Michael Trumble, Geraldine Gray, Dr Collette Burke
and Paula Allen (appointed 1 April 2016). Former
Director Sam Andersen retired from the Board on
31 March 2016.
Each Director has wide experience across various
sectors and organisations and together they bring
a diverse range of knowledge and business expertise
to VicTrack.
Board meetings
In 2015-16, VicTrack held Board meetings monthly,
other than in November, January and May.
Board performance
In accordance with the Board Charter, the Board
conducts an annual review to evaluate its performance
and identify areas for improvement.
Delegation to management
Day-to-day management of VicTrack is delegated
to the Chief Executive and other senior managers
pursuant to a formal delegations policy. This policy
is reviewed annually by the Board.
Board committees
Five Board committees assisted the Board to
perform its role during the year. Each is chaired
by a Director and has a formal charter setting
out its roles and responsibilities.
At year end, the members of the
Board sub-committees were:
Audit & Risk Management Committee
David Hunter (Chair), Brian Bulluss, Geraldine Gray
and Paula Allen.
Remuneration & Human Resources Committee
John Lenders (Chair), Yehudi Blacher and
Geraldine Gray.
Property, Environment & Heritage Committee
Michael Trumble (Chair), David Hunter and
Yehudi Blacher.
Telecommunications Committee
Brian Bulluss (Chair,) Collette Burke and Randall Straw
(non-director member).
Freight Logistics Committee
Yehudi Blacher (Chair), David Hunter and John Lenders.
VicTrack’s Heritage Advisory Panel
(Consisting of David Hunter (Chair), Sam Andersen,
Dimity Reed (non-director member, heritage architect)
and Martin Zweep (non-director member from
Heritage Victoria), held its last meeting on 25 March
2016 before it was disbanded and its role integrated
into the Property, Environment & Heritage Committee.
Statutory information
2015-16 Annual Report 35
Section 3 – Statutory and financial reporting
Corporate Plan
VicTrack is required, under the Transport Integration
Act 2010 (Vic) and the State Owned Enterprises
Act 1992, to prepare a corporate plan for Ministerial
approval. The purpose of the plan is to establish the
framework for business strategies and performance
monitoring, to be agreed between the Board, the
Minister for Public Transport and the Treasurer.
The corporate plan is prepared annually and covers
a four-year period starting from the current
financial year.
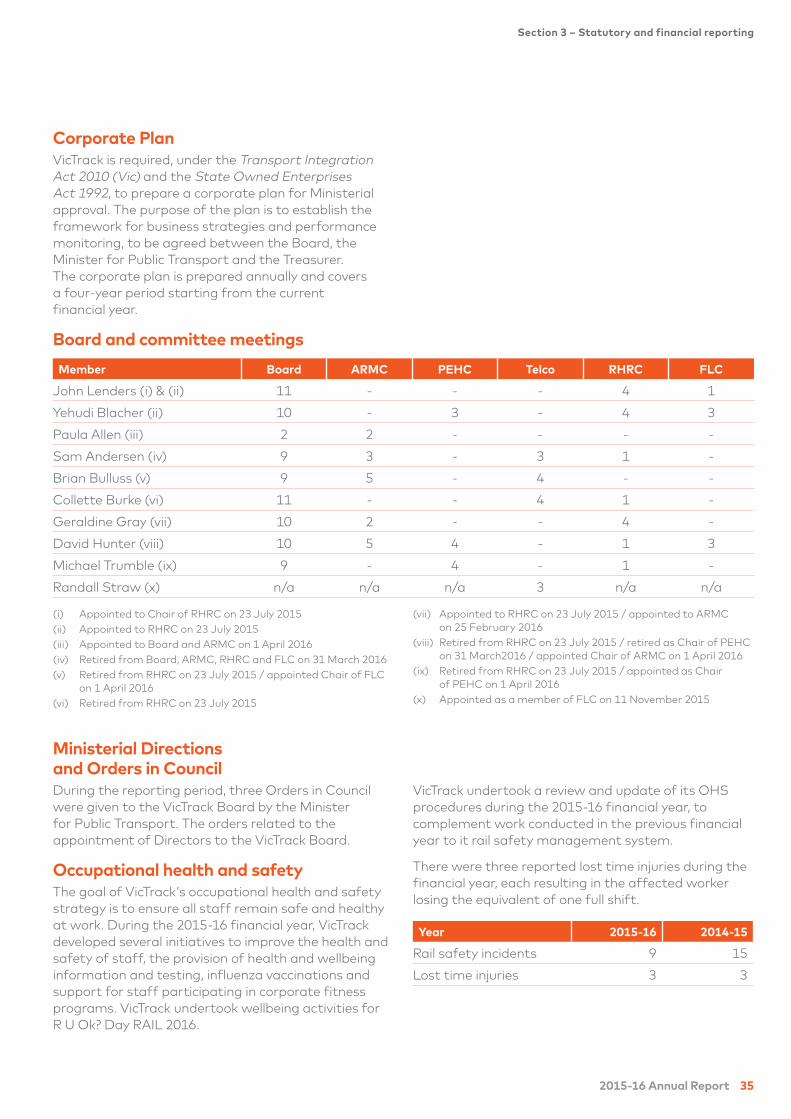
Board and committee meetings
Member Board ARMC PEHC Telco RHRC FLC
John Lenders (i) & (ii) 11 - - - 4 1
Yehudi Blacher (ii) 10 - 3 - 4 3
Paula Allen (iii) 2 2 - - - -
Sam Andersen (iv) 9 3 - 3 1 -
Brian Bulluss (v) 9 5 - 4 - -
Collette Burke (vi) 11 - - 4 1 -
Geraldine Gray (vii) 10 2 - - 4 -
David Hunter (viii) 10 5 4 - 1 3
Michael Trumble (ix) 9 - 4 - 1 -
Randall Straw (x) n/a n/a n/a 3 n/a n/a
(i) Appointed to Chair of RHRC on 23 July 2015
(ii) Appointed to RHRC on 23 July 2015
(iii) Appointed to Board and ARMC on 1 April 2016
(iv) Retired from Board, ARMC, RHRC and FLC on 31 March 2016
(v) Retired from RHRC on 23 July 2015 / appointed Chair of FLC
on 1 April 2016
(vi) Retired from RHRC on 23 July 2015
(vii) Appointed to RHRC on 23 July 2015 / appointed to ARMC
on 25 February 2016
(viii) Retired from RHRC on 23 July 2015 / retired as Chair of PEHC
on 31 March2016 / appointed Chair of ARMC on 1 April 2016
(ix) Retired from RHRC on 23 July 2015 / appointed as Chair
of PEHC on 1 April 2016
(x) Appointed as a member of FLC on 11 November 2015
Ministerial Directions
and Orders in Council
During the reporting period, three Orders in Council
were given to the VicTrack Board by the Minister
for Public Transport. The orders related to the
appointment of Directors to the VicTrack Board.
Occupational health and safety
The goal of VicTrack’s occupational health and safety
strategy is to ensure all staff remain safe and healthy
at work. During the 2015-16 financial year, VicTrack
developed several initiatives to improve the health and
safety of staff, the provision of health and wellbeing
information and testing, influenza vaccinations and
support for staff participating in corporate fitness
programs. VicTrack undertook wellbeing activities for
R U Ok? Day RAIL 2016.
VicTrack undertook a review and update of its OHS
procedures during the 2015-16 financial year, to
complement work conducted in the previous financial
year to it rail safety management system.
There were three reported lost time injuries during the
financial year, each resulting in the affected worker
losing the equivalent of one full shift.
Year 2015-16 2014-15
Rail safety incidents 9 15
Lost time injuries 3 3
36 VicTrack
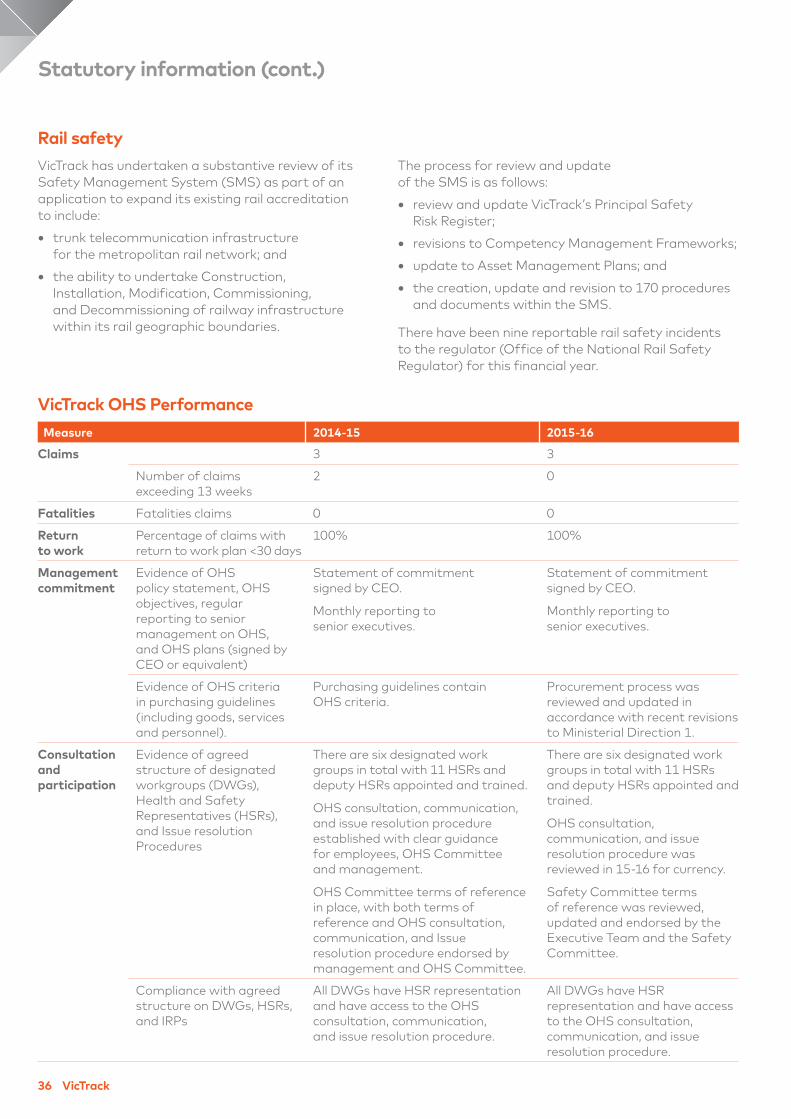
Rail safety
VicTrack has undertaken a substantive review of its
Safety Management System (SMS) as part of an
application to expand its existing rail accreditation
to include:
• trunk telecommunication infrastructure
for the metropolitan rail network; and
• the ability to undertake Construction,
Installation, Modification, Commissioning,
and Decommissioning of railway infrastructure
within its rail geographic boundaries.
The process for review and update
of the SMS is as follows:
• review and update VicTrack’s Principal Safety
Risk Register;
• revisions to Competency Management Frameworks;
• update to Asset Management Plans; and
• the creation, update and revision to 170 procedures
and documents within the SMS.
There have been nine reportable rail safety incidents
to the regulator (Office of the National Rail Safety
Regulator) for this financial year.
VicTrack OHS Performance
Measure 2014-15 2015-16
Claims 3 3
Number of claims
exceeding 13 weeks
2 0
Fatalities Fatalities claims 0 0
Return
to work
Percentage of claims with
return to work plan <30 days
100% 100%
Management
commitment
Evidence of OHS
policy statement, OHS
objectives, regular
reporting to senior
management on OHS,
and OHS plans (signed by
CEO or equivalent)
Statement of commitment
signed by CEO.
Monthly reporting to
senior executives.
Statement of commitment
signed by CEO.
Monthly reporting to
senior executives.
Evidence of OHS criteria
in purchasing guidelines
(including goods, services
and personnel).
Purchasing guidelines contain
OHS criteria.
Procurement process was
reviewed and updated in
accordance with recent revisions
to Ministerial Direction 1.
Consultation
and
participation
Evidence of agreed
structure of designated
workgroups (DWGs),
Health and Safety
Representatives (HSRs),
and Issue resolution
Procedures
There are six designated work
groups in total with 11 HSRs and
deputy HSRs appointed and trained.
OHS consultation, communication,
and issue resolution procedure
established with clear guidance
for employees, OHS Committee
and management.
OHS Committee terms of reference
in place, with both terms of
reference and OHS consultation,
communication, and Issue
resolution procedure endorsed by
management and OHS Committee.
There are six designated work
groups in total with 11 HSRs
and deputy HSRs appointed and
trained.
OHS consultation,
communication, and issue
resolution procedure was
reviewed in 15-16 for currency.
Safety Committee terms
of reference was reviewed,
updated and endorsed by the
Executive Team and the Safety
Committee.
Compliance with agreed
structure on DWGs, HSRs,
and IRPs
All DWGs have HSR representation
and have access to the OHS
consultation, communication,
and issue resolution procedure.
All DWGs have HSR
representation and have access
to the OHS consultation,
communication, and issue
resolution procedure.
Statutory information (cont.)
2015-16 Annual Report 37
Section 3 – Statutory and financial reporting
Employment and conduct principles
VicTrack is committed to applying equity principles
when appointing staff. Selection processes ensure that
applicants are assessed and evaluated fairly and on the
basis of key selection criteria and other accountabilities
without discrimination. Employees have been correctly
classified in workforce data collection.
Workforce inclusion policy
VicTrack is working towards creating a balanced
working environment where equal opportunity
and diversity are valued. VicTrack has developed
a Diversity Policy and, in 2016-17, will be developing
a Diversity Strategy to include gender targets.
VicTrack’s current gender profile is 74 per cent male
and 26 per cent female.
Workforce data
Public administration values
and employment principles
The Victorian Government established the Victorian
Public Sector Commission (VPSC) replacing the State
Services Authority, with effect from 1 April 2016.
VicTrack continues to implement the directions of the
VPSC (and former SSA) with respect to fostering
public sector professionalism and integrity, upholding
public sector conduct, managing and valuing diversity,
managing under performance, reviewing personal
grievances and selecting on merit.
In 2015-16, VicTrack is reviewing its suite of
employment policies, including policies with respect
to grievance resolution, recruitment, managing
underperformance, discipline and managing diversity.
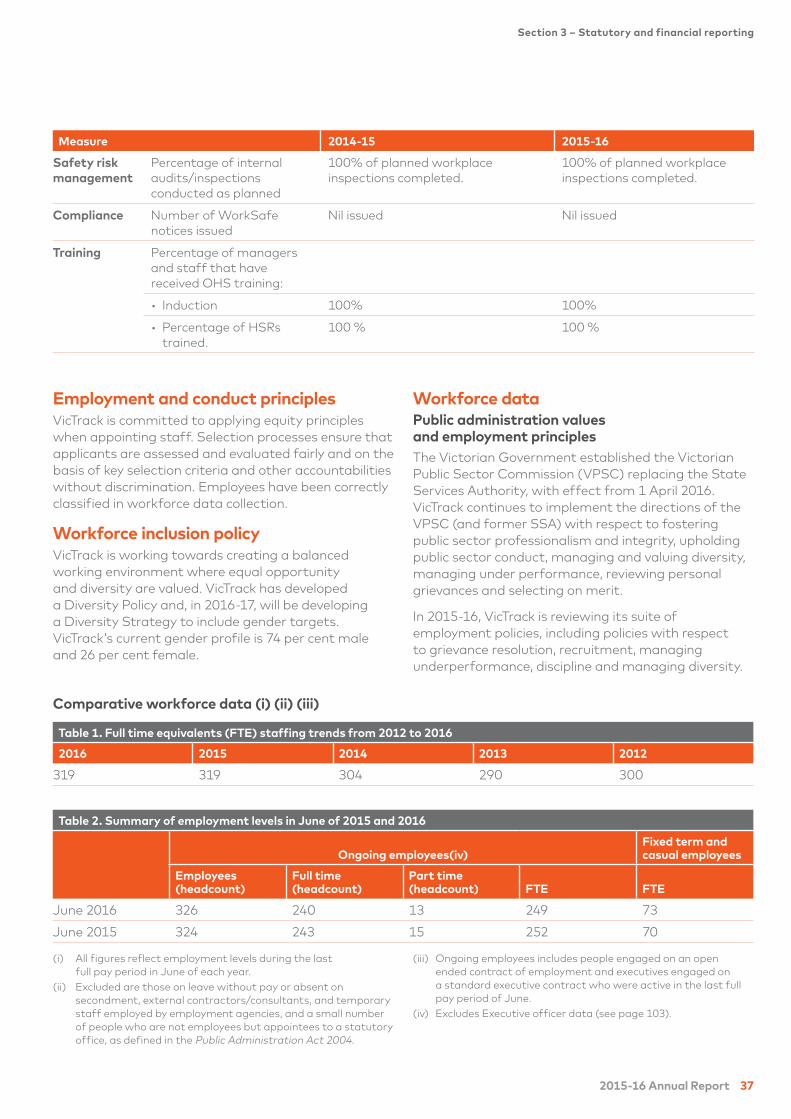
Comparative workforce data (i) (ii) (iii)
Table 1. Full time equivalents (FTE) staffing trends from 2012 to 2016
2016 2015 2014 2013 2012
319 319 304 290 300
Table 2. Summary of employment levels in June of 2015 and 2016
Ongoing employees(iv)
Fixed term and
casual employees
Employees
(headcount)
Full time
(headcount)
Part time
(headcount) FTE FTE
June 2016 326 240 13 249 73
June 2015 324 243 15 252 70
(i) All figures reflect employment levels during the last
full pay period in June of each year.
(ii) Excluded are those on leave without pay or absent on
secondment, external contractors/consultants, and temporary
staff employed by employment agencies, and a small number
of people who are not employees but appointees to a statutory
office, as defined in the Public Administration Act 2004.
(iii) Ongoing employees includes people engaged on an open
ended contract of employment and executives engaged on
a standard executive contract who were active in the last full
pay period of June.
(iv) Excludes Executive officer data (see page 103).
Measure 2014-15 2015-16
Safety risk
management
Percentage of internal
audits/inspections
conducted as planned
100% of planned workplace
inspections completed.
100% of planned workplace
inspections completed.
Compliance Number of WorkSafe
notices issued
Nil issued Nil issued
Training Percentage of managers
and staff that have
received OHS training:
• Induction 100% 100%
• Percentage of HSRs
trained.
100 % 100 %
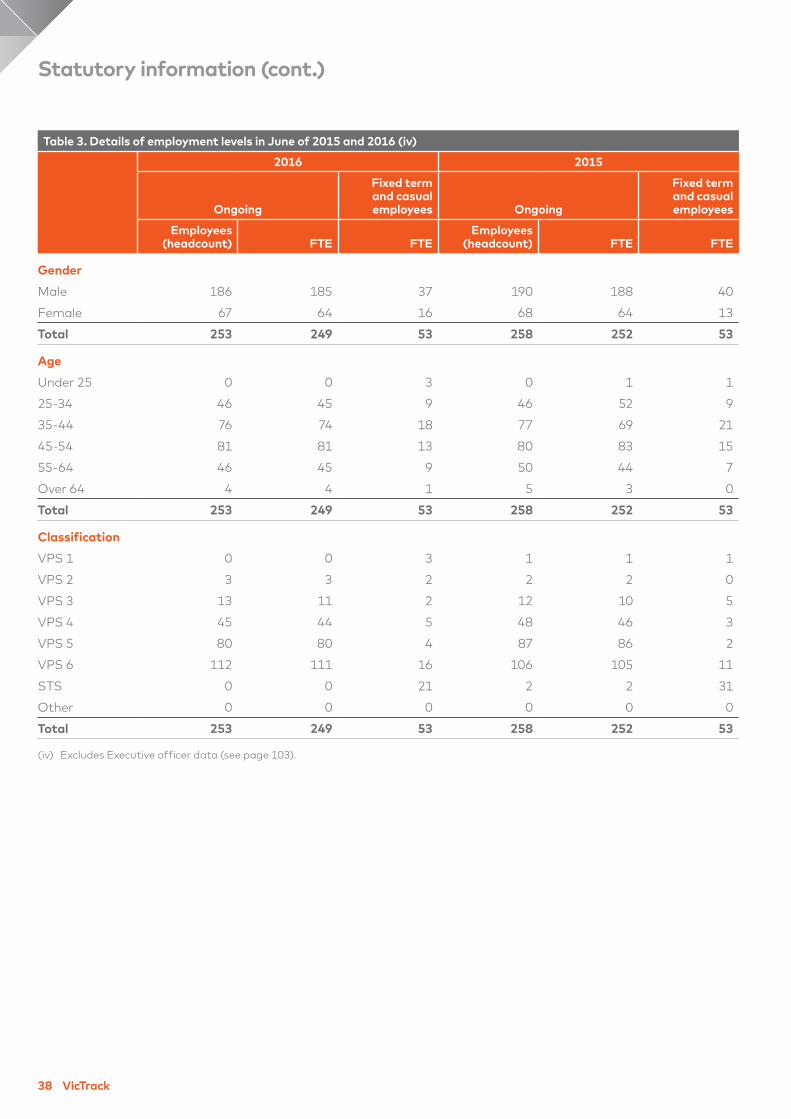
38 VicTrack
Table 3. Details of employment levels in June of 2015 and 2016 (iv)
2016 2015
Ongoing
Fixed term
and casual
employees Ongoing
Fixed term
and casual
employees
Employees
(headcount) FTE FTE
Employees
(headcount) FTE FTE
Gender
Male 186 185 37 190 188 40
Female 67 64 16 68 64 13
Total 253 249 53 258 252 53
Age
Under 25 0 0 3 0 1 1
25-34 46 45 9 46 52 9
35-44 76 74 18 77 69 21
45-54 81 81 13 80 83 15
55-64 46 45 9 50 44 7
Over 64 4 4 1 5 3 0
Total 253 249 53 258 252 53
Classification
VPS 1 0 0 3 1 1 1
VPS 2 3 3 2 2 2 0
VPS 3 13 11 2 12 10 5
VPS 4 45 44 5 48 46 3
VPS 5 80 80 4 87 86 2
VPS 6 112 111 16 106 105 11
STS 0 0 21 2 2 31
Other 0 0 0 0 0 0
Total 253 249 53 258 252 53
(iv) Excludes Executive officer data (see page 103).
Statutory information (cont.)
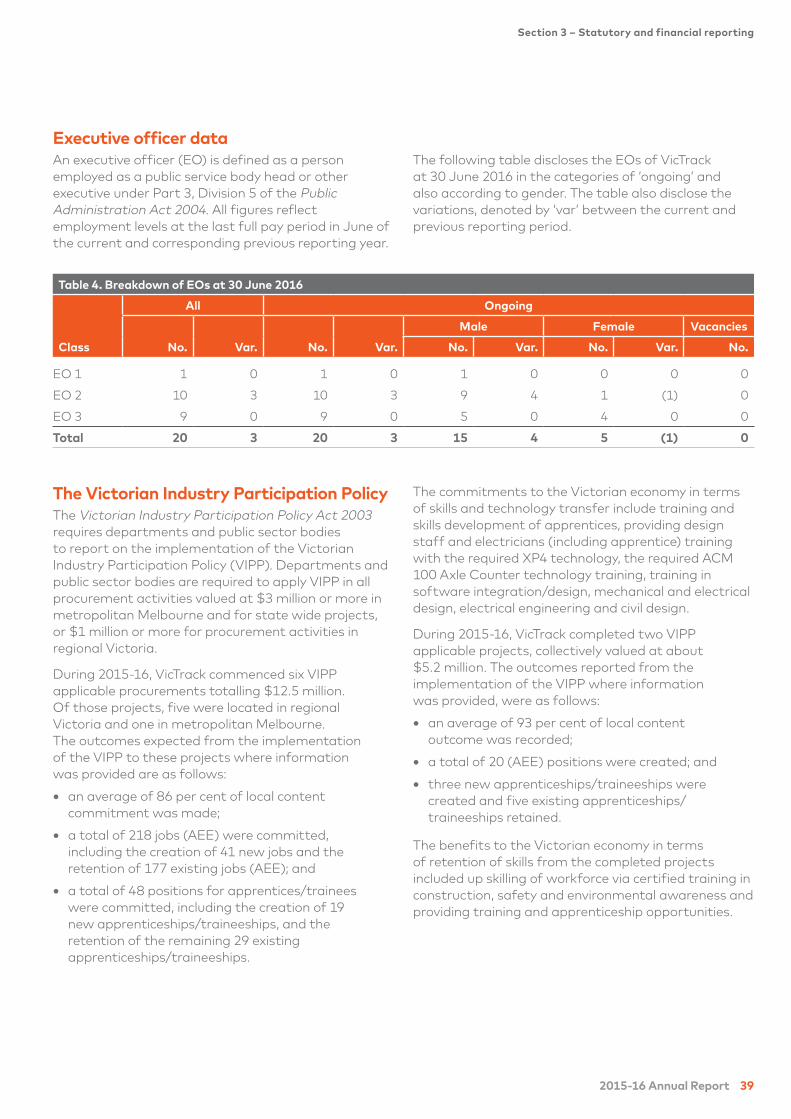
2015-16 Annual Report 39
Section 3 – Statutory and financial reporting
The Victorian Industry Participation Policy
The Victorian Industry Participation Policy Act 2003
requires departments and public sector bodies
to report on the implementation of the Victorian
Industry Participation Policy (VIPP). Departments and
public sector bodies are required to apply VIPP in all
procurement activities valued at $3 million or more in
metropolitan Melbourne and for state wide projects,
or $1 million or more for procurement activities in
regional Victoria.
During 2015-16, VicTrack commenced six VIPP
applicable procurements totalling $12.5 million.
Of those projects, five were located in regional
Victoria and one in metropolitan Melbourne.
The outcomes expected from the implementation
of the VIPP to these projects where information
was provided are as follows:
• an average of 86 per cent of local content
commitment was made;
• a total of 218 jobs (AEE) were committed,
including the creation of 41 new jobs and the
retention of 177 existing jobs (AEE); and
• a total of 48 positions for apprentices/trainees
were committed, including the creation of 19
new apprenticeships/traineeships, and the
retention of the remaining 29 existing
apprenticeships/traineeships.
The commitments to the Victorian economy in terms
of skills and technology transfer include training and
skills development of apprentices, providing design
staff and electricians (including apprentice) training
with the required XP4 technology, the required ACM
100 Axle Counter technology training, training in
software integration/design, mechanical and electrical
design, electrical engineering and civil design.
During 2015-16, VicTrack completed two VIPP
applicable projects, collectively valued at about
$5.2 million. The outcomes reported from the
implementation of the VIPP where information
was provided, were as follows:
• an average of 93 per cent of local content
outcome was recorded;
• a total of 20 (AEE) positions were created; and
• three new apprenticeships/traineeships were
created and five existing apprenticeships/
traineeships retained.
The benefits to the Victorian economy in terms
of retention of skills from the completed projects
included up skilling of workforce via certified training in
construction, safety and environmental awareness and
providing training and apprenticeship opportunities.
Executive officer data
An executive officer (EO) is defined as a person
employed as a public service body head or other
executive under Part 3, Division 5 of the Public
Administration Act 2004. All figures reflect
employment levels at the last full pay period in June of
the current and corresponding previous reporting year.
The following table discloses the EOs of VicTrack
at 30 June 2016 in the categories of ‘ongoing’ and
also according to gender. The table also disclose the
variations, denoted by ‘var’ between the current and
previous reporting period.
Table 4. Breakdown of EOs at 30 June 2016
Class
All Ongoing
No. Var. No. Var.
Male Female Vacancies
No. Var. No. Var. No.
EO 1 1 0 1 0 1 0 0 0 0
EO 2 10 3 10 3 9 4 1 (1) 0
EO 3 9 0 9 0 5 0 4 0 0
Total 20 3 20 3 15 4 5 (1) 0
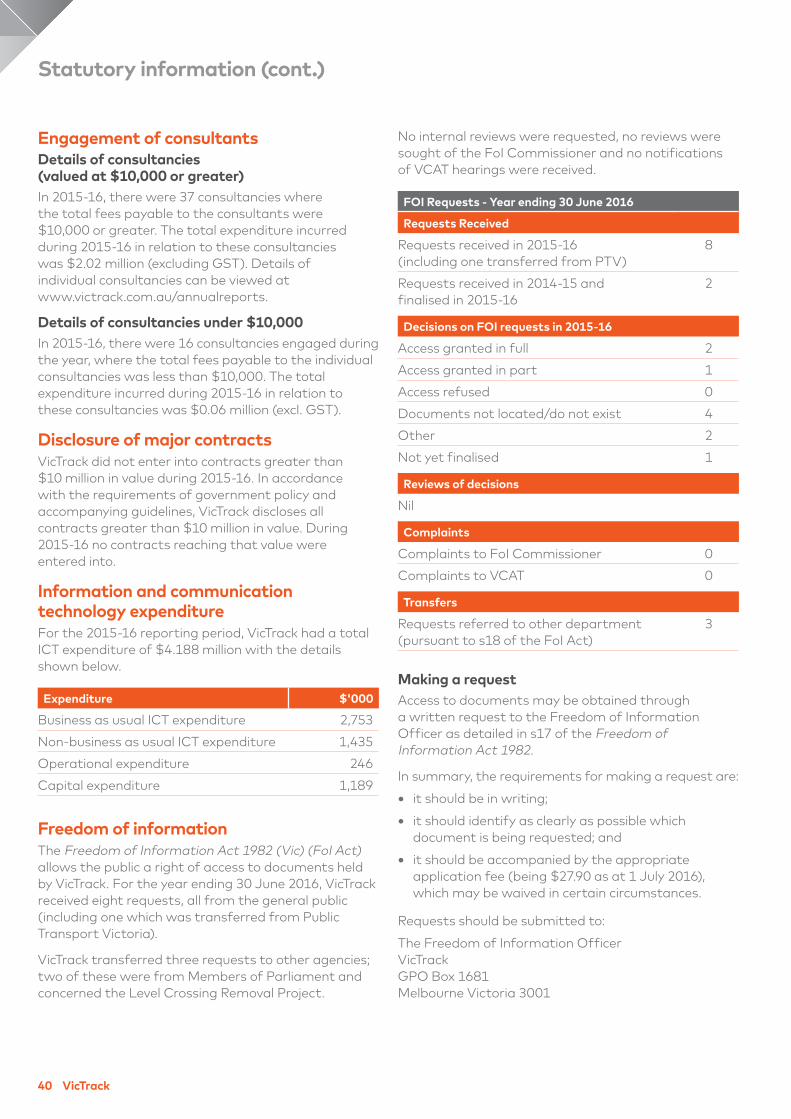
40 VicTrack
Engagement of consultants
Details of consultancies
(valued at $10,000 or greater)
In 2015-16, there were 37 consultancies where
the total fees payable to the consultants were
$10,000 or greater. The total expenditure incurred
during 2015-16 in relation to these consultancies
was $2.02 million (excluding GST). Details of
individual consultancies can be viewed at
www.victrack.com.au/annualreports.
Details of consultancies under $10,000
In 2015-16, there were 16 consultancies engaged during
the year, where the total fees payable to the individual
consultancies was less than $10,000. The total
expenditure incurred during 2015-16 in relation to
these consultancies was $0.06 million (excl. GST).
Disclosure of major contracts
VicTrack did not enter into contracts greater than
$10 million in value during 2015-16. In accordance
with the requirements of government policy and
accompanying guidelines, VicTrack discloses all
contracts greater than $10 million in value. During
2015-16 no contracts reaching that value were
entered into.
Information and communication
technology expenditure
For the 2015-16 reporting period, VicTrack had a total
ICT expenditure of $4.188 million with the details
shown below.
Expenditure $'000
Business as usual ICT expenditure 2,753
Non-business as usual ICT expenditure 1,435
Operational expenditure 246
Capital expenditure 1,189
Freedom of information
The Freedom of Information Act 1982 (Vic) (FoI Act)
allows the public a right of access to documents held
by VicTrack. For the year ending 30 June 2016, VicTrack
received eight requests, all from the general public
(including one which was transferred from Public
Transport Victoria).
VicTrack transferred three requests to other agencies;
two of these were from Members of Parliament and
concerned the Level Crossing Removal Project.
No internal reviews were requested, no reviews were
sought of the FoI Commissioner and no notifications
of VCAT hearings were received.
FOI Requests - Year ending 30 June 2016
Requests Received
Requests received in 2015-16
(including one transferred from PTV)
8
Requests received in 2014-15 and
finalised in 2015-16
2
Decisions on FOI requests in 2015-16
Access granted in full 2
Access granted in part 1
Access refused 0
Documents not located/do not exist 4
Other 2
Not yet finalised 1
Reviews of decisions
Nil
Complaints
Complaints to FoI Commissioner 0
Complaints to VCAT 0
Transfers
Requests referred to other department
(pursuant to s18 of the FoI Act)
3
Making a request
Access to documents may be obtained through
a written request to the Freedom of Information
Officer as detailed in s17 of the Freedom of
Information Act 1982.
In summary, the requirements for making a request are:
• it should be in writing;
• it should identify as clearly as possible which
document is being requested; and
• it should be accompanied by the appropriate
application fee (being $27.90 as at 1 July 2016),
which may be waived in certain circumstances.
Requests should be submitted to:
The Freedom of Information Officer
VicTrack
GPO Box 1681
Melbourne Victoria 3001
Statutory information (cont.)
2015-16 Annual Report 41
Section 3 – Statutory and financial reporting
Compliance with the Building Act 1993
VicTrack is working towards full compliance with the
building and maintenance provisions of the Building Act
1993 in relation to the buildings it owns. A compliance
program is in place in order to meet these requirements
and relevant guidelines.
National Competition Policy
Under the National Competition Policy, the guiding
legislative principle is that legislation, including future
legislative proposals, should not restrict competition
unless it can be demonstrated that: the benefits of
the restriction to the community as a whole outweigh
the costs the objectives of the legislation can only be
achieved by restricting competition.
Competitive neutrality requires government businesses
to ensure where services compete, or potentially
compete with the private sector, any advantage arising
solely from their government ownership be removed
if they are not in the public interest. Government
businesses are required to cost and price these services
as if they were privately owned and thus be fully cost
reflective. Competitive neutrality policy provides
government businesses with a tool to enhance
decisions on resource allocation. This policy does not
override other policy objectives of government and
focuses on efficiency in the provision of service.
In 2014, VicTrack’s policies and processes were updated
to ensure alignment with Victoria’s Competitive
Neutrality Policy. This was based on VicTrack’s 2014
review which found VicTrack’s business processes for
price determination are consistent with the Victorian
Competitive Neutrality Policy.
The infrastructure leases with Public Transport Victoria
provide for open access to Victoria’s rail infrastructure.
PTV sub-leases to national, regional and suburban
train and tram operators to facilitate the state’s open
access regime, fostering competition among intrastate
and interstate transport companies.
VicTrack also manages the Dynon Rail Freight Terminal.
Critical rail facilities fall within the Victorian rail access
regime and others compete on a commercial basis.
VicTrack has approached its other non-transport
opportunities within the framework of maintaining
an open track access regime. That is, no one party
is given exclusive rights to the rail corridor to the
detriment of competition.
Availability of information
In compliance with the requirements of the Standing
Directions of the Minister for Finance, details in respect
of the items listed below have been retained and are
available to relevant Ministers, Members of Parliament
and the public on request (subject to the freedom of
information requirements, if applicable):
a) a statement that declarations of pecuniary
interests have been duly completed by all
relevant officers;
b) details of shares held by a senior officer as nominee
or held beneficially in VicTrack or a subsidiary;
c) details of publications produced by VicTrack
itself and where they can be obtained;
d) details of changes in price, fees, charges, rates
and levies charged by VicTrack;
e) details of any major external reviews carried
out on VicTrack;
f) details of major research and development
activities undertaken by VicTrack;
g) details of overseas visits undertaken including
a summary of the objectives and outcomes of
each visit;
h) details of major promotional, public relations
and marketing activities undertaken by VicTrack
to develop community awareness of VicTrack
and its services;
i) details of assessments and measures
undertaken to improve the occupational
health and safety of employees;
j) a general statement on industrial relations
within VicTrack and details of time lost through
industrial accidents and disputes;
k) a list of major committees sponsored by VicTrack,
the purposes of each committee and the extent
to which the purposes have been achieved; and
l) details of all consultancies and contractors,
including consultants/contractors engaged,
services provided and expenditure committed
to for each engagement.
The information is available on request from the
Company Secretary at the address on back cover
of this report.
42 VicTrack
Compliance with the Protected Disclosure
Act 2012 (formerly the Whistleblowers
Protection Act 2001)
The Protected Disclosure Act 2012 encourages and
assists people in making disclosures of improper
conduct by public officers and public bodies. The Act
provides protection to people who make disclosures in
accordance with the Act and establishes a system for
the matters disclosed to be investigated and rectifying
action to be taken.
VicTrack does not tolerate improper conduct by
employees, or the taking of reprisals against those who
come forward to disclose such conduct. It is committed
to ensuring transparency and accountability in its
administrative and management practices and supports
the making of disclosures that reveal corrupt conduct,
conduct involving a substantial mismanagement of
public resources, or conduct involving a substantial risk
to public health and safety or the environment.
VicTrack will take all reasonable steps to protect people
who make such disclosures from any detrimental
action in reprisal for making the disclosure. It will also
afford natural justice to the person who is the subject
of the disclosure to the extent it is legally possible.
Disclosures of improper conduct or detrimental action
by VicTrack or any of its employees and/or officers may
also be made directly to the Independent Broad-Based
Anti-Corruption Commission:
Level 1, North Tower, 459 Collins Street
Melbourne Victoria 3000
Internet: www.ibac.vic.gov.au which has a secure
form for making anonymous complaints.
Alternatively, disclosures of improper conduct or
detrimental action by VicTrack or any of its employees
and/or officers may be made to:
• the Protected Disclosure Coordinator, being the
General Counsel and Company Secretary;
• the Chief Executive;
• a manager or supervisor of a VicTrack employee
who chooses to make a disclosure; and
• a manager or supervisor of a VicTrack employee
about whom a disclosure has been made.
However, a person that discloses improper conduct
or detrimental action by VicTrack to the VicTrack
Protected Disclosure Coordinator may not be afforded
protection under the Act.
During the year, there were no disclosures
made to VicTrack, nor disclosed matters referred
to the Ombudsman.
Compliance with the Carers
Recognition Act 2012
VicTrack has taken all practical measures to comply
with its obligations under the Act. These include:
considering the carer relationships principles set out
in the Act when setting policies and providing services
including the flexible working and leave policies to
ensure that these comply with the statement of
principles in the Act.
Compliance with the Disability Act 2006
VicTrack has identified the need to provide a
Disability Action Plan. The plan is scheduled to be
developed and implemented, along with diversity
initiatives, in 2015-16.
Office based environmental impacts
VicTrack previously reported against FRD 24C for
the first time in 2014-15. VicTrack’s Environment and
Sustainability Strategy was endorsed by the Executive
Team and the Property and Environment Heritage
Committee in 2016, with implementation across the
organisation currently underway. The strategy had
three focus areas, aligned to VicTrack’s Corporate
Plan. As part of the strategy, an environmental
management system (EMS) would be developed and
rolled out to meet government requirements, and to
reduce environmental impact. Part of the EMS would
focus on office based activities in the areas of energy
use, waste production, paper use, water consumption,
transportation fuel consumption, greenhouse gas
emissions and sustainable procurement. Other areas
relating to understanding and reducing office based
environmental impacts will also be considered.
VicTrack was currently looking at its accommodation
to consolidate employees into fewer buildings, which
would possibly impact reduction targets on some
office based environmental impacts.
VicTrack’s greenhouse gas inventory has been prepared
using The National Greenhouse Accounts Factors
updated by the Australian Government’s Department
of Environment in August 2015.
Statutory information (cont.)
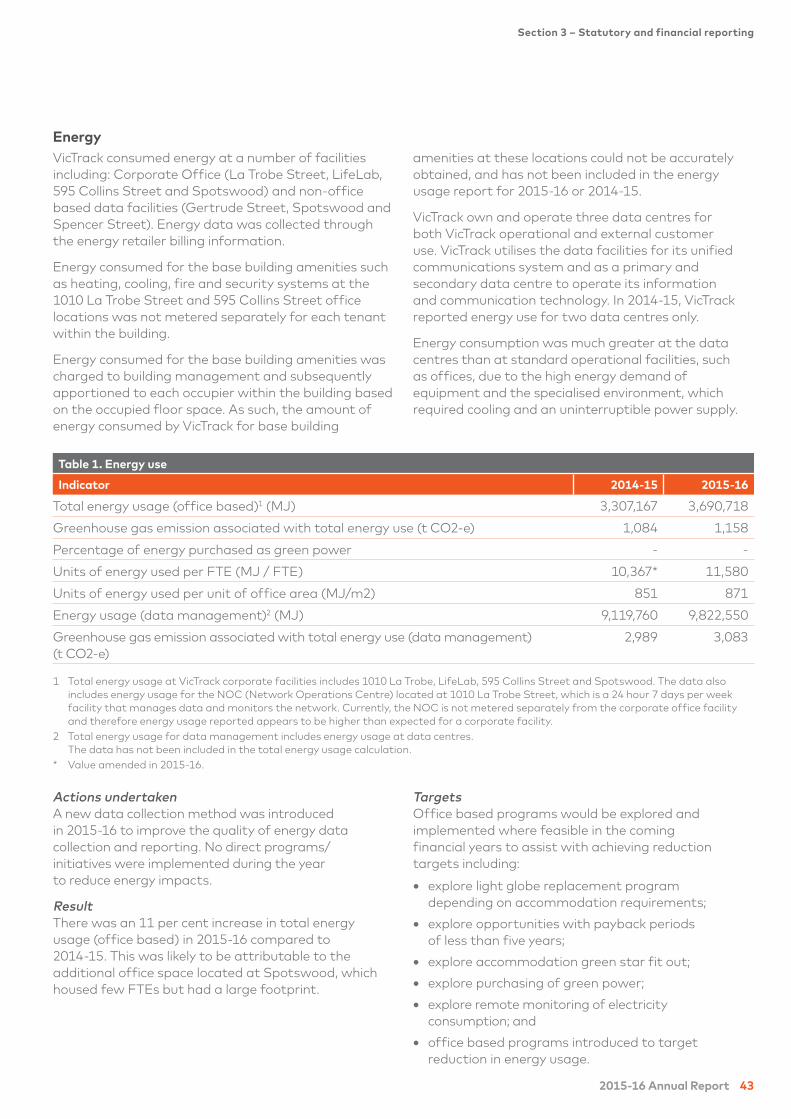
2015-16 Annual Report 43
Section 3 – Statutory and financial reporting
Energy
VicTrack consumed energy at a number of facilities
including: Corporate Office (La Trobe Street, LifeLab,
595 Collins Street and Spotswood) and non-office
based data facilities (Gertrude Street, Spotswood and
Spencer Street). Energy data was collected through
the energy retailer billing information.
Energy consumed for the base building amenities such
as heating, cooling, fire and security systems at the
1010 La Trobe Street and 595 Collins Street office
locations was not metered separately for each tenant
within the building.
Energy consumed for the base building amenities was
charged to building management and subsequently
apportioned to each occupier within the building based
on the occupied floor space. As such, the amount of
energy consumed by VicTrack for base building
amenities at these locations could not be accurately
obtained, and has not been included in the energy
usage report for 2015-16 or 2014-15.
VicTrack own and operate three data centres for
both VicTrack operational and external customer
use. VicTrack utilises the data facilities for its unified
communications system and as a primary and
secondary data centre to operate its information
and communication technology. In 2014-15, VicTrack
reported energy use for two data centres only.
Energy consumption was much greater at the data
centres than at standard operational facilities, such
as offices, due to the high energy demand of
equipment and the specialised environment, which
required cooling and an uninterruptible power supply.
Table 1. Energy use
Indicator 2014-15 2015-16
Total energy usage (office based)1 (MJ) 3,307,167 3,690,718
Greenhouse gas emission associated with total energy use (t CO2-e) 1,084 1,158
Percentage of energy purchased as green power - -
Units of energy used per FTE (MJ / FTE) 10,367* 11,580
Units of energy used per unit of office area (MJ/m2) 851 871
Energy usage (data management)2 (MJ) 9,119,760 9,822,550
Greenhouse gas emission associated with total energy use (data management)
(t CO2-e)
2,989 3,083
1 Total energy usage at VicTrack corporate facilities includes 1010 La Trobe, LifeLab, 595 Collins Street and Spotswood. The data also
includes energy usage for the NOC (Network Operations Centre) located at 1010 La Trobe Street, which is a 24 hour 7 days per week
facility that manages data and monitors the network. Currently, the NOC is not metered separately from the corporate office facility
and therefore energy usage reported appears to be higher than expected for a corporate facility.
2 Total energy usage for data management includes energy usage at data centres.
The data has not been included in the total energy usage calculation.
* Value amended in 2015-16.
Actions undertaken
A new data collection method was introduced
in 2015-16 to improve the quality of energy data
collection and reporting. No direct programs/
initiatives were implemented during the year
to reduce energy impacts.
Result
There was an 11 per cent increase in total energy
usage (office based) in 2015-16 compared to
2014-15. This was likely to be attributable to the
additional office space located at Spotswood, which
housed few FTEs but had a large footprint.
Targets
Office based programs would be explored and
implemented where feasible in the coming
financial years to assist with achieving reduction
targets including:
• explore light globe replacement program
depending on accommodation requirements;
• explore opportunities with payback periods
of less than five years;
• explore accommodation green star fit out;
• explore purchasing of green power;
• explore remote monitoring of electricity
consumption; and
• office based programs introduced to target
reduction in energy usage.
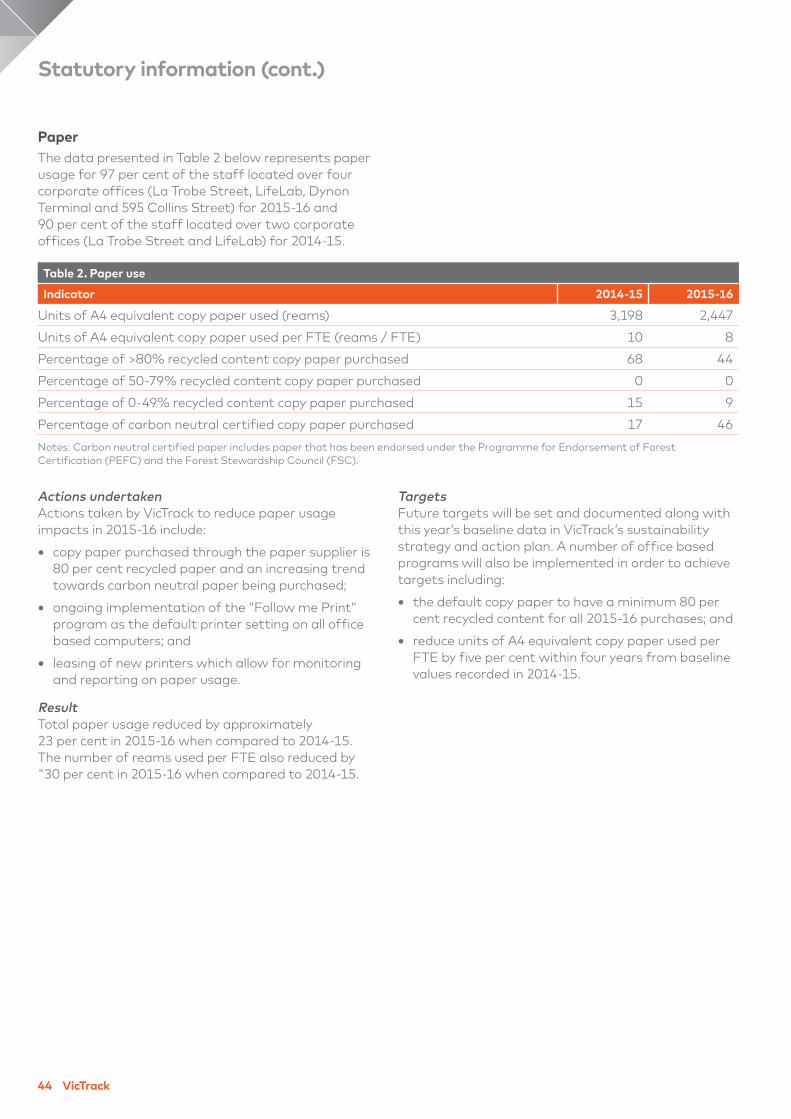
44 VicTrack
Paper
The data presented in Table 2 below represents paper
usage for 97 per cent of the staff located over four
corporate offices (La Trobe Street, LifeLab, Dynon
Terminal and 595 Collins Street) for 2015-16 and
90 per cent of the staff located over two corporate
offices (La Trobe Street and LifeLab) for 2014-15.
Table 2. Paper use
Indicator 2014-15 2015-16
Units of A4 equivalent copy paper used (reams) 3,198 2,447
Units of A4 equivalent copy paper used per FTE (reams / FTE) 10 8
Percentage of >80% recycled content copy paper purchased 68 44
Percentage of 50-79% recycled content copy paper purchased 0 0
Percentage of 0-49% recycled content copy paper purchased 15 9
Percentage of carbon neutral certified copy paper purchased 17 46
Notes: Carbon neutral certified paper includes paper that has been endorsed under the Programme for Endorsement of Forest
Certification (PEFC) and the Forest Stewardship Council (FSC).
Actions undertaken
Actions taken by VicTrack to reduce paper usage
impacts in 2015-16 include:
• copy paper purchased through the paper supplier is
80 per cent recycled paper and an increasing trend
towards carbon neutral paper being purchased;
• ongoing implementation of the “Follow me Print”
program as the default printer setting on all office
based computers; and
• leasing of new printers which allow for monitoring
and reporting on paper usage.
Result
Total paper usage reduced by approximately
23 per cent in 2015-16 when compared to 2014-15.
The number of reams used per FTE also reduced by
"30 per cent in 2015-16 when compared to 2014-15.
Targets
Future targets will be set and documented along with
this year’s baseline data in VicTrack’s sustainability
strategy and action plan. A number of office based
programs will also be implemented in order to achieve
targets including:
• the default copy paper to have a minimum 80 per
cent recycled content for all 2015-16 purchases; and
• reduce units of A4 equivalent copy paper used per
FTE by five per cent within four years from baseline
values recorded in 2014-15.
Statutory information (cont.)
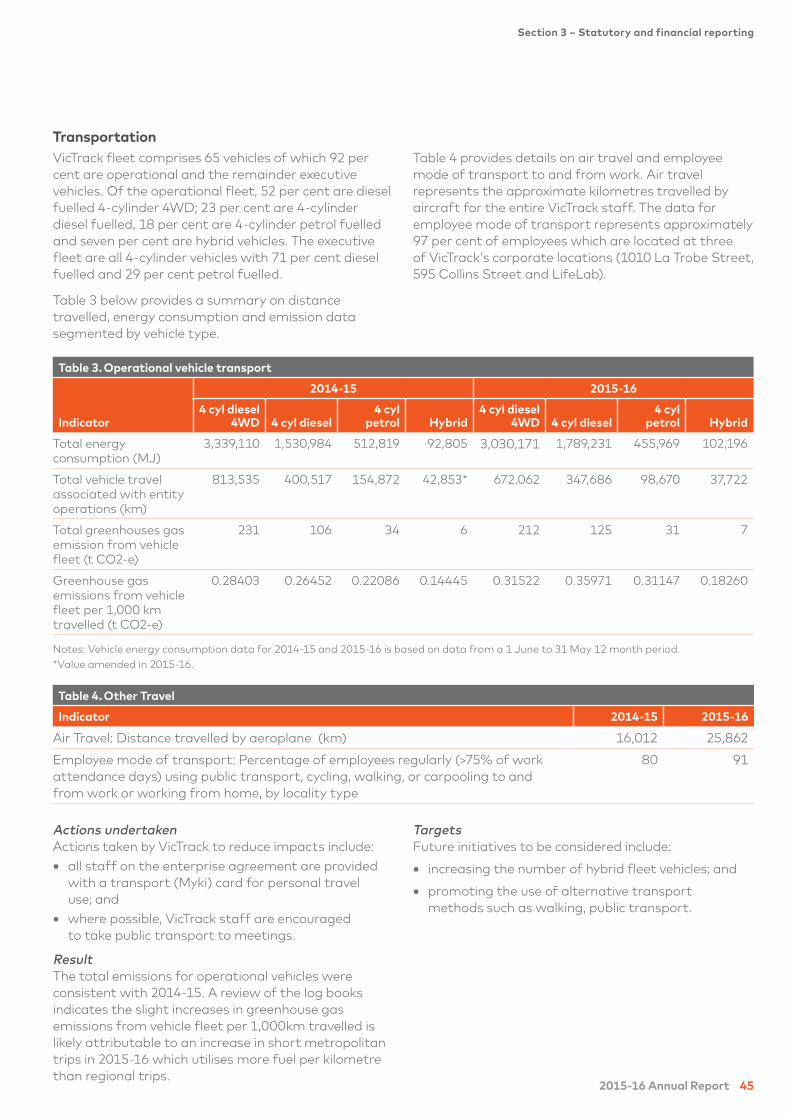
2015-16 Annual Report 45
Section 3 – Statutory and financial reporting
Table 3. Operational vehicle transport
Indicator
2014-15 2015-16
4 cyl diesel
4WD 4 cyl diesel
4 cyl
petrol Hybrid
4 cyl diesel
4WD 4 cyl diesel
4 cyl
petrol Hybrid
Total energy
consumption (MJ)
3,339,110 1,530,984 512,819 92,805 3,030,171 1,789,231 455,969 102,196
Total vehicle travel
associated with entity
operations (km)
813,535 400,517 154,872 42,853* 672,062 347,686 98,670 37,722
Total greenhouses gas
emission from vehicle
fleet (t CO2-e)
231 106 34 6 212 125 31 7
Greenhouse gas
emissions from vehicle
fleet per 1,000 km
travelled (t CO2-e)
0.28403 0.26452 0.22086 0.14445 0.31522 0.35971 0.31147 0.18260
Notes: Vehicle energy consumption data for 2014-15 and 2015-16 is based on data from a 1 June to 31 May 12 month period.
*Value amended in 2015-16.
Table 4. Other Travel
Indicator 2014-15 2015-16
Air Travel: Distance travelled by aeroplane (km) 16,012 25,862
Employee mode of transport: Percentage of employees regularly (>75% of work
attendance days) using public transport, cycling, walking, or carpooling to and
from work or working from home, by locality type
80 91
Actions undertaken
Actions taken by VicTrack to reduce impacts include:
• all staff on the enterprise agreement are provided
with a transport (Myki) card for personal travel
use; and
• where possible, VicTrack staff are encouraged
to take public transport to meetings.
Result
The total emissions for operational vehicles were
consistent with 2014-15. A review of the log books
indicates the slight increases in greenhouse gas
emissions from vehicle fleet per 1,000km travelled is
likely attributable to an increase in short metropolitan
trips in 2015-16 which utilises more fuel per kilometre
than regional trips.
Targets
Future initiatives to be considered include:
• increasing the number of hybrid fleet vehicles; and
• promoting the use of alternative transport
methods such as walking, public transport.
Transportation
VicTrack fleet comprises 65 vehicles of which 92 per
cent are operational and the remainder executive
vehicles. Of the operational fleet, 52 per cent are diesel
fuelled 4-cylinder 4WD; 23 per cent are 4-cylinder
diesel fuelled, 18 per cent are 4-cylinder petrol fuelled
and seven per cent are hybrid vehicles. The executive
fleet are all 4-cylinder vehicles with 71 per cent diesel
fuelled and 29 per cent petrol fuelled.
Table 3 below provides a summary on distance
travelled, energy consumption and emission data
segmented by vehicle type.
Table 4 provides details on air travel and employee
mode of transport to and from work. Air travel
represents the approximate kilometres travelled by
aircraft for the entire VicTrack staff. The data for
employee mode of transport represents approximately
97 per cent of employees which are located at three
of VicTrack’s corporate locations (1010 La Trobe Street,
595 Collins Street and LifeLab).
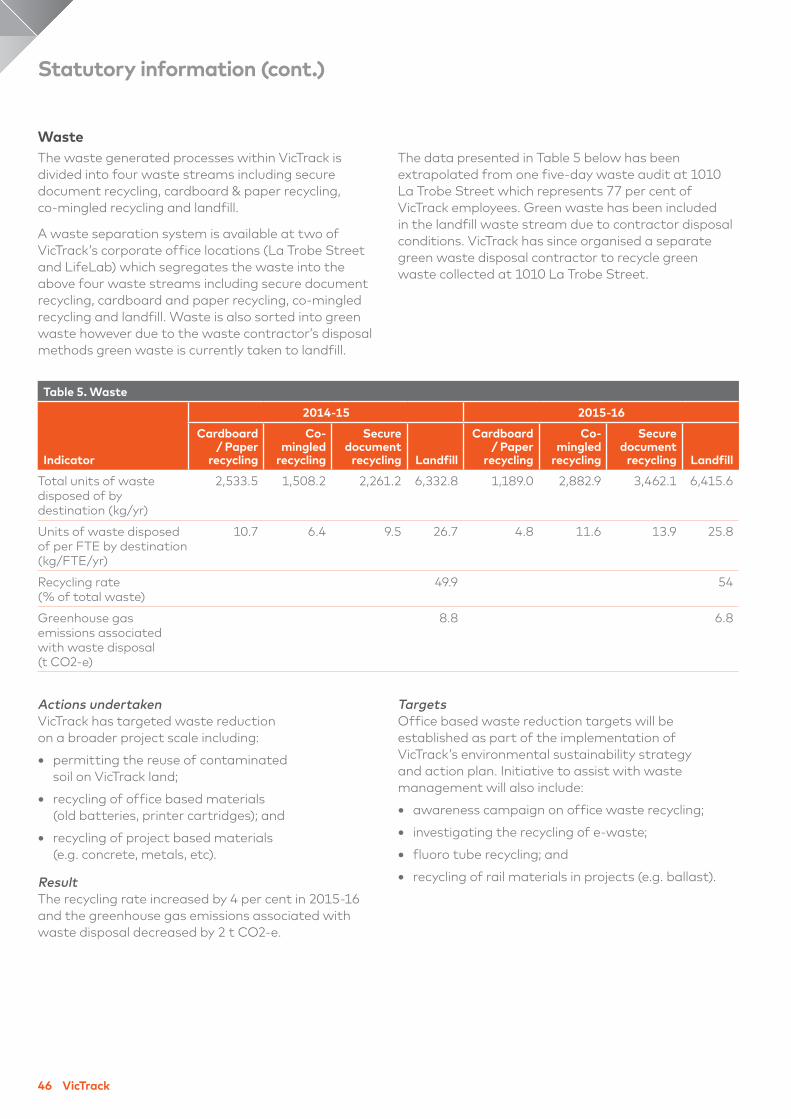
46 VicTrack
Targets
Office based waste reduction targets will be
established as part of the implementation of
VicTrack’s environmental sustainability strategy
and action plan. Initiative to assist with waste
management will also include:
• awareness campaign on office waste recycling;
• investigating the recycling of e-waste;
• fluoro tube recycling; and
• recycling of rail materials in projects (e.g. ballast).
Actions undertaken
VicTrack has targeted waste reduction
on a broader project scale including:
• permitting the reuse of contaminated
soil on VicTrack land;
• recycling of office based materials
(old batteries, printer cartridges); and
• recycling of project based materials
(e.g. concrete, metals, etc).
Result
The recycling rate increased by 4 per cent in 2015-16
and the greenhouse gas emissions associated with
waste disposal decreased by 2 t CO2-e.
Waste
The waste generated processes within VicTrack is
divided into four waste streams including secure
document recycling, cardboard & paper recycling,
co-mingled recycling and landfill.
A waste separation system is available at two of
VicTrack’s corporate office locations (La Trobe Street
and LifeLab) which segregates the waste into the
above four waste streams including secure document
recycling, cardboard and paper recycling, co-mingled
recycling and landfill. Waste is also sorted into green
waste however due to the waste contractor’s disposal
methods green waste is currently taken to landfill.
The data presented in Table 5 below has been
extrapolated from one five-day waste audit at 1010
La Trobe Street which represents 77 per cent of
VicTrack employees. Green waste has been included
in the landfill waste stream due to contractor disposal
conditions. VicTrack has since organised a separate
green waste disposal contractor to recycle green
waste collected at 1010 La Trobe Street.
Table 5. Waste
Indicator
2014-15 2015-16
Cardboard
/ Paper
recycling
Co-
mingled
recycling
Secure
document
recycling Landfill
Cardboard
/ Paper
recycling
Co-
mingled
recycling
Secure
document
recycling Landfill
Total units of waste
disposed of by
destination (kg/yr)
2,533.5 1,508.2 2,261.2 6,332.8 1,189.0 2,882.9 3,462.1 6,415.6
Units of waste disposed
of per FTE by destination
(kg/FTE/yr)
10.7 6.4 9.5 26.7 4.8 11.6 13.9 25.8
Recycling rate
(% of total waste)
49.9 54
Greenhouse gas
emissions associated
with waste disposal
(t CO2-e)
8.8 6.8
Statutory information (cont.)
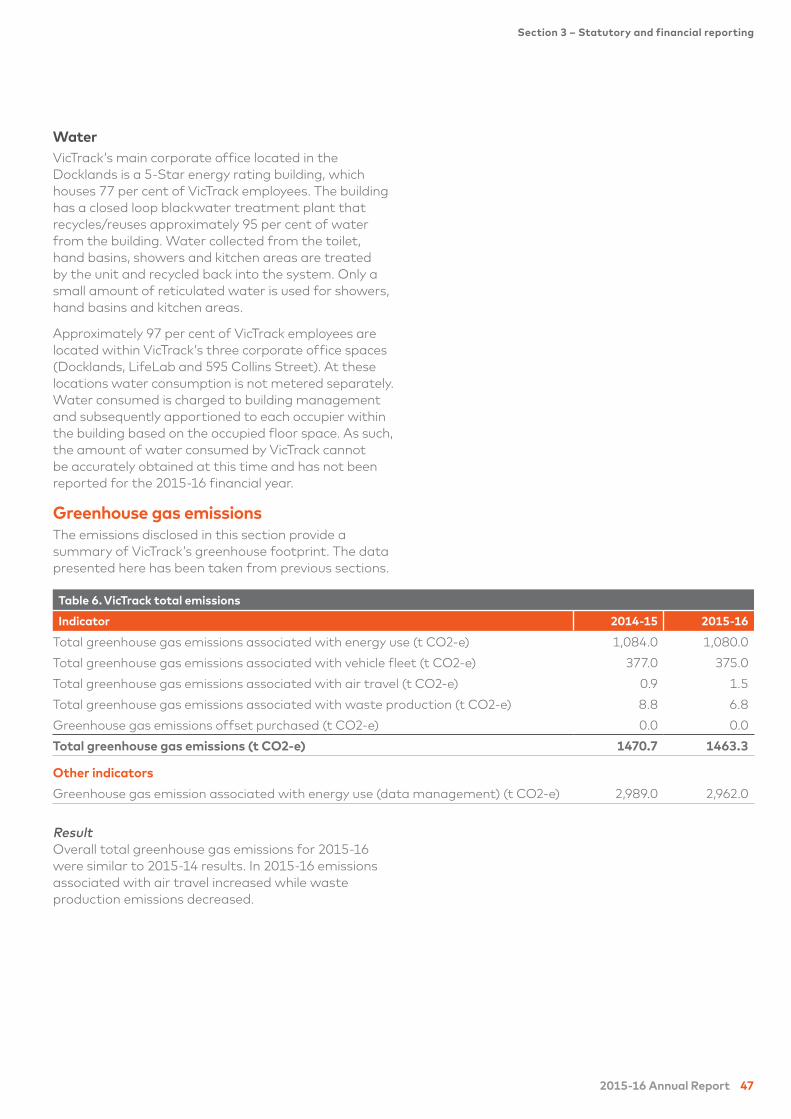
2015-16 Annual Report 47
Section 3 – Statutory and financial reporting
Water
VicTrack’s main corporate office located in the
Docklands is a 5-Star energy rating building, which
houses 77 per cent of VicTrack employees. The building
has a closed loop blackwater treatment plant that
recycles/reuses approximately 95 per cent of water
from the building. Water collected from the toilet,
hand basins, showers and kitchen areas are treated
by the unit and recycled back into the system. Only a
small amount of reticulated water is used for showers,
hand basins and kitchen areas.
Approximately 97 per cent of VicTrack employees are
located within VicTrack’s three corporate office spaces
(Docklands, LifeLab and 595 Collins Street). At these
locations water consumption is not metered separately.
Water consumed is charged to building management
and subsequently apportioned to each occupier within
the building based on the occupied floor space. As such,
the amount of water consumed by VicTrack cannot
be accurately obtained at this time and has not been
reported for the 2015-16 financial year.
Greenhouse gas emissions
The emissions disclosed in this section provide a
summary of VicTrack’s greenhouse footprint. The data
presented here has been taken from previous sections.
Table 6. VicTrack total emissions
Indicator 2014-15 2015-16
Total greenhouse gas emissions associated with energy use (t CO2-e) 1,084.0 1,080.0
Total greenhouse gas emissions associated with vehicle fleet (t CO2-e) 377.0 375.0
Total greenhouse gas emissions associated with air travel (t CO2-e) 0.9 1.5
Total greenhouse gas emissions associated with waste production (t CO2-e) 8.8 6.8
Greenhouse gas emissions offset purchased (t CO2-e) 0.0 0.0
Total greenhouse gas emissions (t CO2-e) 1470.7 1463.3
Other indicators
Greenhouse gas emission associated with energy use (data management) (t CO2-e) 2,989.0 2,962.0
Result
Overall total greenhouse gas emissions for 2015-16
were similar to 2015-14 results. In 2015-16 emissions
associated with air travel increased while waste
production emissions decreased.
48 VicTrack
Procurement
VicTrack procures both goods for office and field based
activities and services from contractors/consultants.
VicTrack has incorporated environmental requirements
into procurement decision making by:
• including schedules in tender documents that
require tenderers to disclose their environmental
management practices;
• including schedules in tender documents that
require tenderers to disclose any environmental
breaches that may have occurred;
• weighting of environmental considerations
as part of the tender review process;
• purchasing paper with a recycled content;
• developing an environmental sustainability strategy
which includes establishing green procurement
policies and purchasing standards; and
• establishing organisational workflows which require
business groups to consult with the environmental
group to determine project environmental impacts.
Enterprise risk management
VicTrack recognises there is uncertainty tied to its
activities, but through the application of effective risk
management the organisation can understand the
context of that uncertainty and adopt strategies to
both protect and create opportunity.
The Board and management are committed
to identifying and appropriately managing this
uncertainty and the resulting risk. The Board
committee structure, with a specialist Audit and
Risk Management Committee, is an important
part of risk management at VicTrack.
In addition, VicTrack maintains a comprehensive Risk
Management Program, founded on a framework that
meets international best practice. VicTrack conducts
regular reviews of identified risks and controls to
ensure risk is appropriately mitigated.
An internal audit program is carried out each year,
developed with regard to the risks identified through
the enterprise risk management process.
Risk management and insurance
compliance attestation
I, John Lenders, Chair of VicTrack, certify that VicTrack
has complied with the Ministerial Standing Direction
4.5.5 – Risk Management Framework and Processes
with the exception that there is partial compliance
with the new requirements for the management of
shared inter-agency risks.
Processes have been developed and partially
implemented to facilitate the identification and
management of inter-agency risks. Full implementation
of these processes will be achieved in the 2016-17
financial year.
The VicTrack Audit and Risk Management Committee
verifies this.
John Lenders
Chair
Victorian Rail Track (VicTrack)
18 August 2016
Compliance with DataVic Access Policy
Consistent with the DataVic Access Policy issued by
the Victorian Government in 2012, which requires
agencies to make datasets or databases accessible for
public use unless needing to be restricted for reasons
of privacy, public safety, security and law enforcement,
public health and compliance with the law, VicTrack
has not released, or identified for release, any dataset
or database.
Statutory information (cont.)
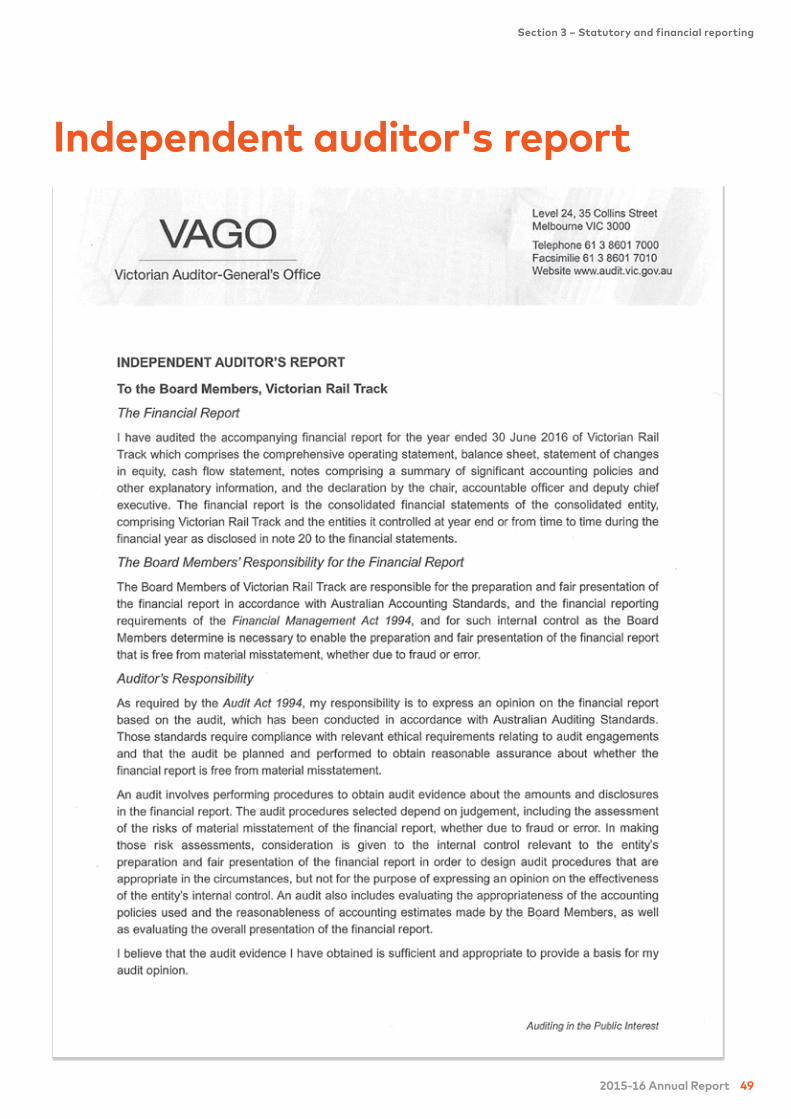
2015-16 Annual Report 49
Section 3 – Statutory and financial reporting
Independent auditor's report
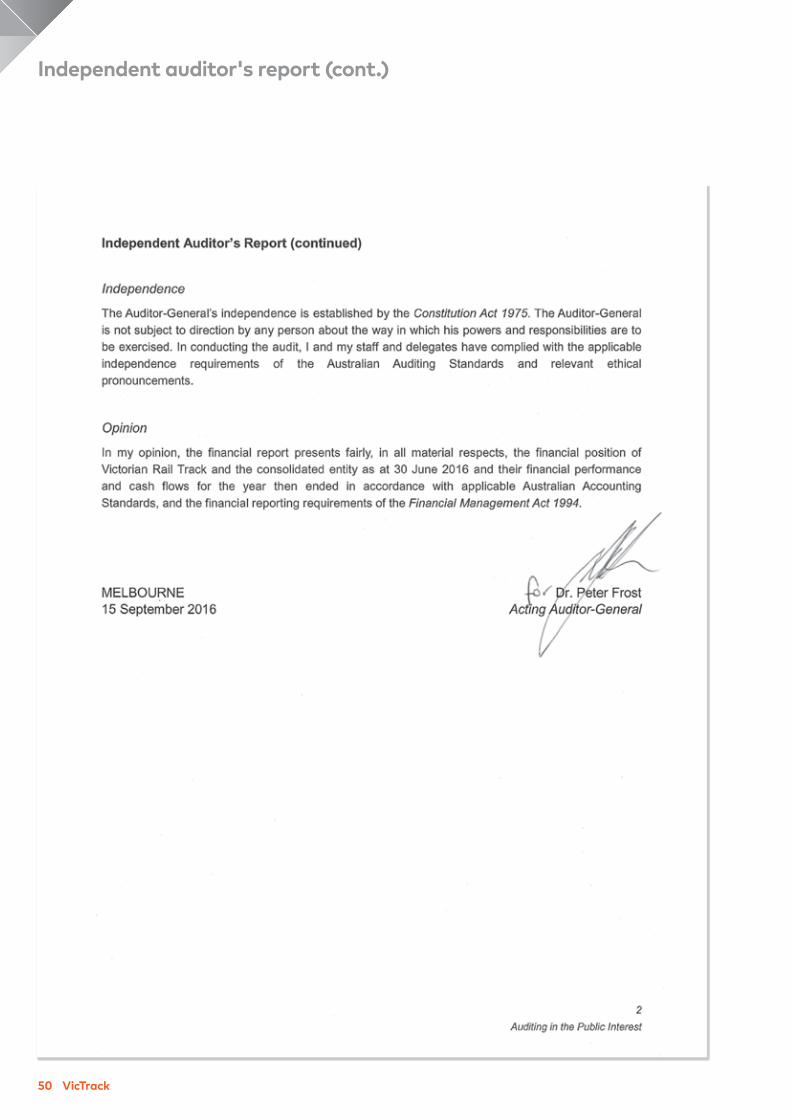
50 VicTrack
Independent auditor's report (cont.)
2015-16 Annual Report 51
Section 3 – Statutory and financial reporting
Statutory statement
Declaration by Chair, Accountable Officer and Deputy Chief Executive
30 June 2016
The attached financial statements for Victorian Rail Track (“VicTrack”) (as an individual entity and
the Consolidated Entity comprising VicTrack and its Controlled Entities) have been prepared in
accordance with Direction 4.2 of the Standing Directions of the Minister for Finance under the Financial
Management Act 1994, applicable Financial Reporting Directions, Australian Accounting Standards
including interpretations, and other mandatory professional reporting requirements.
We further state that, in our opinion, the information set out in the comprehensive operating statement,
balance sheet, statement of changes in equity, cashflow statement, and notes to and forming part of
the financial statements, presents fairly the financial transactions during the year ended 30 June 2016
and the financial position as at 30 June 2016 of VicTrack and the Consolidated Entity.
As at the time of signing we are not aware of any circumstance that would render any particulars
included in the financial statements to be misleading or inaccurate.
We authorise the attached financial statements for issue on 15 September 2016.
John Lenders
Chair
Dated: 15 September 2016
Campbell A. Rose
Chief Executive
Dated: 15 September 2016
Garry Button
Deputy Chief Executive
Dated: 15 September 2016
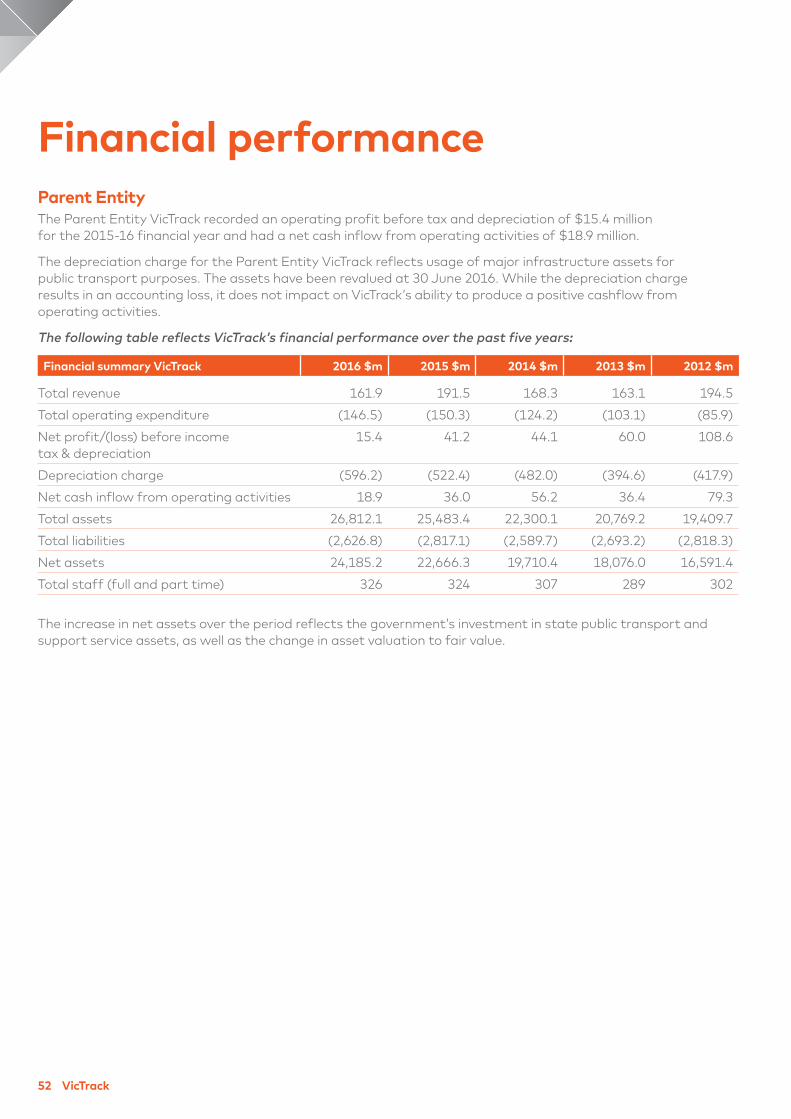
52 VicTrack
Financial performance
Parent Entity
The Parent Entity VicTrack recorded an operating profit before tax and depreciation of $15.4 million
for the 2015-16 financial year and had a net cash inflow from operating activities of $18.9 million.
The depreciation charge for the Parent Entity VicTrack reflects usage of major infrastructure assets for
public transport purposes. The assets have been revalued at 30 June 2016. While the depreciation charge
results in an accounting loss, it does not impact on VicTrack’s ability to produce a positive cashflow from
operating activities.
The following table reflects VicTrack’s financial performance over the past five years:
Financial summary VicTrack 2016 $m 2015 $m 2014 $m 2013 $m 2012 $m
Total revenue 161.9 191.5 168.3 163.1 194.5
Total operating expenditure (146.5) (150.3) (124.2) (103.1) (85.9)
Net profit/(loss) before income
tax & depreciation
15.4 41.2 44.1 60.0 108.6
Depreciation charge (596.2) (522.4) (482.0) (394.6) (417.9)
Net cash inflow from operating activities 18.9 36.0 56.2 36.4 79.3
Total assets 26,812.1 25,483.4 22,300.1 20,769.2 19,409.7
Total liabilities (2,626.8) (2,817.1) (2,589.7) (2,693.2) (2,818.3)
Net assets 24,185.2 22,666.3 19,710.4 18,076.0 16,591.4
Total staff (full and part time) 326 324 307 289 302
The increase in net assets over the period reflects the government’s investment in state public transport and
support service assets, as well as the change in asset valuation to fair value.
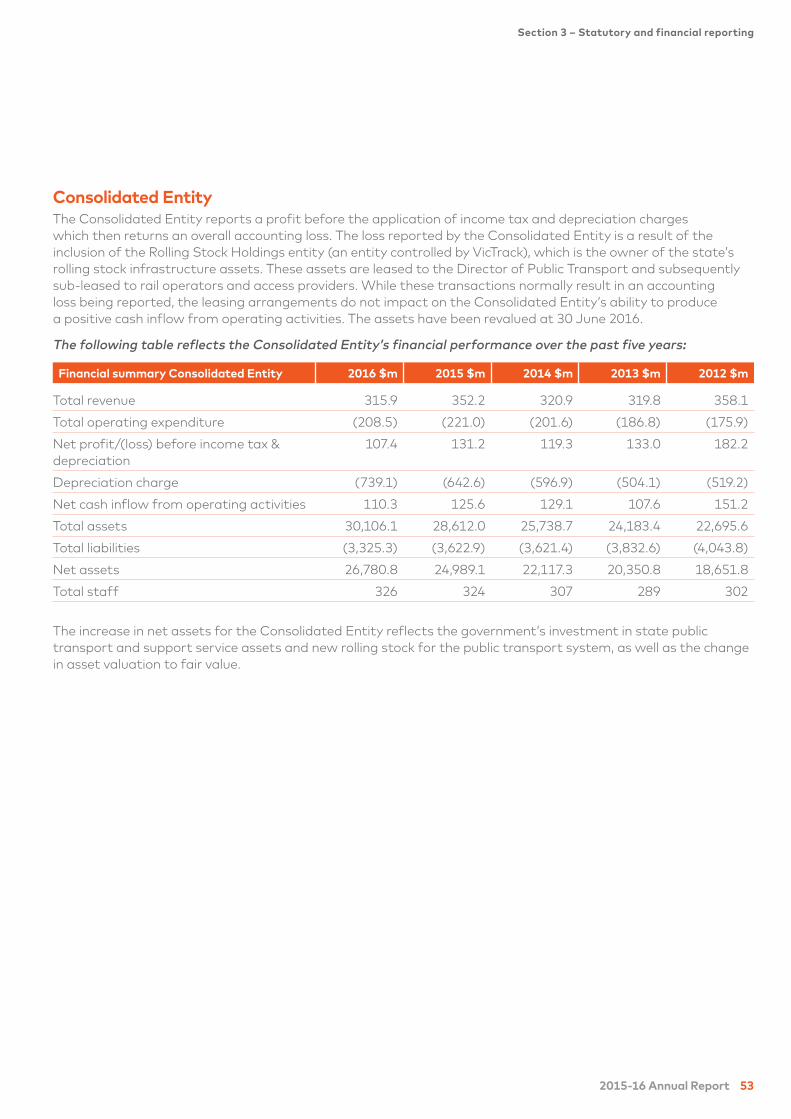
2015-16 Annual Report 53
Section 3 – Statutory and financial reporting
Consolidated Entity
The Consolidated Entity reports a profit before the application of income tax and depreciation charges
which then returns an overall accounting loss. The loss reported by the Consolidated Entity is a result of the
inclusion of the Rolling Stock Holdings entity (an entity controlled by VicTrack), which is the owner of the state’s
rolling stock infrastructure assets. These assets are leased to the Director of Public Transport and subsequently
sub-leased to rail operators and access providers. While these transactions normally result in an accounting
loss being reported, the leasing arrangements do not impact on the Consolidated Entity’s ability to produce
a positive cash inflow from operating activities. The assets have been revalued at 30 June 2016.
The following table reflects the Consolidated Entity’s financial performance over the past five years:
Financial summary Consolidated Entity 2016 $m 2015 $m 2014 $m 2013 $m 2012 $m
Total revenue 315.9 352.2 320.9 319.8 358.1
Total operating expenditure (208.5) (221.0) (201.6) (186.8) (175.9)
Net profit/(loss) before income tax &
depreciation
107.4 131.2 119.3 133.0 182.2
Depreciation charge (739.1) (642.6) (596.9) (504.1) (519.2)
Net cash inflow from operating activities 110.3 125.6 129.1 107.6 151.2
Total assets 30,106.1 28,612.0 25,738.7 24,183.4 22,695.6
Total liabilities (3,325.3) (3,622.9) (3,621.4) (3,832.6) (4,043.8)
Net assets 26,780.8 24,989.1 22,117.3 20,350.8 18,651.8
Total staff 326 324 307 289 302
The increase in net assets for the Consolidated Entity reflects the government’s investment in state public
transport and support service assets and new rolling stock for the public transport system, as well as the change
in asset valuation to fair value.
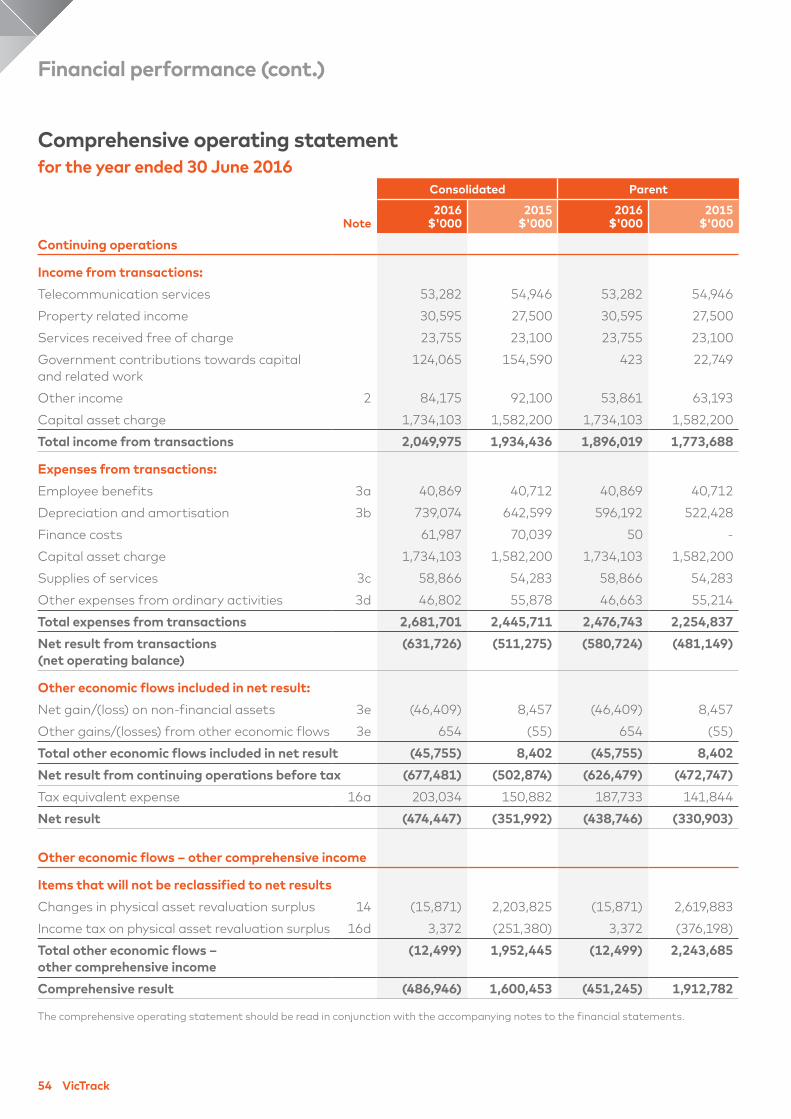
54 VicTrack
Comprehensive operating statement
for the year ended 30 June 2016
Consolidated Parent
Note
2016
$'000
2015
$'000
2016
$'000
2015
$'000
Continuing operations
Income from transactions:
Telecommunication services 53,282 54,946 53,282 54,946
Property related income 30,595 27,500 30,595 27,500
Services received free of charge 23,755 23,100 23,755 23,100
Government contributions towards capital
and related work
124,065 154,590 423 22,749
Other income 2 84,175 92,100 53,861 63,193
Capital asset charge 1,734,103 1,582,200 1,734,103 1,582,200
Total income from transactions 2,049,975 1,934,436 1,896,019 1,773,688
Expenses from transactions:
Employee benefits 3a 40,869 40,712 40,869 40,712
Depreciation and amortisation 3b 739,074 642,599 596,192 522,428
Finance costs 61,987 70,039 50 -
Capital asset charge 1,734,103 1,582,200 1,734,103 1,582,200
Supplies of services 3c 58,866 54,283 58,866 54,283
Other expenses from ordinary activities 3d 46,802 55,878 46,663 55,214
Total expenses from transactions 2,681,701 2,445,711 2,476,743 2,254,837
Net result from transactions
(net operating balance)
(631,726) (511,275) (580,724) (481,149)
Other economic flows included in net result:
Net gain/(loss) on non-financial assets 3e (46,409) 8,457 (46,409) 8,457
Other gains/(losses) from other economic flows 3e 654 (55) 654 (55)
Total other economic flows included in net result (45,755) 8,402 (45,755) 8,402
Net result from continuing operations before tax (677,481) (502,874) (626,479) (472,747)
Tax equivalent expense 16a 203,034 150,882 187,733 141,844
Net result (474,447) (351,992) (438,746) (330,903)
Other economic flows – other comprehensive income
Items that will not be reclassified to net results
Changes in physical asset revaluation surplus 14 (15,871) 2,203,825 (15,871) 2,619,883
Income tax on physical asset revaluation surplus 16d 3,372 (251,380) 3,372 (376,198)
Total other economic flows –
other comprehensive income
(12,499) 1,952,445 (12,499) 2,243,685
Comprehensive result (486,946) 1,600,453 (451,245) 1,912,782
The comprehensive operating statement should be read in conjunction with the accompanying notes to the financial statements.
Financial performance (cont.)
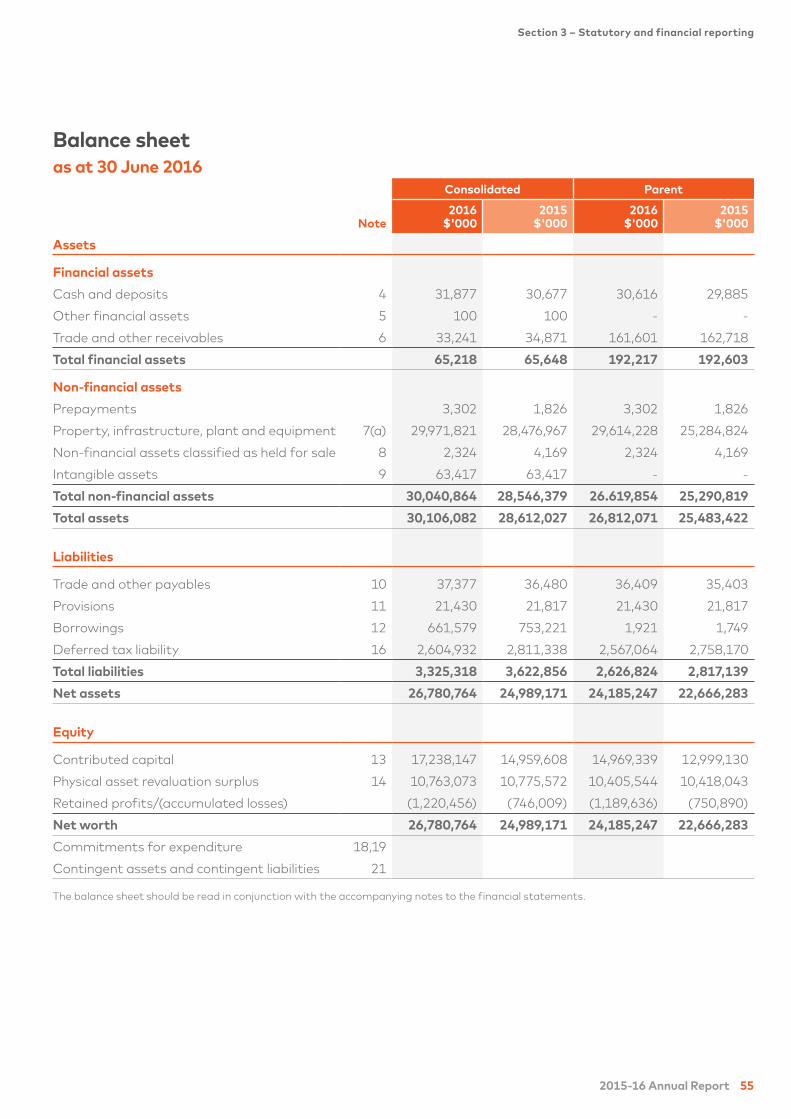
2015-16 Annual Report 55
Section 3 – Statutory and financial reporting
Balance sheet
as at 30 June 2016
Consolidated Parent
Note
2016
$'000
2015
$'000
2016
$'000
2015
$'000
Assets
Financial assets
Cash and deposits 4 31,877 30,677 30,616 29,885
Other financial assets 5 100 100 - -
Trade and other receivables 6 33,241 34,871 161,601 162,718
Total financial assets 65,218 65,648 192,217 192,603
Non-financial assets
Prepayments 3,302 1,826 3,302 1,826
Property, infrastructure, plant and equipment 7(a) 29,971,821 28,476,967 29,614,228 25,284,824
Non-financial assets classified as held for sale 8 2,324 4,169 2,324 4,169
Intangible assets 9 63,417 63,417 - -
Total non-financial assets 30,040,864 28,546,379 26.619,854 25,290,819
Total assets 30,106,082 28,612,027 26,812,071 25,483,422
Liabilities
Trade and other payables 10 37,377 36,480 36,409 35,403
Provisions 11 21,430 21,817 21,430 21,817
Borrowings 12 661,579 753,221 1,921 1,749
Deferred tax liability 16 2,604,932 2,811,338 2,567,064 2,758,170
Total liabilities 3,325,318 3,622,856 2,626,824 2,817,139
Net assets 26,780,764 24,989,171 24,185,247 22,666,283
Equity
Contributed capital 13 17,238,147 14,959,608 14,969,339 12,999,130
Physical asset revaluation surplus 14 10,763,073 10,775,572 10,405,544 10,418,043
Retained profits/(accumulated losses) (1,220,456) (746,009) (1,189,636) (750,890)
Net worth 26,780,764 24,989,171 24,185,247 22,666,283
Commitments for expenditure 18,19
Contingent assets and contingent liabilities 21
The balance sheet should be read in conjunction with the accompanying notes to the financial statements.
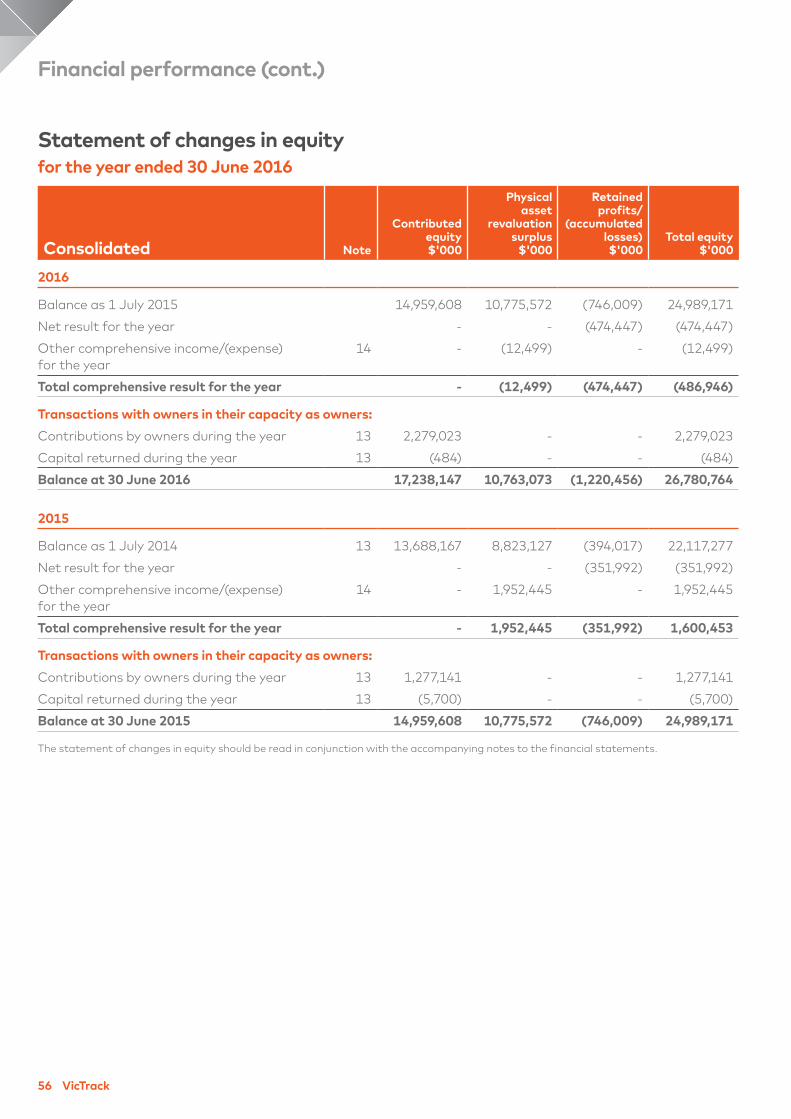
56 VicTrack
Statement of changes in equity
for the year ended 30 June 2016
Consolidated Note
Contributed
equity
$'000
Physical
asset
revaluation
surplus
$'000
Retained
profits/
(accumulated
losses)
$'000
Total equity
$'000
2016
Balance as 1 July 2015 14,959,608 10,775,572 (746,009) 24,989,171
Net result for the year - - (474,447) (474,447)
Other comprehensive income/(expense)
for the year
14 - (12,499) - (12,499)
Total comprehensive result for the year - (12,499) (474,447) (486,946)
Transactions with owners in their capacity as owners:
Contributions by owners during the year 13 2,279,023 - - 2,279,023
Capital returned during the year 13 (484) - - (484)
Balance at 30 June 2016 17,238,147 10,763,073 (1,220,456) 26,780,764
2015
Balance as 1 July 2014 13 13,688,167 8,823,127 (394,017) 22,117,277
Net result for the year - - (351,992) (351,992)
Other comprehensive income/(expense)
for the year
14 - 1,952,445 - 1,952,445
Total comprehensive result for the year - 1,952,445 (351,992) 1,600,453
Transactions with owners in their capacity as owners:
Contributions by owners during the year 13 1,277,141 - - 1,277,141
Capital returned during the year 13 (5,700) - - (5,700)
Balance at 30 June 2015 14,959,608 10,775,572 (746,009) 24,989,171
The statement of changes in equity should be read in conjunction with the accompanying notes to the financial statements.
Financial performance (cont.)
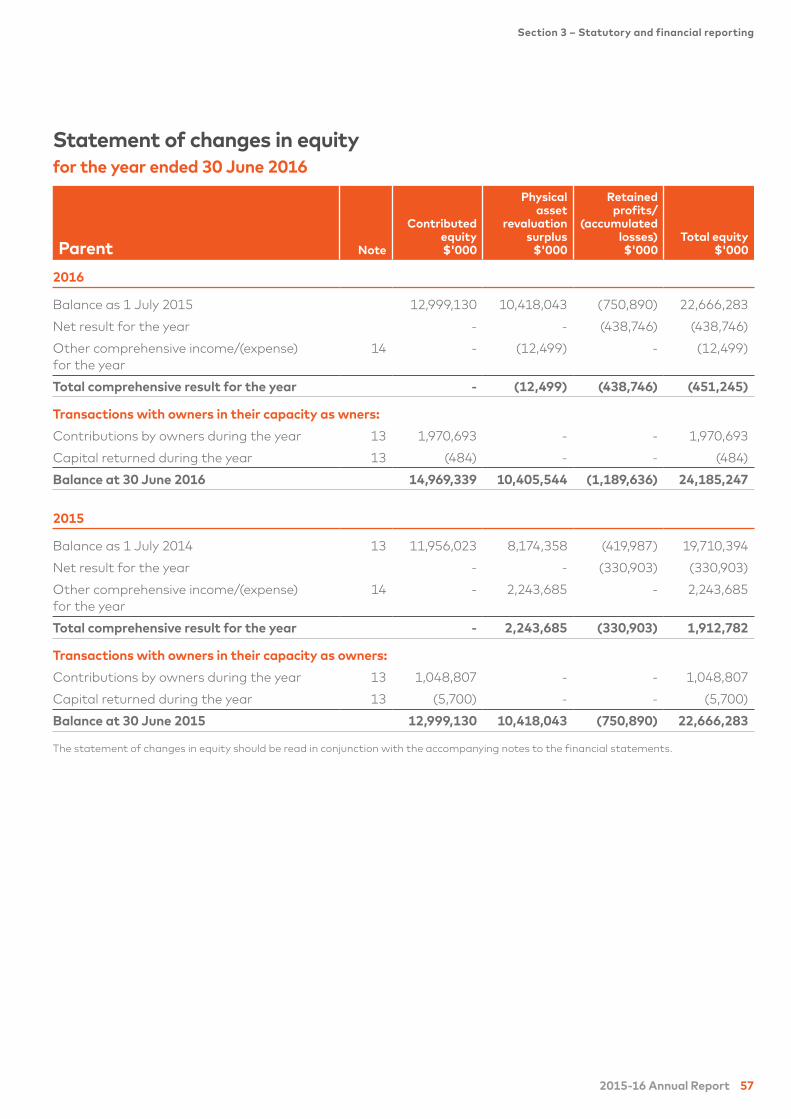
2015-16 Annual Report 57
Section 3 – Statutory and financial reporting
Statement of changes in equity
for the year ended 30 June 2016
Parent Note
Contributed
equity
$'000
Physical
asset
revaluation
surplus
$'000
Retained
profits/
(accumulated
losses)
$'000
Total equity
$'000
2016
Balance as 1 July 2015 12,999,130 10,418,043 (750,890) 22,666,283
Net result for the year - - (438,746) (438,746)
Other comprehensive income/(expense)
for the year
14 - (12,499) - (12,499)
Total comprehensive result for the year - (12,499) (438,746) (451,245)
Transactions with owners in their capacity as wners:
Contributions by owners during the year 13 1,970,693 - - 1,970,693
Capital returned during the year 13 (484) - - (484)
Balance at 30 June 2016 14,969,339 10,405,544 (1,189,636) 24,185,247
2015
Balance as 1 July 2014 13 11,956,023 8,174,358 (419,987) 19,710,394
Net result for the year - - (330,903) (330,903)
Other comprehensive income/(expense)
for the year
14 - 2,243,685 - 2,243,685
Total comprehensive result for the year - 2,243,685 (330,903) 1,912,782
Transactions with owners in their capacity as owners:
Contributions by owners during the year 13 1,048,807 - - 1,048,807
Capital returned during the year 13 (5,700) - - (5,700)
Balance at 30 June 2015 12,999,130 10,418,043 (750,890) 22,666,283
The statement of changes in equity should be read in conjunction with the accompanying notes to the financial statements.
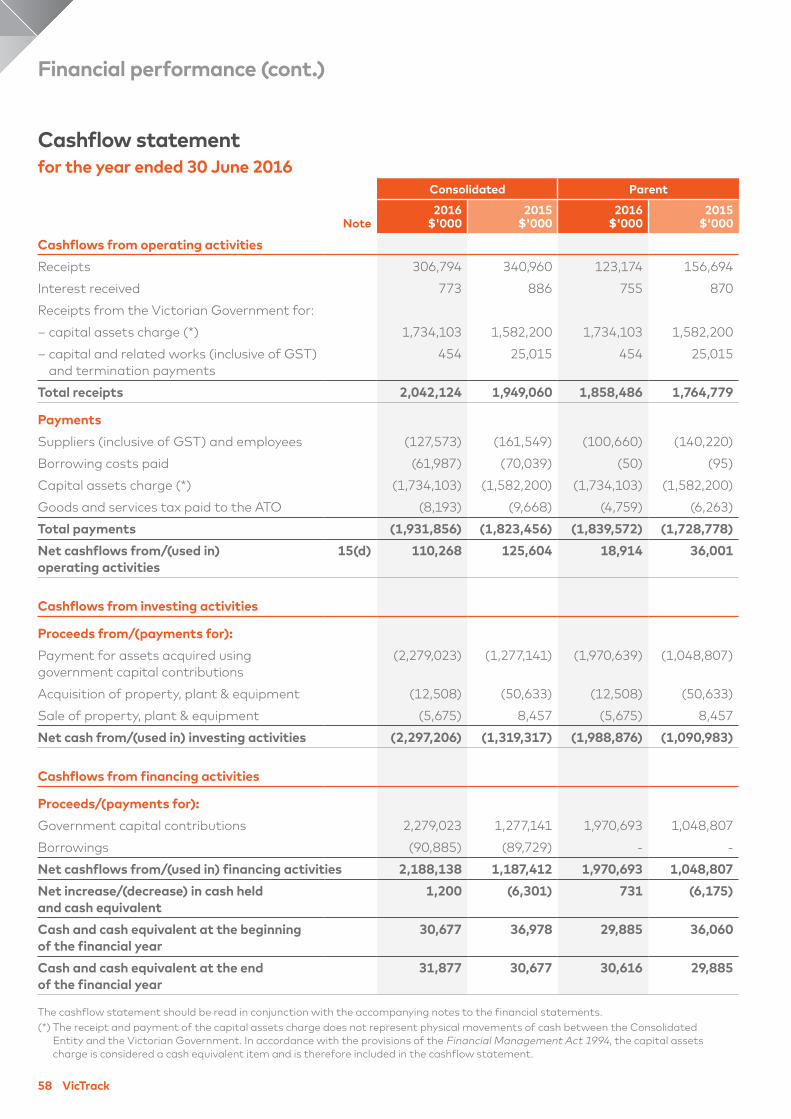
58 VicTrack
Cashflow statement
for the year ended 30 June 2016
Consolidated Parent
Note
2016
$'000
2015
$'000
2016
$'000
2015
$'000
Cashflows from operating activities
Receipts 306,794 340,960 123,174 156,694
Interest received 773 886 755 870
Receipts from the Victorian Government for:
– capital assets charge (*) 1,734,103 1,582,200 1,734,103 1,582,200
– capital and related works (inclusive of GST)
and termination payments
454 25,015 454 25,015
Total receipts 2,042,124 1,949,060 1,858,486 1,764,779
Payments
Suppliers (inclusive of GST) and employees (127,573) (161,549) (100,660) (140,220)
Borrowing costs paid (61,987) (70,039) (50) (95)
Capital assets charge (*) (1,734,103) (1,582,200) (1,734,103) (1,582,200)
Goods and services tax paid to the ATO (8,193) (9,668) (4,759) (6,263)
Total payments (1,931,856) (1,823,456) (1,839,572) (1,728,778)
Net cashflows from/(used in)
operating activities
15(d) 110,268 125,604 18,914 36,001
Cashflows from investing activities
Proceeds from/(payments for):
Payment for assets acquired using
government capital contributions
(2,279,023) (1,277,141) (1,970,639) (1,048,807)
Acquisition of property, plant & equipment (12,508) (50,633) (12,508) (50,633)
Sale of property, plant & equipment (5,675) 8,457 (5,675) 8,457
Net cash from/(used in) investing activities (2,297,206) (1,319,317) (1,988,876) (1,090,983)
Cashflows from financing activities
Proceeds/(payments for):
Government capital contributions 2,279,023 1,277,141 1,970,693 1,048,807
Borrowings (90,885) (89,729) - -
Net cashflows from/(used in) financing activities 2,188,138 1,187,412 1,970,693 1,048,807
Net increase/(decrease) in cash held
and cash equivalent
1,200 (6,301) 731 (6,175)
Cash and cash equivalent at the beginning
of the financial year
30,677 36,978 29,885 36,060
Cash and cash equivalent at the end
of the financial year
31,877 30,677 30,616 29,885
The cashflow statement should be read in conjunction with the accompanying notes to the financial statements.
(*) The receipt and payment of the capital assets charge does not represent physical movements of cash between the Consolidated
Entity and the Victorian Government. In accordance with the provisions of the Financial Management Act 1994, the capital assets
charge is considered a cash equivalent item and is therefore included in the cashflow statement.
Financial performance (cont.)
2015-16 Annual Report 59
Section 3 – Statutory and financial reporting
Notes to the financial statements30 June 2016
Note 1. Summary of significant
accounting policies
These annual financial statements represent the
audited general purpose financial statements for
VicTrack and its Controlled Entities (“Consolidated
Entity”) for the period ended 30 June 2016. The purpose
of the report is to provide users with information about
the Consolidated Entity's stewardship of resources
entrusted to it.
The nature of the operations and principal activities
of the Consolidated Entity are described in the
Directors’ report.
(a) Statement of compliance
These general purpose financial statements have been
prepared on a historical cost basis, unless otherwise
stated in the notes to the financial statements, in
accordance with the Financial Management Act
1994, Australian Accounting Standards and other
authoritative pronouncements issued by the Australian
Accounting Standards Board (“AASB”). Historical cost
is based on the fair values of the consideration given in
exchange for assets.
The entity is a not-for-profit entity for reporting
purposes under Australian Accounting Standards
and FRD108B Classification of entities as for profit.
The financial statements of the Consolidated Entity
for the year ended 30 June 2016 were authorised for
issue in accordance with a resolution of the Directors
on the 15 September 2016.
The Consolidated Entity provides certain services free
of charge or at prices significantly below their cost
of production for the collective consumption by the
community, which is incompatible with generating
profit as a principal objective. Consequently,
where appropriate, those paragraphs in Australian
Accounting Standards relating to not-for-profit
entities are applied.
Exceptions to the historical cost convention include:
• non-financial physical assets which, subsequent to
acquisition, are measured at a revalued amount
being their fair value at the date of the revaluation
less any subsequent accumulated depreciation and
subsequent impairment losses. Revaluations are
made with sufficient regularity to ensure that the
carrying amounts do not materially differ from
their fair value;
• consistent with AASB 13 Fair Value Measurement,
the Consolidated Entity determines the policies
and procedures for both recurring fair value
measurements such as property, plant and
equipment, investment properties and financial
instruments and for non-recurring fair value
measurements such as non-financial physical assets
held for sale, in accordance with the requirement of
AASB 13 Fair Value Measurement and the relevant
Financial Reporting Directions (“FRDs”). All assets
and liabilities for which fair value is measured or
disclosed in the financial statements are categorised
within the fair value hierarchy, described as follows,
based on the lowest level input that is significant to
the fair value measurement as a whole:
• Level 1 — quoted (unadjusted) market prices in
active markets for identical assets or liabilities;
• Level 2 — valuation techniques for which the
lowest level input that is significant to the fair
value measurement is directly or indirectly
observable; and
• Level 3 — valuation techniques for which the
lowest level input that is significant to the fair
value measurement is unobservable.
For the purpose of fair value disclosures, the
Consolidated Entity has determined classes of assets
and liabilities on the basis of the nature, characteristics
and risks of the asset or liability, and the level of the
fair value hierarchy as explained above.
In addition, the Consolidated Entity has determined
whether transfers have occurred between levels in
the hierarchy by re-assessing categorisation (based
on the lowest level input that is significant to the fair
value measurement as a whole) at the end of each
reporting period.
The Valuer General Victoria (“VGV”) is the
Consolidated Entity’s independent valuation agency.
The Consolidated Entity, in conjunction with VGV,
monitors changes in the fair value of each asset and
liability through relevant data sources to determine
whether revaluation is required.
60 VicTrack
(b) Basis of accounting preparation
and measurement
The accrual basis of accounting has been applied in
the preparation of these financial statements whereby
assets, liabilities, equity, income and expenses are
recognised in the reporting period to which they
relate, regardless of when cash is received or paid.
The following significant accounting policies have
been applied in preparing the financial statements
for the year ended 30 June 2016 and the comparative
information presented for the year ended 30 June 2015.
(i) Significant accounting estimates
and judgements
The following significant judgements and estimates
have been made by management in the preparation
of the financial statements:
Judgements, estimates and assumptions are required
to be made about the carrying values of assets and
liabilities that are not readily apparent from other
sources. The estimates and associated assumptions
are based on professional judgements derived from
historical experience and various other factors that
are believed to be reasonable under the circumstances.
Actual results may differ from these estimates.
The estimates and underlying assumptions are
reviewed on an ongoing basis. Revisions to accounting
estimates are recognised in the period in which the
estimate is revised if the revision affects only that
period or in the period of the revision and future periods
if the revision affects both current and future periods.
(ii) Land valuation
The Consolidated Entity recognises two major classes
of land – rail corridor land and non-rail corridor land.
Non-rail corridor land is used for commercial purposes
whilst rail corridor land is used as a rail reserve.
Rail corridor land is based on the assessed market
value of the land and is discounted by 75% in
accordance with the VGV’s Community Service
Obligations. The basis of the valuation of non-rail
corridor land is market value, with adjustments being
made, where appropriate, for variations in the size
and quality of each land parcel.
Estimated cost of environmental contamination
remediation is included in the value of the land
(where it is expected to enhance the value of the
land by providing future economic benefits) and a
corresponding liability or provision is recognised when
the obligation for remediation arises and can be
reliably estimated.
(iii) Non-financial physical assets
In addition to land, all non-financial physical assets are
recognised initially at cost and subsequently revalued
at fair value less accumulated depreciation and
impairment in accordance with the requirements of
FRD 103F Non-Financial Physical Assets reporting.
The fair value is determined on the basis of
depreciated replacement cost. The impairment
analysis on non-financial physical assets has been
carried out annually since with no impairment noted.
The last independent valuation of non-financial
physical assets was at 30 June 2015 by the VGV.
Where the assets are revalued, the revaluation
increments are credited directly to the asset
revaluation surplus net of income tax effect, except
to the extent that an increment reverses a prior year
decrement for that class of asset that had been
recognised as an expense in which case the increment
is recognised in profit and loss up to the amount of the
expense. Revaluation decrements are recognised as an
expense except where prior increments are included
in the asset revaluation surplus for that class of asset
in which case the decrement is taken to the reserve to
the extent of the remaining increments.
(iv) Estimation of useful lives
The estimation of the useful lives of assets has
been based on historical experience as well as
manufacturers' warranties (for plant and equipment)
and lease terms (for leased equipment). In addition,
the condition of the assets is assessed at least once
per year and considered against the remaining useful
life. Adjustments to useful lives are made when
considered necessary.
As part of the prior year revaluation the estimated
total useful lives of certain items of rolling stock
were reassessed. The net financial effect of this
reassessment in the current financial year was an
increase in depreciation expense of $22 million for
the Consolidated Entity.
(v) Operating lease commitments –
Consolidated Entity as lessor
The Consolidated Entity has entered into leases
for use of its rolling stock. The Consolidated Entity
has determined that it retains substantially all the
significant risks and rewards of ownership of the
rolling stock primarily as the lease does not transfer
ownership of the asset to the lessee at the end of the
lease term. Thus the Consolidated Entity has classified
the leases as operating leases.
Note 1. Summary of significant
accounting policies (cont.)
2015-16 Annual Report 61
Section 3 – Statutory and financial reporting
(vi) Finance lease commitments –
Consolidated Entity as lessee
The Consolidated Entity has entered into leases for
the acquisition of its rolling stock and determined that
as substantially all the risks and benefits transfer to
the Consolidated Entity, the leases are finance leases.
The control of the leases is effected through the rolling
stock head lease agreement between VicTrack and
PTV, with risks and rewards incidental to ownership
residing with VicTrack.
(vii) Recovery of deferred tax assets
Deferred tax assets with respect to deductible
temporary differences and tax losses have been
recognised in the balance sheet to the extent
of offsetting deferred tax liabilities recognised.
Significant management judgement is required to
determine the amount of deferred tax assets that can
be recognised, based upon the likely timing and the
level of future taxable profits over the next two years
together with future tax planning strategies.
The accounting policies adopted, and the classification
and presentation of items are consistent with those
of the previous year, except where a change is required
to comply with an Australian Accounting Standard
or an alternative accounting policy or an alternative
presentation or classification of an item, as permitted
by an Australian Accounting Standard, is adopted to
improve the relevance and reliability of the financial
report. Where practicable, comparative amounts are
presented and classified on a basis consistent with
the current year.
(c) Reporting entity
The Consolidated Entity is a public statutory body
established under section 8 of the Rail Management
Act 1996 and continued in existence under section
116 of the Transport Integration Act 2010 (Vic).
The principal address is: Level 8, 1010 La Trobe Street,
Docklands Victoria 3008.
(d) Scope and presentation
of financial statements
(i) Comprehensive operating statement
The comprehensive operating statement comprises
three components, being ‘net result from transactions’
(or termed as ‘net operating balance’), ‘other economic
flows included in net result’, as well as ‘other economic
flows – other comprehensive income’. The sum of
the former two, together with the net result from
discontinued operations, represents the net result.
The net result is equivalent to profit or loss derived
in accordance with Australian Accounting Standards.
‘Other economic flows’ are changes arising
from market remeasurements. They include:
• gains and losses from disposals
of non-financial assets;
• remeasurement of provisions; and
• revaluations and impairments of non-financial
physical, and intangible assets.
This classification is consistent with the whole of
government reporting format and is allowed under
AASB 101 Presentation of Financial Statements.
(ii) Balance sheet
Assets and liabilities are presented in liquidity order
with assets aggregated into, financial assets and
non-financial assets.
Current and non-current assets and liabilities are
disclosed in the notes, where relevant. In general,
non-current assets or liabilities are expected to be
recovered or settled more than 12 months after the
reporting period, except for the provisions of employee
benefits, which are classified as current liabilities if the
department does not have the unconditional right to
defer the settlement of the liabilities within 12 months
after the end of the reporting period.
(iii) Statement of changes in equity
The statement of changes in equity presents
reconciliations of each non-owner and owner equity
opening balance at the beginning of the reporting
period to the closing balance at the end of the
reporting period. It also shows separately changes
due to amounts recognised in the comprehensive
result and amounts recognised in other comprehensive
income related to other non-owner changes in equity.
(iv) Cashflow statement
Cashflows are classified according to whether or not
they arise from operating activities, investing activities,
or financing activities. This classification is consistent
with requirements under AASB 107 Statement of
Cash Flows.
62 VicTrack
(v) New and amended standards adopted
by the Consolidated Entity
The following accounting pronouncements effective
from the 2015-16 reporting period are considered to
have insignificant impacts on public sector reporting:
• AASB 1048 Interpretation of Standards;
• AASB 2013 9 Amendments to Australian Accounting
Standards [Part C Financial Instruments];
• AASB 2014 8 Amendments to Australian Accounting
Standards arising from AASB 9 – Application of
AASB 9 (December 2009) and AASB 9 (December
2010) [AASB 9 (2009 & 2010)];
• AASB 2015 3 Amendments to Australian Accounting
Standards arising from the Withdrawal of AASB
1031 Materiality; and
• AASB 2015 4 Amendments to Australian Accounting
Standards – Financial Reporting Requirements for
Australian Groups with a Foreign Parent [AASB 127
& AASB 128].
Note: Amending standard AASB 2015 7 Amendments
to Australian Accounting Standards – Fair Value
Disclosures of Not for Profit Public Sector Entities,
which is operative from 1 July 2016 provides an
exemption for not-for-profit public sector entities from
certain fair value disclosures. Please note that the state
early adopted AASB 2015 7 in the 2014-15 reporting
period and gave not-for-profit entities the option to
early adopt this amending standard last year. As a
result, all not for profit entities must now comply with
this amending standard for the current financial year.
(e) Basis of consolidation
In accordance with AASB 10 Consolidated Financial
Statements the consolidated financial statements
of the Consolidated Entity incorporates assets and
liabilities of all reporting entities controlled by the
Consolidated Entity as at 30 June 2016, and their
income and expenses for that part of the reporting
period in which control existed.
Where control of an entity is obtained during the
financial period, its results are included in the
comprehensive operating statement from the date
on which control commenced. Where control ceases
during a financial period, the entity’s results are
included for that part of the period in which control
existed. Where dissimilar accounting policies are
adopted by entities and their effect is considered
material, adjustments are made to ensure consistent
policies are adopted in these financial statements.
In the process of preparing consolidated financial
statements for the Consolidated Entity, all material
transactions and balances between consolidated
entities are eliminated. Entities consolidated into
the Parent Entity are listed in Note 20, Investments.
(i) Controlled Entities
The Parent controls an entity when it is exposed to,
or has rights to, variable returns from its involvement
with the entity and has the ability to affect those
returns through its power over the entity. Where
control of an entity is obtained during a financial
year, its results are included in the consolidated
comprehensive operating statement from the date on
which control commences. Where control of an entity
ceases during a financial year, its results are included
for that part of the year during which control existed.
Investments in Controlled Entities are accounted for
at cost in the separate financial statements of the
Parent Entity.
(ii) Transactions eliminated on consolidation
Intercompany transactions, balances and unrealised
gains between group companies are eliminated.
Unrealised losses are also eliminated unless the
transaction provides evidence of impairment of
the assets transferred.
(f) Income from transactions
Income is measured at the fair value of the
consideration received or receivable. Income
is disclosed, where applicable, net of returns,
allowances, duties and taxes.
The Consolidated Entity recognises income when
the amount of income can be reliably measured, it is
probable that future economic benefits will flow to
the entity and specific criteria have been met for each
of the Consolidated Entity’s activities as described
below. The Consolidated Entity bases its estimates on
historical results, taking into consideration the type of
customer, the type of transaction and the specifics of
each arrangement.
Income is recognised for the major business
activities as follows:
(i) Rendering of services
Income from telecommunications services, property
services, advertising, infrastructure management and
lease of the interstate rail corridors is recognised when
services are provided by the Consolidated Entity.
(ii) Leasehold improvements
Leasehold improvements/renewals undertaken by
lessees/sub-lessees and assets provided by other
parties are recognised as works are performed on the
assets/improvements based on confirmations received
from the other parties.
Note 1. Summary of significant
accounting policies (cont.)
2015-16 Annual Report 63
Section 3 – Statutory and financial reporting
(iii) Government contributions
Government contributions towards capital and related
costs are recognised when the Consolidated Entity
gains control of the underlying assets.
(iv) Interest income
Interest income includes unwinding over time of
discounts on financial assets and interest received on
bank term deposits and other investments.
Interest income is recognised on a time proportionate
basis that takes into account the effective yield on the
financial asset.
(v) Fair value of assets received free of
charge or for nominal consideration
Assets received free of charge is recognised at its
fair value at the time of acquisition, irrespective of
whether these contributions are subject to restrictions
or conditions over their use.
(g) Expenses from transactions
Expenses are recognised as they are incurred and
reported in the financial year to which they relate.
(i) Employee expenses
Refer to section 1(l)(iii) regarding employee benefits.
These expenses include all costs related to employment
(other than superannuation which is accounted for
separately) including wages and salaries, fringe
benefits tax, leave entitlements, redundancy payments
and WorkCover premiums.
(ii) Superannuation
The amount charged to the comprehensive operating
statement in respect of superannuation represents the
employers’ contributions made by the Consolidated
Entity to superannuation funds of which employees
are members. Further details are provided in Note 17,
employee superannuation funds.
(iii) Depreciation and amortisation
All infrastructure assets, buildings, plant and
equipment and other non-financial physical assets
(excluding items under operating leases, assets
held for sale, land and investment properties) that
have finite useful lives are depreciated. Depreciation
is generally calculated on a straight-line basis, at
rates that allocate the asset’s fair value, less any
estimated residual value, over its estimated useful
life. The estimated useful lives, residual values and
depreciation method are reviewed at the end of each
annual reporting period, and adjustments made where
appropriate. The range of depreciation rates used for
each class of asset is as follows:
Asset class Depreciation rates Useful life
Buildings and
structures
1.0% to 2.5% 100 to 40 years
Track 1.0% to 2.0% 100 to 50 years
Signals and
communications
3.0% to 3.3% 33 to 30 years
Plant and
equipment
2.5% to 10% 40 to 10 years
Software and
licences
3.0% to 14% 33 to 7 years
Rolling stock 2.5% to 3.3% 40 to 30 years
Land is considered to have indefinite life
and is not depreciated.
Intangible produced assets with finite useful lives
are depreciated as an expense from transactions on
a systematic (typically straight-line) basis over the
asset’s useful life. Depreciation begins when the asset
is available for use, that is, when it is in the location and
condition necessary for it to be capable of operating
in the manner intended by management. On the other
hand, the consumption of intangible non-produced
assets with finite useful lives is not classified as a
transaction, but as amortisation. Consequently, the
amortisation is included as an other economic flow in
the net result. Intangible assets with indefinite useful
lives are not depreciated or amortised, but are tested
annually for impairment.
Other than the reassessment of certain items of rolling
stock, the above rates are the same as those applied in
the previous financial year.
(iv) Finance cost – interest expense
Interest expenses are recognised as expenses
in the period in which they are incurred.
(v) Finance cost – borrowing costs
Borrowing costs represent interest incurred on
loans taken out primarily for the purpose of acquiring
new passenger rolling stock. Borrowing costs also
includes the amortisation of discounts or premiums
relating to these borrowings and interest charges on
finance leases.
In accordance with the paragraphs of AASB 123
Borrowing Costs applicable to not-for-profit public
sector entities, the Consolidated Entity continues
to recognise borrowing costs immediately as
an expense, to the extent that they are directly
attributable to the acquisition, construction or
production of a qualifying asset.
64 VicTrack
(vi) Supplies and services
Supplies and services expenses are recognised
as an expense in the reporting period in which they
are incurred.
(vii) Other operating expenses
Other operating expenses generally represent the
day to day running costs incurred in normal operations
and also includes customer construction expense.
(viii) Capital assets charge
The capital assets charge is the estimate of the cost
of capital investment in government assets i.e. the
return that could be achieved were the government
to direct its capital towards the next best investment
of comparable risk. It is imposed on the Consolidated
Entity by the Victorian Government’s Department of
Treasury and Finance (“DTF”).
The purpose of this notional charge is to increase
the awareness of the costs of assets for
management to make improved resource
allocation and investment decisions.
The capital assets charge is shown as both a revenue
and an expense from ordinary activities in the
comprehensive operating statement, meaning that
there is no impact on the operating result for the year,
nor on the balance sheet as at 30 June 2016.
Although the receipt and payment of the capital
assets charge does not represent physical movements
of cash, the capital assets charge has been disclosed
in the cashflow statement as it is considered a cash
equivalent item under the provisions of the Financial
Management Act 1994.
(ix) Other economic flows included in the net result
Other economic flows are changes in the volume
or value an asset or liability that does not result
from transactions.
Net gain/(loss) on non-financial assets
Net gain/(loss) on non-financial assets and
liabilities includes realised and unrealised gains
and losses as follows:
• any gain or loss on the disposal of non-financial
assets is recognised at the date of disposal and
is determined after deducting the proceeds from
the carrying value of the asset at the time; and
• impairment on non-financial assets as described
in note 1(i).
Amortisation of non-produced intangible assets
Intangible non-produced assets with finite lives are
amortised as another economic flow on a systematic
(typically straight line) basis over the asset’s useful
life. Amortisation begins when the asset is available
for use, that is, when it is in the location and condition
necessary for it to be capable of operating in the
manner intended by management.
Other gains/(losses) from other economic flows
Other gains/(losses) from other economic flows
include the gains or losses from:
• the revaluation of the present value of the long
service leave liability due to changes in the bond
interest rates or other assumptions.
(h) National Tax Equivalent Regime (NTER)
By direction of the Treasurer of Victoria under the
State Owned Enterprises Act 1992, the Consolidated
Entity is subject to the NTER in 2015-16, but limited
to the income tax component of the NTER.
(i) Current tax
Current tax is calculated by reference to the amount
of income taxes payable or recoverable in respect of
the taxable profit or tax loss for the period. The tax
rates and tax laws used to compute the amount are
those that are enacted or substantively enacted by
the end of the reporting period. Current tax assets
and liabilities for the current and prior periods are
measured at the amount expected to be recovered
from or paid to the taxation authorities.
(ii) Deferred tax
Deferred income tax is provided on all temporary
differences at the end of the reporting period between
the tax bases of assets and liabilities and their carrying
amounts for financial reporting purposes.
Deferred income tax liabilities are recognised for
all taxable temporary differences except:
• when the liability arises from the initial recognition
of goodwill or of an asset or liability in a transaction
that is not a business combination and that, at
the time of the transaction, affects neither the
accounting profit nor taxable profit or loss; or
• when the taxable temporary difference is associated
with investments in subsidiaries, associates or
interests in joint ventures, and the timing of the
reversal of the temporary difference can be
controlled, and it is probable that the temporary
difference will not reverse in the foreseeable future.
Deferred tax assets are recognised for deductible
temporary differences and unused tax losses only if it is
probable that future taxable amounts will be available
to utilise those temporary differences and losses.
Note 1. Summary of significant
accounting policies (cont.)
2015-16 Annual Report 65
Section 3 – Statutory and financial reporting
The carrying amount of deferred tax assets are
reassessed at the end of each reporting period and
reduced to the extent that it is no longer probable that
sufficient taxable profit will be available to allow all or
part of the deferred income tax asset to be utilised.
Unrecognised deferred tax assets are reassessed at
the end of each reporting period and are recognised
to the extent that it has become probable that
future taxable profit will allow the deferred tax
asset to be recovered.
Deferred tax assets and liabilities are offset when
they relate to income taxes levied by the same
taxation authority and the Consolidated Entity
intends to settle its current tax assets and liabilities
on a net basis.
(i) Impairment of non-financial assets
Goodwill and intangible assets with indefinite useful
lives (and intangible assets not yet available for use)
are tested annually for impairment and whenever
there is an indication that the asset may be impaired.
All other assets are assessed annually for indications
of impairment, except for assets arising from
construction contracts.
If there is an indication of impairment, the assets
concerned are tested as to whether their carrying
value exceeds their recoverable amount. Where an
asset’s carrying value exceeds its recoverable amount,
the difference is written off as another economic
flow, except to the extent that the write down can
be debited to an asset revaluation surplus amount
applicable to that class of asset.
If there is an indication that there has been a reversal
in the estimate of an asset’s recoverable amount since
the last impairment loss was recognised, the carrying
amount shall be increased to its recoverable amount.
The impairment loss is reversed only to the extent
that the asset’s carrying amount does not exceed the
carrying amount that would have been determined,
net of depreciation or amortisation, if no impairment
loss had been recognised in prior years.
It is deemed that, in the event of the loss or
destruction of an asset, the future economic benefits
arising from the use of the asset will be replaced
unless a specific decision to the contrary has been
made. The recoverable amount for most assets is
measured at the higher of depreciated replacement
cost and fair value less costs to sell.
Refer to Note 1(k) in relation to the recognition
and measurement of non-financial assets.
(j) Financial instruments
Financial instruments arise out of contractual
agreements that give rise to a financial asset
of one entity and a financial liability or equity
instrument of another entity. Due to the nature
of the Consolidated Entity’s activities, certain
financial assets and financial liabilities arise under
statute rather than a contract. Such financial assets
and financial liabilities do not meet the definition
of financial instruments in AASB 132 Financial
Instruments: Presentation. For example, statutory
receivables arising from taxes, fines and penalties
do not meet the definition of financial instruments
as they do not arise under contract.
Where relevant, for note disclosure purposes, a
distinction is made between those financial assets
and financial liabilities that meet the definition of
financial instruments in accordance with AASB 132
Financial Instruments: Presentation and those that
do not.
(i) Recognition and derecognition
Regular purchases and sales of financial assets are
recognised on the trade date i.e. the date that the
Consolidated Entity commits to the asset.
A financial asset (or where applicable, a part of a
financial asset or part of a group of similar financial
assets) is derecognised when:
• the rights to receive cashflows from the asset
have expired; or
• the Consolidated Entity retains the right to receive
cashflows from the asset, but has assumed an
obligation to pay them in full without material delay
to a third party under a 'pass through‘ arrangement;
or
• the Consolidated Entity has transferred its rights
to receive cashflows from the asset and either:
• has transferred substantially all the risks and
rewards of the asset; or
• has neither transferred nor retained substantially
all the risks and rewards of the asset, but has
transferred control of the asset.
Where the Consolidated Entity has neither transferred
nor retained substantially all the risks and rewards
or transferred control, the asset is recognised to
the extent of the Consolidated Entity's continuing
involvement in the asset.
66 VicTrack
(ii) Cash and deposits
Cash and deposits recognised on the balance sheet
comprise of cash at bank and term deposits with
maturity greater than three months are recorded at
cost less impairment. The term deposits represent a
rolling 90 days fixed term investment with Treasury
Corporation of Victoria (“TCV”). These investments
are earmarked for use on future infrastructure
improvement projects.
(iii) Other financial assets
Other financial assets are deposits restricted to
payments of interest on borrowings and payments
to suppliers in relation to the construction of new
rolling stock.
(iv) Loan and receivables
Loans and receivables are financial instrument
assets with fixed and determinable payments that
are not quoted on an active market. These assets
are initially recognised at fair value plus any directly
attributable transaction costs. Subsequent to initial
measurement, loans and receivables are measured
at amortised cost using the effective interest
method, less any impairment.
The collectability of receivables is reviewed on
an ongoing basis. Debts that are known to be
uncollectible are written off. An allowance account
(provision for impairment of receivables) is used when
some doubt as to collection exists. The amount of
the impairment loss is recognised in profit or loss
with other expenses. When a receivable for which an
impairment allowance has been recognised becomes
uncollectable in a subsequent period, it is written off
against the allowance account. Subsequent recoveries
of amounts previously written off are credited against
other expenses in profit or loss.
(v) Financial liabilities at amortised cost
Financial instrument liabilities are initially recognised
on the date they are originated. They are initially
measured at fair value plus any directly attributable
transaction costs. Subsequent to initial recognition,
these financial instruments are measured at amortised
cost with any difference between the initial recognised
amount and the redemption value being recognised in
profit and loss over the period of the interest bearing
liability, using the effective interest rate method (refer
to Note 25, Financial risk management).
Financial instrument liabilities measured at amortised
cost include all of the departments contractual
payables, deposits held and advances received, and
interest bearing arrangements other than those
designated at fair value through profit or loss.
(vi) Offsetting financial instruments
Financial instrument assets and liabilities are offset
and the net amount presented in the consolidated
balance sheet when, and only when, the department
concerned has a legal right to offset the amounts and
intend either to settle on a net basis or to realise the
asset and settle the liability simultaneously.
Some master netting arrangements do not result in
an offset of balance sheet assets and liabilities. Where
the department does not have a legally enforceable
right to offset recognised amounts, because the right
to offset is enforceable only on the occurrence of
future events such as default, insolvency or bankruptcy,
they are reported on a gross basis.
(vii) Reclassification of financial instruments
Subsequent to initial recognition and under rare
circumstances, non-derivative financial instruments
assets that have not been designated at fair value
through profit or loss upon recognition, may be
reclassified out of the fair value through profit or
loss category, if they are no longer held for the
purpose of selling or repurchasing in the near term.
(k) Non-financial assets
(i) Prepayments
Prepayments represent payments in advance of
receipt of goods or services or that part of expenditure
made in one accounting period covering a term
extending beyond that period.
(ii) Property, infrastructure, plant and equipment
Non-financial physical assets are measured at fair
value on a cyclical basis, in accordance with the FRDs
issued by the Minister for Finance. A full revaluation
normally occurs every five years, based upon the
asset’s government purpose classification but may
occur more frequently if fair value assessments
indicate material changes in values. Independent
valuers are generally used to conduct these scheduled
revaluations. Certain infrastructure assets are
revalued using specialised advisors. Any interim
revaluations are determined in accordance with the
requirements of the FRDs. Revaluation increases or
decreases arise from differences between an asset’s
carrying value and fair value.
Net revaluation increases (where the carrying amount
of a class of assets is increased as a result of a
revaluation) are recognised in ‘other economic flows
– other comprehensive income’, and accumulated in
equity under the asset revaluation surplus. However,
the net revaluation increase is recognised in the net
result to the extent that it reverses a net revaluation
decrease in respect of the same class of property,
plant and equipment previously recognised as an
expense (other economic flows) in the net result.
Note 1. Summary of significant
accounting policies (cont.)
2015-16 Annual Report 67
Section 3 – Statutory and financial reporting
Net revaluation decrease is recognised in ‘other
economic flows – other comprehensive income’ to
the extent that a credit balance exists in the asset
revaluation surplus in respect of the same class of
property, plant and equipment. Otherwise, the net
revaluation decreases are recognised immediately
as other economic flows in the net result. The net
revaluation decrease recognised in ‘other economic
flows – other comprehensive income’ reduces the
amount accumulated in equity under the asset
revaluation surplus.
Revaluation increases and decreases relating to
individual assets in a class of property, plant and
equipment, are offset against one another in that
class but are not offset in respect of assets in
different classes. The asset revaluation surplus is not
transferred to accumulated funds on derecognition
of the relevant asset.
Rail infrastructure
All rail infrastructure assets owned by the
Consolidated Entity when it commenced operations
were transferred from the previous owners, the
Public Transport Corporation and the V/Line Freight
Corporation, by way of statutory allocation under the
Rail Corporations Act 1996, effective from 1 July 1997.
The allocation statement (as amended) included the
carrying value for the rail infrastructure assets to be
adopted by the Consolidated Entity
There have been a number of subsequent allocation
statements since the commencement of operations,
having the effect of transferring ownership both to
and from the Consolidated Entity. These allocation
statements also included the carrying value of the rail
infrastructure assets adopted by the Consolidated
Entity at the time of transfer.
The initial allocation statement (and amendment)
and subsequent allocation statements were ratified
by the relevant Minister under Section 40 of the Rail
Corporations Act 1996 and, as such, the values ascribed
to the rail infrastructure assets, apart from land, have
been adopted by the directors of the Consolidated
Entity as the appropriate cost for reporting purposes.
Rail Infrastructure assets are recognised initially
at cost plus incidental costs attributable to the
acquisition and subsequently revalued to fair value
less accumulated depreciation and impairment in
accordance with the requirements of FRD103F: Non-
Current Physical Assets. The impairment analysis on
the rail infrastructure has been carried out annually
since with no impairment noted.
The last independent valuation of rail infrastructure
assets was at 30 June 2015.
Plant and equipment
Plant and equipment, which include rolling stock,
are recognised initially at cost plus incidental costs
attributable to the acquisition and subsequently
revalued to fair value less accumulated depreciation
and impairment in accordance with the requirements
of FRD103F: Non-Current Physical Assets.
Intangible assets – software and licences
Intangible assets represent identifiable non-monetary
assets without physical substance and are initially
recognised at cost. Subsequently intangible assets
with finite useful lives are carried at cost less
accumulated depreciation/amortisation and
accumulated impairment losses. Costs incurred
subsequent to initial acquisition are capitalised
when it is expected that additional future economic
benefits will flow. Amortisation begins when the asset
is available for use, that is, when it is in the location
and condition necessary for it to be capable of
operating in the manner intended by management.
The amortisation period and the amortisation
method for an intangible asset with a finite useful
life are reviewed at least at the end of the each
annual reporting period. In addition, an assessment
is made at each reporting date to determine whether
there are indications that the intangible assets
concerned is impaired.
An internally generated intangible asset arising from
development (or from the development phase of an
internal project) is recognised if, and only if, all of the
following are demonstrated:
(a) the technical feasibility of completing the
intangible asset so that it will be available
for use or sale;
(b) an intention to complete the intangible asset
and use or sell it;
(c) the ability to use or sell the intangible asset;
(d) the intangible asset will generate probable
future economic benefits;
(e) the availability of adequate technical, financial
and other resources to complete the development
and to use or sell the intangible asset; and
(f) the ability to measure reliably the expenditure
attributable to the intangible asset during
its development.
68 VicTrack
(iii) Land
The Consolidated Entity recognises two major classes
of land – rail corridor land and non-rail corridor land.
Non-rail corridor land is used for commercial purposes
whilst rail corridor land is used as a rail reserve.
Non-financial physical assets such as Crown land
and heritage assets are measured at fair value
with regard to the property’s highest and best use
after due consideration is made for any legal or
physical restrictions imposed on the asset, public
announcements or commitments made in relation
to the intended use of the asset. Theoretical
opportunities that may be available in relation to
the asset are not taken into account until it is
virtually certain that the restrictions will no longer
apply. Therefore, unless otherwise disclosed, the
current use of these non-financial physical assets
will be their highest and best use.
The basis of the valuation of non-rail corridor land is
market value, with adjustments being made, where
appropriate, for variations in the size and quality of
each land parcel
Rail corridor land is based on the assessed market
value of the land (effectively the value of the land
were it to be sold to adjoining land owners) with
discounts being applied to reflect costs that would be
incurred in selling the land i.e. subdivisional, legal, etc.
The last independent valuation of land was
at 30 June 2015.
(iv) Lease of infrastructure assets
The Consolidated Entity leases the majority of its rail
infrastructure assets to the Public Transport of Victoria
(PTV) for the purposes of conducting passenger and
freight train and tram operations. PTV then sub-leases
the assets to various transport operators and track
access providers. Under the leases, responsibility for
conducting transport operations and maintaining
the infrastructure assets is effectively transferred
to the lessees/sub-lessees. The Consolidated Entity
reserves the exclusive right to engage in non-transport
activities on its assets and specifically excludes trunk
telecommunications infrastructure from the leases.
(v) Leasehold improvements
Infrastructure improvements undertaken by lessees/
sub-lessees have been recorded as assets of the
Consolidated Entity in accordance with a direction
from DTF. These leasehold improvements have been
recognised at cost.
In the prior year, transfers of net assets arising from
administrative restructures and/or from all other
arrangements which are deemed to be contributions
by owners, where there is insufficient contributed
capital for distribution are recognised as an expense
by the transferor and income by the transferee
in accordance with FRD119A: Transfers through
Contributed Capital. Alternatively if the transferor
has approval to reclassify sufficient accumulated
funds to contributed capital prior to or at the time
of the asset transfer date then a distribution from
contributed capital can occur.
(vi) Rolling stock
The Consolidated Entity owns the majority of the
existing suburban rolling stock fleet (trains and trams)
that were transferred as assets received free of
charge in April 2004 at a fair value of $448.2 million.
This value was adopted as the deemed cost of the
assets. The fair value was determined on the basis
of depreciated replacement cost.
The Consolidated Entity’s works in progress includes
rail infrastructure and rolling stock projects underway,
but not yet complete or ready for service. The
incomplete rail infrastructure projects are recorded
at cost. The recorded value of rolling stock works in
progress includes payments made to the manufacturer.
Borrowing costs incurred to finance the construction
of new rolling stock are expensed as they are incurred.
(vii) Intangible assets
Goodwill
Where an entity or operation is acquired, the net
identifiable assets acquired are measured at fair
value. The excess of the fair value of the cost of
acquisition over the fair value of the identifiable net
assets acquired is brought to account as goodwill.
Goodwill is not amortised. Instead, goodwill is tested
for impairment annually, or more frequently if events
or changes in circumstances indicate that it might
be impaired, and is carried at cost less accumulated
impairment losses. As at 30 June 2016, there was no
impairment of the goodwill relating to the purchase
of Rolling Stock (Victoria-VL) Pty Ltd. Gains and
losses on the disposal of an entity include the carrying
amount of goodwill relating to the entity sold.
Note 1. Summary of significant
accounting policies (cont.)
2015-16 Annual Report 69
Section 3 – Statutory and financial reporting
Goodwill is allocated to the cash-generating units for
the purpose of impairment testing. The allocation is
made to those cash-generating units or groups of
cash-generating units or groups of cash-generating
units that are expected to benefit from the business
combination in which the goodwill arose.
Goodwill is allocated to the Consolidated Entity’s
leasing business. The recoverable amount of the
cash generating unit is determined based on value-
in-use calculations. Value-in-use is calculated based
on the present value of cashflow projections over a
10-year period with the period extending beyond five
years extrapolated using an estimated growth rate.
The cashflows are discounted using the yield of a
10-year government bond at the beginning of the
budget period. Management has based the value-
in-use calculations on budgets for each operating
segment. These budgets use historical weighted
average growth rates to project revenue. Costs
are calculated taking into account historical gross
margins as well as estimated weighted average
inflation rates over the period, which are consistent
with inflation rates applicable to the locations in
which the segments operate. Discount rates are
pre-tax and are adjusted to incorporate risks
associated with a particular division.
There was no addition, impairment and amortisation
incurred during the current and prior year for goodwill.
Software and licences
Intangible assets represent identifiable non-monetary
assets without physical substance and are initially
recognised at cost. Subsequently intangible
assets with finite useful lives are carried at cost
less accumulated depreciation/amortisation and
accumulated impairment losses. Costs incurred
subsequent to initial acquisition are capitalised
when it is expected that additional future economic
benefits will flow. Amortisation begins when the
asset is available for use, that is, when it is in the
location and condition necessary for it to be capable
of operating in the manner intended by management.
The amortisation period and the amortisation
method for an intangible asset with a finite useful
life are reviewed at least at the end of each annual
reporting period. In addition, an assessment is made
at each reporting date to determine whether there
are indications that the intangible assets concerned
is impaired.
An internally generated intangible asset arising from
development (or from the development phase of an
internal project) is recognised if, and only if, all of the
following are demonstrated:
(a) the technical feasibility of completing the intangible
asset so that it will be available for use or sale;
(b) an intention to complete the intangible asset
and use or sell it;
(c) the ability to use or sell the intangible asset;
(d) the intangible asset will generate probable
future economic benefits;
(e) the availability of adequate technical, financial
and other resources to complete the development
and to use or sell the intangible asset; and
(f) the ability to measure reliably the expenditure
attributable to the intangible asset during
its development.
(l) Liabilities
(i) Trade and other payables
These amounts represent liabilities for goods and
services provided to the Consolidated Entity prior
to the end of the financial year which are unpaid at
the end of the reporting period. Payables are initially
measured at fair value, being the cost of the goods
and services, and then subsequently measured at
amortised cost. The amounts are unsecured and are
usually paid within 45 days of recognition.
(ii) Borrowings
Secured loans are carried on the balance sheet at
their fair value at the time the loan was taken out
or acquired, net of fair value unwinds. Interest is
accrued over the period it becomes due and is recorded
as part of trade and other payables at year end.
The finance lease liability is determined in accordance
with the requirements of AASB 117 Leases.
The premium that arose on the secured loans as
a result of being recorded at their fair value is being
amortised over the repayment period of the
secured loans.
70 VicTrack
(iii) Employee benefits –
wages, salaries and annual leave
Provision is made for benefits accruing to employees
in respect for wages and salaries, annual leave and
long service for services provided during the
reporting period.
Liabilities for wages and salaries, including non-
monetary benefits, annual leave and accumulating
sick leave, are all recognised in the provision for
employee benefits as current liabilities, because the
Consolidated Entity does not have an unconditional
right to defer settlements of these liabilities.
Depending on the expectation of the timing of
settlement, liabilities for wages and salaries, annual
leave and sick leave are measured at:
• nominal value – if the Consolidated Entity
expects to wholly settle within 12 months; or
• present value – if the Consolidated Entity does
not expect to wholly settle within 12 months.
(iv) Employee benefits – long service leave
Liability for long service leave (LSL) is recognised
in the provision for employee benefits.
Unconditional LSL is disclosed in the notes to the
financial statements as a current liability, even where
the Consolidated Entity does not expect to settle
the liability within 12 months because it will not have
the unconditional right to defer the settlement of
the entitlement should an employee take leave within
12 months.
The components of this current LSL liability
are measured at:
• nominal value - if the Consolidated Entity expects
to wholly settle within 12 months; and
• present value - if the Consolidated Entity does
not expect to wholly settle within 12 months.
Conditional LSL is disclosed as a non-current liability.
There is an unconditional right to defer the settlement
of the entitlement until the employee has completed
the requisite years of service. This non-current LSL
liability is measured at present value.
Any gain or loss following revaluation of the present
value of non-current LSL liability is recognised in the
‘net result from transactions’, except to the extent
that a gain or loss arises due to changes in bond
interest rates for which it is then recognised in the
net result as another economic flow.
(v) On-costs on employee benefits
On-costs on employee benefits, including payroll
tax, are recognised and included in employee benefit
liabilities and costs when the employee benefits to
which they relate are recognised as liabilities.
(vi) Employee benefits - termination benefits
Termination benefits are payable when employment
is terminated before the normal retirement date,
or when an employee accepts voluntary redundancy
in exchange for these benefits. The Consolidated
Entity recognises termination benefits when it is
demonstrably committed to either terminating
the employment of current employees according
to a detailed formal plan without possibility of
withdrawal or to providing termination benefits
as a result of an offer made to encourage voluntary
redundancy. Benefits falling due more than 12 months
after the end of the reporting period are discounted
to present value.
(vii) Provisions
Provisions are recognised when the Consolidated
Entity has a present obligation, the future sacrifice
of economic benefits is probable, and the amount
of the provision can be measured reliably.
The amount recognised as a provision is the best
estimate of the consideration required to settle
the present obligation at the end of the reporting
period, taking into account the risks and uncertainties
surrounding the obligation. Where a provision is
measured using the cashflows estimated to settle
the present obligation, its carrying amount is the
present value of those cashflows, using discount
rate that reflects the time value of money and risks
specific to the provision.
Consolidated Entity land and other assets may
be subject to varying degrees of contamination.
Estimated costs of environmental assessments and
restoration of assets are recognised as liabilities
when the obligation is identified and costs can
be reliably estimated. Ongoing environmental
assessments and restoration costs are progressively
charged as expenses from ordinary activities when
incurred. Environmental assessments, management
and restoration costs for which an obligation will
possibly arise in the future or which cannot be reliably
measured are disclosed as contingent liabilities.
Note 1. Summary of significant
accounting policies (cont.)
2015-16 Annual Report 71
Section 3 – Statutory and financial reporting
(m) Leases
A lease is a right to use an asset for an agreed period
of time in exchange for payment. Leases are classified
at their inception as either operating or finance leases
based on the economic substance of the agreement,
so as to reflect the risks and benefits incidental to
ownership. Leases of fixed assets where substantially
all the risks and benefits incidental to the ownership of
the asset are transferred to the Consolidated Entity
are classified as finance leases. All other leases are
classified as operating leases.
Finance lease
Consolidated Entity as lessee
Assets under finance leases are initially recognised
at their fair value or, if lower, the present value of
the minimum lease payments, each determined at
inception of the lease. The corresponding liability to
the lessor is included in the balance sheet as a finance
lease obligation. Lease payments are allocated
between the reduction of the lease liability and the
finance charges so as to achieve a constant rate
of interest on the remaining balance of the liability.
Finance charges are charged directly against income
in accordance with the Consolidated Entity’s general
policy on borrowing costs. Refer to note 1g(v).
Leased assets are depreciated on a straight-line basis
over their estimated useful lives, where it is likely the
Consolidated Entity will obtain ownership of the asset,
or over the term of the lease
Operating lease – Consolidated Entity as lessor
Consolidated Entity as lessor payments, including
any contingent rentals, are recognised as an expense
in the comprehensive operating statement on a
straight-line basis over the lease term, except where
another systematic basis is more representative of
the time pattern of the benefits derived from the
use of the leased asset. The leased asset is not
recognised in the balance sheet.
Lease income from operating leases where the
Consolidated Entity is the lessor is recognised on
a straight-line basis over the term of the relevant
lease. The respective leased assets are included in
the balance sheet on their nature.
(n) Goods and services tax (GST)
Income, expenses and assets are recognised net of
the amount of goods and services tax (GST), except
where the amount of GST incurred is not recoverable
from the ATO. In these circumstances, the GST is
recognised as part of the cost of acquisition of the
asset or as part of an item of the expense.
Receivables and payables are recognised inclusive
of GST.
The net amount of GST recoverable from, or payable
to, the ATO is included as a current asset or liability in
the balance sheet.
Cashflows are included in the cashflow statement
on a gross basis. The GST components of cashflows
arising from investing and financing activities which
are recoverable from, or payable to, the ATO are
classified as operating cashflows.
Commitments and contingencies are disclosed inclusive
of GST recoverable from, or payable to, the ATO
(o) Contributed capital
The Consolidated Entity’s contributed capital
comprises the value (at the date of transfer) of
the majority of the state’s rail and tram fixed
infrastructure as well as leasehold improvements
undertaken by lessees/sub-lessees.
Transfers of net assets arising from administrative
restructures and/or from all other arrangements which
are deemed to be contributions by owners, where
there is insufficient contributed capital for distribution,
are recognised as an expense by the transferor and
income by the transferee in accordance FRD119A:
Transfers through Contributed Capital. Alternatively,
if the transferor has approval to reclassify sufficient
accumulated funds to contributed capital prior to or at
the time of the asset transfer date then a distribution
from contributed capital can occur.
(p) Commitments
Commitments include operating and capital
expenditure arising from non-cancellable contractual
sources and disclosed at their nominal value and
inclusive of the GST payable.
(q) Dividends
Section 36 of the Rail Corporations Act 1996,
provides for a rail corporation to pay to the state
amounts as directed by the Treasurer of Victoria
after consultation with the Board of the Consolidated
Entity and the Minister.
No determination was received from the Treasurer
requiring the Consolidated Entity to make a dividend
payment in respect of the financial year ending
30 June 2016 (30 June 2015: Nil).
(r) Rounding
All amounts shown in the financial statements
are expressed by reference to the nearest thousand
dollars unless otherwise specified.
72 VicTrack
(u) Events after the reporting period
Assets, liabilities, income or expenses arise from
past transactions or other past events. Where the
transactions result from an agreement between
the Consolidated Entity and other parties, the
transactions are only recognised when the
agreement is irrevocable at or before the end of the
reporting period. Adjustments are made to amounts
recognised in the financial statements for events
which occur between the end of the reporting period
and the date when the financial statements are
authorised for issue, where those events provide
information about conditions which existed at the
reporting date. Note disclosure is made about events
between the end of the reporting period and the date
the financial statements are authorised for issue
where the events relate to conditions which arose
after the end of the reporting period that are
considered to be of material interest.
No events have arisen since the end of the financial
year which significantly affected or may significantly
affect the operations of the Consolidated Entity, the
results of those operations, or the state of affairs of
the Consolidated Entity in future financial years.
(v) Contingent liabilities
Contingent liabilities are not recognised in the balance
sheet, but are disclosed at Note 21, Contingent
liabilities and, if quantifiable, are measured at nominal
value. Contingent liabilities are presented inclusive of
GST receivable or payable respectively.
(s) Functional and presentation currency
The consolidated financial statements are
denominated in Australian dollars, which is the
functional and presentation currency of the
Consolidated Entity.
(t) Going concern
The financial statements have been prepared on a
going concern basis, which contemplates the continuity
of normal business operations and the realisation
of assets and settlement of liabilities in accordance
with the normal course of business. The ability of
the Consolidated Entity to continue paying its debts
as and when they fall due is dependent on existing
contractual arrangements for the provision of services
to customers, acquisition of new rolling stock and
payments to financiers with respect to rolling stock
previously acquired under lease or finance, continuing
to operate as originally intended. In respect of rolling
stock previously acquired under lease or finance, the
arrangements whereby PTV makes all payments to
the lessors or financiers on behalf of the Consolidated
Entity is confirmed by the Letter of Support provided
by the Department of Economic Development, Jobs,
Transport and Resources (“DEDJTR”) dated 9 August
2016 covering the period until 30 September 2017.
On the basis of the above factors, the Directors are
of the opinion that the Consolidated Entity are going
concerns and can pay their debts as and when they
fall due.
Note 1. Summary of significant
accounting policies (cont.)
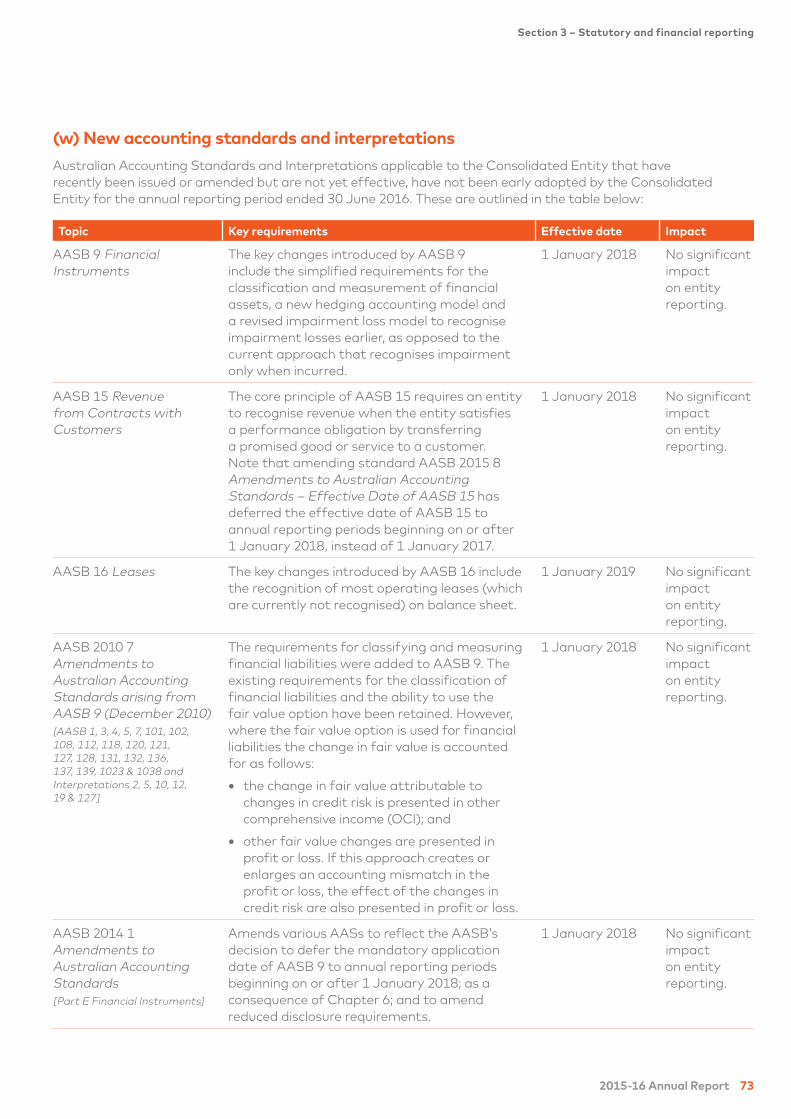
2015-16 Annual Report 73
Section 3 – Statutory and financial reporting
(w) New accounting standards and interpretations
Australian Accounting Standards and Interpretations applicable to the Consolidated Entity that have
recently been issued or amended but are not yet effective, have not been early adopted by the Consolidated
Entity for the annual reporting period ended 30 June 2016. These are outlined in the table below:
Topic Key requirements Effective date Impact
AASB 9 Financial
Instruments
The key changes introduced by AASB 9
include the simplified requirements for the
classification and measurement of financial
assets, a new hedging accounting model and
a revised impairment loss model to recognise
impairment losses earlier, as opposed to the
current approach that recognises impairment
only when incurred.
1 January 2018 No significant
impact
on entity
reporting.
AASB 15 Revenue
from Contracts with
Customers
The core principle of AASB 15 requires an entity
to recognise revenue when the entity satisfies
a performance obligation by transferring
a promised good or service to a customer.
Note that amending standard AASB 2015 8
Amendments to Australian Accounting
Standards – Effective Date of AASB 15 has
deferred the effective date of AASB 15 to
annual reporting periods beginning on or after
1 January 2018, instead of 1 January 2017.
1 January 2018 No significant
impact
on entity
reporting.
AASB 16 Leases The key changes introduced by AASB 16 include
the recognition of most operating leases (which
are currently not recognised) on balance sheet.
1 January 2019 No significant
impact
on entity
reporting.
AASB 2010 7
Amendments to
Australian Accounting
Standards arising from
AASB 9 (December 2010)
[AASB 1, 3, 4, 5, 7, 101, 102,
108, 112, 118, 120, 121,
127, 128, 131, 132, 136,
137, 139, 1023 & 1038 and
Interpretations 2, 5, 10, 12,
19 & 127]
The requirements for classifying and measuring
financial liabilities were added to AASB 9. The
existing requirements for the classification of
financial liabilities and the ability to use the
fair value option have been retained. However,
where the fair value option is used for financial
liabilities the change in fair value is accounted
for as follows:
• the change in fair value attributable to
changes in credit risk is presented in other
comprehensive income (OCI); and
• other fair value changes are presented in
profit or loss. If this approach creates or
enlarges an accounting mismatch in the
profit or loss, the effect of the changes in
credit risk are also presented in profit or loss.
1 January 2018 No significant
impact
on entity
reporting.
AASB 2014 1
Amendments to
Australian Accounting
Standards
[Part E Financial Instruments]
Amends various AASs to reflect the AASB’s
decision to defer the mandatory application
date of AASB 9 to annual reporting periods
beginning on or after 1 January 2018; as a
consequence of Chapter 6; and to amend
reduced disclosure requirements.
1 January 2018 No significant
impact
on entity
reporting.
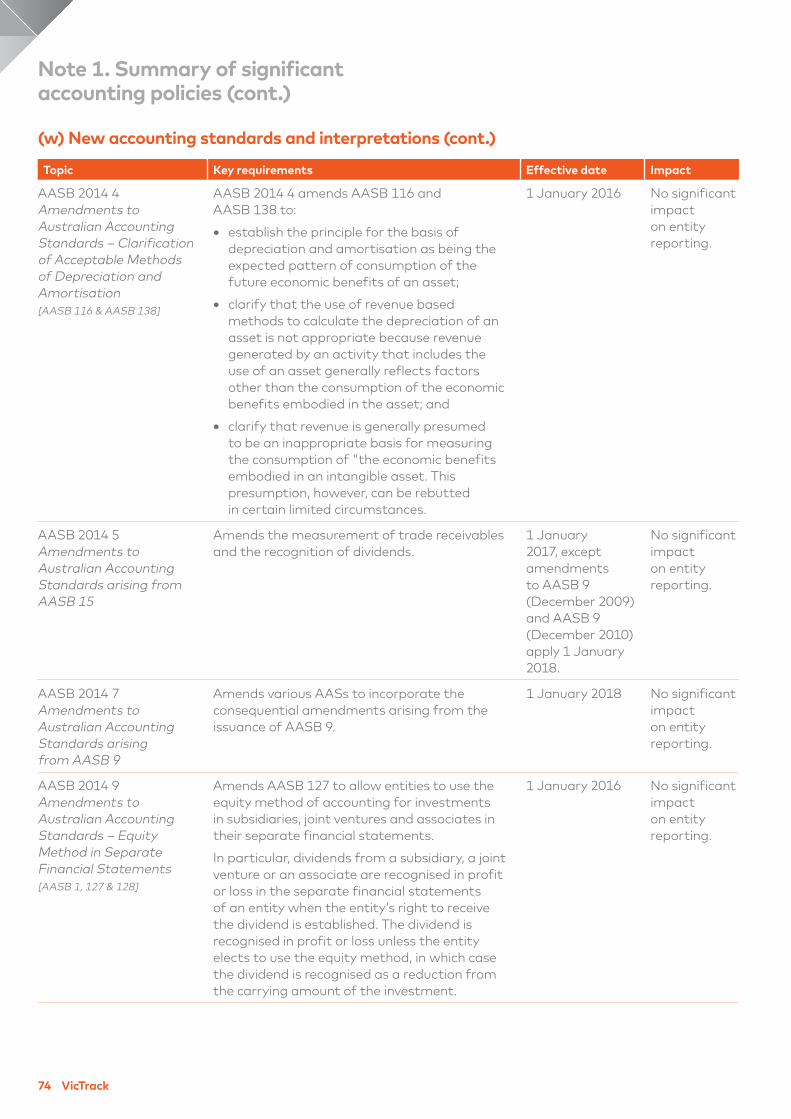
74 VicTrack
Topic Key requirements Effective date Impact
AASB 2014 4
Amendments to
Australian Accounting
Standards – Clarification
of Acceptable Methods
of Depreciation and
Amortisation
[AASB 116 & AASB 138]
AASB 2014 4 amends AASB 116 and
AASB 138 to:
• establish the principle for the basis of
depreciation and amortisation as being the
expected pattern of consumption of the
future economic benefits of an asset;
• clarify that the use of revenue based
methods to calculate the depreciation of an
asset is not appropriate because revenue
generated by an activity that includes the
use of an asset generally reflects factors
other than the consumption of the economic
benefits embodied in the asset; and
• clarify that revenue is generally presumed
to be an inappropriate basis for measuring
the consumption of "the economic benefits
embodied in an intangible asset. This
presumption, however, can be rebutted
in certain limited circumstances.
1 January 2016 No significant
impact
on entity
reporting.
AASB 2014 5
Amendments to
Australian Accounting
Standards arising from
AASB 15
Amends the measurement of trade receivables
and the recognition of dividends.
1 January
2017, except
amendments
to AASB 9
(December 2009)
and AASB 9
(December 2010)
apply 1 January
2018.
No significant
impact
on entity
reporting.
AASB 2014 7
Amendments to
Australian Accounting
Standards arising
from AASB 9
Amends various AASs to incorporate the
consequential amendments arising from the
issuance of AASB 9.
1 January 2018 No significant
impact
on entity
reporting.
AASB 2014 9
Amendments to
Australian Accounting
Standards – Equity
Method in Separate
Financial Statements
[AASB 1, 127 & 128]
Amends AASB 127 to allow entities to use the
equity method of accounting for investments
in subsidiaries, joint ventures and associates in
their separate financial statements.
In particular, dividends from a subsidiary, a joint
venture or an associate are recognised in profit
or loss in the separate financial statements
of an entity when the entity’s right to receive
the dividend is established. The dividend is
recognised in profit or loss unless the entity
elects to use the equity method, in which case
the dividend is recognised as a reduction from
the carrying amount of the investment.
1 January 2016 No significant
impact
on entity
reporting.
Note 1. Summary of significant
accounting policies (cont.)
(w) New accounting standards and interpretations (cont.)
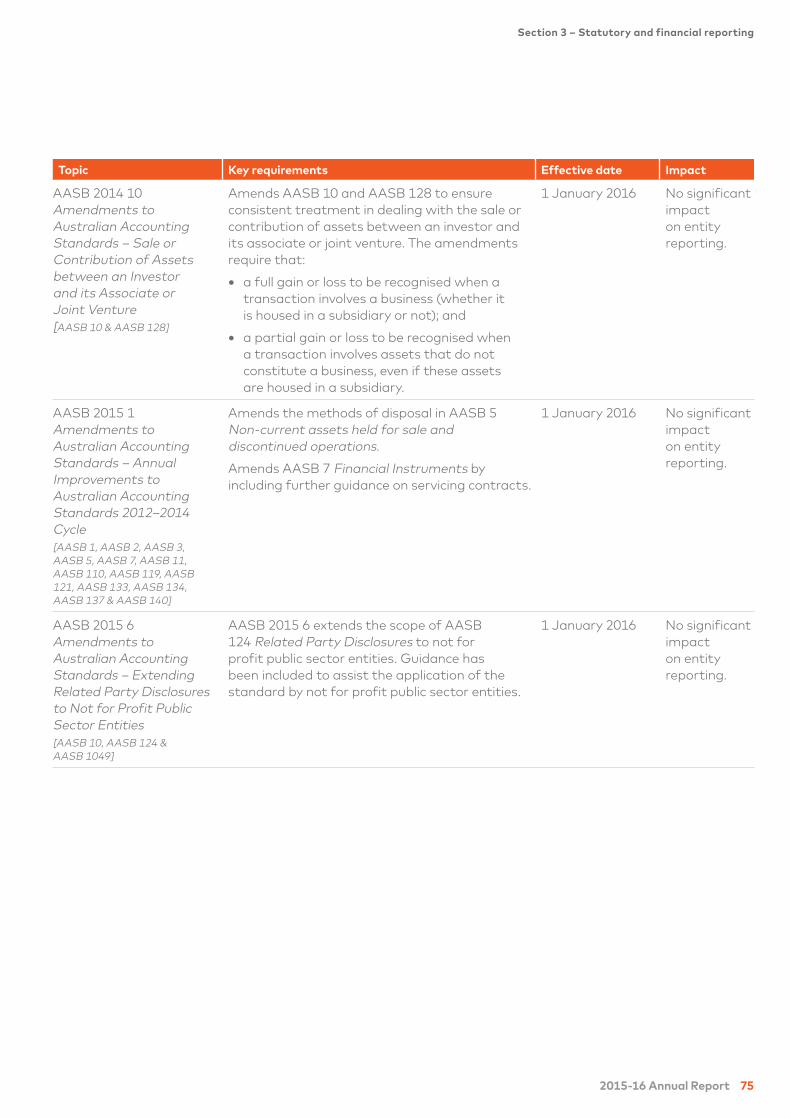
2015-16 Annual Report 75
Section 3 – Statutory and financial reporting
Topic Key requirements Effective date Impact
AASB 2014 10
Amendments to
Australian Accounting
Standards – Sale or
Contribution of Assets
between an Investor
and its Associate or
Joint Venture
[AASB 10 & AASB 128]
Amends AASB 10 and AASB 128 to ensure
consistent treatment in dealing with the sale or
contribution of assets between an investor and
its associate or joint venture. The amendments
require that:
• a full gain or loss to be recognised when a
transaction involves a business (whether it
is housed in a subsidiary or not); and
• a partial gain or loss to be recognised when
a transaction involves assets that do not
constitute a business, even if these assets
are housed in a subsidiary.
1 January 2016 No significant
impact
on entity
reporting.
AASB 2015 1
Amendments to
Australian Accounting
Standards – Annual
Improvements to
Australian Accounting
Standards 2012–2014
Cycle
[AASB 1, AASB 2, AASB 3,
AASB 5, AASB 7, AASB 11,
AASB 110, AASB 119, AASB
121, AASB 133, AASB 134,
AASB 137 & AASB 140]
Amends the methods of disposal in AASB 5
Non-current assets held for sale and
discontinued operations.
Amends AASB 7 Financial Instruments by
including further guidance on servicing contracts.
1 January 2016 No significant
impact
on entity
reporting.
AASB 2015 6
Amendments to
Australian Accounting
Standards – Extending
Related Party Disclosures
to Not for Profit Public
Sector Entities
[AASB 10, AASB 124 &
AASB 1049]
AASB 2015 6 extends the scope of AASB
124 Related Party Disclosures to not for
profit public sector entities. Guidance has
been included to assist the application of the
standard by not for profit public sector entities.
1 January 2016 No significant
impact
on entity
reporting.
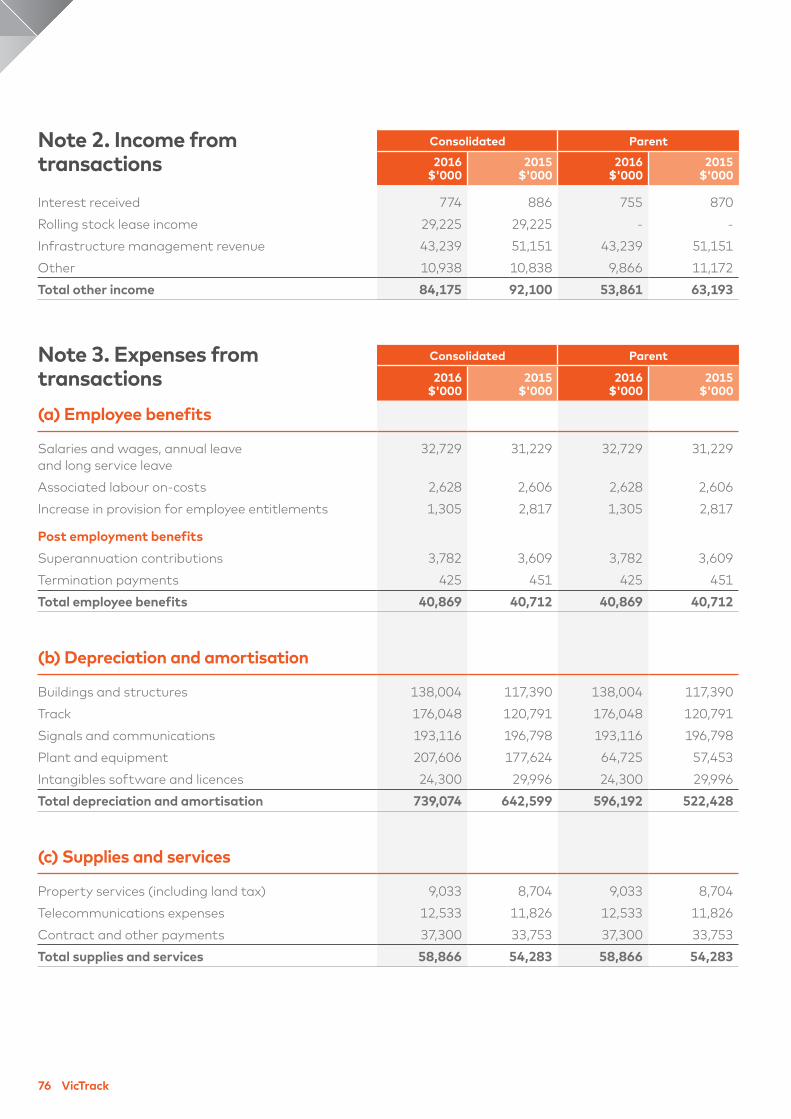
76 VicTrack
Note 2. Income from
transactions
Consolidated Parent
2016
$'000
2015
$'000
2016
$'000
2015
$'000
Interest received 774 886 755 870
Rolling stock lease income 29,225 29,225 - -
Infrastructure management revenue 43,239 51,151 43,239 51,151
Other 10,938 10,838 9,866 11,172
Total other income 84,175 92,100 53,861 63,193
Note 3. Expenses from
transactions
Consolidated Parent
2016
$'000
2015
$'000
2016
$'000
2015
$'000
(a) Employee benefits
Salaries and wages, annual leave
and long service leave
32,729 31,229 32,729 31,229
Associated labour on-costs 2,628 2,606 2,628 2,606
Increase in provision for employee entitlements 1,305 2,817 1,305 2,817
Post employment benefits
Superannuation contributions 3,782 3,609 3,782 3,609
Termination payments 425 451 425 451
Total employee benefits 40,869 40,712 40,869 40,712
(b) Depreciation and amortisation
Buildings and structures 138,004 117,390 138,004 117,390
Track 176,048 120,791 176,048 120,791
Signals and communications 193,116 196,798 193,116 196,798
Plant and equipment 207,606 177,624 64,725 57,453
Intangibles software and licences 24,300 29,996 24,300 29,996
Total depreciation and amortisation 739,074 642,599 596,192 522,428
(c) Supplies and services
Property services (including land tax) 9,033 8,704 9,033 8,704
Telecommunications expenses 12,533 11,826 12,533 11,826
Contract and other payments 37,300 33,753 37,300 33,753
Total supplies and services 58,866 54,283 58,866 54,283
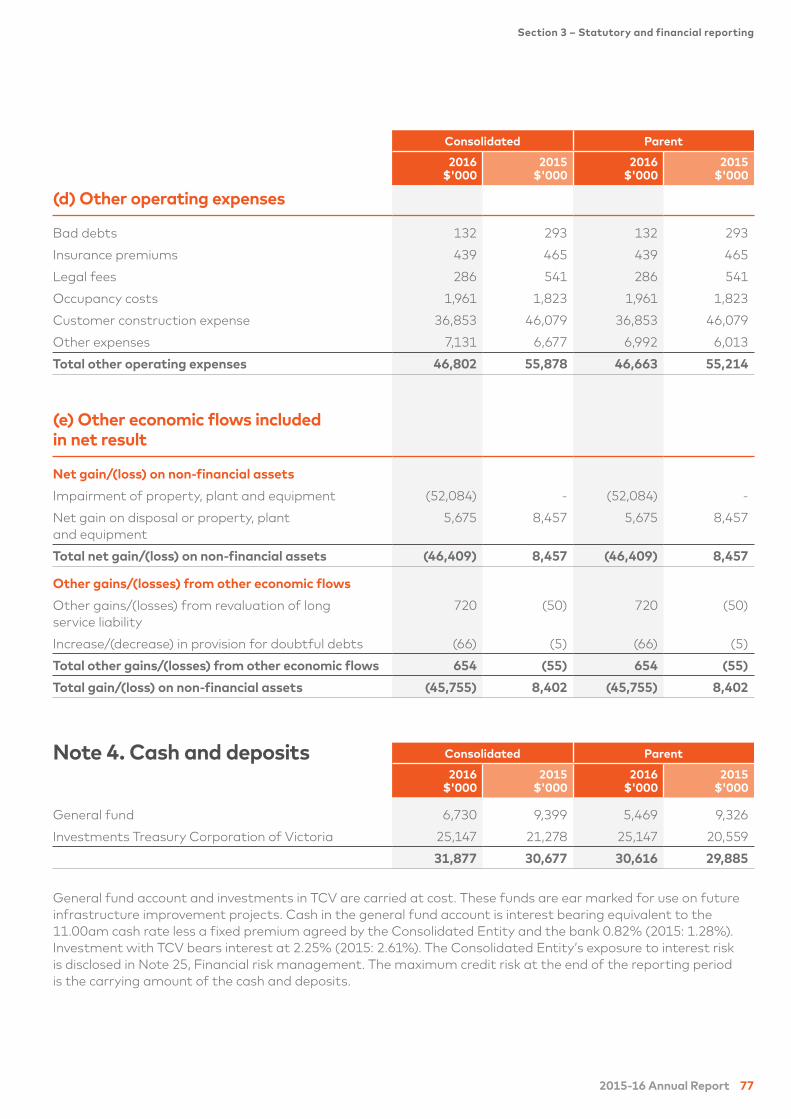
2015-16 Annual Report 77
Section 3 – Statutory and financial reporting
Consolidated Parent
2016
$'000
2015
$'000
2016
$'000
2015
$'000
(d) Other operating expenses
Bad debts 132 293 132 293
Insurance premiums 439 465 439 465
Legal fees 286 541 286 541
Occupancy costs 1,961 1,823 1,961 1,823
Customer construction expense 36,853 46,079 36,853 46,079
Other expenses 7,131 6,677 6,992 6,013
Total other operating expenses 46,802 55,878 46,663 55,214
(e) Other economic flows included
in net result
Net gain/(loss) on non-financial assets
Impairment of property, plant and equipment (52,084) - (52,084) -
Net gain on disposal or property, plant
and equipment
5,675 8,457 5,675 8,457
Total net gain/(loss) on non-financial assets (46,409) 8,457 (46,409) 8,457
Other gains/(losses) from other economic flows
Other gains/(losses) from revaluation of long
service liability
720 (50) 720 (50)
Increase/(decrease) in provision for doubtful debts (66) (5) (66) (5)
Total other gains/(losses) from other economic flows 654 (55) 654 (55)
Total gain/(loss) on non-financial assets (45,755) 8,402 (45,755) 8,402
Note 4. Cash and deposits Consolidated Parent
2016
$'000
2015
$'000
2016
$'000
2015
$'000
General fund 6,730 9,399 5,469 9,326
Investments Treasury Corporation of Victoria 25,147 21,278 25,147 20,559
31,877 30,677 30,616 29,885
General fund account and investments in TCV are carried at cost. These funds are ear marked for use on future
infrastructure improvement projects. Cash in the general fund account is interest bearing equivalent to the
11.00am cash rate less a fixed premium agreed by the Consolidated Entity and the bank 0.82% (2015: 1.28%).
Investment with TCV bears interest at 2.25% (2015: 2.61%). The Consolidated Entity’s exposure to interest risk
is disclosed in Note 25, Financial risk management. The maximum credit risk at the end of the reporting period
is the carrying amount of the cash and deposits.
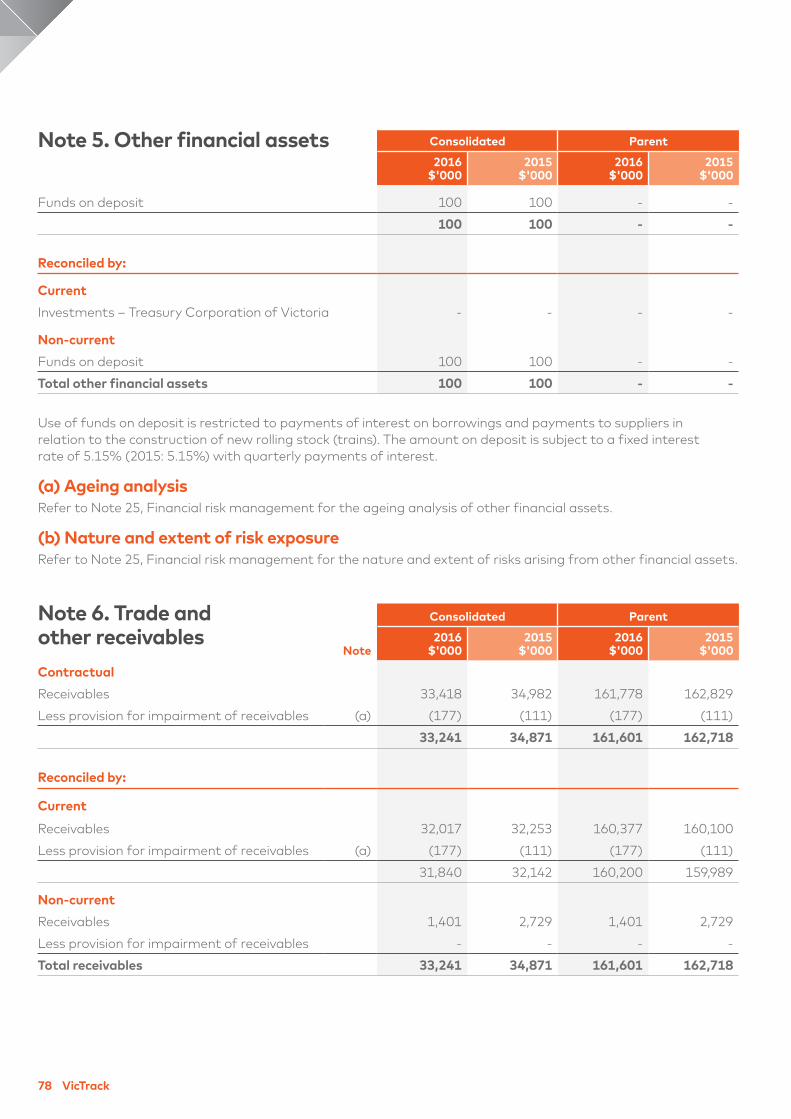
78 VicTrack
Note 5. Other financial assets Consolidated Parent
2016
$'000
2015
$'000
2016
$'000
2015
$'000
Funds on deposit 100 100 - -
100 100 - -
Reconciled by:
Current
Investments – Treasury Corporation of Victoria - - - -
Non-current
Funds on deposit 100 100 - -
Total other financial assets 100 100 - -
Use of funds on deposit is restricted to payments of interest on borrowings and payments to suppliers in
relation to the construction of new rolling stock (trains). The amount on deposit is subject to a fixed interest
rate of 5.15% (2015: 5.15%) with quarterly payments of interest.
(a) Ageing analysis
Refer to Note 25, Financial risk management for the ageing analysis of other financial assets.
(b) Nature and extent of risk exposure
Refer to Note 25, Financial risk management for the nature and extent of risks arising from other financial assets.
Note 6. Trade and
other receivables
Consolidated Parent
Note
2016
$'000
2015
$'000
2016
$'000
2015
$'000
Contractual
Receivables 33,418 34,982 161,778 162,829
Less provision for impairment of receivables (a) (177) (111) (177) (111)
33,241 34,871 161,601 162,718
Reconciled by:
Current
Receivables 32,017 32,253 160,377 160,100
Less provision for impairment of receivables (a) (177) (111) (177) (111)
31,840 32,142 160,200 159,989
Non-current
Receivables 1,401 2,729 1,401 2,729
Less provision for impairment of receivables - - - -
Total receivables 33,241 34,871 161,601 162,718
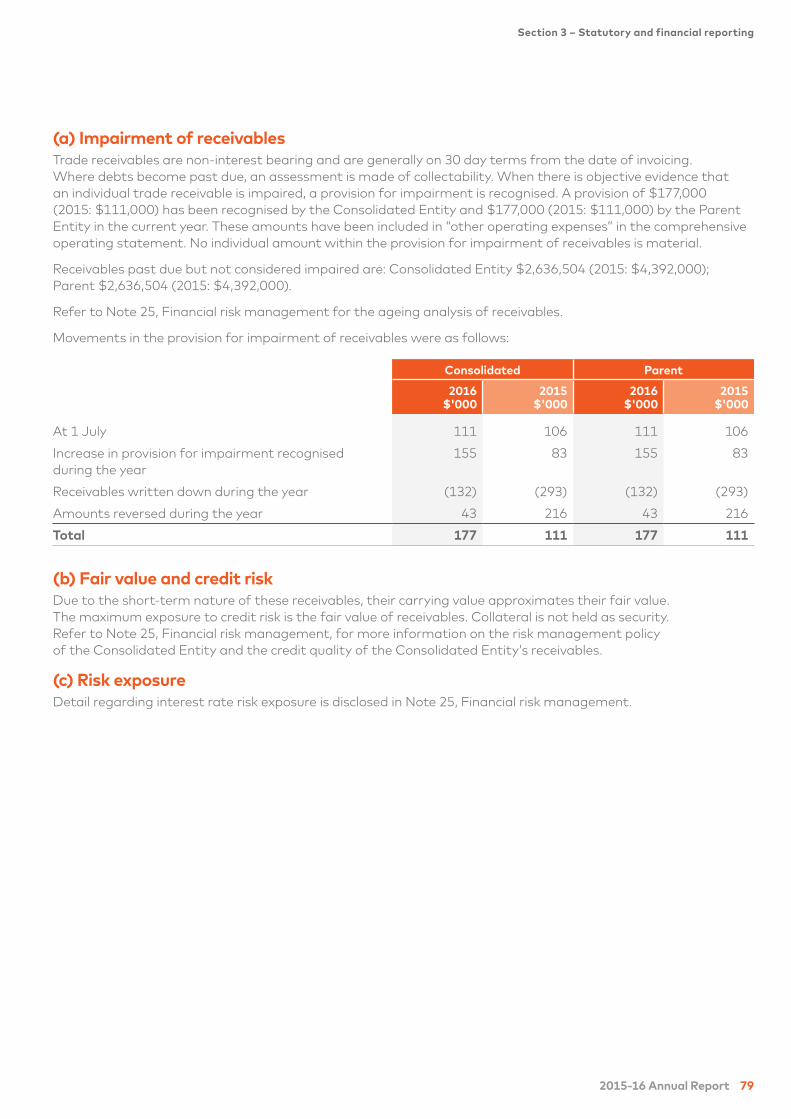
2015-16 Annual Report 79
Section 3 – Statutory and financial reporting
(a) Impairment of receivables
Trade receivables are non-interest bearing and are generally on 30 day terms from the date of invoicing.
Where debts become past due, an assessment is made of collectability. When there is objective evidence that
an individual trade receivable is impaired, a provision for impairment is recognised. A provision of $177,000
(2015: $111,000) has been recognised by the Consolidated Entity and $177,000 (2015: $111,000) by the Parent
Entity in the current year. These amounts have been included in “other operating expenses” in the comprehensive
operating statement. No individual amount within the provision for impairment of receivables is material.
Receivables past due but not considered impaired are: Consolidated Entity $2,636,504 (2015: $4,392,000);
Parent $2,636,504 (2015: $4,392,000).
Refer to Note 25, Financial risk management for the ageing analysis of receivables.
Movements in the provision for impairment of receivables were as follows:
Consolidated Parent
2016
$'000
2015
$'000
2016
$'000
2015
$'000
At 1 July 111 106 111 106
Increase in provision for impairment recognised
during the year
155 83 155 83
Receivables written down during the year (132) (293) (132) (293)
Amounts reversed during the year 43 216 43 216
Total 177 111 177 111
(b) Fair value and credit risk
Due to the short-term nature of these receivables, their carrying value approximates their fair value.
The maximum exposure to credit risk is the fair value of receivables. Collateral is not held as security.
Refer to Note 25, Financial risk management, for more information on the risk management policy
of the Consolidated Entity and the credit quality of the Consolidated Entity’s receivables.
(c) Risk exposure
Detail regarding interest rate risk exposure is disclosed in Note 25, Financial risk management.
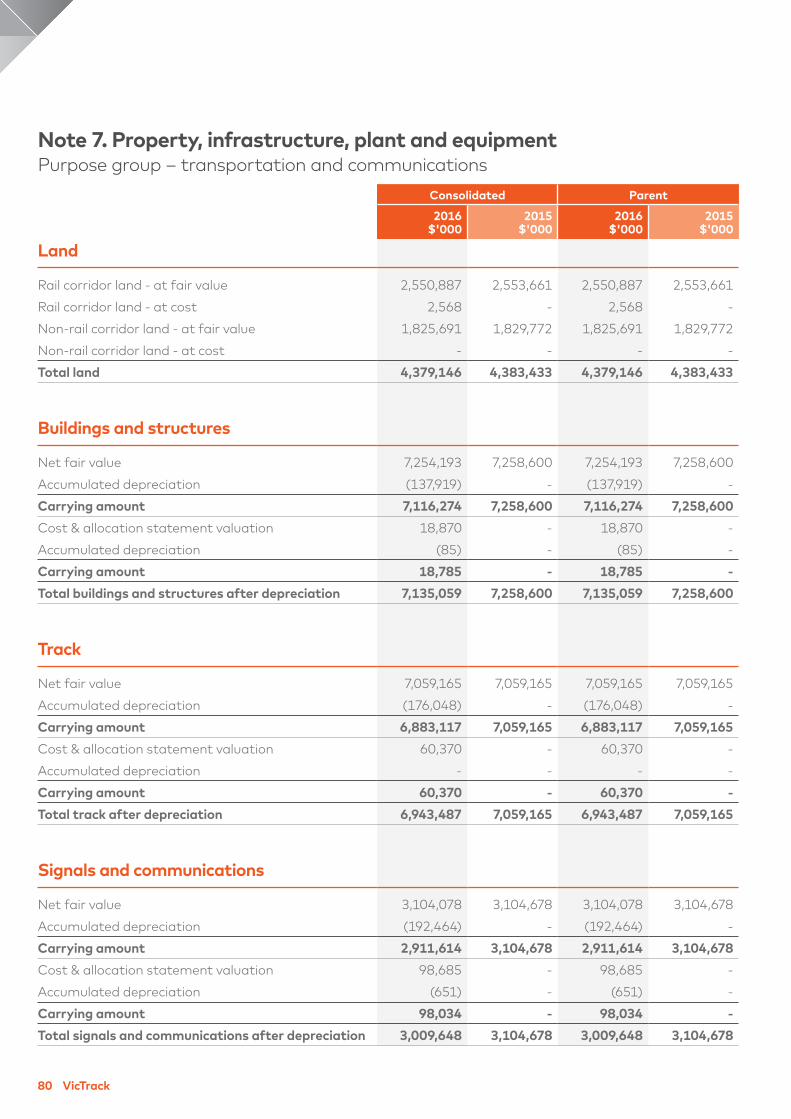
80 VicTrack
Note 7. Property, infrastructure, plant and equipment
Purpose group – transportation and communications
Consolidated Parent
2016
$'000
2015
$'000
2016
$'000
2015
$'000
Land
Rail corridor land - at fair value 2,550,887 2,553,661 2,550,887 2,553,661
Rail corridor land - at cost 2,568 - 2,568 -
Non-rail corridor land - at fair value 1,825,691 1,829,772 1,825,691 1,829,772
Non-rail corridor land - at cost - - - -
Total land 4,379,146 4,383,433 4,379,146 4,383,433
Buildings and structures
Net fair value 7,254,193 7,258,600 7,254,193 7,258,600
Accumulated depreciation (137,919) - (137,919) -
Carrying amount 7,116,274 7,258,600 7,116,274 7,258,600
Cost & allocation statement valuation 18,870 - 18,870 -
Accumulated depreciation (85) - (85) -
Carrying amount 18,785 - 18,785 -
Total buildings and structures after depreciation 7,135,059 7,258,600 7,135,059 7,258,600
Track
Net fair value 7,059,165 7,059,165 7,059,165 7,059,165
Accumulated depreciation (176,048) - (176,048) -
Carrying amount 6,883,117 7,059,165 6,883,117 7,059,165
Cost & allocation statement valuation 60,370 - 60,370 -
Accumulated depreciation - - - -
Carrying amount 60,370 - 60,370 -
Total track after depreciation 6,943,487 7,059,165 6,943,487 7,059,165
Signals and communications
Net fair value 3,104,078 3,104,678 3,104,078 3,104,678
Accumulated depreciation (192,464) - (192,464) -
Carrying amount 2,911,614 3,104,678 2,911,614 3,104,678
Cost & allocation statement valuation 98,685 - 98,685 -
Accumulated depreciation (651) - (651) -
Carrying amount 98,034 - 98,034 -
Total signals and communications after depreciation 3,009,648 3,104,678 3,009,648 3,104,678
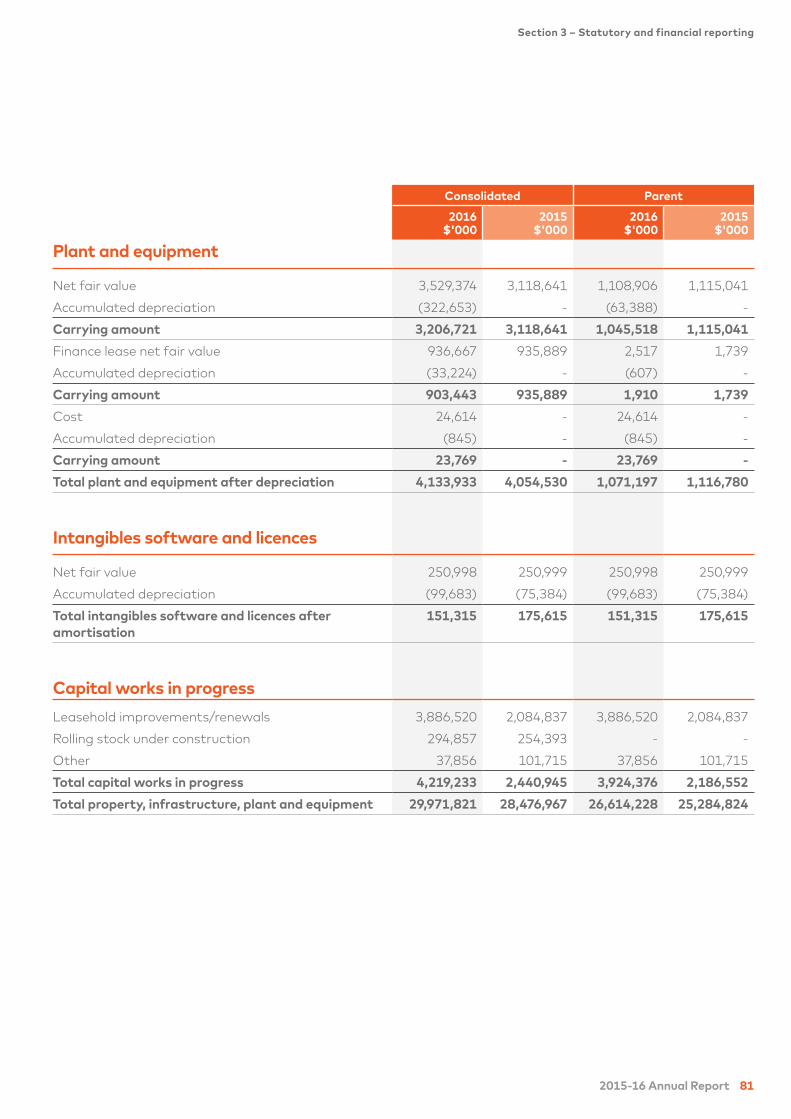
2015-16 Annual Report 81
Section 3 – Statutory and financial reporting
Consolidated Parent
2016
$'000
2015
$'000
2016
$'000
2015
$'000
Plant and equipment
Net fair value 3,529,374 3,118,641 1,108,906 1,115,041
Accumulated depreciation (322,653) - (63,388) -
Carrying amount 3,206,721 3,118,641 1,045,518 1,115,041
Finance lease net fair value 936,667 935,889 2,517 1,739
Accumulated depreciation (33,224) - (607) -
Carrying amount 903,443 935,889 1,910 1,739
Cost 24,614 - 24,614 -
Accumulated depreciation (845) - (845) -
Carrying amount 23,769 - 23,769 -
Total plant and equipment after depreciation 4,133,933 4,054,530 1,071,197 1,116,780
Intangibles software and licences
Net fair value 250,998 250,999 250,998 250,999
Accumulated depreciation (99,683) (75,384) (99,683) (75,384)
Total intangibles software and licences after
amortisation
151,315 175,615 151,315 175,615
Capital works in progress
Leasehold improvements/renewals 3,886,520 2,084,837 3,886,520 2,084,837
Rolling stock under construction 294,857 254,393 - -
Other 37,856 101,715 37,856 101,715
Total capital works in progress 4,219,233 2,440,945 3,924,376 2,186,552
Total property, infrastructure, plant and equipment 29,971,821 28,476,967 26,614,228 25,284,824
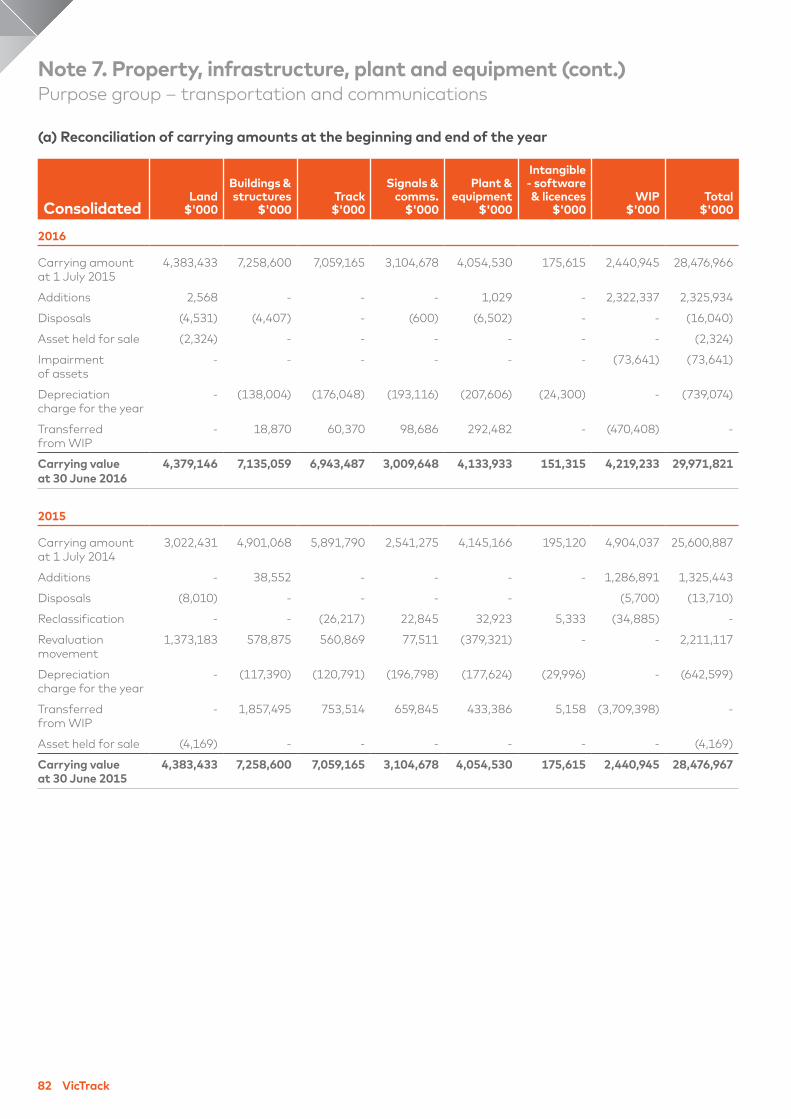
82 VicTrack
(a) Reconciliation of carrying amounts at the beginning and end of the year
Consolidated
Land
$'000
Buildings &
structures
$'000
Track
$'000
Signals &
comms.
$'000
Plant &
equipment
$'000
Intangible
- software
& licences
$'000
WIP
$'000
Total
$'000
2016
Carrying amount
at 1 July 2015
4,383,433 7,258,600 7,059,165 3,104,678 4,054,530 175,615 2,440,945 28,476,966
Additions 2,568 - - - 1,029 - 2,322,337 2,325,934
Disposals (4,531) (4,407) - (600) (6,502) - - (16,040)
Asset held for sale (2,324) - - - - - - (2,324)
Impairment
of assets
- - - - - - (73,641) (73,641)
Depreciation
charge for the year
- (138,004) (176,048) (193,116) (207,606) (24,300) - (739,074)
Transferred
from WIP
- 18,870 60,370 98,686 292,482 - (470,408) -
Carrying value
at 30 June 2016
4,379,146 7,135,059 6,943,487 3,009,648 4,133,933 151,315 4,219,233 29,971,821
2015
Carrying amount
at 1 July 2014
3,022,431 4,901,068 5,891,790 2,541,275 4,145,166 195,120 4,904,037 25,600,887
Additions - 38,552 - - - - 1,286,891 1,325,443
Disposals (8,010) - - - - (5,700) (13,710)
Reclassification - - (26,217) 22,845 32,923 5,333 (34,885) -
Revaluation
movement
1,373,183 578,875 560,869 77,511 (379,321) - - 2,211,117
Depreciation
charge for the year
- (117,390) (120,791) (196,798) (177,624) (29,996) - (642,599)
Transferred
from WIP
- 1,857,495 753,514 659,845 433,386 5,158 (3,709,398) -
Asset held for sale (4,169) - - - - - - (4,169)
Carrying value
at 30 June 2015
4,383,433 7,258,600 7,059,165 3,104,678 4,054,530 175,615 2,440,945 28,476,967
Note 7. Property, infrastructure, plant and equipment (cont.)
Purpose group – transportation and communications
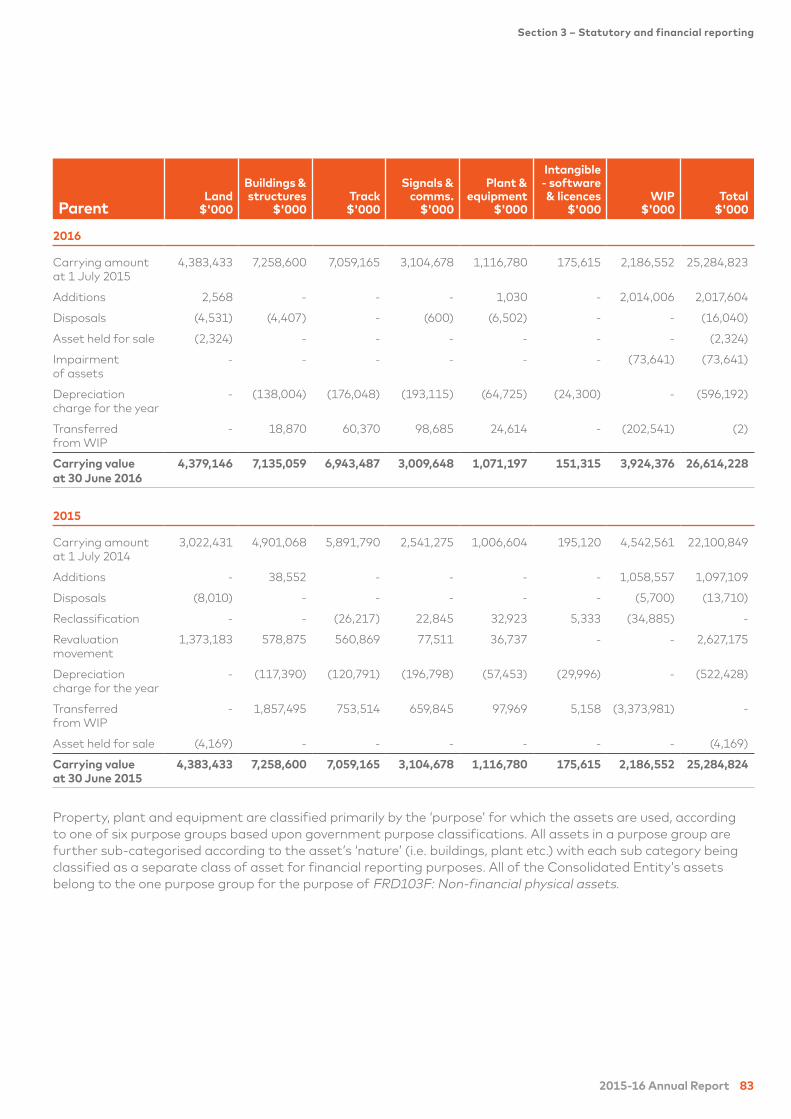
2015-16 Annual Report 83
Section 3 – Statutory and financial reporting
Parent
Land
$'000
Buildings &
structures
$'000
Track
$'000
Signals &
comms.
$'000
Plant &
equipment
$'000
Intangible
- software
& licences
$'000
WIP
$'000
Total
$'000
2016
Carrying amount
at 1 July 2015
4,383,433 7,258,600 7,059,165 3,104,678 1,116,780 175,615 2,186,552 25,284,823
Additions 2,568 - - - 1,030 - 2,014,006 2,017,604
Disposals (4,531) (4,407) - (600) (6,502) - - (16,040)
Asset held for sale (2,324) - - - - - - (2,324)
Impairment
of assets
- - - - - - (73,641) (73,641)
Depreciation
charge for the year
- (138,004) (176,048) (193,115) (64,725) (24,300) - (596,192)
Transferred
from WIP
- 18,870 60,370 98,685 24,614 - (202,541) (2)
Carrying value
at 30 June 2016
4,379,146 7,135,059 6,943,487 3,009,648 1,071,197 151,315 3,924,376 26,614,228
2015
Carrying amount
at 1 July 2014
3,022,431 4,901,068 5,891,790 2,541,275 1,006,604 195,120 4,542,561 22,100,849
Additions - 38,552 - - - - 1,058,557 1,097,109
Disposals (8,010) - - - - - (5,700) (13,710)
Reclassification - - (26,217) 22,845 32,923 5,333 (34,885) -
Revaluation
movement
1,373,183 578,875 560,869 77,511 36,737 - - 2,627,175
Depreciation
charge for the year
- (117,390) (120,791) (196,798) (57,453) (29,996) - (522,428)
Transferred
from WIP
- 1,857,495 753,514 659,845 97,969 5,158 (3,373,981) -
Asset held for sale (4,169) - - - - - - (4,169)
Carrying value
at 30 June 2015
4,383,433 7,258,600 7,059,165 3,104,678 1,116,780 175,615 2,186,552 25,284,824
Property, plant and equipment are classified primarily by the ‘purpose’ for which the assets are used, according
to one of six purpose groups based upon government purpose classifications. All assets in a purpose group are
further sub-categorised according to the asset’s ‘nature’ (i.e. buildings, plant etc.) with each sub category being
classified as a separate class of asset for financial reporting purposes. All of the Consolidated Entity’s assets
belong to the one purpose group for the purpose of FRD103F: Non-financial physical assets.
84 VicTrack
(b) Valuations of land
Land is shown at fair value based on an independent
valuation undertaken by the VGV as at 30 June 2015.
Subsequent fair value assessment (and if necessary
revaluation) have been undertaken using indices
based (where required) in accordance with FRD103F:
Non-Financial Physical Assets.
(c) Valuations of buildings and structures
Building and structures are shown based on an
independent valuation undertaken by the VGV as at
30 June 2015. The fair value was determined on the
basis of depreciated replacement cost. An impairment
analysis has been carried out annually since with no
impairment noted.
(d) Valuations of track
Track is shown based on an independent valuation
undertaken by the VGV as at 30 June 2015. The fair
value was determined on the basis of depreciated
replacement cost. An impairment analysis has been
carried out annually since with no impairment noted.
(e) Valuations of signals
and communications
Signals and communications are shown based on an
independent valuation undertaken by the VGV as at
30 June 2015. The fair value was determined on the
basis of depreciated replacement cost. An impairment
analysis has been carried out annually since with no
impairment noted.
(f) Valuations of plant and equipment
& intangible software and licenses
Plant and equipment are shown based on an
independent valuation undertaken by the VGV as at
30 June 2015. The fair value was determined on the
basis of depreciated replacement cost. Software and
licences are carried at historical cost. An impairment
analysis has been carried out annually since with no
impairment noted.
(g) Fair value measurements
Victrack measures and recognises its assets at fair
value less any subsequent accumulated depreciation
and subsequent accumulated impairment losses under
AASB 116 Property, Plant & Equipment.
(i) Fair value hierarchy
AASB 13 Fair value measurement requires disclosure
of fair value measurements by level of the following
fair value measurement hierarchy:
(a) quoted prices (unadjusted) in active markets
for identical assets or liabilities (level 1);
(b) inputs other than quoted prices included within
level 1 that are observable for the asset or liability,
either directly or indirectly (level 2); and
(c) inputs for the asset or liability that are not based
on observable market data (unobservable inputs)
(level 3).
To provide an indication about the subjectivity of the
inputs used in determining fair value, the Consolidated
Entity has classified its assets into the appropriate
level of the fair value hierarchy as prescribed under
the accounting standards in the following table.
Note 7. Property, infrastructure, plant and equipment (cont.)
Purpose group – transportation and communications
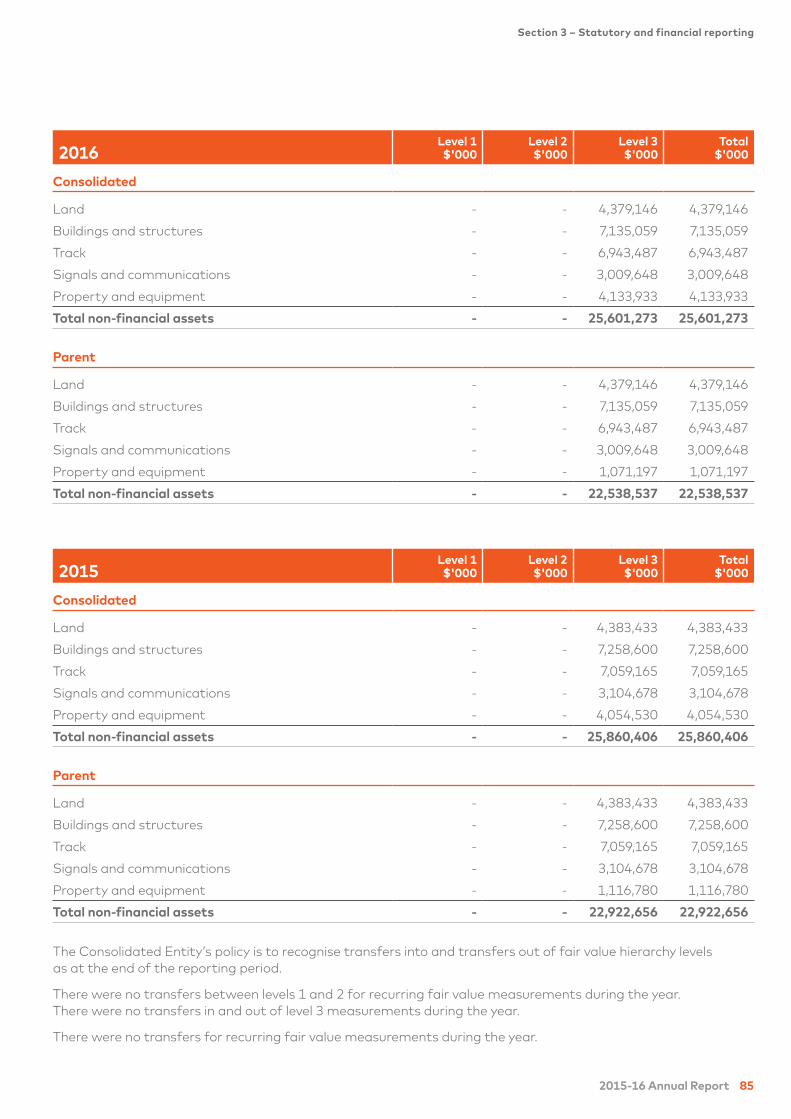
2015-16 Annual Report 85
Section 3 – Statutory and financial reporting
2016Level 1
$'000
Level 2
$'000
Level 3
$'000
Total
$'000
Consolidated
Land - - 4,379,146 4,379,146
Buildings and structures - - 7,135,059 7,135,059
Track - - 6,943,487 6,943,487
Signals and communications - - 3,009,648 3,009,648
Property and equipment - - 4,133,933 4,133,933
Total non-financial assets - - 25,601,273 25,601,273
Parent
Land - - 4,379,146 4,379,146
Buildings and structures - - 7,135,059 7,135,059
Track - - 6,943,487 6,943,487
Signals and communications - - 3,009,648 3,009,648
Property and equipment - - 1,071,197 1,071,197
Total non-financial assets - - 22,538,537 22,538,537
2015Level 1
$'000
Level 2
$'000
Level 3
$'000
Total
$'000
Consolidated
Land - - 4,383,433 4,383,433
Buildings and structures - - 7,258,600 7,258,600
Track - - 7,059,165 7,059,165
Signals and communications - - 3,104,678 3,104,678
Property and equipment - - 4,054,530 4,054,530
Total non-financial assets - - 25,860,406 25,860,406
Parent
Land - - 4,383,433 4,383,433
Buildings and structures - - 7,258,600 7,258,600
Track - - 7,059,165 7,059,165
Signals and communications - - 3,104,678 3,104,678
Property and equipment - - 1,116,780 1,116,780
Total non-financial assets - - 22,922,656 22,922,656
The Consolidated Entity’s policy is to recognise transfers into and transfers out of fair value hierarchy levels
as at the end of the reporting period.
There were no transfers between levels 1 and 2 for recurring fair value measurements during the year.
There were no transfers in and out of level 3 measurements during the year.
There were no transfers for recurring fair value measurements during the year.
86 VicTrack
(ii) Valuation techniques used to determine
fair values
In addition to the Australian Accounting Standards
and Interpretations, as a public sector agency the
Consolidated Entity is also required to comply with
the FRDs issued DTF. FRD103F: Non-Financial
Physical Assets requires all non-current physical
assets to be measured (after initial recognition
at cost) using the revaluation model. In accordance
FRD103F: Non-Financial Physical Assets requirements,
the Consolidated Entity has adopted fair value for
all its classes of fixed assets except capital works in
progress. The Consolidated Entity obtains external,
independent valuations for its fixed assets every
five years. At the end of each reporting period,
management update their assessment of the fair
value of the assets, taking into account the most
recent independent valuation. Refer below for
further information on the valuation process.
All assets are valued using the depreciated replacement
cost method with the exception of land. This method
represents the current cost of reproduction or
replacement of an asset less deductions for physical
deterioration and all relevant forms of obsolescence
and optimisation. The method of valuation may vary
for each subcategory and inputs are determined
with reference to publicly available construction and
ancillary costs, and average asset price for comparable
local and global contracts. Relevant adjustments for
inflation and qualitative attractiveness (consisting of
functional and/or technical obsolescence) may also
be made. The replacement cost for each asset was
then depreciated using straight line depreciation on
the basis of remaining life as a proportion of total
economic life to arrive at depreciated replacement
cost for each asset.
The best evidence of fair value is current prices in
an active market for similar assets. Given the lack
of an active market for a majority, the Consolidated
Entity property, infrastructure, plant and equipment,
fair value is derived using information from a variety
of sources including prices for similar assets in less
active markets, adjusted to reflect those differences.
The specialised nature of most physical non-current
assets and/or significant imperfections in the
markets in which they are traded may preclude
the current market selling price from being observed.
These specialised assets are rarely, if ever, sold in the
market, except by way of a sale of the business entity
of which it is part, due to the uniqueness arising from
its specialised nature and design, its configuration,
size, location or otherwise.
Given that most of the valuation inputs, their
application within the valuation models and the
Consolidated Entity's determined depreciation
rates cannot be market-corroborated, the fair
value estimates in relation to these assets are
included in level 3.
Note 7. Property, infrastructure, plant and equipment (cont.)
Purpose group – transportation and communications
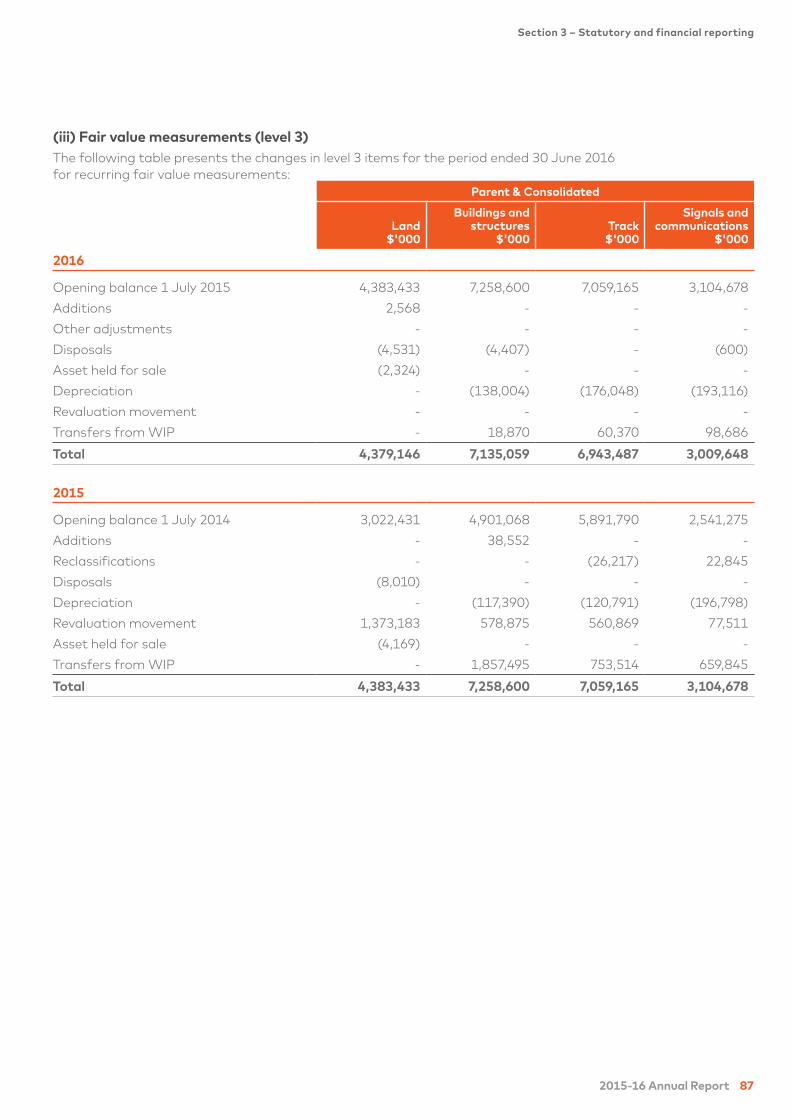
2015-16 Annual Report 87
Section 3 – Statutory and financial reporting
(iii) Fair value measurements (level 3)
The following table presents the changes in level 3 items for the period ended 30 June 2016
for recurring fair value measurements:
Parent & Consolidated
Land
$'000
Buildings and
structures
$'000
Track
$'000
Signals and
communications
$'000
2016
Opening balance 1 July 2015 4,383,433 7,258,600 7,059,165 3,104,678
Additions 2,568 - - -
Other adjustments - - - -
Disposals (4,531) (4,407) - (600)
Asset held for sale (2,324) - - -
Depreciation - (138,004) (176,048) (193,116)
Revaluation movement - - - -
Transfers from WIP - 18,870 60,370 98,686
Total 4,379,146 7,135,059 6,943,487 3,009,648
2015
Opening balance 1 July 2014 3,022,431 4,901,068 5,891,790 2,541,275
Additions - 38,552 - -
Reclassifications - - (26,217) 22,845
Disposals (8,010) - - -
Depreciation - (117,390) (120,791) (196,798)
Revaluation movement 1,373,183 578,875 560,869 77,511
Asset held for sale (4,169) - - -
Transfers from WIP - 1,857,495 753,514 659,845
Total 4,383,433 7,258,600 7,059,165 3,104,678
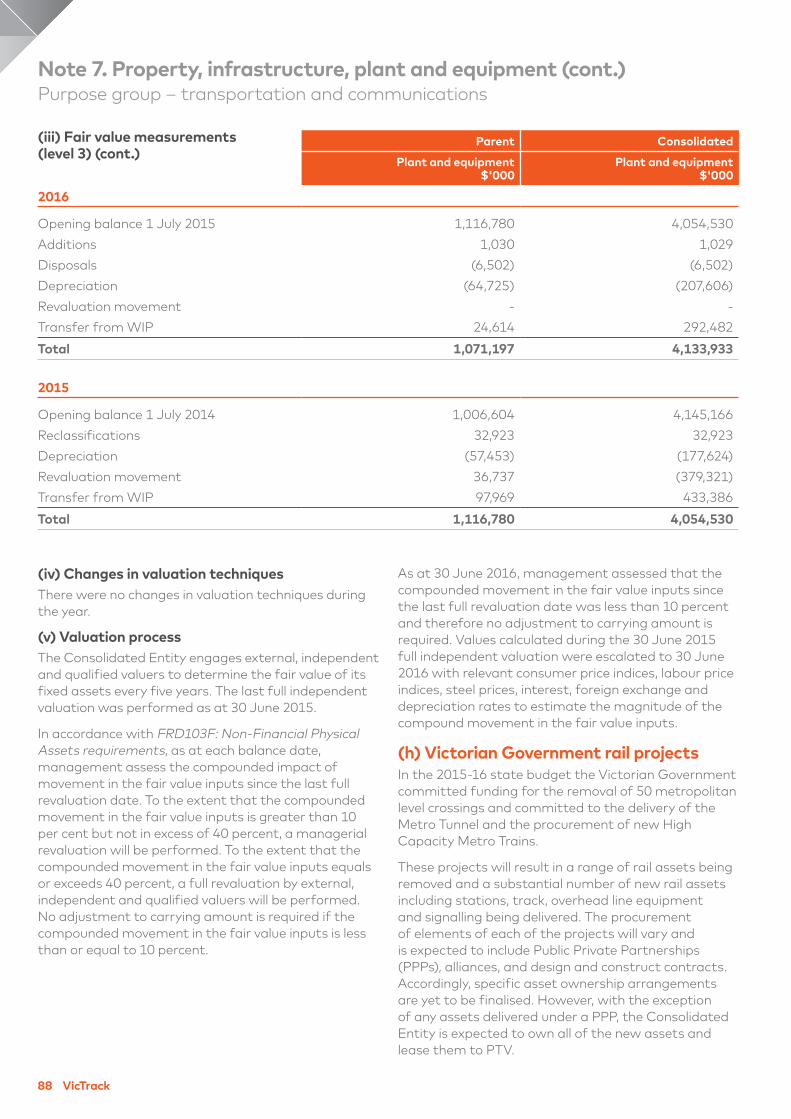
88 VicTrack
(iv) Changes in valuation techniques
There were no changes in valuation techniques during
the year.
(v) Valuation process
The Consolidated Entity engages external, independent
and qualified valuers to determine the fair value of its
fixed assets every five years. The last full independent
valuation was performed as at 30 June 2015.
In accordance with FRD103F: Non-Financial Physical
Assets requirements, as at each balance date,
management assess the compounded impact of
movement in the fair value inputs since the last full
revaluation date. To the extent that the compounded
movement in the fair value inputs is greater than 10
per cent but not in excess of 40 percent, a managerial
revaluation will be performed. To the extent that the
compounded movement in the fair value inputs equals
or exceeds 40 percent, a full revaluation by external,
independent and qualified valuers will be performed.
No adjustment to carrying amount is required if the
compounded movement in the fair value inputs is less
than or equal to 10 percent.
As at 30 June 2016, management assessed that the
compounded movement in the fair value inputs since
the last full revaluation date was less than 10 percent
and therefore no adjustment to carrying amount is
required. Values calculated during the 30 June 2015
full independent valuation were escalated to 30 June
2016 with relevant consumer price indices, labour price
indices, steel prices, interest, foreign exchange and
depreciation rates to estimate the magnitude of the
compound movement in the fair value inputs.
(h) Victorian Government rail projects
In the 2015-16 state budget the Victorian Government
committed funding for the removal of 50 metropolitan
level crossings and committed to the delivery of the
Metro Tunnel and the procurement of new High
Capacity Metro Trains.
These projects will result in a range of rail assets being
removed and a substantial number of new rail assets
including stations, track, overhead line equipment
and signalling being delivered. The procurement
of elements of each of the projects will vary and
is expected to include Public Private Partnerships
(PPPs), alliances, and design and construct contracts.
Accordingly, specific asset ownership arrangements
are yet to be finalised. However, with the exception
of any assets delivered under a PPP, the Consolidated
Entity is expected to own all of the new assets and
lease them to PTV.
Note 7. Property, infrastructure, plant and equipment (cont.)
Purpose group – transportation and communications
(iii) Fair value measurements
(level 3) (cont.)
Parent Consolidated
Plant and equipment
$'000
Plant and equipment
$'000
2016
Opening balance 1 July 2015 1,116,780 4,054,530
Additions 1,030 1,029
Disposals (6,502) (6,502)
Depreciation (64,725) (207,606)
Revaluation movement - -
Transfer from WIP 24,614 292,482
Total 1,071,197 4,133,933
2015
Opening balance 1 July 2014 1,006,604 4,145,166
Reclassifications 32,923 32,923
Depreciation (57,453) (177,624)
Revaluation movement 36,737 (379,321)
Transfer from WIP 97,969 433,386
Total 1,116,780 4,054,530
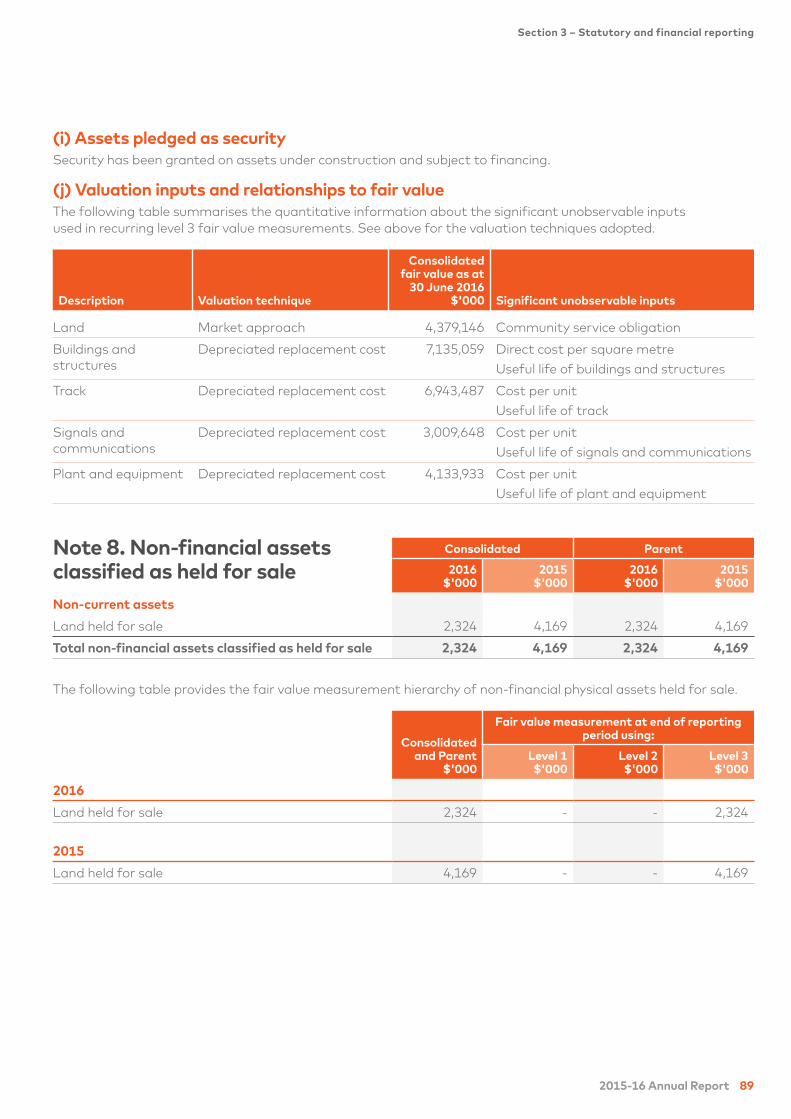
2015-16 Annual Report 89
Section 3 – Statutory and financial reporting
(i) Assets pledged as security
Security has been granted on assets under construction and subject to financing.
(j) Valuation inputs and relationships to fair value
The following table summarises the quantitative information about the significant unobservable inputs
used in recurring level 3 fair value measurements. See above for the valuation techniques adopted.
Description Valuation technique
Consolidated
fair value as at
30 June 2016
$'000 Significant unobservable inputs
Land Market approach 4,379,146 Community service obligation
Buildings and
structures
Depreciated replacement cost 7,135,059 Direct cost per square metre
Useful life of buildings and structures
Track Depreciated replacement cost 6,943,487 Cost per unit
Useful life of track
Signals and
communications
Depreciated replacement cost 3,009,648 Cost per unit
Useful life of signals and communications
Plant and equipment Depreciated replacement cost 4,133,933 Cost per unit
Useful life of plant and equipment
Note 8. Non-financial assets
classified as held for sale
Consolidated Parent
2016
$'000
2015
$'000
2016
$'000
2015
$'000
Non-current assets
Land held for sale 2,324 4,169 2,324 4,169
Total non-financial assets classified as held for sale 2,324 4,169 2,324 4,169
The following table provides the fair value measurement hierarchy of non-financial physical assets held for sale.
Consolidated
and Parent
$'000
Fair value measurement at end of reporting
period using:
Level 1
$'000
Level 2
$'000
Level 3
$'000
2016
Land held for sale 2,324 - - 2,324
2015
Land held for sale 4,169 - - 4,169
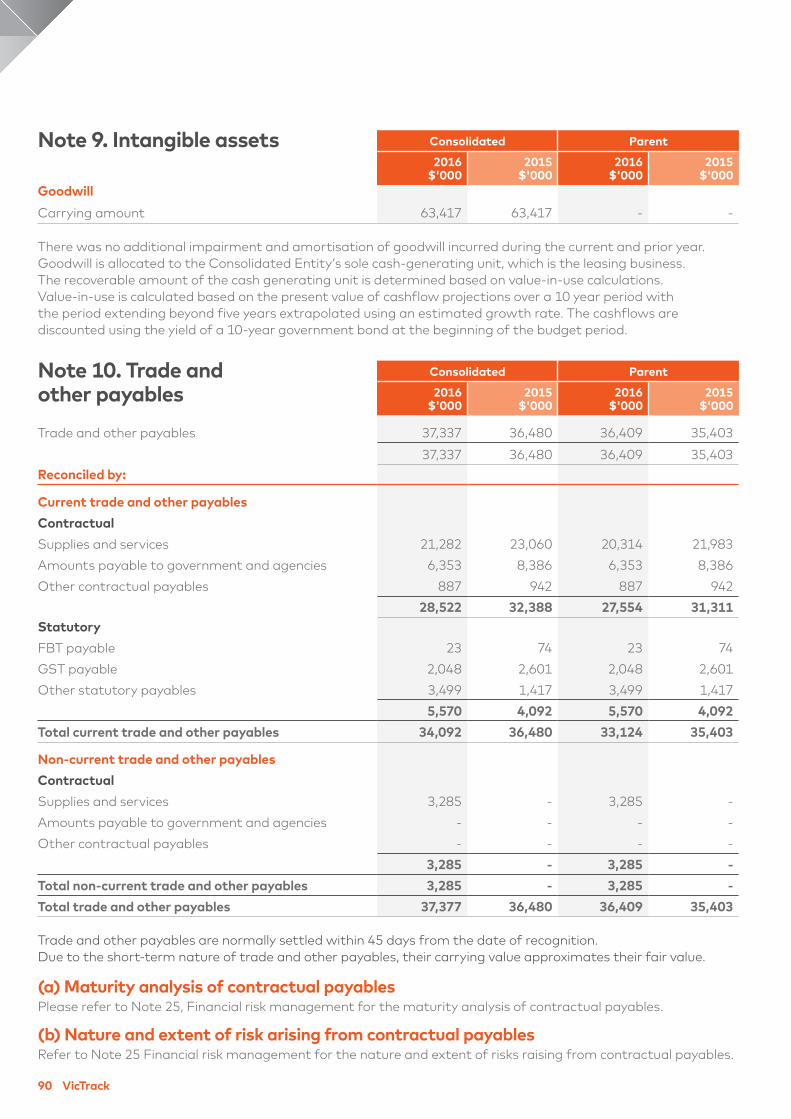
90 VicTrack
Note 9. Intangible assets Consolidated Parent
2016
$'000
2015
$'000
2016
$'000
2015
$'000
Goodwill
Carrying amount 63,417 63,417 - -
There was no additional impairment and amortisation of goodwill incurred during the current and prior year.
Goodwill is allocated to the Consolidated Entity’s sole cash-generating unit, which is the leasing business.
The recoverable amount of the cash generating unit is determined based on value-in-use calculations.
Value-in-use is calculated based on the present value of cashflow projections over a 10 year period with
the period extending beyond five years extrapolated using an estimated growth rate. The cashflows are
discounted using the yield of a 10-year government bond at the beginning of the budget period.
Note 10. Trade and
other payables
Consolidated Parent
2016
$'000
2015
$'000
2016
$'000
2015
$'000
Trade and other payables 37,337 36,480 36,409 35,403
37,337 36,480 36,409 35,403
Reconciled by:
Current trade and other payables
Contractual
Supplies and services 21,282 23,060 20,314 21,983
Amounts payable to government and agencies 6,353 8,386 6,353 8,386
Other contractual payables 887 942 887 942
28,522 32,388 27,554 31,311
Statutory
FBT payable 23 74 23 74
GST payable 2,048 2,601 2,048 2,601
Other statutory payables 3,499 1,417 3,499 1,417
5,570 4,092 5,570 4,092
Total current trade and other payables 34,092 36,480 33,124 35,403
Non-current trade and other payables
Contractual
Supplies and services 3,285 - 3,285 -
Amounts payable to government and agencies - - - -
Other contractual payables - - - -
3,285 - 3,285 -
Total non-current trade and other payables 3,285 - 3,285 -
Total trade and other payables 37,377 36,480 36,409 35,403
Trade and other payables are normally settled within 45 days from the date of recognition.
Due to the short-term nature of trade and other payables, their carrying value approximates their fair value.
(a) Maturity analysis of contractual payables
Please refer to Note 25, Financial risk management for the maturity analysis of contractual payables.
(b) Nature and extent of risk arising from contractual payables
Refer to Note 25 Financial risk management for the nature and extent of risks raising from contractual payables.
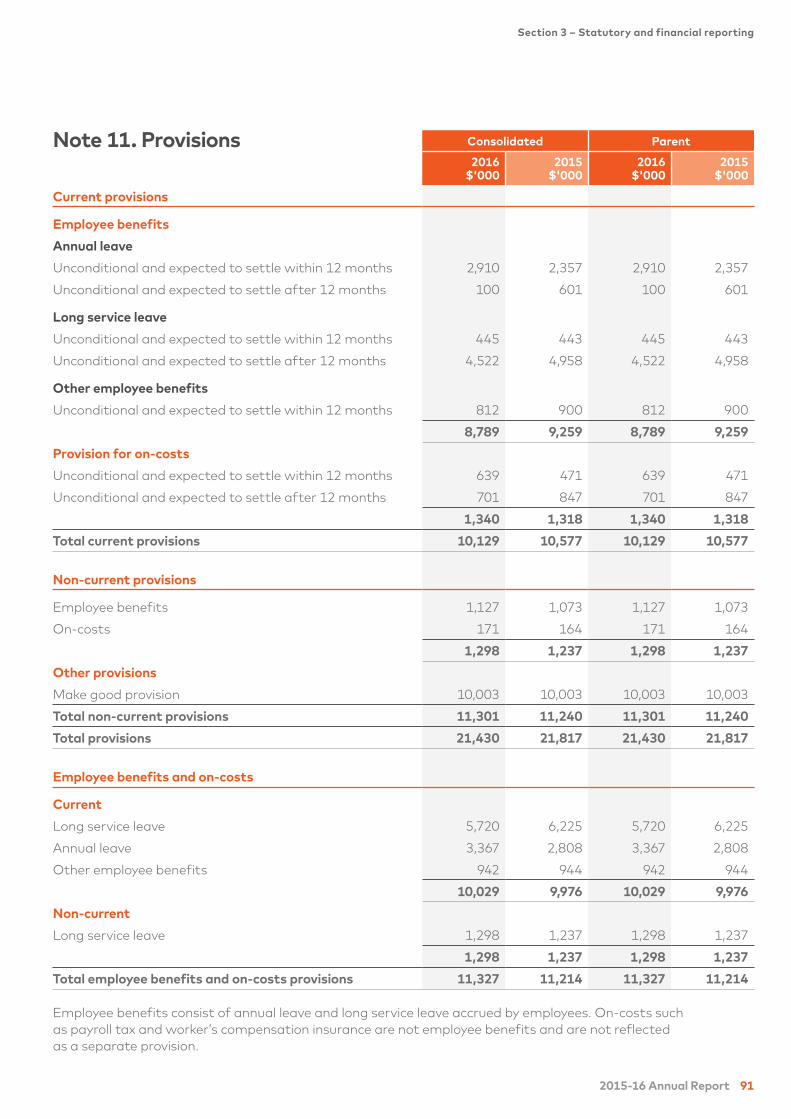
2015-16 Annual Report 91
Section 3 – Statutory and financial reporting
Note 11. Provisions Consolidated Parent
2016
$'000
2015
$'000
2016
$'000
2015
$'000
Current provisions
Employee benefits
Annual leave
Unconditional and expected to settle within 12 months 2,910 2,357 2,910 2,357
Unconditional and expected to settle after 12 months 100 601 100 601
Long service leave
Unconditional and expected to settle within 12 months 445 443 445 443
Unconditional and expected to settle after 12 months 4,522 4,958 4,522 4,958
Other employee benefits
Unconditional and expected to settle within 12 months 812 900 812 900
8,789 9,259 8,789 9,259
Provision for on-costs
Unconditional and expected to settle within 12 months 639 471 639 471
Unconditional and expected to settle after 12 months 701 847 701 847
1,340 1,318 1,340 1,318
Total current provisions 10,129 10,577 10,129 10,577
Non-current provisions
Employee benefits 1,127 1,073 1,127 1,073
On-costs 171 164 171 164
1,298 1,237 1,298 1,237
Other provisions
Make good provision 10,003 10,003 10,003 10,003
Total non-current provisions 11,301 11,240 11,301 11,240
Total provisions 21,430 21,817 21,430 21,817
Employee benefits and on-costs
Current
Long service leave 5,720 6,225 5,720 6,225
Annual leave 3,367 2,808 3,367 2,808
Other employee benefits 942 944 942 944
10,029 9,976 10,029 9,976
Non-current
Long service leave 1,298 1,237 1,298 1,237
1,298 1,237 1,298 1,237
Total employee benefits and on-costs provisions 11,327 11,214 11,327 11,214
Employee benefits consist of annual leave and long service leave accrued by employees. On-costs such
as payroll tax and worker’s compensation insurance are not employee benefits and are not reflected
as a separate provision.
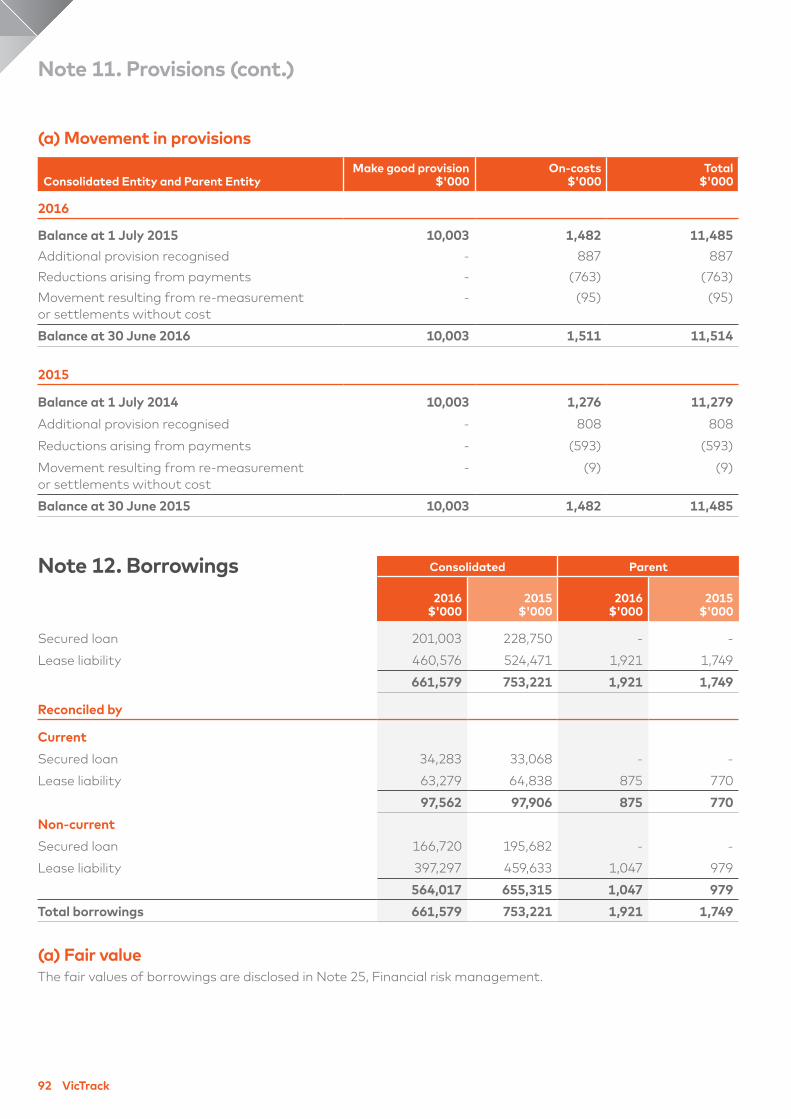
92 VicTrack
(a) Movement in provisions
Consolidated Entity and Parent Entity
Make good provision
$'000
On-costs
$'000
Total
$'000
2016
Balance at 1 July 2015 10,003 1,482 11,485
Additional provision recognised - 887 887
Reductions arising from payments - (763) (763)
Movement resulting from re-measurement
or settlements without cost
- (95) (95)
Balance at 30 June 2016 10,003 1,511 11,514
2015
Balance at 1 July 2014 10,003 1,276 11,279
Additional provision recognised - 808 808
Reductions arising from payments - (593) (593)
Movement resulting from re-measurement
or settlements without cost
- (9) (9)
Balance at 30 June 2015 10,003 1,482 11,485
Note 12. Borrowings Consolidated Parent
2016
$'000
2015
$'000
2016
$'000
2015
$'000
Secured loan 201,003 228,750 - -
Lease liability 460,576 524,471 1,921 1,749
661,579 753,221 1,921 1,749
Reconciled by
Current
Secured loan 34,283 33,068 - -
Lease liability 63,279 64,838 875 770
97,562 97,906 875 770
Non-current
Secured loan 166,720 195,682 - -
Lease liability 397,297 459,633 1,047 979
564,017 655,315 1,047 979
Total borrowings 661,579 753,221 1,921 1,749
(a) Fair value
The fair values of borrowings are disclosed in Note 25, Financial risk management.
Note 11. Provisions (cont.)
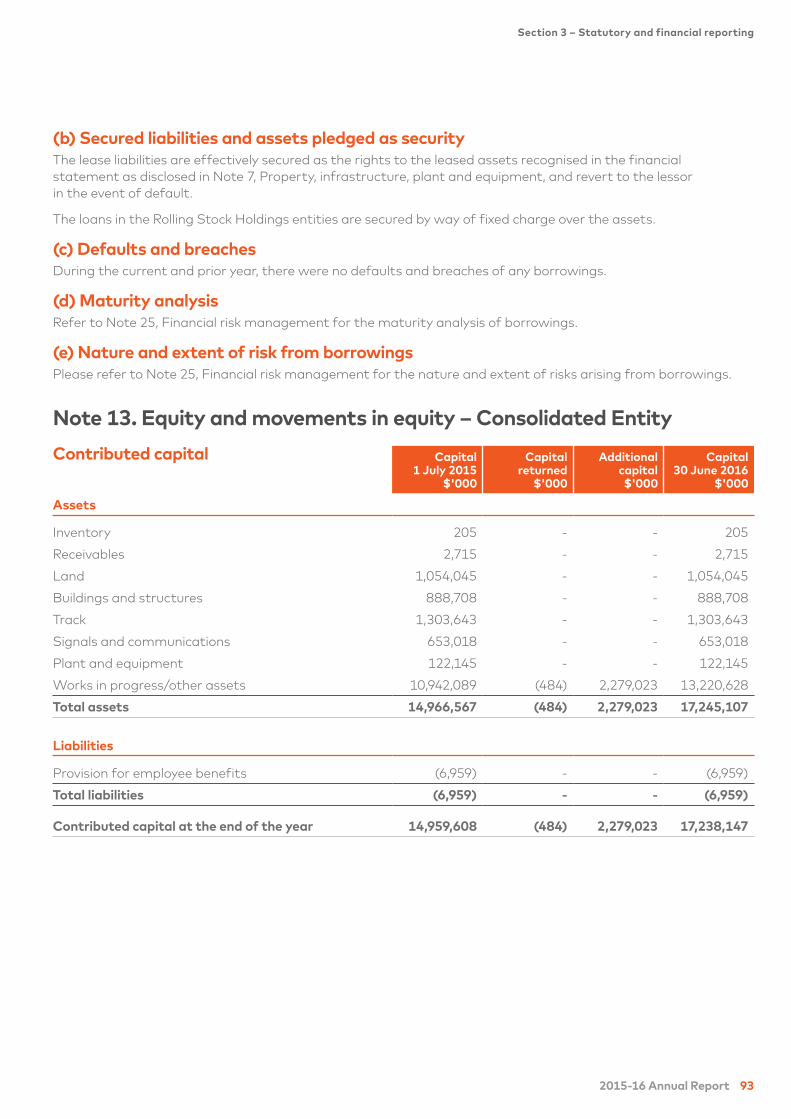
2015-16 Annual Report 93
Section 3 – Statutory and financial reporting
(b) Secured liabilities and assets pledged as security
The lease liabilities are effectively secured as the rights to the leased assets recognised in the financial
statement as disclosed in Note 7, Property, infrastructure, plant and equipment, and revert to the lessor
in the event of default.
The loans in the Rolling Stock Holdings entities are secured by way of fixed charge over the assets.
(c) Defaults and breaches
During the current and prior year, there were no defaults and breaches of any borrowings.
(d) Maturity analysis
Refer to Note 25, Financial risk management for the maturity analysis of borrowings.
(e) Nature and extent of risk from borrowings
Please refer to Note 25, Financial risk management for the nature and extent of risks arising from borrowings.
Note 13. Equity and movements in equity – Consolidated Entity
Contributed capital Capital
1 July 2015
$'000
Capital
returned
$'000
Additional
capital
$'000
Capital
30 June 2016
$'000
Assets
Inventory 205 - - 205
Receivables 2,715 - - 2,715
Land 1,054,045 - - 1,054,045
Buildings and structures 888,708 - - 888,708
Track 1,303,643 - - 1,303,643
Signals and communications 653,018 - - 653,018
Plant and equipment 122,145 - - 122,145
Works in progress/other assets 10,942,089 (484) 2,279,023 13,220,628
Total assets 14,966,567 (484) 2,279,023 17,245,107
Liabilities
Provision for employee benefits (6,959) - - (6,959)
Total liabilities (6,959) - - (6,959)
Contributed capital at the end of the year 14,959,608 (484) 2,279,023 17,238,147
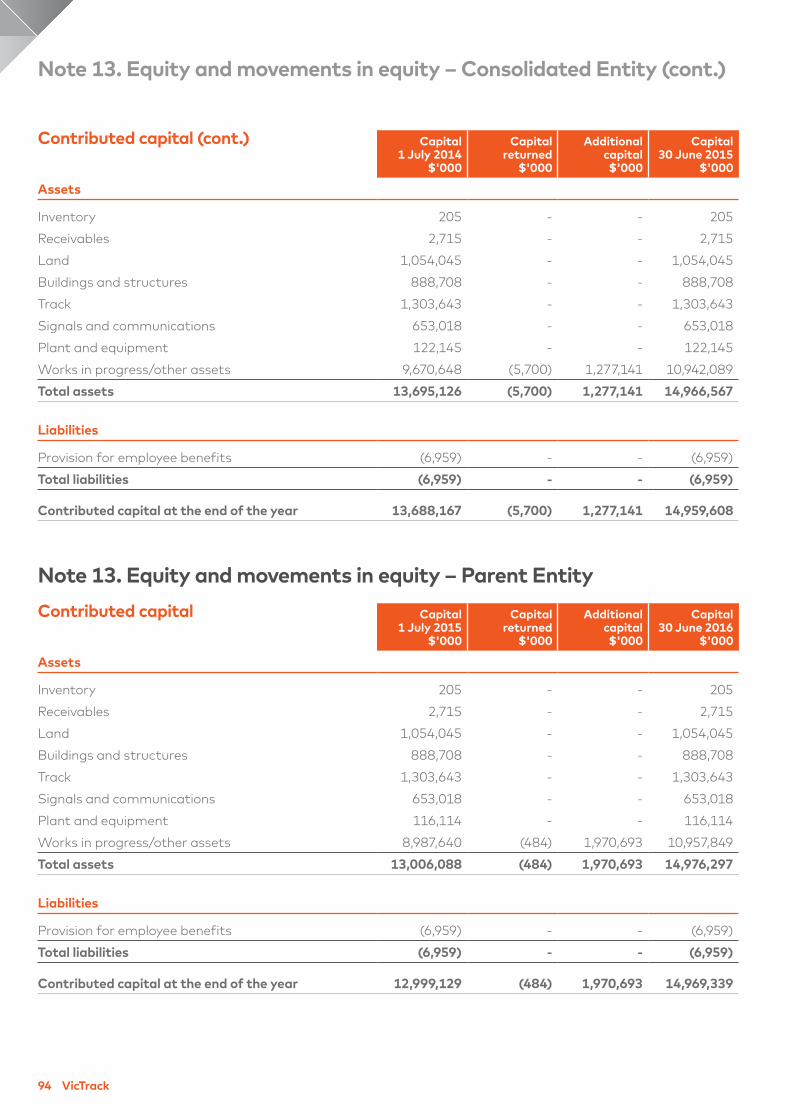
94 VicTrack
Note 13. Equity and movements in equity – Parent Entity
Contributed capital Capital
1 July 2015
$'000
Capital
returned
$'000
Additional
capital
$'000
Capital
30 June 2016
$'000
Assets
Inventory 205 - - 205
Receivables 2,715 - - 2,715
Land 1,054,045 - - 1,054,045
Buildings and structures 888,708 - - 888,708
Track 1,303,643 - - 1,303,643
Signals and communications 653,018 - - 653,018
Plant and equipment 116,114 - - 116,114
Works in progress/other assets 8,987,640 (484) 1,970,693 10,957,849
Total assets 13,006,088 (484) 1,970,693 14,976,297
Liabilities
Provision for employee benefits (6,959) - - (6,959)
Total liabilities (6,959) - - (6,959)
Contributed capital at the end of the year 12,999,129 (484) 1,970,693 14,969,339
Contributed capital (cont.) Capital
1 July 2014
$'000
Capital
returned
$'000
Additional
capital
$'000
Capital
30 June 2015
$'000
Assets
Inventory 205 - - 205
Receivables 2,715 - - 2,715
Land 1,054,045 - - 1,054,045
Buildings and structures 888,708 - - 888,708
Track 1,303,643 - - 1,303,643
Signals and communications 653,018 - - 653,018
Plant and equipment 122,145 - - 122,145
Works in progress/other assets 9,670,648 (5,700) 1,277,141 10,942,089
Total assets 13,695,126 (5,700) 1,277,141 14,966,567
Liabilities
Provision for employee benefits (6,959) - - (6,959)
Total liabilities (6,959) - - (6,959)
Contributed capital at the end of the year 13,688,167 (5,700) 1,277,141 14,959,608
Note 13. Equity and movements in equity – Consolidated Entity (cont.)
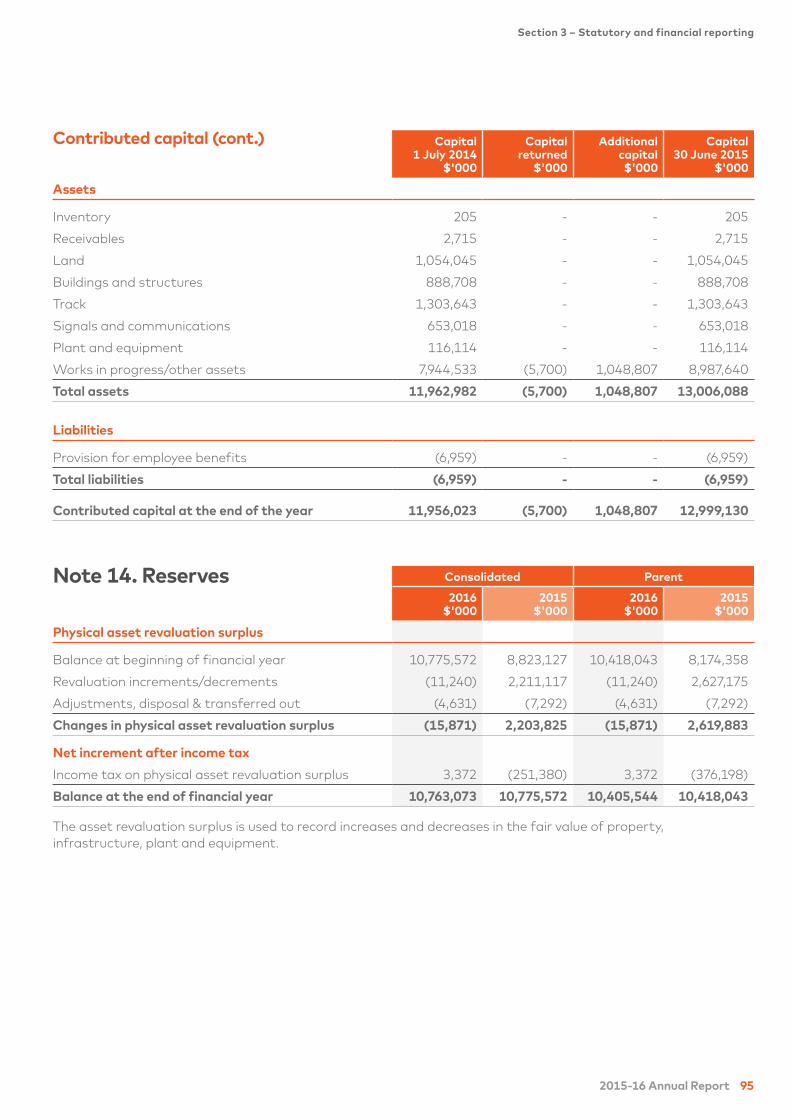
2015-16 Annual Report 95
Section 3 – Statutory and financial reporting
Contributed capital (cont.) Capital
1 July 2014
$'000
Capital
returned
$'000
Additional
capital
$'000
Capital
30 June 2015
$'000
Assets
Inventory 205 - - 205
Receivables 2,715 - - 2,715
Land 1,054,045 - - 1,054,045
Buildings and structures 888,708 - - 888,708
Track 1,303,643 - - 1,303,643
Signals and communications 653,018 - - 653,018
Plant and equipment 116,114 - - 116,114
Works in progress/other assets 7,944,533 (5,700) 1,048,807 8,987,640
Total assets 11,962,982 (5,700) 1,048,807 13,006,088
Liabilities
Provision for employee benefits (6,959) - - (6,959)
Total liabilities (6,959) - - (6,959)
Contributed capital at the end of the year 11,956,023 (5,700) 1,048,807 12,999,130
Note 14. Reserves Consolidated Parent
2016
$'000
2015
$'000
2016
$'000
2015
$'000
Physical asset revaluation surplus
Balance at beginning of financial year 10,775,572 8,823,127 10,418,043 8,174,358
Revaluation increments/decrements (11,240) 2,211,117 (11,240) 2,627,175
Adjustments, disposal & transferred out (4,631) (7,292) (4,631) (7,292)
Changes in physical asset revaluation surplus (15,871) 2,203,825 (15,871) 2,619,883
Net increment after income tax
Income tax on physical asset revaluation surplus 3,372 (251,380) 3,372 (376,198)
Balance at the end of financial year 10,763,073 10,775,572 10,405,544 10,418,043
The asset revaluation surplus is used to record increases and decreases in the fair value of property,
infrastructure, plant and equipment.
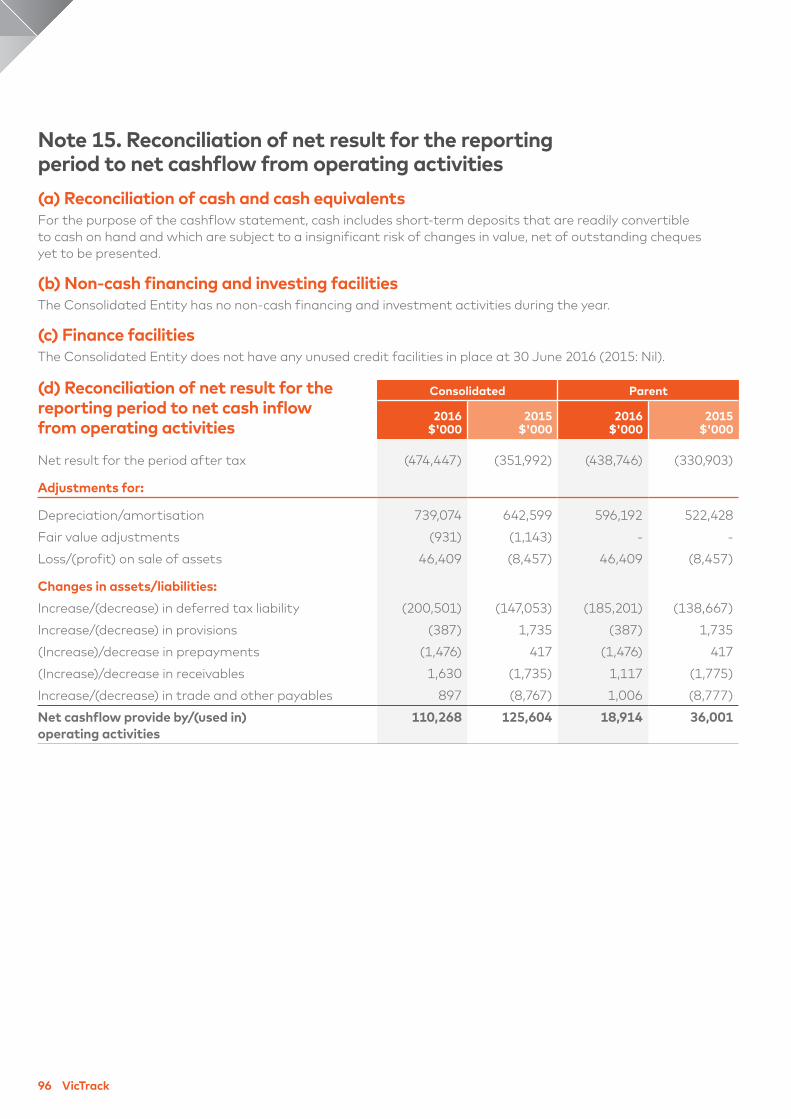
96 VicTrack
Note 15. Reconciliation of net result for the reporting
period to net cashflow from operating activities
(a) Reconciliation of cash and cash equivalents
For the purpose of the cashflow statement, cash includes short-term deposits that are readily convertible
to cash on hand and which are subject to a insignificant risk of changes in value, net of outstanding cheques
yet to be presented.
(b) Non-cash financing and investing facilities
The Consolidated Entity has no non-cash financing and investment activities during the year.
(c) Finance facilities
The Consolidated Entity does not have any unused credit facilities in place at 30 June 2016 (2015: Nil).
(d) Reconciliation of net result for the
reporting period to net cash inflow
from operating activities
Consolidated Parent
2016
$'000
2015
$'000
2016
$'000
2015
$'000
Net result for the period after tax (474,447) (351,992) (438,746) (330,903)
Adjustments for:
Depreciation/amortisation 739,074 642,599 596,192 522,428
Fair value adjustments (931) (1,143) - -
Loss/(profit) on sale of assets 46,409 (8,457) 46,409 (8,457)
Changes in assets/liabilities:
Increase/(decrease) in deferred tax liability (200,501) (147,053) (185,201) (138,667)
Increase/(decrease) in provisions (387) 1,735 (387) 1,735
(Increase)/decrease in prepayments (1,476) 417 (1,476) 417
(Increase)/decrease in receivables 1,630 (1,735) 1,117 (1,775)
Increase/(decrease) in trade and other payables 897 (8,767) 1,006 (8,777)
Net cashflow provide by/(used in)
operating activities
110,268 125,604 18,914 36,001
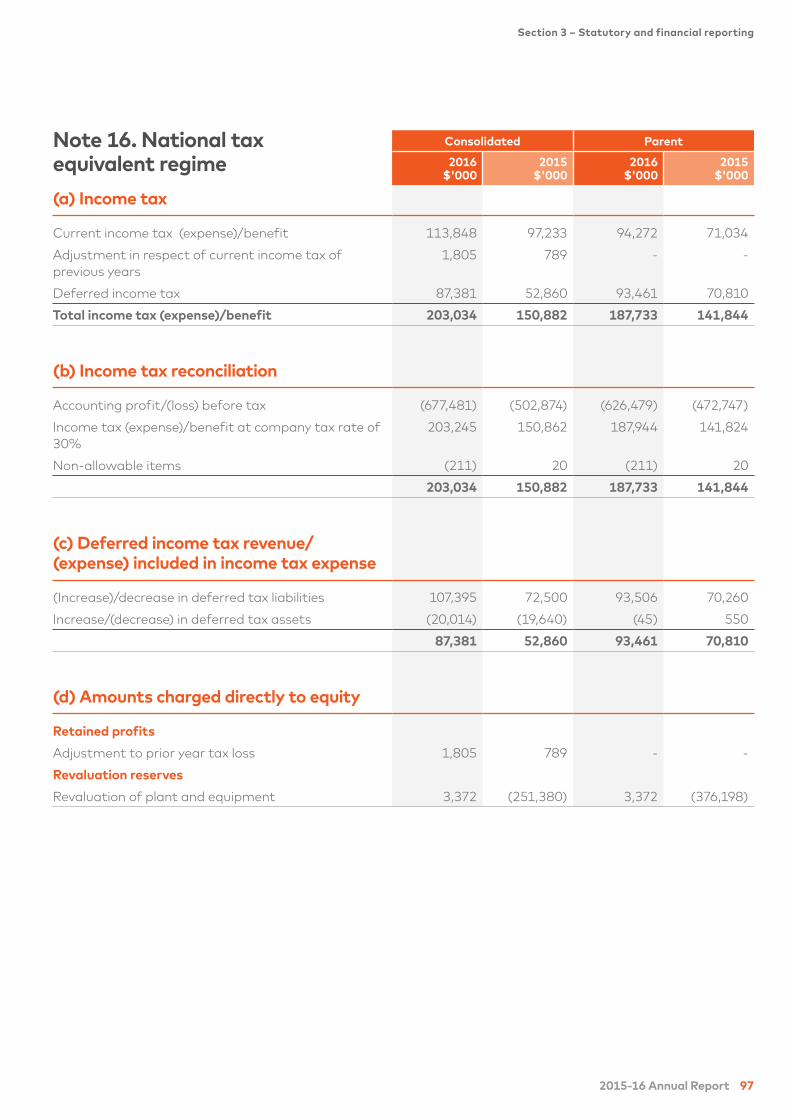
2015-16 Annual Report 97
Section 3 – Statutory and financial reporting
Note 16. National tax
equivalent regime
Consolidated Parent
2016
$'000
2015
$'000
2016
$'000
2015
$'000
(a) Income tax
Current income tax (expense)/benefit 113,848 97,233 94,272 71,034
Adjustment in respect of current income tax of
previous years
1,805 789 - -
Deferred income tax 87,381 52,860 93,461 70,810
Total income tax (expense)/benefit 203,034 150,882 187,733 141,844
(b) Income tax reconciliation
Accounting profit/(loss) before tax (677,481) (502,874) (626,479) (472,747)
Income tax (expense)/benefit at company tax rate of
30%
203,245 150,862 187,944 141,824
Non-allowable items (211) 20 (211) 20
203,034 150,882 187,733 141,844
(c) Deferred income tax revenue/
(expense) included in income tax expense
(Increase)/decrease in deferred tax liabilities 107,395 72,500 93,506 70,260
Increase/(decrease) in deferred tax assets (20,014) (19,640) (45) 550
87,381 52,860 93,461 70,810
(d) Amounts charged directly to equity
Retained profits
Adjustment to prior year tax loss 1,805 789 - -
Revaluation reserves
Revaluation of plant and equipment 3,372 (251,380) 3,372 (376,198)
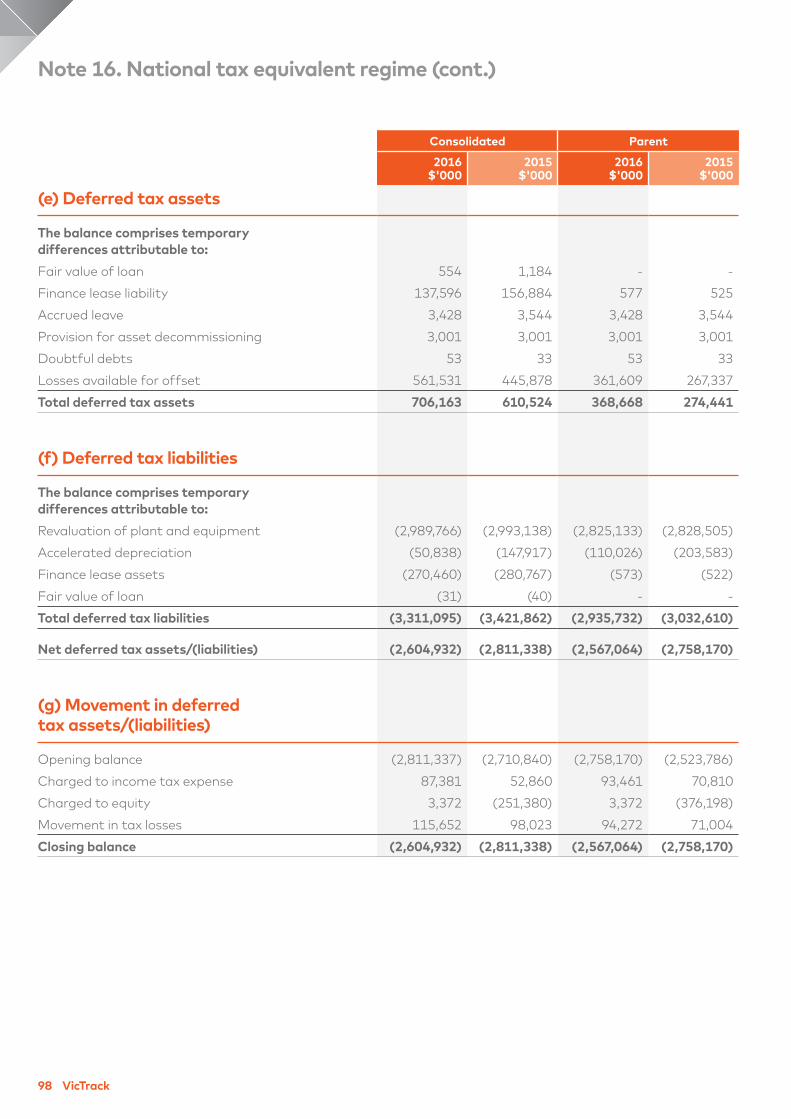
98 VicTrack
Consolidated Parent
2016
$'000
2015
$'000
2016
$'000
2015
$'000
(e) Deferred tax assets
The balance comprises temporary
differences attributable to:
Fair value of loan 554 1,184 - -
Finance lease liability 137,596 156,884 577 525
Accrued leave 3,428 3,544 3,428 3,544
Provision for asset decommissioning 3,001 3,001 3,001 3,001
Doubtful debts 53 33 53 33
Losses available for offset 561,531 445,878 361,609 267,337
Total deferred tax assets 706,163 610,524 368,668 274,441
(f) Deferred tax liabilities
The balance comprises temporary
differences attributable to:
Revaluation of plant and equipment (2,989,766) (2,993,138) (2,825,133) (2,828,505)
Accelerated depreciation (50,838) (147,917) (110,026) (203,583)
Finance lease assets (270,460) (280,767) (573) (522)
Fair value of loan (31) (40) - -
Total deferred tax liabilities (3,311,095) (3,421,862) (2,935,732) (3,032,610)
Net deferred tax assets/(liabilities) (2,604,932) (2,811,338) (2,567,064) (2,758,170)
(g) Movement in deferred
tax assets/(liabilities)
Opening balance (2,811,337) (2,710,840) (2,758,170) (2,523,786)
Charged to income tax expense 87,381 52,860 93,461 70,810
Charged to equity 3,372 (251,380) 3,372 (376,198)
Movement in tax losses 115,652 98,023 94,272 71,004
Closing balance (2,604,932) (2,811,338) (2,567,064) (2,758,170)
Note 16. National tax equivalent regime (cont.)
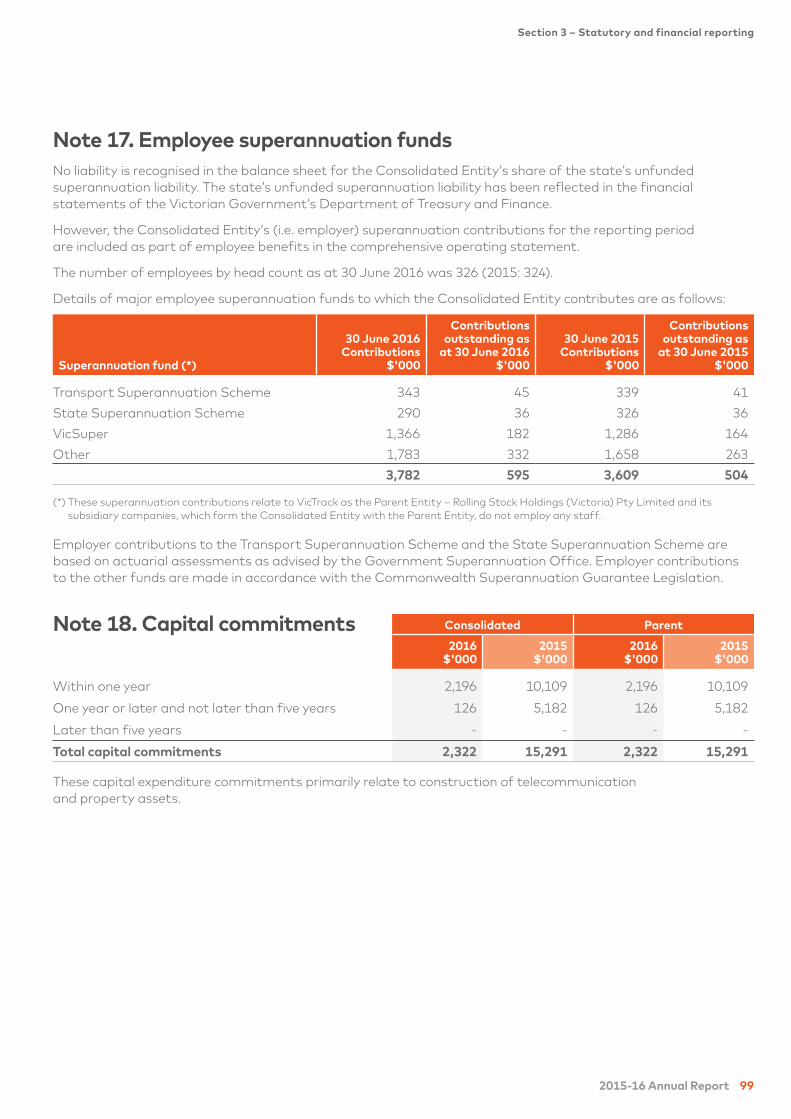
2015-16 Annual Report 99
Section 3 – Statutory and financial reporting
Note 17. Employee superannuation funds
No liability is recognised in the balance sheet for the Consolidated Entity’s share of the state’s unfunded
superannuation liability. The state’s unfunded superannuation liability has been reflected in the financial
statements of the Victorian Government’s Department of Treasury and Finance.
However, the Consolidated Entity’s (i.e. employer) superannuation contributions for the reporting period
are included as part of employee benefits in the comprehensive operating statement.
The number of employees by head count as at 30 June 2016 was 326 (2015: 324).
Details of major employee superannuation funds to which the Consolidated Entity contributes are as follows:
Superannuation fund (*)
30 June 2016
Contributions
$'000
Contributions
outstanding as
at 30 June 2016
$'000
30 June 2015
Contributions
$'000
Contributions
outstanding as
at 30 June 2015
$'000
Transport Superannuation Scheme 343 45 339 41
State Superannuation Scheme 290 36 326 36
VicSuper 1,366 182 1,286 164
Other 1,783 332 1,658 263
3,782 595 3,609 504
(*) These superannuation contributions relate to VicTrack as the Parent Entity – Rolling Stock Holdings (Victoria) Pty Limited and its
subsidiary companies, which form the Consolidated Entity with the Parent Entity, do not employ any staff.
Employer contributions to the Transport Superannuation Scheme and the State Superannuation Scheme are
based on actuarial assessments as advised by the Government Superannuation Office. Employer contributions
to the other funds are made in accordance with the Commonwealth Superannuation Guarantee Legislation.
Note 18. Capital commitments Consolidated Parent
2016
$'000
2015
$'000
2016
$'000
2015
$'000
Within one year 2,196 10,109 2,196 10,109
One year or later and not later than five years 126 5,182 126 5,182
Later than five years - - - -
Total capital commitments 2,322 15,291 2,322 15,291
These capital expenditure commitments primarily relate to construction of telecommunication
and property assets.
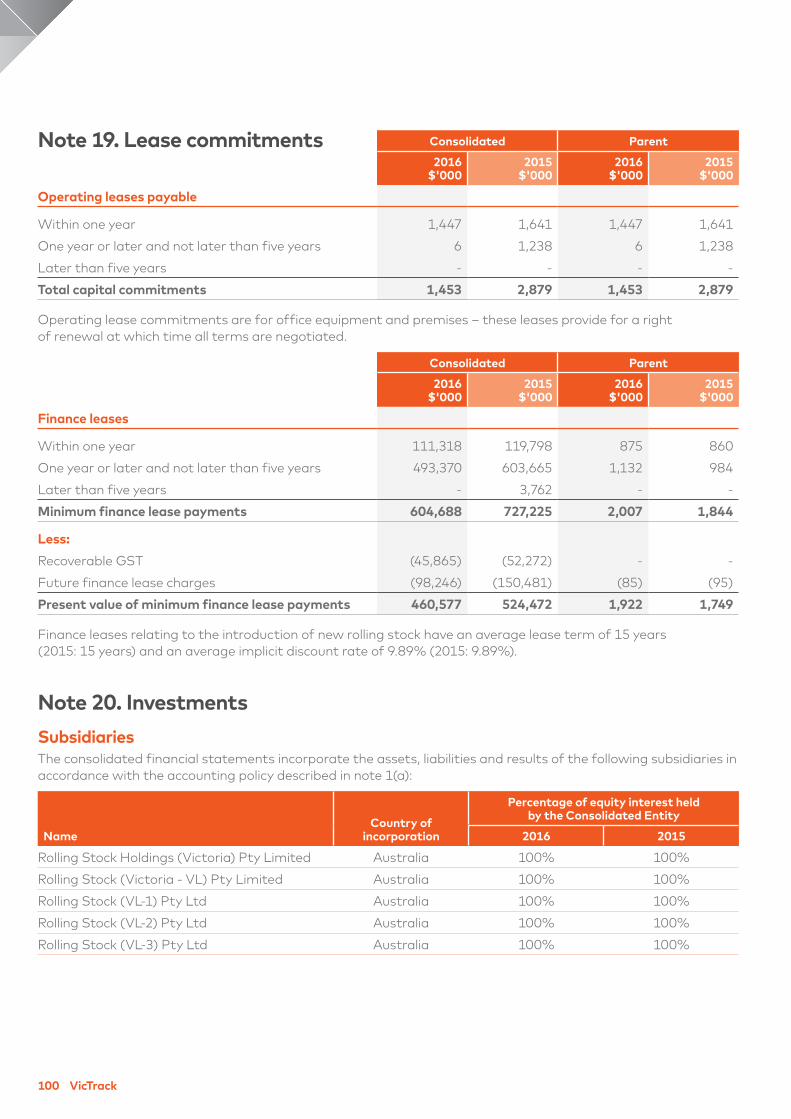
100 VicTrack
Note 19. Lease commitments Consolidated Parent
2016
$'000
2015
$'000
2016
$'000
2015
$'000
Operating leases payable
Within one year 1,447 1,641 1,447 1,641
One year or later and not later than five years 6 1,238 6 1,238
Later than five years - - - -
Total capital commitments 1,453 2,879 1,453 2,879
Operating lease commitments are for office equipment and premises – these leases provide for a right
of renewal at which time all terms are negotiated.
Consolidated Parent
2016
$'000
2015
$'000
2016
$'000
2015
$'000
Finance leases
Within one year 111,318 119,798 875 860
One year or later and not later than five years 493,370 603,665 1,132 984
Later than five years - 3,762 - -
Minimum finance lease payments 604,688 727,225 2,007 1,844
Less:
Recoverable GST (45,865) (52,272) - -
Future finance lease charges (98,246) (150,481) (85) (95)
Present value of minimum finance lease payments 460,577 524,472 1,922 1,749
Finance leases relating to the introduction of new rolling stock have an average lease term of 15 years
(2015: 15 years) and an average implicit discount rate of 9.89% (2015: 9.89%).
Note 20. Investments
Subsidiaries
The consolidated financial statements incorporate the assets, liabilities and results of the following subsidiaries in
accordance with the accounting policy described in note 1(a):
Country of
incorporation
Percentage of equity interest held
by the Consolidated Entity
Name 2016 2015
Rolling Stock Holdings (Victoria) Pty Limited Australia 100% 100%
Rolling Stock (Victoria - VL) Pty Limited Australia 100% 100%
Rolling Stock (VL-1) Pty Ltd Australia 100% 100%
Rolling Stock (VL-2) Pty Ltd Australia 100% 100%
Rolling Stock (VL-3) Pty Ltd Australia 100% 100%
2015-16 Annual Report 101
Section 3 – Statutory and financial reporting
Note 21. Contingent liabilities
Environmental and property
contingent liabilities
Upon the Consolidated Entity’s establishment, and
in subsequent asset allocations, the former Public
Transport Corporation did not grant indemnities
in relation to any consequences of environmental
contamination of land and property or compliance
with building code regulations that may have been
transferred along with the ownership of the land
and property.
An action plan has been prepared to address
environmental contamination at a number of high
priority sites. The Consolidated Entity does not have a
present obligation (legal or constructive) as a result of
a past event and is unable to reliably estimate future
expenditure levels that are expected to be required to
address environmental issues, including remediation
activities. Due to the absence of a present obligation
and the uncertainty regarding the actual quantum
of expenditure, no provision for these costs has been
included in the financial statements.
Indemnities
Infrastructure leases with the
Director of Public Transport
The Consolidated Entity has entered into a number
of leases with the Director of Public Transport
under which its assets are made available to various
transport operators and track access providers. These
leases were allocated to PTV when it commenced
operations on 2 April 2012. Under these leases the
Consolidated Entity provides various indemnities to
PTV, for example in relation to the exercise of certain
powers under the respective leases. In turn, PTV
provides an indemnity to the Consolidated Entity
against any losses that may result from the use of the
land and infrastructure by its sub-lessees (transport
operators and track access providers).
Subject to the note below relating to current
litigation and other indemnities, the Directors of the
Consolidated Entity are unaware of any circumstances
that would lead them to believe that these contingent
liabilities will result in any material actual liability, and
consequently no provisions are included in the financial
statements in respect of these matters.
The Consolidated Entity is currently involved in a
number of court proceedings and/or formal litigation.
The majority of these relate to third party public liability
claims for personal injury arising from use of or access
to VicTrack owned station and rail infrastructure.
At this stage, it is too early to predict the outcome of
these actions and whether any significant liabilities
will be incurred by the Consolidated Entity as a result.
Victrack’s exposure to a majority of these claims are
limited by the excess stated in Victrack’s relevant
insurance policy that is held with the Victorian
Managed Insurance Authority. At the time of print,
the maximum, aggregated, financial effect, if VicTrack
is liable in all the above cases, is likely to be no more
than $640,000.
There are other commitments made by the
Consolidated Entity which are not quantifiable at this
time, arising from indemnities provided in relation to
transactions including leases, consultancy services,
service agreements, as well as for Directors of the
Consolidated Entity.
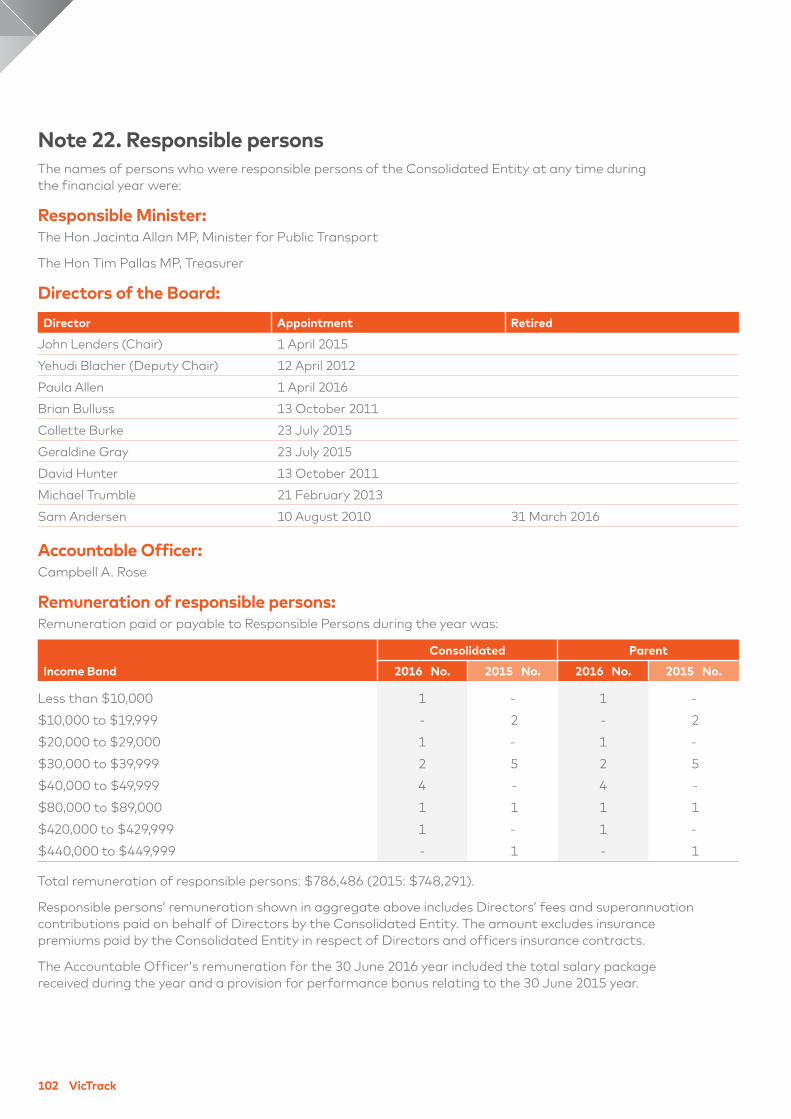
102 VicTrack
Note 22. Responsible persons
The names of persons who were responsible persons of the Consolidated Entity at any time during
the financial year were:
Responsible Minister:
The Hon Jacinta Allan MP, Minister for Public Transport
The Hon Tim Pallas MP, Treasurer
Directors of the Board:
Director Appointment Retired
John Lenders (Chair) 1 April 2015
Yehudi Blacher (Deputy Chair) 12 April 2012
Paula Allen 1 April 2016
Brian Bulluss 13 October 2011
Collette Burke 23 July 2015
Geraldine Gray 23 July 2015
David Hunter 13 October 2011
Michael Trumble 21 February 2013
Sam Andersen 10 August 2010 31 March 2016
Accountable Officer:
Campbell A. Rose
Remuneration of responsible persons:
Remuneration paid or payable to Responsible Persons during the year was:
Income Band
Consolidated Parent
2016 No. 2015 No. 2016 No. 2015 No.
Less than $10,000 1 - 1 -
$10,000 to $19,999 - 2 - 2
$20,000 to $29,000 1 - 1 -
$30,000 to $39,999 2 5 2 5
$40,000 to $49,999 4 - 4 -
$80,000 to $89,000 1 1 1 1
$420,000 to $429,999 1 - 1 -
$440,000 to $449,999 - 1 - 1
Total remuneration of responsible persons: $786,486 (2015: $748,291).
Responsible persons’ remuneration shown in aggregate above includes Directors’ fees and superannuation
contributions paid on behalf of Directors by the Consolidated Entity. The amount excludes insurance
premiums paid by the Consolidated Entity in respect of Directors and officers insurance contracts.
The Accountable Officer's remuneration for the 30 June 2016 year included the total salary package
received during the year and a provision for performance bonus relating to the 30 June 2015 year.
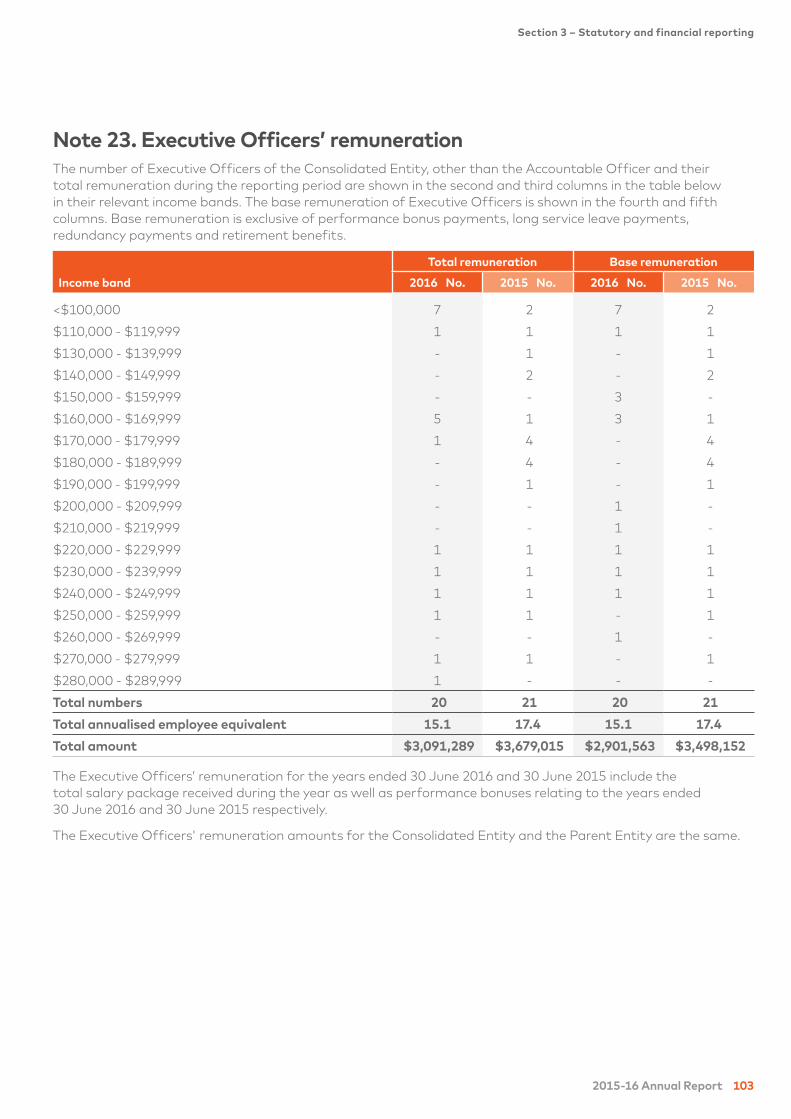
2015-16 Annual Report 103
Section 3 – Statutory and financial reporting
Note 23. Executive Officers’ remuneration
The number of Executive Officers of the Consolidated Entity, other than the Accountable Officer and their
total remuneration during the reporting period are shown in the second and third columns in the table below
in their relevant income bands. The base remuneration of Executive Officers is shown in the fourth and fifth
columns. Base remuneration is exclusive of performance bonus payments, long service leave payments,
redundancy payments and retirement benefits.
Income band
Total remuneration Base remuneration
2016 No. 2015 No. 2016 No. 2015 No.
<$100,000 7 2 7 2
$110,000 - $119,999 1 1 1 1
$130,000 - $139,999 - 1 - 1
$140,000 - $149,999 - 2 - 2
$150,000 - $159,999 - - 3 -
$160,000 - $169,999 5 1 3 1
$170,000 - $179,999 1 4 - 4
$180,000 - $189,999 - 4 - 4
$190,000 - $199,999 - 1 - 1
$200,000 - $209,999 - - 1 -
$210,000 - $219,999 - - 1 -
$220,000 - $229,999 1 1 1 1
$230,000 - $239,999 1 1 1 1
$240,000 - $249,999 1 1 1 1
$250,000 - $259,999 1 1 - 1
$260,000 - $269,999 - - 1 -
$270,000 - $279,999 1 1 - 1
$280,000 - $289,999 1 - - -
Total numbers 20 21 20 21
Total annualised employee equivalent 15.1 17.4 15.1 17.4
Total amount $3,091,289 $3,679,015 $2,901,563 $3,498,152
The Executive Officers’ remuneration for the years ended 30 June 2016 and 30 June 2015 include the
total salary package received during the year as well as performance bonuses relating to the years ended
30 June 2016 and 30 June 2015 respectively.
The Executive Officers' remuneration amounts for the Consolidated Entity and the Parent Entity are the same.
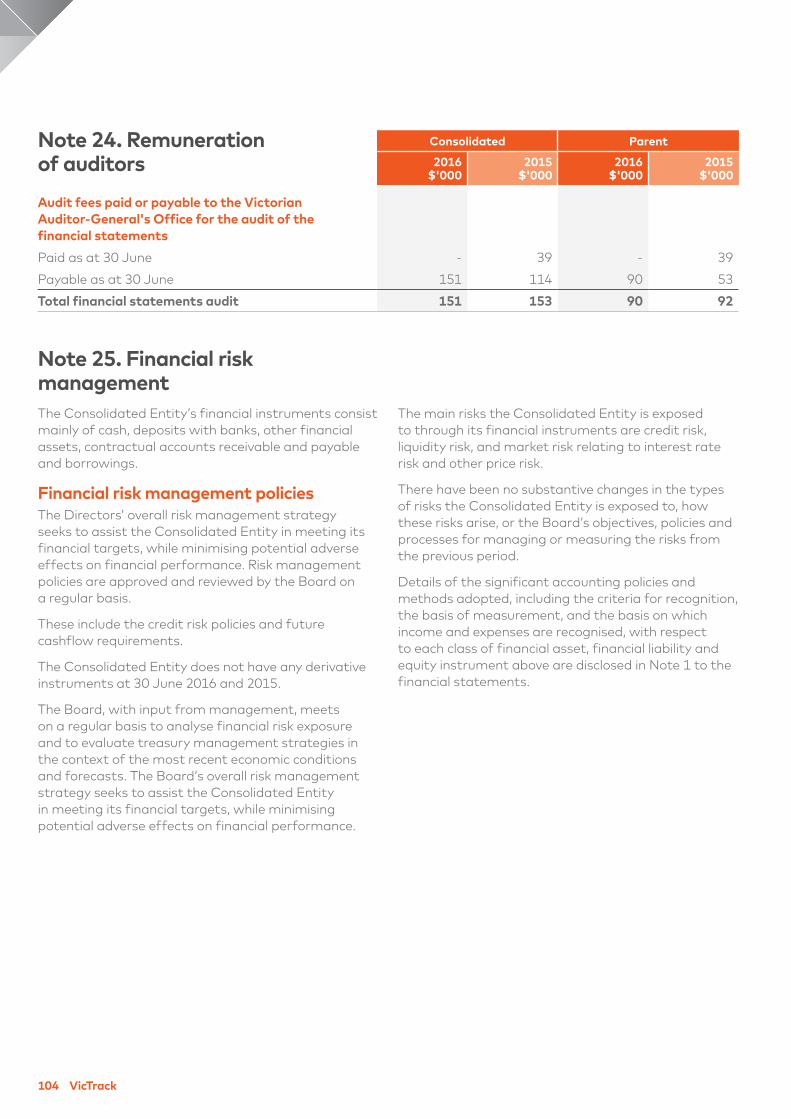
104 VicTrack
Note 24. Remuneration
of auditors
Consolidated Parent
2016
$'000
2015
$'000
2016
$'000
2015
$'000
Audit fees paid or payable to the Victorian
Auditor-General's Office for the audit of the
financial statements
Paid as at 30 June - 39 - 39
Payable as at 30 June 151 114 90 53
Total financial statements audit 151 153 90 92
Note 25. Financial risk
management
The Consolidated Entity’s financial instruments consist
mainly of cash, deposits with banks, other financial
assets, contractual accounts receivable and payable
and borrowings.
Financial risk management policies
The Directors’ overall risk management strategy
seeks to assist the Consolidated Entity in meeting its
financial targets, while minimising potential adverse
effects on financial performance. Risk management
policies are approved and reviewed by the Board on
a regular basis.
These include the credit risk policies and future
cashflow requirements.
The Consolidated Entity does not have any derivative
instruments at 30 June 2016 and 2015.
The Board, with input from management, meets
on a regular basis to analyse financial risk exposure
and to evaluate treasury management strategies in
the context of the most recent economic conditions
and forecasts. The Board’s overall risk management
strategy seeks to assist the Consolidated Entity
in meeting its financial targets, while minimising
potential adverse effects on financial performance.
The main risks the Consolidated Entity is exposed
to through its financial instruments are credit risk,
liquidity risk, and market risk relating to interest rate
risk and other price risk.
There have been no substantive changes in the types
of risks the Consolidated Entity is exposed to, how
these risks arise, or the Board’s objectives, policies and
processes for managing or measuring the risks from
the previous period.
Details of the significant accounting policies and
methods adopted, including the criteria for recognition,
the basis of measurement, and the basis on which
income and expenses are recognised, with respect
to each class of financial asset, financial liability and
equity instrument above are disclosed in Note 1 to the
financial statements.
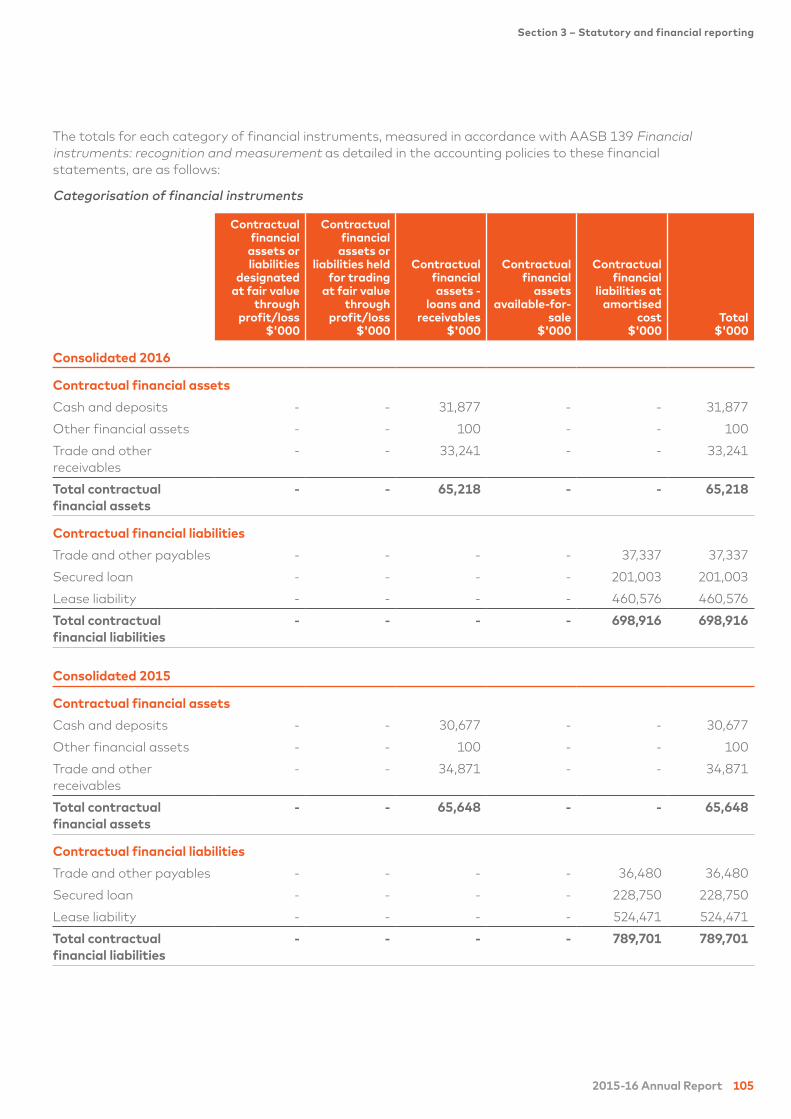
2015-16 Annual Report 105
Section 3 – Statutory and financial reporting
The totals for each category of financial instruments, measured in accordance with AASB 139 Financial
instruments: recognition and measurement as detailed in the accounting policies to these financial
statements, are as follows:
Categorisation of financial instruments
Contractual
financial
assets or
liabilities
designated
at fair value
through
profit/loss
$'000
Contractual
financial
assets or
liabilities held
for trading
at fair value
through
profit/loss
$'000
Contractual
financial
assets -
loans and
receivables
$'000
Contractual
financial
assets
available-for-
sale
$'000
Contractual
financial
liabilities at
amortised
cost
$'000
Total
$'000
Consolidated 2016
Contractual financial assets
Cash and deposits - - 31,877 - - 31,877
Other financial assets - - 100 - - 100
Trade and other
receivables
- - 33,241 - - 33,241
Total contractual
financial assets
- - 65,218 - - 65,218
Contractual financial liabilities
Trade and other payables - - - - 37,337 37,337
Secured loan - - - - 201,003 201,003
Lease liability - - - - 460,576 460,576
Total contractual
financial liabilities
- - - - 698,916 698,916
Consolidated 2015
Contractual financial assets
Cash and deposits - - 30,677 - - 30,677
Other financial assets - - 100 - - 100
Trade and other
receivables
- - 34,871 - - 34,871
Total contractual
financial assets
- - 65,648 - - 65,648
Contractual financial liabilities
Trade and other payables - - - - 36,480 36,480
Secured loan - - - - 228,750 228,750
Lease liability - - - - 524,471 524,471
Total contractual
financial liabilities
- - - - 789,701 789,701
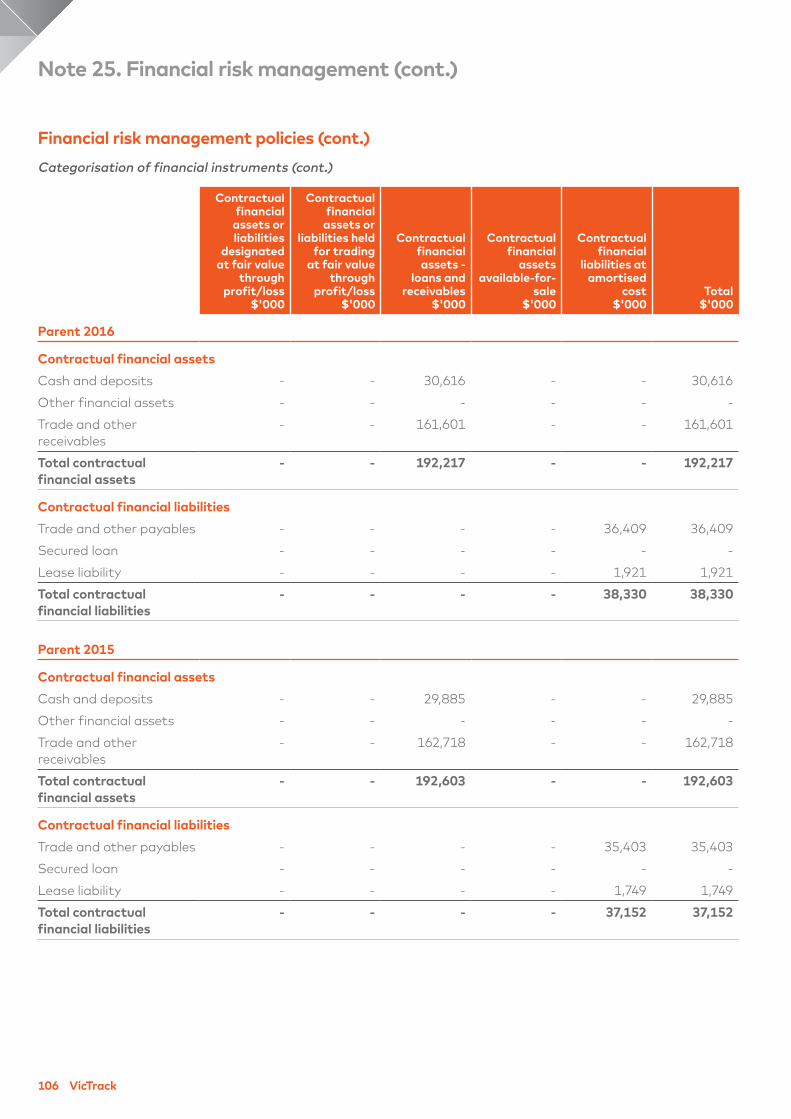
106 VicTrack
Financial risk management policies (cont.)
Categorisation of financial instruments (cont.)
Contractual
financial
assets or
liabilities
designated
at fair value
through
profit/loss
$'000
Contractual
financial
assets or
liabilities held
for trading
at fair value
through
profit/loss
$'000
Contractual
financial
assets -
loans and
receivables
$'000
Contractual
financial
assets
available-for-
sale
$'000
Contractual
financial
liabilities at
amortised
cost
$'000
Total
$'000
Parent 2016
Contractual financial assets
Cash and deposits - - 30,616 - - 30,616
Other financial assets - - - - - -
Trade and other
receivables
- - 161,601 - - 161,601
Total contractual
financial assets
- - 192,217 - - 192,217
Contractual financial liabilities
Trade and other payables - - - - 36,409 36,409
Secured loan - - - - - -
Lease liability - - - - 1,921 1,921
Total contractual
financial liabilities
- - - - 38,330 38,330
Parent 2015
Contractual financial assets
Cash and deposits - - 29,885 - - 29,885
Other financial assets - - - - - -
Trade and other
receivables
- - 162,718 - - 162,718
Total contractual
financial assets
- - 192,603 - - 192,603
Contractual financial liabilities
Trade and other payables - - - - 35,403 35,403
Secured loan - - - - - -
Lease liability - - - - 1,749 1,749
Total contractual
financial liabilities
- - - - 37,152 37,152
Note 25. Financial risk management (cont.)
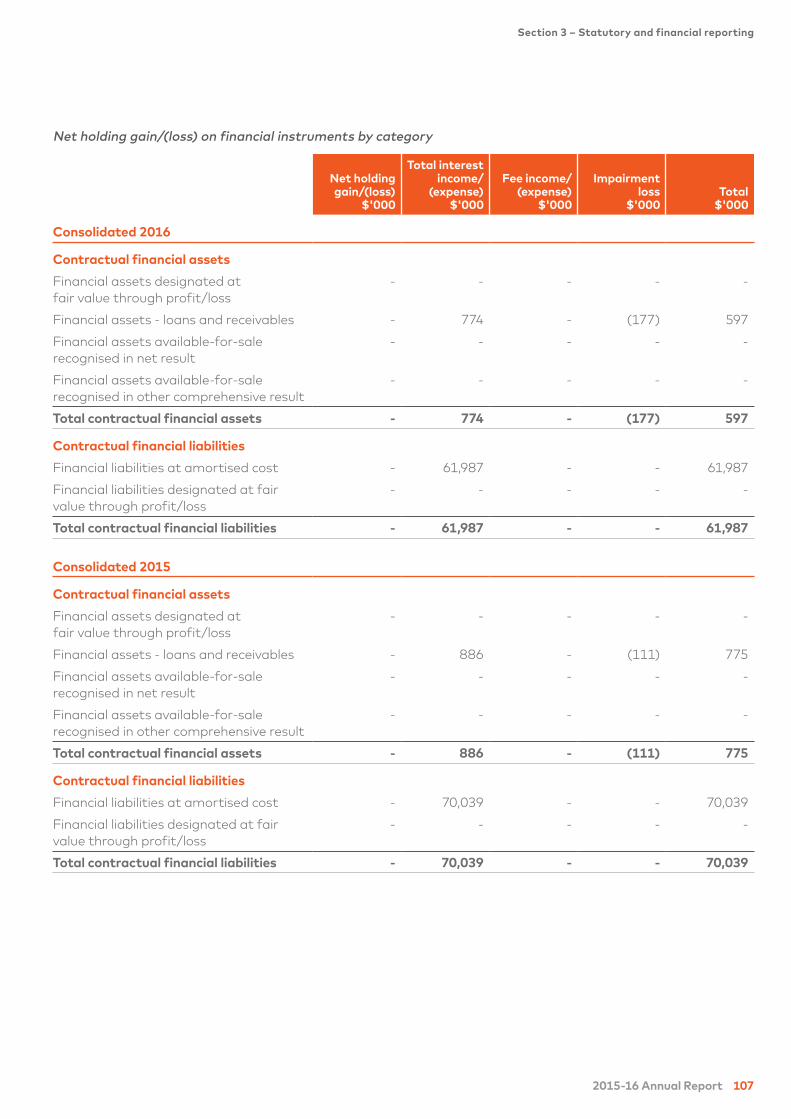
2015-16 Annual Report 107
Section 3 – Statutory and financial reporting
Net holding gain/(loss) on financial instruments by category
Net holding
gain/(loss)
$'000
Total interest
income/
(expense)
$'000
Fee income/
(expense)
$'000
Impairment
loss
$'000
Total
$'000
Consolidated 2016
Contractual financial assets
Financial assets designated at
fair value through profit/loss
- - - - -
Financial assets - loans and receivables - 774 - (177) 597
Financial assets available-for-sale
recognised in net result
- - - - -
Financial assets available-for-sale
recognised in other comprehensive result
- - - - -
Total contractual financial assets - 774 - (177) 597
Contractual financial liabilities
Financial liabilities at amortised cost - 61,987 - - 61,987
Financial liabilities designated at fair
value through profit/loss
- - - - -
Total contractual financial liabilities - 61,987 - - 61,987
Consolidated 2015
Contractual financial assets
Financial assets designated at
fair value through profit/loss
- - - - -
Financial assets - loans and receivables - 886 - (111) 775
Financial assets available-for-sale
recognised in net result
- - - - -
Financial assets available-for-sale
recognised in other comprehensive result
- - - - -
Total contractual financial assets - 886 - (111) 775
Contractual financial liabilities
Financial liabilities at amortised cost - 70,039 - - 70,039
Financial liabilities designated at fair
value through profit/loss
- - - - -
Total contractual financial liabilities - 70,039 - - 70,039
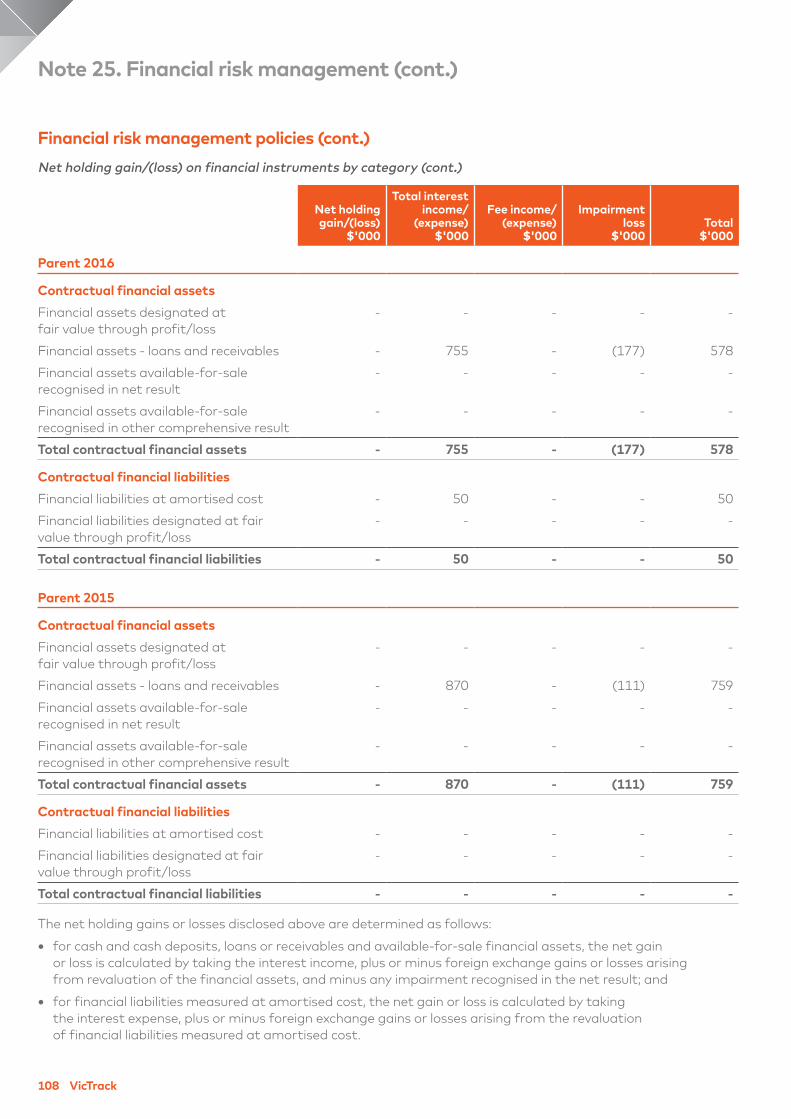
108 VicTrack
Financial risk management policies (cont.)
Net holding gain/(loss) on financial instruments by category (cont.)
Net holding
gain/(loss)
$'000
Total interest
income/
(expense)
$'000
Fee income/
(expense)
$'000
Impairment
loss
$'000
Total
$'000
Parent 2016
Contractual financial assets
Financial assets designated at
fair value through profit/loss
- - - - -
Financial assets - loans and receivables - 755 - (177) 578
Financial assets available-for-sale
recognised in net result
- - - - -
Financial assets available-for-sale
recognised in other comprehensive result
- - - - -
Total contractual financial assets - 755 - (177) 578
Contractual financial liabilities
Financial liabilities at amortised cost - 50 - - 50
Financial liabilities designated at fair
value through profit/loss
- - - - -
Total contractual financial liabilities - 50 - - 50
Parent 2015
Contractual financial assets
Financial assets designated at
fair value through profit/loss
- - - - -
Financial assets - loans and receivables - 870 - (111) 759
Financial assets available-for-sale
recognised in net result
- - - - -
Financial assets available-for-sale
recognised in other comprehensive result
- - - - -
Total contractual financial assets - 870 - (111) 759
Contractual financial liabilities
Financial liabilities at amortised cost - - - - -
Financial liabilities designated at fair
value through profit/loss
- - - - -
Total contractual financial liabilities - - - - -
The net holding gains or losses disclosed above are determined as follows:
• for cash and cash deposits, loans or receivables and available-for-sale financial assets, the net gain
or loss is calculated by taking the interest income, plus or minus foreign exchange gains or losses arising
from revaluation of the financial assets, and minus any impairment recognised in the net result; and
• for financial liabilities measured at amortised cost, the net gain or loss is calculated by taking
the interest expense, plus or minus foreign exchange gains or losses arising from the revaluation
of financial liabilities measured at amortised cost.
Note 25. Financial risk management (cont.)
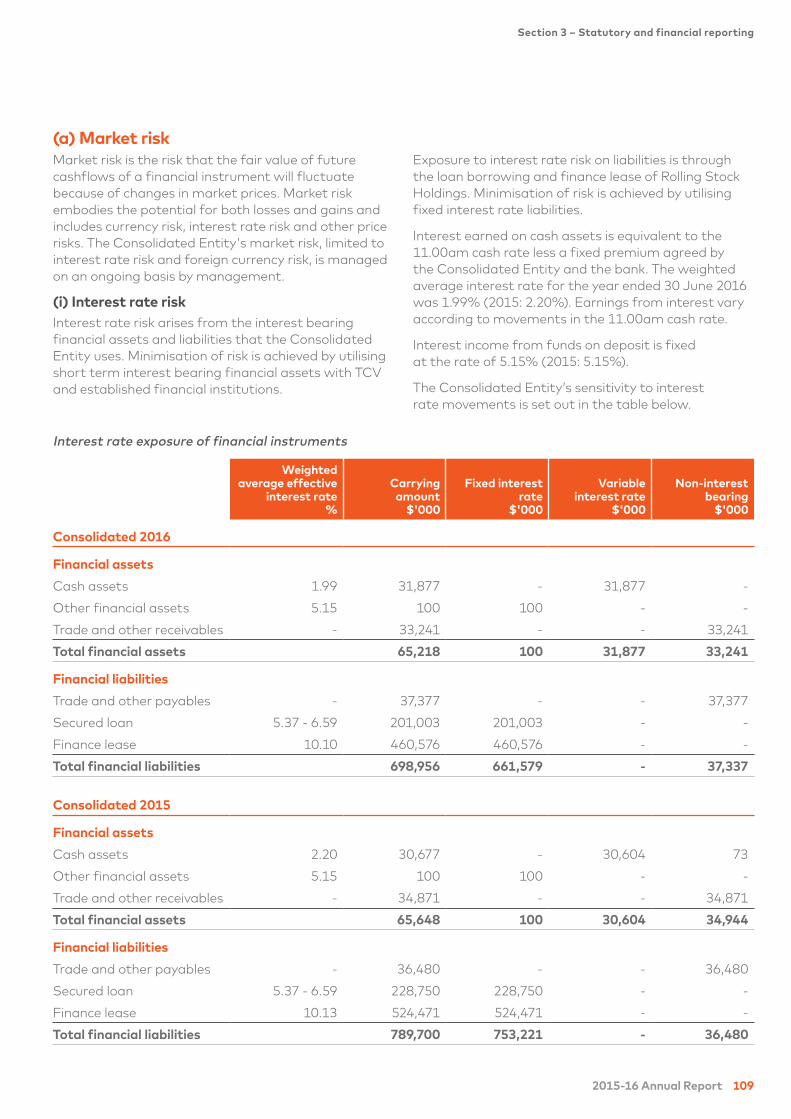
2015-16 Annual Report 109
Section 3 – Statutory and financial reporting
(a) Market risk
Market risk is the risk that the fair value of future
cashflows of a financial instrument will fluctuate
because of changes in market prices. Market risk
embodies the potential for both losses and gains and
includes currency risk, interest rate risk and other price
risks. The Consolidated Entity's market risk, limited to
interest rate risk and foreign currency risk, is managed
on an ongoing basis by management.
(i) Interest rate risk
Interest rate risk arises from the interest bearing
financial assets and liabilities that the Consolidated
Entity uses. Minimisation of risk is achieved by utilising
short term interest bearing financial assets with TCV
and established financial institutions.
Exposure to interest rate risk on liabilities is through
the loan borrowing and finance lease of Rolling Stock
Holdings. Minimisation of risk is achieved by utilising
fixed interest rate liabilities.
Interest earned on cash assets is equivalent to the
11.00am cash rate less a fixed premium agreed by
the Consolidated Entity and the bank. The weighted
average interest rate for the year ended 30 June 2016
was 1.99% (2015: 2.20%). Earnings from interest vary
according to movements in the 11.00am cash rate.
Interest income from funds on deposit is fixed
at the rate of 5.15% (2015: 5.15%).
The Consolidated Entity’s sensitivity to interest
rate movements is set out in the table below.
Interest rate exposure of financial instruments
Weighted
average effective
interest rate
%
Carrying
amount
$'000
Fixed interest
rate
$'000
Variable
interest rate
$'000
Non-interest
bearing
$'000
Consolidated 2016
Financial assets
Cash assets 1.99 31,877 - 31,877 -
Other financial assets 5.15 100 100 - -
Trade and other receivables - 33,241 - - 33,241
Total financial assets 65,218 100 31,877 33,241
Financial liabilities
Trade and other payables - 37,377 - - 37,377
Secured loan 5.37 - 6.59 201,003 201,003 - -
Finance lease 10.10 460,576 460,576 - -
Total financial liabilities 698,956 661,579 - 37,337
Consolidated 2015
Financial assets
Cash assets 2.20 30,677 - 30,604 73
Other financial assets 5.15 100 100 - -
Trade and other receivables - 34,871 - - 34,871
Total financial assets 65,648 100 30,604 34,944
Financial liabilities
Trade and other payables - 36,480 - - 36,480
Secured loan 5.37 - 6.59 228,750 228,750 - -
Finance lease 10.13 524,471 524,471 - -
Total financial liabilities 789,700 753,221 - 36,480
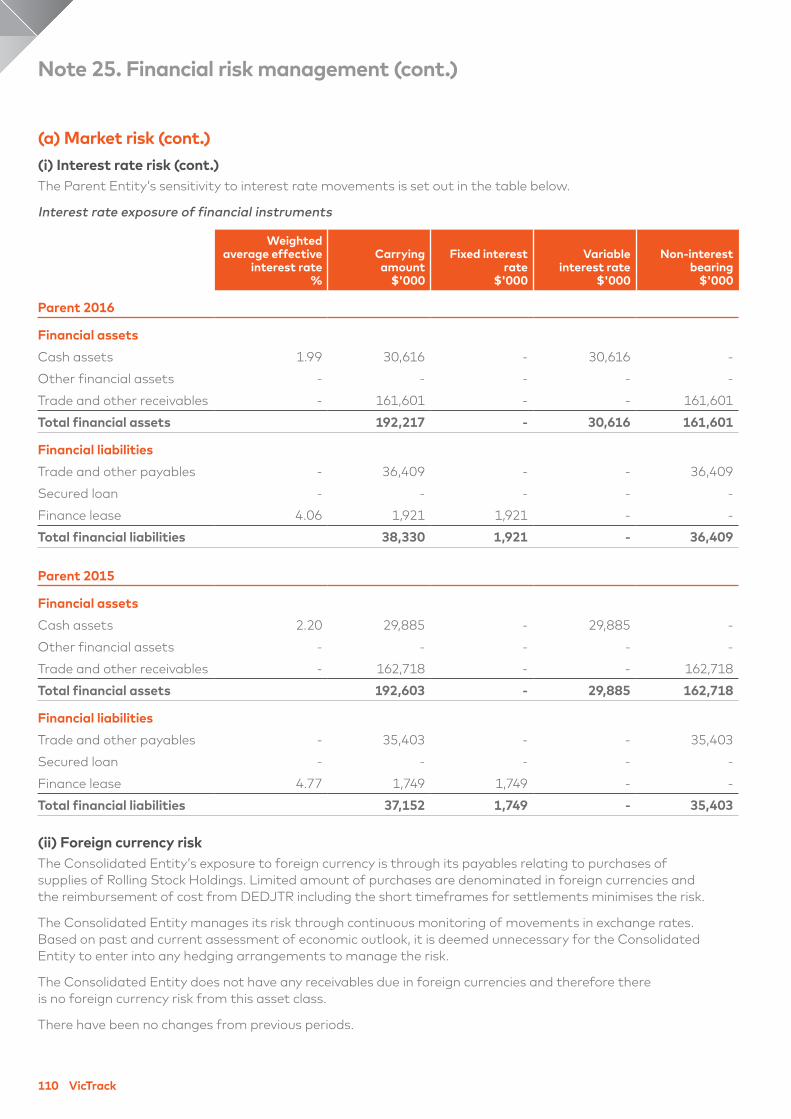
110 VicTrack
(a) Market risk (cont.)
(i) Interest rate risk (cont.)
The Parent Entity’s sensitivity to interest rate movements is set out in the table below.
Interest rate exposure of financial instruments
Weighted
average effective
interest rate
%
Carrying
amount
$'000
Fixed interest
rate
$'000
Variable
interest rate
$'000
Non-interest
bearing
$'000
Parent 2016
Financial assets
Cash assets 1.99 30,616 - 30,616 -
Other financial assets - - - - -
Trade and other receivables - 161,601 - - 161,601
Total financial assets 192,217 - 30,616 161,601
Financial liabilities
Trade and other payables - 36,409 - - 36,409
Secured loan - - - - -
Finance lease 4.06 1,921 1,921 - -
Total financial liabilities 38,330 1,921 - 36,409
Parent 2015
Financial assets
Cash assets 2.20 29,885 - 29,885 -
Other financial assets - - - - -
Trade and other receivables - 162,718 - - 162,718
Total financial assets 192,603 - 29,885 162,718
Financial liabilities
Trade and other payables - 35,403 - - 35,403
Secured loan - - - - -
Finance lease 4.77 1,749 1,749 - -
Total financial liabilities 37,152 1,749 - 35,403
(ii) Foreign currency risk
The Consolidated Entity’s exposure to foreign currency is through its payables relating to purchases of
supplies of Rolling Stock Holdings. Limited amount of purchases are denominated in foreign currencies and
the reimbursement of cost from DEDJTR including the short timeframes for settlements minimises the risk.
The Consolidated Entity manages its risk through continuous monitoring of movements in exchange rates.
Based on past and current assessment of economic outlook, it is deemed unnecessary for the Consolidated
Entity to enter into any hedging arrangements to manage the risk.
The Consolidated Entity does not have any receivables due in foreign currencies and therefore there
is no foreign currency risk from this asset class.
There have been no changes from previous periods.
Note 25. Financial risk management (cont.)
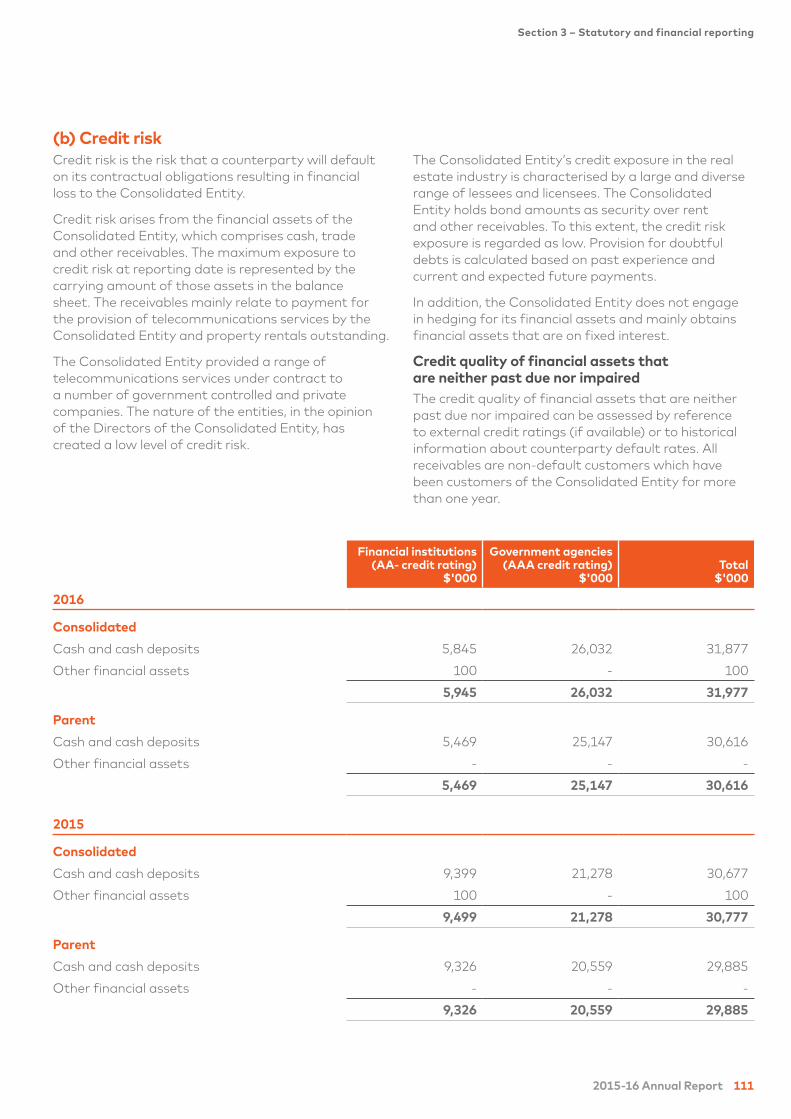
2015-16 Annual Report 111
Section 3 – Statutory and financial reporting
(b) Credit risk
Credit risk is the risk that a counterparty will default
on its contractual obligations resulting in financial
loss to the Consolidated Entity.
Credit risk arises from the financial assets of the
Consolidated Entity, which comprises cash, trade
and other receivables. The maximum exposure to
credit risk at reporting date is represented by the
carrying amount of those assets in the balance
sheet. The receivables mainly relate to payment for
the provision of telecommunications services by the
Consolidated Entity and property rentals outstanding.
The Consolidated Entity provided a range of
telecommunications services under contract to
a number of government controlled and private
companies. The nature of the entities, in the opinion
of the Directors of the Consolidated Entity, has
created a low level of credit risk.
The Consolidated Entity’s credit exposure in the real
estate industry is characterised by a large and diverse
range of lessees and licensees. The Consolidated
Entity holds bond amounts as security over rent
and other receivables. To this extent, the credit risk
exposure is regarded as low. Provision for doubtful
debts is calculated based on past experience and
current and expected future payments.
In addition, the Consolidated Entity does not engage
in hedging for its financial assets and mainly obtains
financial assets that are on fixed interest.
Credit quality of financial assets that
are neither past due nor impaired
The credit quality of financial assets that are neither
past due nor impaired can be assessed by reference
to external credit ratings (if available) or to historical
information about counterparty default rates. All
receivables are non-default customers which have
been customers of the Consolidated Entity for more
than one year.
Financial institutions
(AA- credit rating)
$'000
Government agencies
(AAA credit rating)
$'000
Total
$'000
2016
Consolidated
Cash and cash deposits 5,845 26,032 31,877
Other financial assets 100 - 100
5,945 26,032 31,977
Parent
Cash and cash deposits 5,469 25,147 30,616
Other financial assets - - -
5,469 25,147 30,616
2015
Consolidated
Cash and cash deposits 9,399 21,278 30,677
Other financial assets 100 - 100
9,499 21,278 30,777
Parent
Cash and cash deposits 9,326 20,559 29,885
Other financial assets - - -
9,326 20,559 29,885
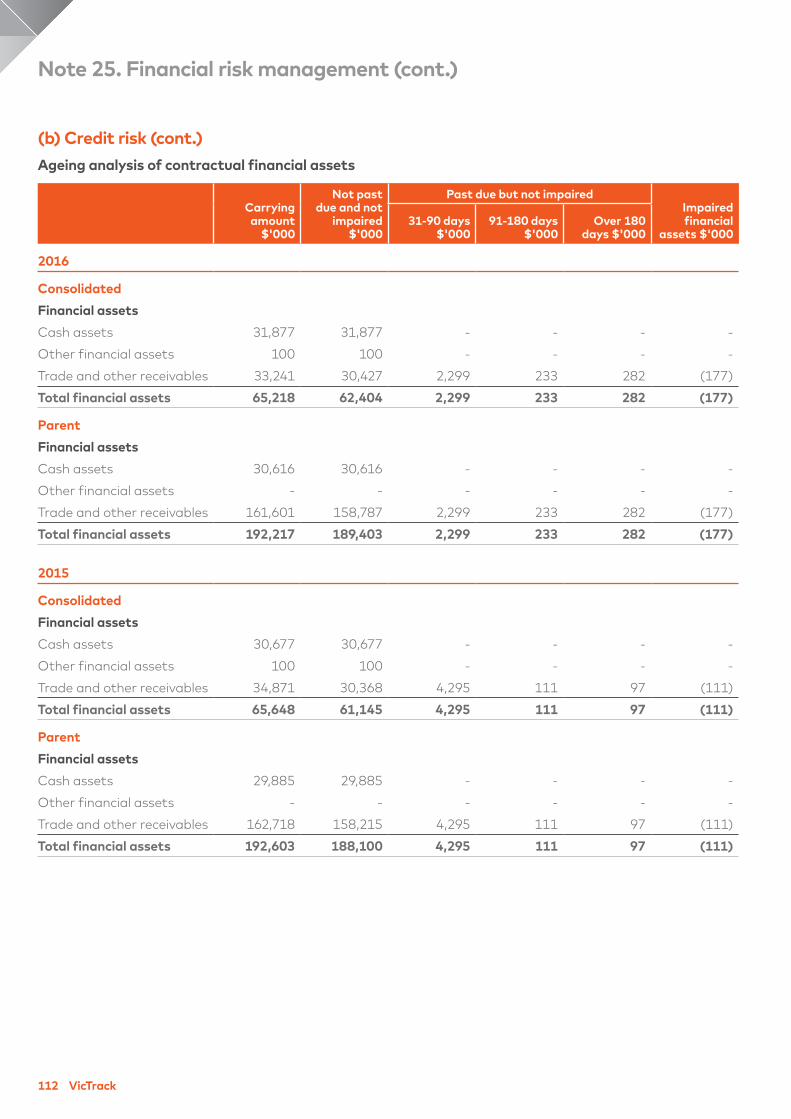
112 VicTrack
(b) Credit risk (cont.)
Ageing analysis of contractual financial assets
Carrying
amount
$'000
Not past
due and not
impaired
$'000
Past due but not impaired
Impaired
financial
assets $'000
31-90 days
$'000
91-180 days
$'000
Over 180
days $'000
2016
Consolidated
Financial assets
Cash assets 31,877 31,877 - - - -
Other financial assets 100 100 - - - -
Trade and other receivables 33,241 30,427 2,299 233 282 (177)
Total financial assets 65,218 62,404 2,299 233 282 (177)
Parent
Financial assets
Cash assets 30,616 30,616 - - - -
Other financial assets - - - - - -
Trade and other receivables 161,601 158,787 2,299 233 282 (177)
Total financial assets 192,217 189,403 2,299 233 282 (177)
2015
Consolidated
Financial assets
Cash assets 30,677 30,677 - - - -
Other financial assets 100 100 - - - -
Trade and other receivables 34,871 30,368 4,295 111 97 (111)
Total financial assets 65,648 61,145 4,295 111 97 (111)
Parent
Financial assets
Cash assets 29,885 29,885 - - - -
Other financial assets - - - - - -
Trade and other receivables 162,718 158,215 4,295 111 97 (111)
Total financial assets 192,603 188,100 4,295 111 97 (111)
Note 25. Financial risk management (cont.)
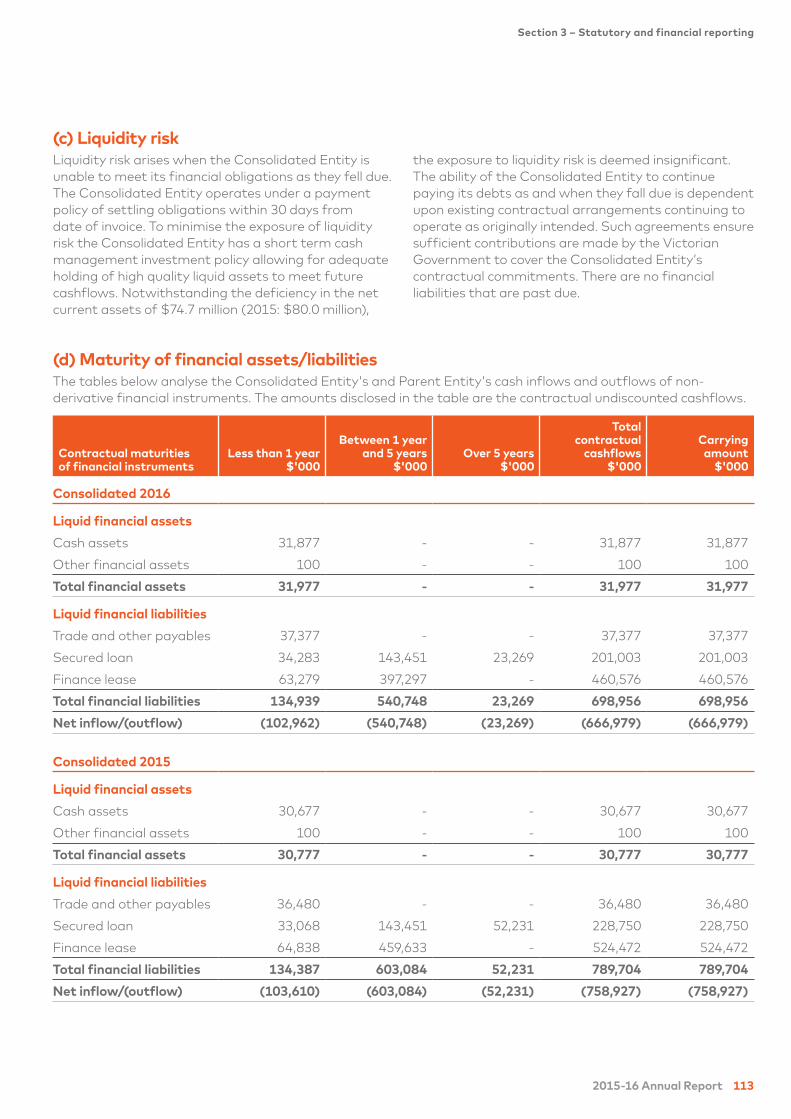
2015-16 Annual Report 113
Section 3 – Statutory and financial reporting
(c) Liquidity risk
Liquidity risk arises when the Consolidated Entity is
unable to meet its financial obligations as they fell due.
The Consolidated Entity operates under a payment
policy of settling obligations within 30 days from
date of invoice. To minimise the exposure of liquidity
risk the Consolidated Entity has a short term cash
management investment policy allowing for adequate
holding of high quality liquid assets to meet future
cashflows. Notwithstanding the deficiency in the net
current assets of $74.7 million (2015: $80.0 million),
the exposure to liquidity risk is deemed insignificant.
The ability of the Consolidated Entity to continue
paying its debts as and when they fall due is dependent
upon existing contractual arrangements continuing to
operate as originally intended. Such agreements ensure
sufficient contributions are made by the Victorian
Government to cover the Consolidated Entity’s
contractual commitments. There are no financial
liabilities that are past due.
(d) Maturity of financial assets/liabilities
The tables below analyse the Consolidated Entity's and Parent Entity's cash inflows and outflows of non-
derivative financial instruments. The amounts disclosed in the table are the contractual undiscounted cashflows.
Contractual maturities
of financial instruments
Less than 1 year
$'000
Between 1 year
and 5 years
$'000
Over 5 years
$'000
Total
contractual
cashflows
$'000
Carrying
amount
$'000
Consolidated 2016
Liquid financial assets
Cash assets 31,877 - - 31,877 31,877
Other financial assets 100 - - 100 100
Total financial assets 31,977 - - 31,977 31,977
Liquid financial liabilities
Trade and other payables 37,377 - - 37,377 37,377
Secured loan 34,283 143,451 23,269 201,003 201,003
Finance lease 63,279 397,297 - 460,576 460,576
Total financial liabilities 134,939 540,748 23,269 698,956 698,956
Net inflow/(outflow) (102,962) (540,748) (23,269) (666,979) (666,979)
Consolidated 2015
Liquid financial assets
Cash assets 30,677 - - 30,677 30,677
Other financial assets 100 - - 100 100
Total financial assets 30,777 - - 30,777 30,777
Liquid financial liabilities
Trade and other payables 36,480 - - 36,480 36,480
Secured loan 33,068 143,451 52,231 228,750 228,750
Finance lease 64,838 459,633 - 524,472 524,472
Total financial liabilities 134,387 603,084 52,231 789,704 789,704
Net inflow/(outflow) (103,610) (603,084) (52,231) (758,927) (758,927)
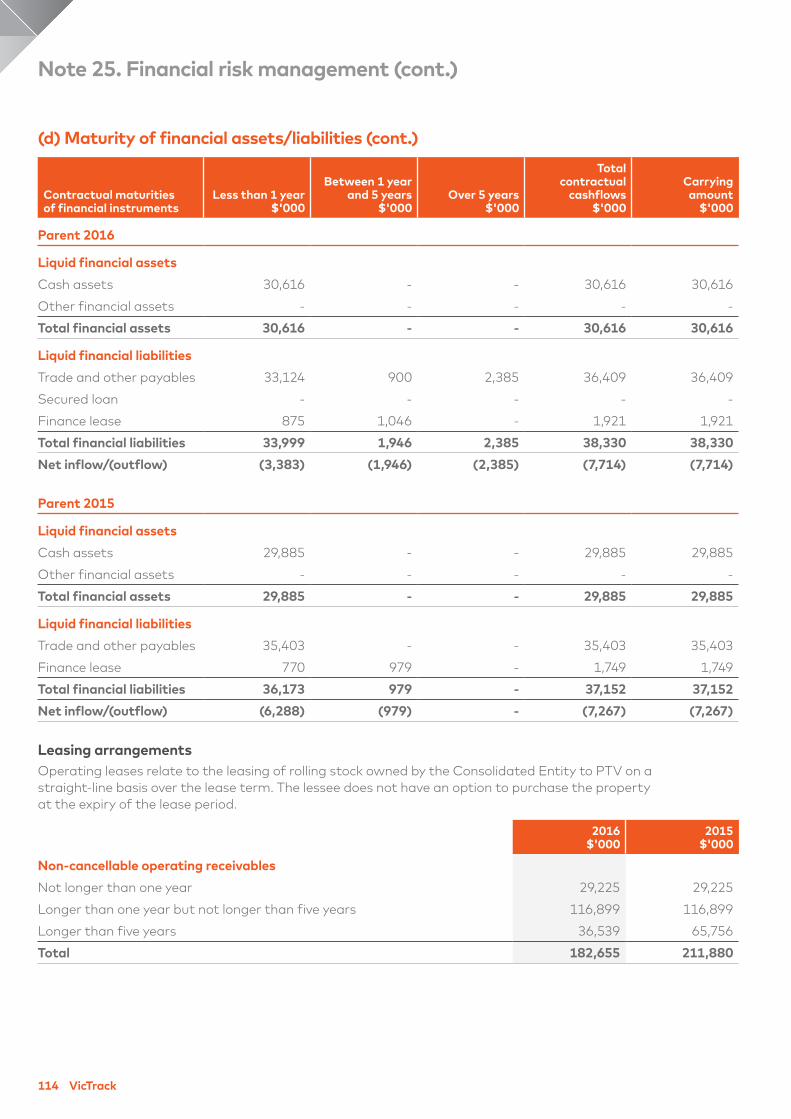
114 VicTrack
(d) Maturity of financial assets/liabilities (cont.)
Contractual maturities
of financial instruments
Less than 1 year
$'000
Between 1 year
and 5 years
$'000
Over 5 years
$'000
Total
contractual
cashflows
$'000
Carrying
amount
$'000
Parent 2016
Liquid financial assets
Cash assets 30,616 - - 30,616 30,616
Other financial assets - - - - -
Total financial assets 30,616 - - 30,616 30,616
Liquid financial liabilities
Trade and other payables 33,124 900 2,385 36,409 36,409
Secured loan - - - - -
Finance lease 875 1,046 - 1,921 1,921
Total financial liabilities 33,999 1,946 2,385 38,330 38,330
Net inflow/(outflow) (3,383) (1,946) (2,385) (7,714) (7,714)
Parent 2015
Liquid financial assets
Cash assets 29,885 - - 29,885 29,885
Other financial assets - - - - -
Total financial assets 29,885 - - 29,885 29,885
Liquid financial liabilities
Trade and other payables 35,403 - - 35,403 35,403
Finance lease 770 979 - 1,749 1,749
Total financial liabilities 36,173 979 - 37,152 37,152
Net inflow/(outflow) (6,288) (979) - (7,267) (7,267)
Leasing arrangements
Operating leases relate to the leasing of rolling stock owned by the Consolidated Entity to PTV on a
straight-line basis over the lease term. The lessee does not have an option to purchase the property
at the expiry of the lease period.
2016
$'000
2015
$'000
Non-cancellable operating receivables
Not longer than one year 29,225 29,225
Longer than one year but not longer than five years 116,899 116,899
Longer than five years 36,539 65,756
Total 182,655 211,880
Note 25. Financial risk management (cont.)
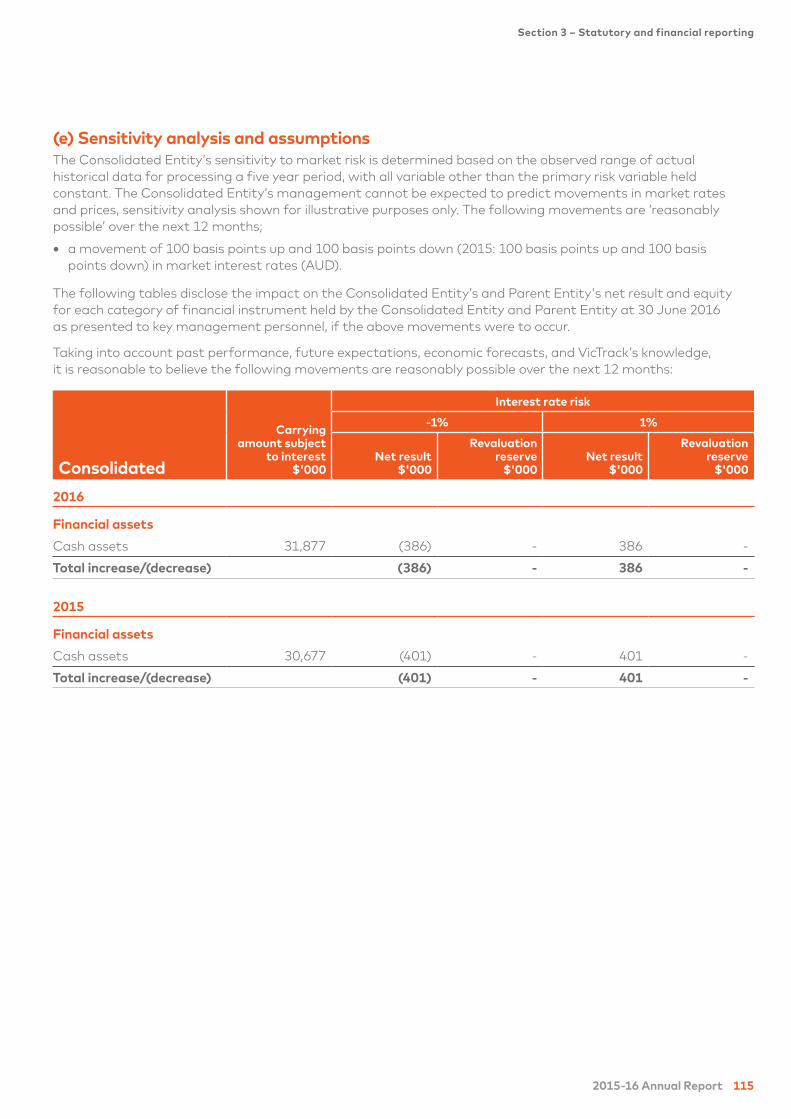
2015-16 Annual Report 115
Section 3 – Statutory and financial reporting
(e) Sensitivity analysis and assumptions
The Consolidated Entity’s sensitivity to market risk is determined based on the observed range of actual
historical data for processing a five year period, with all variable other than the primary risk variable held
constant. The Consolidated Entity’s management cannot be expected to predict movements in market rates
and prices, sensitivity analysis shown for illustrative purposes only. The following movements are ‘reasonably
possible’ over the next 12 months;
• a movement of 100 basis points up and 100 basis points down (2015: 100 basis points up and 100 basis
points down) in market interest rates (AUD).
The following tables disclose the impact on the Consolidated Entity’s and Parent Entity's net result and equity
for each category of financial instrument held by the Consolidated Entity and Parent Entity at 30 June 2016
as presented to key management personnel, if the above movements were to occur.
Taking into account past performance, future expectations, economic forecasts, and VicTrack’s knowledge,
it is reasonable to believe the following movements are reasonably possible over the next 12 months:
Carrying
amount subject
to interest
$'000
Interest rate risk
-1% 1%
ConsolidatedNet result
$'000
Revaluation
reserve
$'000
Net result
$'000
Revaluation
reserve
$'000
2016
Financial assets
Cash assets 31,877 (386) - 386 -
Total increase/(decrease) (386) - 386 -
2015
Financial assets
Cash assets 30,677 (401) - 401 -
Total increase/(decrease) (401) - 401 -
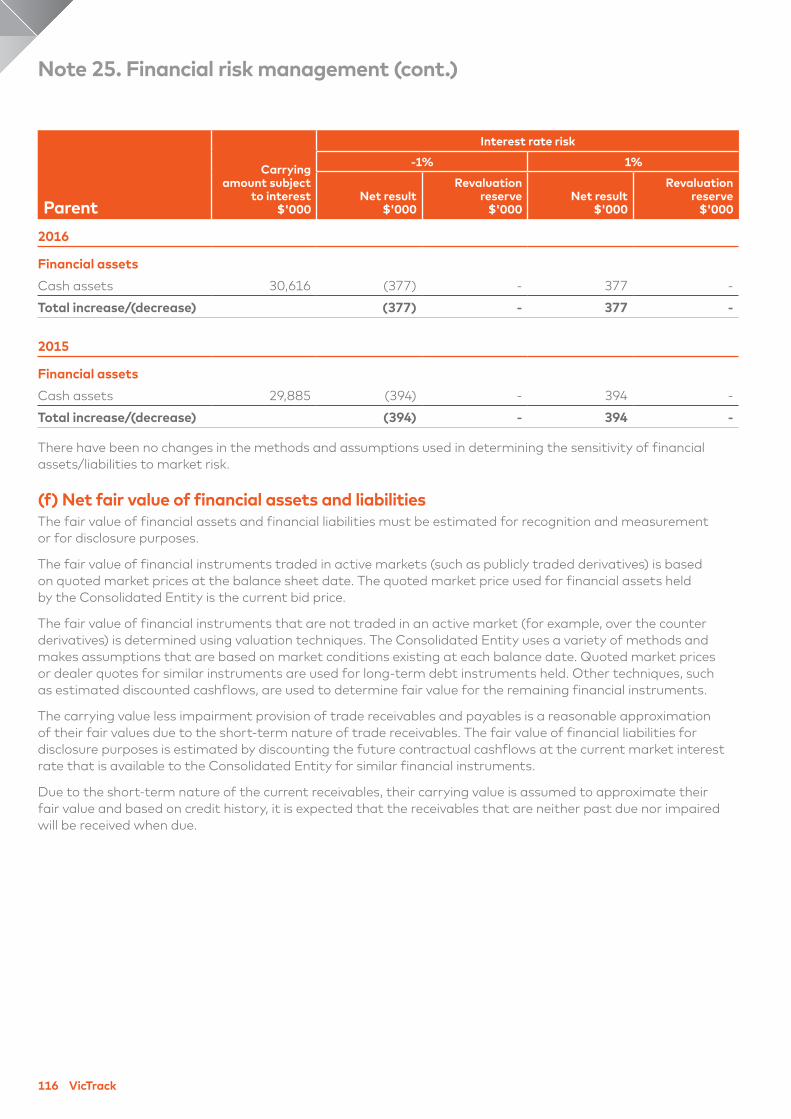
116 VicTrack
Carrying
amount subject
to interest
$'000
Interest rate risk
-1% 1%
ParentNet result
$'000
Revaluation
reserve
$'000
Net result
$'000
Revaluation
reserve
$'000
2016
Financial assets
Cash assets 30,616 (377) - 377 -
Total increase/(decrease) (377) - 377 -
2015
Financial assets
Cash assets 29,885 (394) - 394 -
Total increase/(decrease) (394) - 394 -
There have been no changes in the methods and assumptions used in determining the sensitivity of financial
assets/liabilities to market risk.
(f) Net fair value of financial assets and liabilities
The fair value of financial assets and financial liabilities must be estimated for recognition and measurement
or for disclosure purposes.
The fair value of financial instruments traded in active markets (such as publicly traded derivatives) is based
on quoted market prices at the balance sheet date. The quoted market price used for financial assets held
by the Consolidated Entity is the current bid price.
The fair value of financial instruments that are not traded in an active market (for example, over the counter
derivatives) is determined using valuation techniques. The Consolidated Entity uses a variety of methods and
makes assumptions that are based on market conditions existing at each balance date. Quoted market prices
or dealer quotes for similar instruments are used for long-term debt instruments held. Other techniques, such
as estimated discounted cashflows, are used to determine fair value for the remaining financial instruments.
The carrying value less impairment provision of trade receivables and payables is a reasonable approximation
of their fair values due to the short-term nature of trade receivables. The fair value of financial liabilities for
disclosure purposes is estimated by discounting the future contractual cashflows at the current market interest
rate that is available to the Consolidated Entity for similar financial instruments.
Due to the short-term nature of the current receivables, their carrying value is assumed to approximate their
fair value and based on credit history, it is expected that the receivables that are neither past due nor impaired
will be received when due.
Note 25. Financial risk management (cont.)
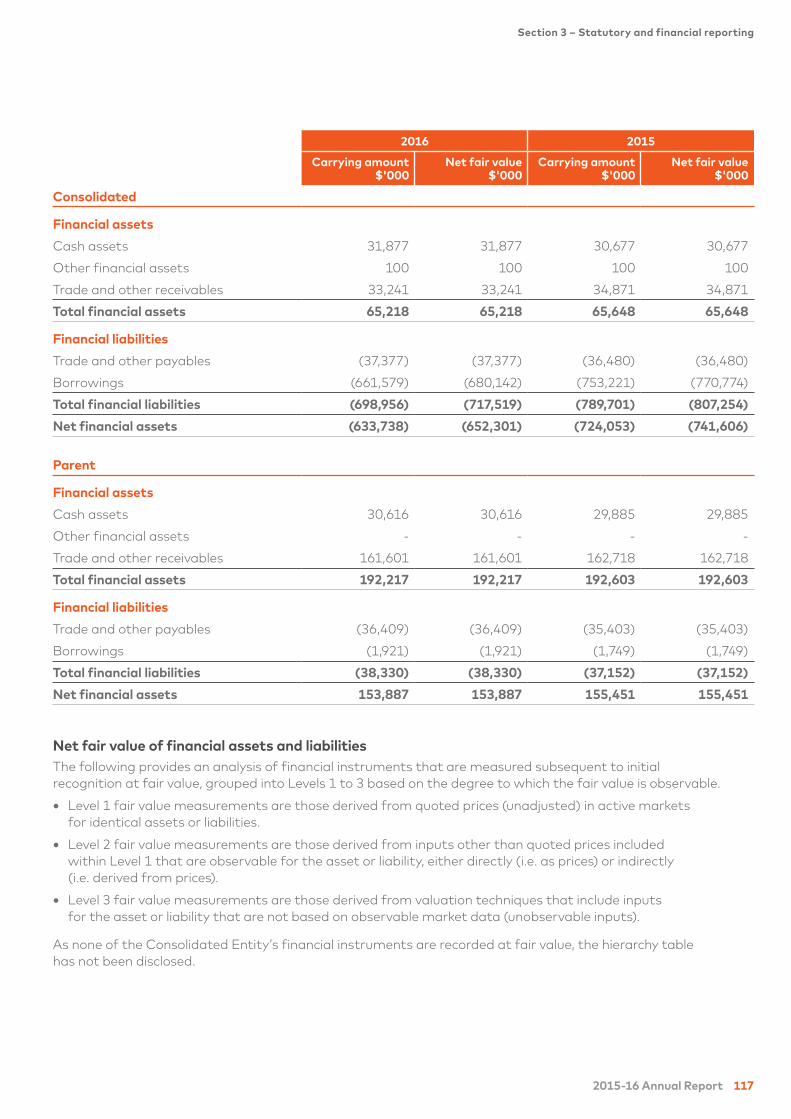
2015-16 Annual Report 117
Section 3 – Statutory and financial reporting
Net fair value of financial assets and liabilities
The following provides an analysis of financial instruments that are measured subsequent to initial
recognition at fair value, grouped into Levels 1 to 3 based on the degree to which the fair value is observable.
• Level 1 fair value measurements are those derived from quoted prices (unadjusted) in active markets
for identical assets or liabilities.
• Level 2 fair value measurements are those derived from inputs other than quoted prices included
within Level 1 that are observable for the asset or liability, either directly (i.e. as prices) or indirectly
(i.e. derived from prices).
• Level 3 fair value measurements are those derived from valuation techniques that include inputs
for the asset or liability that are not based on observable market data (unobservable inputs).
As none of the Consolidated Entity’s financial instruments are recorded at fair value, the hierarchy table
has not been disclosed.
2016 2015
Carrying amount
$'000
Net fair value
$'000
Carrying amount
$'000
Net fair value
$'000
Consolidated
Financial assets
Cash assets 31,877 31,877 30,677 30,677
Other financial assets 100 100 100 100
Trade and other receivables 33,241 33,241 34,871 34,871
Total financial assets 65,218 65,218 65,648 65,648
Financial liabilities
Trade and other payables (37,377) (37,377) (36,480) (36,480)
Borrowings (661,579) (680,142) (753,221) (770,774)
Total financial liabilities (698,956) (717,519) (789,701) (807,254)
Net financial assets (633,738) (652,301) (724,053) (741,606)
Parent
Financial assets
Cash assets 30,616 30,616 29,885 29,885
Other financial assets - - - -
Trade and other receivables 161,601 161,601 162,718 162,718
Total financial assets 192,217 192,217 192,603 192,603
Financial liabilities
Trade and other payables (36,409) (36,409) (35,403) (35,403)
Borrowings (1,921) (1,921) (1,749) (1,749)
Total financial liabilities (38,330) (38,330) (37,152) (37,152)
Net financial assets 153,887 153,887 155,451 155,451
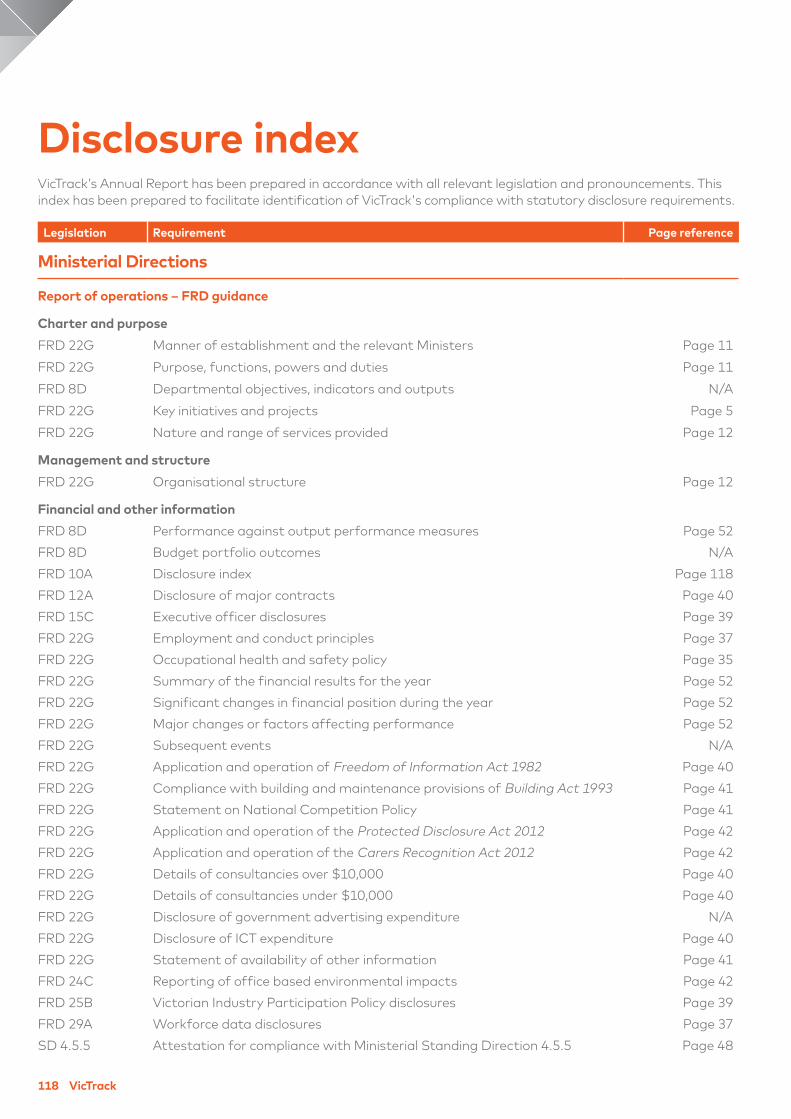
118 VicTrack
Disclosure index
VicTrack’s Annual Report has been prepared in accordance with all relevant legislation and pronouncements. This
index has been prepared to facilitate identification of VicTrack's compliance with statutory disclosure requirements.
Legislation Requirement Page reference
Ministerial Directions
Report of operations – FRD guidance
Charter and purpose
FRD 22G Manner of establishment and the relevant Ministers Page 11
FRD 22G Purpose, functions, powers and duties Page 11
FRD 8D Departmental objectives, indicators and outputs N/A
FRD 22G Key initiatives and projects Page 5
FRD 22G Nature and range of services provided Page 12
Management and structure
FRD 22G Organisational structure Page 12
Financial and other information
FRD 8D Performance against output performance measures Page 52
FRD 8D Budget portfolio outcomes N/A
FRD 10A Disclosure index Page 118
FRD 12A Disclosure of major contracts Page 40
FRD 15C Executive officer disclosures Page 39
FRD 22G Employment and conduct principles Page 37
FRD 22G Occupational health and safety policy Page 35
FRD 22G Summary of the financial results for the year Page 52
FRD 22G Significant changes in financial position during the year Page 52
FRD 22G Major changes or factors affecting performance Page 52
FRD 22G Subsequent events N/A
FRD 22G Application and operation of Freedom of Information Act 1982 Page 40
FRD 22G Compliance with building and maintenance provisions of Building Act 1993 Page 41
FRD 22G Statement on National Competition Policy Page 41
FRD 22G Application and operation of the Protected Disclosure Act 2012 Page 42
FRD 22G Application and operation of the Carers Recognition Act 2012 Page 42
FRD 22G Details of consultancies over $10,000 Page 40
FRD 22G Details of consultancies under $10,000 Page 40
FRD 22G Disclosure of government advertising expenditure N/A
FRD 22G Disclosure of ICT expenditure Page 40
FRD 22G Statement of availability of other information Page 41
FRD 24C Reporting of office based environmental impacts Page 42
FRD 25B Victorian Industry Participation Policy disclosures Page 39
FRD 29A Workforce data disclosures Page 37
SD 4.5.5 Attestation for compliance with Ministerial Standing Direction 4.5.5 Page 48
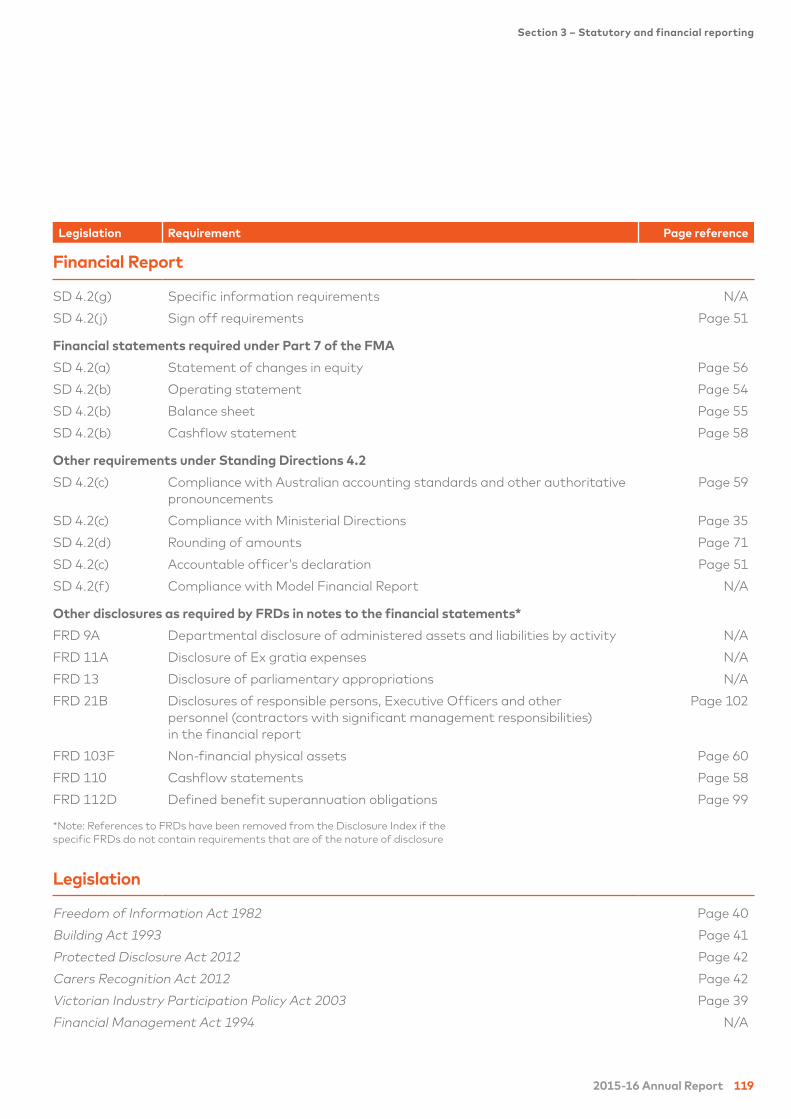
2015-16 Annual Report 119
Section 3 – Statutory and financial reporting
Legislation Requirement Page reference
Financial Report
SD 4.2(g) Specific information requirements N/A
SD 4.2(j) Sign off requirements Page 51
Financial statements required under Part 7 of the FMA
SD 4.2(a) Statement of changes in equity Page 56
SD 4.2(b) Operating statement Page 54
SD 4.2(b) Balance sheet Page 55
SD 4.2(b) Cashflow statement Page 58
Other requirements under Standing Directions 4.2
SD 4.2(c) Compliance with Australian accounting standards and other authoritative
pronouncements
Page 59
SD 4.2(c) Compliance with Ministerial Directions Page 35
SD 4.2(d) Rounding of amounts Page 71
SD 4.2(c) Accountable officer’s declaration Page 51
SD 4.2(f) Compliance with Model Financial Report N/A
Other disclosures as required by FRDs in notes to the financial statements*
FRD 9A Departmental disclosure of administered assets and liabilities by activity N/A
FRD 11A Disclosure of Ex gratia expenses N/A
FRD 13 Disclosure of parliamentary appropriations N/A
FRD 21B Disclosures of responsible persons, Executive Officers and other
personnel (contractors with significant management responsibilities)
in the financial report
Page 102
FRD 103F Non-financial physical assets Page 60
FRD 110 Cashflow statements Page 58
FRD 112D Defined benefit superannuation obligations Page 99
*Note: References to FRDs have been removed from the Disclosure Index if the
specific FRDs do not contain requirements that are of the nature of disclosure
Legislation
Freedom of Information Act 1982 Page 40
Building Act 1993 Page 41
Protected Disclosure Act 2012 Page 42
Carers Recognition Act 2012 Page 42
Victorian Industry Participation Policy Act 2003 Page 39
Financial Management Act 1994 N/A
120 VicTrack
Appendices
Board members
VicTrack Directors are appointed on the basis of their ability to contribute to meeting VicTrack’s objectives.
Each Director has wide experience with other boards and organisations, and together they bring a diverse
range of knowledge and business expertise to VicTrack. At year end, the Board comprised eight independent,
non-executive Directors – John Lenders (Chair), Yehudi Blacher (Deputy Chair), Paula Allen, Brian Bulluss,
Collette Burke, Geraldine Gray, David Hunter and Michael Trumble.
John Lenders
Chair
John was appointed as Director and Chair of
VicTrack in April 2015 and has more than a decade
of experience in senior roles in public office. He is
Chair of the Remuneration and Human Resources
Committee. John was elected to State Parliament
in September 1999. After joining the Cabinet in
February 2002, he held a range of portfolios including
Industrial Relations, Consumer Affairs, Finance, ICT,
Major Projects, WorkCover and Education. He was
the Victorian Treasurer from 2007 to 2010 and was
responsible for delivering the State budget, and
providing strategic advice to government on its
economic, financial and budgetary policies.
Yehudi Blacher PSM, BA (Hons), MA, FIPA
Deputy Chair
Yehudi was appointed a Director and Deputy Chair
of VicTrack in April 2012. He is Chair of the Freight
Logistics Committee. Yehudi brings extensive public
sector experience to the Board, including land-use
planning and strategic management. He was the
Secretary of the Victorian Department of Planning
and Community Development from 2002 to 2011.
He also held Deputy Secretary level positions in
the Department of Premier and Cabinet and the
Department of Human Services.
From 1991 to 1996 he was head of the Victorian
Office of Local Government. He is a Fellow of the
IPAA (Victoria) and a Professorial Fellow at the
University of Melbourne. Yehudi was appointed as the
inaugural Chair of the Port of Hastings Development
Authority in 2012 and has been a member of the
Monash University Council since 2008.
Paula Allen CFA FCA
Director
Paula has extensive experience spanning more than
two decades across strategy, finance, governance, and
technology, principally around highly regulated markets.
During her career, she has held senior positions that have
helped businesses to deliver better outcomes, including
Bankers Trust, Colonial Group, and LUCRF Super.
Companies she led have been recognised through listings
in BRW Top 500 companies in Australia and the ‘Rising
Star’ award in the superannuation industry. Currently
Paula manages her own consulting firm, working both
locally and internationally. Paula was appointed to the
Board effective 1 April 2016.
Brian Bulluss
Director
Brian Bulluss was appointed a Director of VicTrack in
September 2011. He is Chair of the Telecommunications
Committee. Brian is a Procurement Project Manager
with CPA Australia, the professional association
for accountants. His expertise is in procurement, IT,
telecommunications and property. Brian was formerly
a National Project Manager for Telstra. His education
background includes Facilities Management (University
of Melbourne) and Commercial Property Management
(Macquarie University).
Collette Burke B.E (Civil), M.Eng.Sci, PhD, FIEAust, GAICD
Director
Collette has spent over 24 years in the design and
construction sector with major contractors (Leightons,
Thiess and John Holland) as well as being a co-founder
of boutique engineering consultancy and education
firm, Exner Group. Collette is also an internationally
acknowledged researcher and authority on risk
management and the delivery of value for money in
major infrastructure projects. Through her experience,
Collette has been exposed to major telecommunications
projects, rail projects and road and rail signalling
installations, which have significant and valuable
synergies with VicTrack. Collette joined VicTrack’s
Board in July 2015.
2015-16 Annual Report 121
Section 3 – Statutory and financial reporting
Geraldine Gray BA, LLB, LLM
Director
Geraldine has spent some 30 years in the legal industry,
practising as a solicitor then a barrister in NSW, Hong
Kong and Victoria. She has been at the Victorian Bar
since 2004 and brings with her broad and invaluable
legal experience in the commercial, contractual and
construction sectors. Geraldine is a director of the
Australasian Leukaemia & Lymphoma Group Ltd.
She was appointed to the VicTrack Board in July 2015.
David Hunter FIE Aust, Dip BA, GAICD
Director
David Hunter was appointed a director of VicTrack in
September 2011 and is Chair of the Audit and Risk
Management Committee. David is a civil engineer
specialising in strategic planning for physical and social
infrastructure. He has more than 40 years’ experience
as a civil engineer, company director and manager,
including 17 years in local government and 25 years in
private practice. David has held senior management
and directorship roles, including Director of Coomes
Consulting Group and Director and Executive
General Manager, Market Development at Downer
EDI Consulting (CPG). Since retiring from full-time
employment, David has established a part-time
consultancy providing strategic advice to key clients.
Michael Trumble BCom, LLB
Director
Michael was appointed a Director of VicTrack in
December 2012. He is the Chair of the Property,
Environment and Heritage Committee. Michael is
a leading commercial property lawyer and is the
principal of the firm Michael Trumble Legal. He has a
wealth of experience in property law in development,
construction and management, commercial leasing,
purchasing and sales, joint ventures and other related
transactions. He has worked on projects ranging
from major office building developments to shopping
centres and public infrastructure projects. In particular,
his public infrastructure experience includes Melbourne
Airport project, the Commonwealth Games Village, the
Melbourne Convention and Exhibition Centre project
and various public transport projects.

This page has been left blank intentionally.


Level 8, 1010 La Trobe Street
Docklands VIC 3008 Australia
T 1300 VICTRACK (1300 842 872)
F +61 3 9619 8851
victrack.com.au