Embed Size (px)
Citation preview

Victoria Transport Policy Institute 1250 Rudlin Street, Victoria, BC, V8V 3R7, CANADA
www.vtpi.org [email protected] Phone & Fax 250-360-1560
“Efficiency - Equity - Clarity”
Light Rail Economic Opportunity Study Evaluating Light Rail Transit As A Solution To
Capital Regional Transportation Problems
3 December 2002
by Todd Litman
Victoria Transport Policy Institute
with Mike Skene
Boulevard Transportation Group
and Shawna FitzGerald
Tom Pearce
for Island Transformations

Light Rail Economic Opportunity Study Victoria Transport Policy Institute
1
Light Rail Economic Opportunity Study Evaluating Light Rail Transit As A Solution To Capital Region Transportation Problems
15 November 2002
by
Todd Litman Victoria Transport Policy Institute
with
Mike Skene Boulevard Transportation Group
Shawna FitzGerald Tom Pearce
for
Island Transformations Contents Introduction ..................................................................................................................................... 3 Sustainable Economic and Social Opportunities ............................................................................. 9 LRT History .................................................................................................................................. 12 Case Studies .................................................................................................................................. 15 Description of Proposed Options ................................................................................................... 18 Evaluation Framework .................................................................................................................. 24
Project Costs and Revenues .................................................................................................. 26 Consumer Accessibility and Mobility Benefits .................................................................... 26 Vehicle Cost Savings ............................................................................................................ 27 Chauffeuring ......................................................................................................................... 27 Traffic Congestion ................................................................................................................ 28 Parking Cost Savings ............................................................................................................ 29 Safety, Security and Health .................................................................................................. 30 Roadway Cost Savings ......................................................................................................... 31 Environmental Impacts ......................................................................................................... 32 Travel Time Impacts ............................................................................................................. 33 Impacts on Regional Transportation and Land Use Objectives ............................................ 34 Economic Development Impacts .......................................................................................... 35 Equity, Affordability and Livability ..................................................................................... 38 Community Support and Political Feasibility ....................................................................... 38
Analysis Summaries ...................................................................................................................... 39 Sensitivity Analysis ....................................................................................................................... 41 Factors Affecting Rail Ridership ................................................................................................... 42 Opportunities For Maximizing Benefits ........................................................................................ 43 Evaluating Criticism of LRT (“Evaluating TDM Criticism,” VTPI, 2002) .................................. 45 Funding Options ............................................................................................................................ 46 Summary and Conclusions ............................................................................................................ 48 Research Recommendations .......................................................................................................... 50 Bibliography .................................................................................................................................. 51

Light Rail Economic Opportunity Study Victoria Transport Policy Institute
2
Acknowledgements Many people have contributed to this project. Gerry Howell Jones was overall project coordinator who provided invaluable guidance and encouragement. A technical review committee including Alan Cassels, Ron Cox, Dick Faulks, Tim Houlihan, George King, John Mitchell, Brendan Read, Robert Wickson and Ernest Wolski advised on many aspects of the project. Shawna FitzGerald and Tom Pearce were responsible extensive information gathering for the external experience case studies, which involved many volunteers scattered around the world, including Robert Clark, Dick Faulks, Christian Friedinger, Kathryn Gibbons, Bruce Hargreaves, John Hubbell, Daniel Kinderman, Bill MacDonald, Doug Parker, Eva Schumacher, Kirk Schneider, Helmut Uttenthaler, Bill Waddell and Robert Waring. Mike Skene of the Boulevard Transportation Group provided quality control by reviewing this report for technical accuracy. Shawna FitzGerald and Tom Pearce organized stakeholder consultations involving a variety of community groups.

Light Rail Economic Opportunity Study Victoria Transport Policy Institute
3
Introduction This study investigates the value a Light Rail Transit (LRT) system could provide to the Capital Regional District, and compares this with other transportation improvement options. It takes into account a wide range of economic, social and environmental impacts.
Description of the Capital Regional District (CRD) The Capital Regional District (CRD), located on southern Vancouver Island on the southwest coast of Canada, consists of several jurisdictions, including the City of Victoria, the capital of British Columbia. It is a beautiful location with a mild climate, making it an attractive tourist and retirement destination, while colleges, universities and art centers attract many younger adults. Victoria, Esquimalt, Saanich and Oak Bay, called the Metropolitan Core or Core Communities, are older (at least by western North American standards), well established cities. Colwood, Highlands, Langford, Metchosin and View Royal are suburban communities located west of the Core Communities, which together are called the Western Shore. According to the 2001 national census, the CRD has about 326,000 residents, with 212,000 people in the Core Communities and about 61,000 in the Western Communities. The population is projected to grow 23%, to 400,000, within 25 years. The Western Communities have the highest growth rate in the CRD. Western Shore residents often travel to Core Communities for work, school and services. This corridor between the Western Shore and Core Communities includes a major share of employment, commercial, education, medical and recreational facilities. Geographic constraints make it difficult to add new roadway links on this corridor.
Regional Transportation Issues During the period of this study the CRD was in the process of finalizing the Regional Growth Strategy. If current trends continue, traffic congestion is expected to increase significantly during the next 20 years, particularly on the corridor between the Western Shore and Core communities. According to this analysis, the overall average region-wide network speed is forecast to decline from 44 km/hr in 1996 to 41 km/hr in 2010, and to 40 km/hr in 2018, and the duration of congestion will also increase.1 These delays impose additional costs on residents and businesses, and therefore on the region’s quality of life and economic development. The most significant traffic delays are forecasted to occur in the Western Communities. Highway 1 (the Trans-Canada Highway from downtown Victoria to Colwood and Goldstream Park) is the busiest highway in the region. Together with highways 1A and 14 in Colwood and Langford, this part off the road network is extremely congested during peak hours, resulting in the nickname “Colwood Crawl.”
1 Regional traffic planners predict that, with current trends, the portion of the roadway system experiencing serious peak-period traffic congestion will increase more than 2,400%, from 0.6 to 15 kilometres. CRD, Capital Regional Profile – Transportation, Capital Regional District (www.crc.bc.ca), 1997.

Light Rail Economic Opportunity Study Victoria Transport Policy Institute
4
Table 1 Regional Highways
Highway Number Location/Route 1 (Trans-Canada Hwy) Dallas Rd, Douglas St., Goldstream Park, Malahat Drive, to Nanaimo 1A (Old Island Hwy) Douglas St., Gorge Rd. Craigflower Rd., through Colwood to Sooke Rd. 14 (Sooke Rd.) Colwood, Metchosin, through Sooke to Port Renfrew 17 (Pat Bay Hwy) Victoria to Sidney and Swartz Bay 17A West Saanich Rd. through Central and North Saanich This table lists major regional highways in the CRD. The first three are on the corridor that is the focus of this study. In response to concerns about increasing traffic congestion and related problems the proposed Regional Growth Strategy (RGS) incorporates objectives to improve transportation options and reduce reliance on automobile travel. Some highlight of the Regional Growth Strategy are summarized on the next page. The RGS establishes a target of increasing regional peak-period transit use from 7% to 10% of total trips, and from about 10% to 15% of commute trips, and to increase non-auto modes to 40% of trips to the metropolitan core by 2026.2 To achieve these targets the RGS includes objectives and actions to improve transport options and encouraging more efficient land use development patterns.3 LRT supports these objectives. Several recent studies have investigated the feasibility of implementing LRT in the CRD, particularly between downtown Victoria and the Western Shore, including an economic evaluation performed in 1994 as part of the Island Highway Project planning, a route alignment study (ND Lea, 1996), and ongoing design analysis by BC Transit. The 1996 ND Lea study identified a preferred route and concluded (CRD, 1997):
• A system is technically feasible.
• The corridor should be protected.
• It would cost approximately $300 million ($224 for the rail system and $72 million for rolling stock, in 1996 dollars)
• Land use management practices along the route and around stations would be an important factor in generating ridership.
2 Existing mode split data from 2001 CRD Origin and Destination Household Survey, Capital Regional District (www.crd.bc.ca), 2002, Exhibit 6.9, and other sources, such as 2001 Canadian Census. Different sources provide somewhat different mode split data due to differences in scope, how travel is defined and categorized, and when surveys are performed. 3 IBI (2001) and MRC (2002) indicate federal agency support for policies to increase transit.
Light Rail Economic Opportunity Study Victoria Transport Policy Institute
5
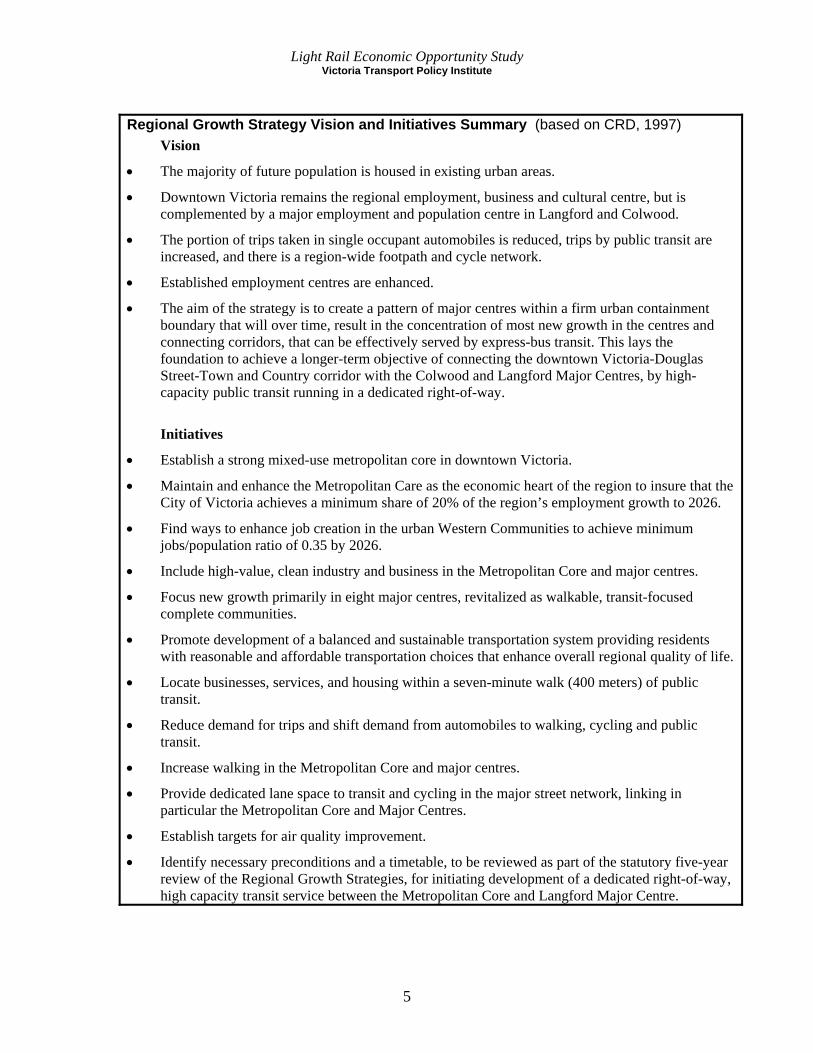
Regional Growth Strategy Vision and Initiatives Summary (based on CRD, 1997)
Vision
• The majority of future population is housed in existing urban areas.
• Downtown Victoria remains the regional employment, business and cultural centre, but is complemented by a major employment and population centre in Langford and Colwood.
• The portion of trips taken in single occupant automobiles is reduced, trips by public transit are increased, and there is a region-wide footpath and cycle network.
• Established employment centres are enhanced.
• The aim of the strategy is to create a pattern of major centres within a firm urban containment boundary that will over time, result in the concentration of most new growth in the centres and connecting corridors, that can be effectively served by express-bus transit. This lays the foundation to achieve a longer-term objective of connecting the downtown Victoria-Douglas Street-Town and Country corridor with the Colwood and Langford Major Centres, by high-capacity public transit running in a dedicated right-of-way.
Initiatives
• Establish a strong mixed-use metropolitan core in downtown Victoria.
• Maintain and enhance the Metropolitan Care as the economic heart of the region to insure that the City of Victoria achieves a minimum share of 20% of the region’s employment growth to 2026.
• Find ways to enhance job creation in the urban Western Communities to achieve minimum jobs/population ratio of 0.35 by 2026.
• Include high-value, clean industry and business in the Metropolitan Core and major centres.
• Focus new growth primarily in eight major centres, revitalized as walkable, transit-focused complete communities.
• Promote development of a balanced and sustainable transportation system providing residents with reasonable and affordable transportation choices that enhance overall regional quality of life.
• Locate businesses, services, and housing within a seven-minute walk (400 meters) of public transit.
• Reduce demand for trips and shift demand from automobiles to walking, cycling and public transit.
• Increase walking in the Metropolitan Core and major centres.
• Provide dedicated lane space to transit and cycling in the major street network, linking in particular the Metropolitan Core and Major Centres.
• Establish targets for air quality improvement.
• Identify necessary preconditions and a timetable, to be reviewed as part of the statutory five-year review of the Regional Growth Strategies, for initiating development of a dedicated right-of-way, high capacity transit service between the Metropolitan Core and Langford Major Centre.

Light Rail Economic Opportunity Study Victoria Transport Policy Institute
6
Regional Transportation Issues Figure 1 illustrates current regional travel demand, showing relatively heavy volumes between the Western Shore and the Metropolitan Core. This is the corridor evaluated in this study. Travel demand is projected to increase with population and economic growth in the Western Shore, and increased interregional travel on the Trans-Canada Highway (about 5% of peak-hour travel on this corridor travels north to the Cowichan Valley). Figure 1 Regional Travel Demand (Capital Regional District, 2002)
This map produced by the regional transportation model shows peak-hour vehicle traffic volumes.

Light Rail Economic Opportunity Study Victoria Transport Policy Institute
7
According to the 2001 CRD Household Travel Survey there are more than 23,000 person-trips and more than 15,000 vehicle-trips on this corridor during an average weekday peak-hour (TSI, 2002), representing 22% of total regional peak-hour travel.4 This corridor has a 66% auto mode split (percentage of trips made by auto drivers), which is consistent with regional patterns, as indicated in Table 2. Table 2 Total Regional PM Peak Hour Mode Share (TSI, 2002)
Trips Mode Share Auto Driver 69,960 65.6% Auto Passenger 22,360 21.0% Transit Passenger 10,480 9.8% Bicycle 3,820 3.6%
Total 106,620 100% This table summarizes peak-hour mode split. This represents about 9% of total daily trips. On the corridor between Victoria and the Western Communities (based on screen lines at Highway 1 near Thetis Lake and Highway 1A at the Six Mile House), about 650 peak-hour trips are currently made by transit on that corridor (CRD data). There are six bus routes (14, 50, 51, 52, 57 and 61) plus daily train service on the corridor between the Western Shore and the Metropolitan Core. Table 3 Transit Ridership In Selected Canadian Cities (2000) (CUTA, 2001)
Population region (urban core)
Transit Trips Trips Per Capita region (urban core)
Canadian Urban Areas 18,717,770 1,487,428,242 79 British Columbia 3,111,398 162,897,969 52 Mid-size Canadian Cities 3,555,932 149,884,626 42 Calgary 951,395 (860,749) 73,459,000 77 (85) Vancouver 1,878,545 129,123,273 69 Edmonton 909,500 (658,000) 43,041,689 47 (65) Winnipeg 621,900 38,914,000 63 Victoria 333,953 19,282,626 58 Hamilton 420,000 20,298,015 48 Saskatoon 212,136 8,005,250 38 Regina 172,100 6,361,553 37 Windsor 200,000 5,640,407 28 Brampton 308,000 7,072,681 23 Markham 197,500 3,007,308 15 This table compares population, annual transit trips, and per capita annual transit trips for various Canadian cities.
4 Calculated by summing trips between eastern (Sid/NSan/CSan, Saanich, Oak Bay and Victoria) and western area communities (Esq/VRoyal, Col/Metch, High/Land and JF/Sooke/Cow) from TSI 2002, exhibits 6.5 and 6.6. There is some uncertainty about these values because of the way data are aggregated in travel surveys. For example, it is not possible to know what portion of trips between Victoria, Esquimalt and View Royal take place on this corridor.

Light Rail Economic Opportunity Study Victoria Transport Policy Institute
8
The Victoria region has relatively high per capita transit ridership, as indicated in Table 3 and Figure 2. Regional residents ride transit about 38% more than average for mid-size Canadian cities (150,000 to 400,000 population). Most Canadian cities with greater transit ridership are significantly larger or have rail transit service. Figure 2 Per Capita Annual Transit Trips for Selected Canadian Cities (2000)
0
10
20
30
40
50
60
70
80
90
Calgary
Vanco
uver
Edmon
ton
Winn
ipeg
Victori
a
Hamilto
n
Mid-siz
e Citie
s
Saska
toon
Regina
Wind
sor
Brampti
on
Markha
m
Ann
ual P
er C
apita
Tra
nsit
Trip
s
City With Rail SystemNo Rail
Victoria has relatively high per capita ridership. Most cities with higher rates have rail systems. Victoria’s per capita transit ridership is even higher when evaluated with respect to the urban core population only. These data tend to understate Victoria’s per capita transit ridership because the Victoria regional transit system has a relatively large service area, including nearby rural communities, while transit agencies in some other cities, such as Calgary and Edmonton, that only serve urban core areas. Considering just the 300,000 population urban area, the Victoria region averages about 64 annual trips per capita.
Light Rail Economic Opportunity Study Victoria Transport Policy Institute
9
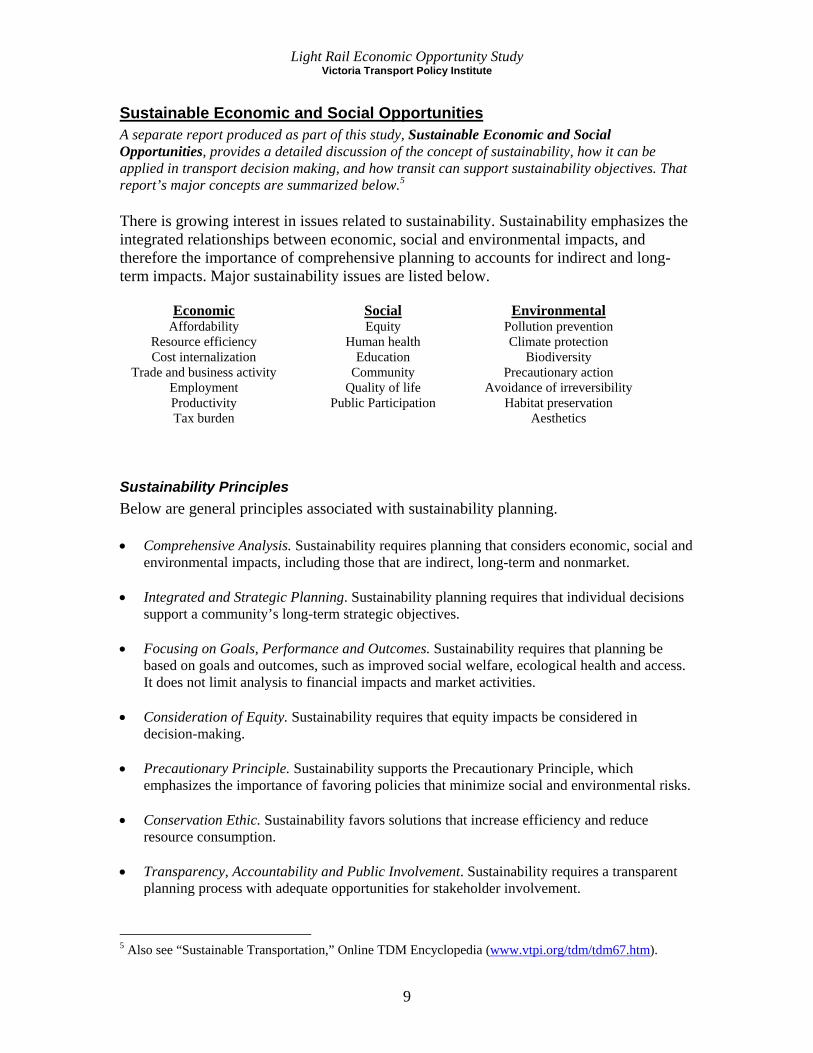
Sustainable Economic and Social Opportunities A separate report produced as part of this study, Sustainable Economic and Social Opportunities, provides a detailed discussion of the concept of sustainability, how it can be applied in transport decision making, and how transit can support sustainability objectives. That report’s major concepts are summarized below.5 There is growing interest in issues related to sustainability. Sustainability emphasizes the integrated relationships between economic, social and environmental impacts, and therefore the importance of comprehensive planning to accounts for indirect and long-term impacts. Major sustainability issues are listed below.
Economic Affordability
Resource efficiency Cost internalization
Trade and business activity Employment Productivity Tax burden
Social Equity
Human health Education
Community Quality of life
Public Participation
Environmental Pollution prevention Climate protection
Biodiversity Precautionary action
Avoidance of irreversibility Habitat preservation
Aesthetics
Sustainability Principles Below are general principles associated with sustainability planning. • Comprehensive Analysis. Sustainability requires planning that considers economic, social and
environmental impacts, including those that are indirect, long-term and nonmarket. • Integrated and Strategic Planning. Sustainability planning requires that individual decisions
support a community’s long-term strategic objectives. • Focusing on Goals, Performance and Outcomes. Sustainability requires that planning be
based on goals and outcomes, such as improved social welfare, ecological health and access. It does not limit analysis to financial impacts and market activities.
• Consideration of Equity. Sustainability requires that equity impacts be considered in
decision-making. • Precautionary Principle. Sustainability supports the Precautionary Principle, which
emphasizes the importance of favoring policies that minimize social and environmental risks. • Conservation Ethic. Sustainability favors solutions that increase efficiency and reduce
resource consumption. • Transparency, Accountability and Public Involvement. Sustainability requires a transparent
planning process with adequate opportunities for stakeholder involvement.
5 Also see “Sustainable Transportation,” Online TDM Encyclopedia (www.vtpi.org/tdm/tdm67.htm).

Light Rail Economic Opportunity Study Victoria Transport Policy Institute
10
Transportation Sustainability Impacts Transportation facilities and activities have significant sustainability impacts, including those listed below. As a result, strategies that increase transport system efficiency and reduce negative impacts from transport activities are among the most effective ways to help achieve sustainability. Transportation Impacts on Sustainability
Economic Traffic congestion Mobility barriers Crash damages
Transportation facility costs Consumer transportation costs
Depletion of non-renewable resources
Social Inequity of impacts
Mobility disadvantaged Human health impacts Community cohesion Community livability
Aesthetics
Environmental Air pollution
Climate change Habitat loss
Water pollution Hydrologic impacts
Noise pollution The most sustainable strategies are those that provide multiple economic, social and environmental benefits. Because transportation activities have so many impacts, it is important to use a comprehensive framework to evaluate transport policies and programs. This helps identify options that help achieve multiple objectives, and avoid those that solve one transportation problem but exacerbate others. For example, a policy or program that reduces traffic congestion but increases air pollution emissions or crashes cannot be considered a sustainable solution. Similarly, a strategy that reduces energy consumption and air pollution emission, but increases traffic congestion, crashes and consumer costs is not necessarily sustainable. The most sustainable transport solutions are those which help reduce traffic congestion, pollution, crashes and consumer costs; increase mobility options for non-drivers; and encourage more efficient land use patterns, or at least avoid contradicting any of these objectives.

Light Rail Economic Opportunity Study Victoria Transport Policy Institute
11
How Transit Supports Sustainability Transit improvements are often advocated to help create more sustainable transportation and land use patterns. Transit service tends to support sustainability in various ways summarized below and discussed in greater detail later in this report. Of course, not every transit project provides all of these benefits – an inefficient transit project may contradict sustainability objectives, or provide less benefit than other options.
Cost Effective When all costs are considered transit is often the most cost effective way to reduce urban traffic congestion and improve regional mobility. It can provide road, parking and consumer cost savings compared with the same trips made by automobile.
Transportation Options and Consumer Preferences Transit improvements and more accessible land use patterns can improve transportation options, particularly for non-drivers. This provides direct consumer benefits and can increase equity if it improves travel options for people who are economically, physically or socially disadvantaged.
Efficient Land Use Transit travel requires less land for roads and parking facilities than automobile travel. Transit, particularly rail, can provide a catalyst for more accessible land use patterns, called transit-oriented development (“Transit Oriented Development,” VTPI, 2002). Some research suggests that, as a result of these land use changes, each passenger-kilometer of rail transit transport results in 1.4 to 9 kilometres in reduced automobile travel (Holtzclaw, 2000). These “indirect” travel impacts occur in addition to “direct” travel impacts such as automobile trips shifted to transit (“Land Use Impacts on Transportation” and “Evaluating Land Use Impacts” chapters of VTPI, 2002).
Economic Development Transit can help stimulate regional economic development in several ways. It can reduce congestion and transportation costs, and encourage more efficient land use, which increases economic productivity. By shifting consumer expenditures away from vehicles and fuel (which are not produced in this region), it increases regional employment and business activity. Rail transit tends to create an urban environment that attracts resource-efficient industries (such as tourism, education, software, health services, etc.), and can help establish a unique community identity that provides inspiration for community sustainable development.
Resource Efficiency and Reduced Pollution Transit travel, particularly electric rail, consumes fewer resources and produce less pollution than automobile travel. These benefits are particularly significant if transit provides a catalyst for more efficient land use or reduced per capita vehicle ownership.

Light Rail Economic Opportunity Study Victoria Transport Policy Institute
12
LRT History Electric Light Rail Transit (LRT, or trolleys) were first built in the 1880s, and during the next forty years many cities, including Victoria, developed along trolley lines (Ewert, 1992). Local railway service (called “interurban”) connected many towns, including three lines from Victoria north on the Saanich Peninsula, and service east to Metchosin and Sooke on what is now the Galloping Goose trail, as illustrated in figures 3 and 4. Figure 3 Victoria Area Rail Network
This map shows the local rail system around Victoria in 1923.

Light Rail Economic Opportunity Study Victoria Transport Policy Institute
13
Most urban rail systems were converted to bus service during the middle of the Twentieth Century, excepting some heavy commuter systems in large cities. But during the later part of the century many cities began to reinvest in rail. There is considerable debate about the value of these investments. Some critics argue that transit does little to solve transport problems due to consumers’ preference for private automobile travel and low-density land use patterns (Orski, 2000, Vreeland, 2002). They argue that outside a few major cities there is little justification for investments or policies to encourage transit use. Supporters point out that, although transit only provides a small portion of total mobility, it be the most cost effective way to serve congested urban corridors and address urban transport problems (Weyrich and Lind, 2001). There is also considerable debate about the relative merits of bus and rail transit (Pascall, 2001). Rail advocates argue that rail provides superior service quality that attracts more discretionary riders (people who have the option of driving) and so provides greater congestion and emission reduction benefits. They claim that rail is an effective “hook” to increase ridership, gain political support for transit-friendly policies and projects, and create more transit-oriented land use patterns. In numerous cities, voters have approved special funding for rail system development, while offering less support for bus service. Figure 4 Trolleys In Downtown Victoria
This photo shows Douglas Street in downtown Victoria, in the 1940s. (Wallace Young Photo)

Light Rail Economic Opportunity Study Victoria Transport Policy Institute
14
Bus advocates argue that buses are more cost effective and flexible, allowing more service to be provided for a given level of funding, and that buses can be nearly as fast and comfortable as rail at lower cost. They claim that much of the preference for rail reflects prejudices rather than real advantages. It can be difficult to predict whether rail or bus will attract the most people out of their cars. Rail transit tends to attract more discretionary riders within the area it serves, while bus transit can serve a greater area, and so may attract equal or greater total ridership. Major differences between bus and rail transit are summarized below. Buses tend to be most effective on low- and medium-density corridors. Rail is most effective on high-density corridors with major residential or commercial centers located around stations.
Bus Light Rail Flexibility. Bus routes can change and expand when needed, to accommodate road closures and changes in destinations or demand. Does not require special facilities. Buses can use existing roadways, and general traffic lanes can be converted into a busway. Several routes can converge onto one busway, reducing the need for transfers. For example, several routes can use a busway to a city center. Lower capital costs. Is used more by people who are transit dependent, so bus service improvements tend to provide greater equity benefits.
Greater ridership demand and public preference. Rail tends to attract more discretionary riders than buses within a given catchment area (and so tends to reduce more vehicle traffic), and voters tend to support more funding for rail than for bus systems. Greater potential capacity. Rail requires less space and is more cost-effective on high volume routes. Tends to have greater positive land use impacts. Can create transit oriented development and increase local property values more than bus-based systems. Increased user comfort, including larger seats with greater legroom, more space per passenger, and smother acceleration. Less air and noise pollution. Bus transfer centers tend to be less pleasant than rail stations.

Light Rail Economic Opportunity Study Victoria Transport Policy Institute
15
Case Studies This section summarizes extensive research on LRT systems in North America and Europe. Data was gathered from transit agencies, local planners and other sources in each region. Table 4 summarizes key statistical data. Individual reports on these systems are available on request.
Calgary, Alberta Calgary’s C-Train is considered a successful light rail system. This is due to several reasons including, integral transportation planning in the overall land-use planning process. Ridership incentive programs, Park & Ride facilities at stations, extensive cycle amenities, and high-quality, frequent service provide excellent access from suburban areas to the city’s downtown core.
Edmonton, Alberta Edmonton, Alberta was the first North American city with a population under one million to build a modern LRT system. The system encountered and eventually overcame a variety of obstacles, including inadequate political support, escalating costs, few policies to encourage transit use, and a lack of supportive land use policies.
Portland, Oregon Portland, Oregon MAX is often cited as an LRT success. Completed on time and within budget, MAX has a high public approval rating. Light rail has supported downtown redevelopment, and has helped increase transit ridership on major corridors. MAX is supported by a variety of integrated land use and transportation policies that encourage transit ridership and transit-oriented development. It serves thousands of central city and suburban jobs, and has influenced a variety of private and public investments along its length. MAX has helped defer the need for new highway investments as ridership has increased at a greater percentage than population growth.
Sacramento, California Sacramento, the capital of California, has a 20.6-mile LRT system that is expanding to 37 miles in 2003. The system carries an average of 30,000 riders per weekday, slightly exceeding projections. Transit carries 17% of downtown commuters, 9.1% on LRT. Census data indicates that light rail ridership in Sacramento’s suburbs is 60-70 % higher than on equivalent bus service, indicating that rail transit is more attractive than buses to affluent suburbanites. Sixty percent of the LRT trips are on non-commute hours, indicating people are using rail for many types of trips.
Graz, Austria Graz, Austria is a city comparable in size to Victoria with a successful LRT system. Graz has a well-established integrated transport policy stemming from the early 1970s and was founded on restricting car use in favour of public transport, cycling and walking. These policies have resulted in a high quality central area and street environment, low levels of congestion giving high access to the historic core, increased priority and mobility for pedestrians, cyclists and public transport, and improved environmental conditions and traffic-related safety, particularly for vulnerable road users.

Light Rail Economic Opportunity Study Victoria Transport Policy Institute
16
Grenoble, France The light rail system in Grenoble is considered a success. The LRT now accounts for 45% of all public transport trips. The system has been a catalyst for improved public transport with continued expansion of the LRT line. It has been a catalyst for redevelopment of the historic city-center into a pedestrian-friendly area. It has been described as the first modern LRT to have a real aesthetic quality and to enhance the image of the city it serves.
Orleans, France Orleans is a tourist hub of beautiful gardens and historic streetscapes, similar in size to Victoria. The 18-kilometre LRT system was completed in 2000, after just 26 months, and was one of the least expensive to build in Europe. The second line is under construction. The first line connects the city with suburban areas that include a major university and hospital. Total transit ridership has increased by about a third since the LRT system began operating, from about 70,000 to 93,600 average daily trips.
Kassel, Germany Kassel, Germany is another city that is similar in size and geography to Victoria. Its LRT system is more than 100 years old, and continues to expand. It currently has nine lines operating on a 44.7 kilometres rail network. This system is integrated into the city’s land use patterns and the lives of residents. Large, new businesses like shopping centres, consider LRT access as a precondition for their investment. After the LRT system was expanded in 1995, per capita annual ridership increased from 34.8 annual trips in 1996 to 39.4 annual trips in 2000. Case Study Conclusions This research shows that new LRT systems have been successfully implemented in many urban areas similar to the CRD in geography, population, demographics, economics and tourism amenities. Most have achieved ridership projections and have been politically popular. Even successful LRT systems are expensive, costing many millions of dollars. All required significant capital investments and most require substantial operating subsidies. Such systems generally carry only a small portion of total regional travel. However, their costs are usually less then the full costs of accommodating additional automobile travel on congested urban corridors, including roadway and parking facility costs, land costs, vehicle ownership and operating costs, and environmental costs. In addition, LRT systems can help achieve strategic transportation and land use objectives by providing a catalyst for urban redevelopment and pedestrian improvements.

Light Rail Economic Opportunity Study Victoria Transport Policy Institute
17
Table 4 LRT System Comparison (Various Sources) City Calgary Edmonton Portland Sacramento Kassel Graz, Austria Orleans Grenoble
Name C-Train Light Rail
Transit MAX Sacramento Light Rail KVG GVB SEMTAO
SEMITAG
Pop. - City Core 879,277 648,284 551,000 407,018 195,281 237,810 105,099 150,815 Pop. – Area 951,395 909,500 1.3 million 1,300,400 245,765 271,017 243,137 404,837
Manufacturer Siemens-Duwag Siemens/Duewag Bombardier/Siemens
Siemens/CAF on order
Duewag, Siemens, Bombardier/Alstom
SGP, Duewag, Bombardier
Alstom/Citadis 301
Alstom
Type of Vehicle U2-DC-83-
AC-2 Articulated Articutlated/LowfloorArticulated/
Lowfloor Mixed/Lowfloor Mixed/Lowfloor Lowfloor
Lowfloor Number of Vehicles
85 (plus 32 on order) 37
26 (plus 39 on order (78 total in 2001)
36 (plus 54 on order)
Total unknown, 35 on order 80 22
53
Operator 1 1 1 1 1 1 1 2 Vehicle Length 24.4 meters 24.3 meters 27.1 m (89 feet) 24.3 m 29.3m/varies 19-27 m 30 m Unknown Max. Speed 80 kmph 80 kmph 88.5 kmph 88.5 kmph 70kmph /varies 60-70 kmph 80 kmph Unknown Seated Passengers 64 64 76 60 87 / varies 53 / varies 44 Unknown Standees 98 97 90 65 80 /varies 93 / varies 130 Unknown Total Passengers 162 161 166 125 167 /varies 146 / varies 174 Unknown
Length of track 32.7 km
(20.3 miles) 19.3km
(12 miles) 71.3km
(44.3 miles) 62.8km (39 miles)
(2003) 44.7 km 29.7 km 18 km
19.2 km Stations 31 10 64 31 107 80 24 42
Street cars
Heritage Park Street
Railway
Yes, Hanover demonstrator for
private hire Streetcars and 1 Vintage Trolley 4
Operates during annual fair
Operates for summer tours
and annual fair No
No
Total costs $548 million $344.7 million $1.65 billion $566 million Unknown (built over
100 yr period) Unknown (built over 100 yr period) $390 million
Unknown
Annual LRT Passengers
109 million (LRT & bus) 9.6 million 22.3 million 26 million 39.4 million 53 million
16.5 m (projected)
22.9 million
Daily Passengers 100,000 36,000 60,000 31,200 Unknown Unknown 45,000
120,000 Per Capita Annual Transit Trips 127 10.5 (LRT only) 17.3 (LRT only) 20 160 195 27
57
Downtown Parking Stalls 9,710 1,600 3,900 4,153 Unknown Unknown 900
unknown

Light Rail Economic Opportunity Study Victoria Transport Policy Institute
18
Description of Proposed Options This study compares five options for improving transport between Victoria and the Western Shore. These options are described below. Cost values in 2002 Canadian dollars unless otherwise indicated.
Highway Description: This option is to build an additional general-purpose travel lane on the main roadways between downtown Victoria and downtown Langford, including Douglas Street, the Trans-Canada Highway and Goldstream Avenue. This is estimated to cost $300 million, plus $5 million in additional annual operating and maintenance expenses. This estimate is based on costs of previous Trans-Canada Highway projects on this corridor, adjusted to account for various factors, such as likely differences in property acquisition costs, and differences in project scope. Travel Impacts: A freeway lane can carry up to 2,200 vehicles per hour. Roadways with intersections, such as these, have maximum capacity of about 1,200 vehicles per hour, or 1,440 additional peak-period passenger trips, assuming 1.2 passengers per vehicle, increasing to 2,880 additional peak-period person-trips over ten years. This increases peak-period vehicle traffic volumes on the corridor about 10%. Increased highway capacity tends to encourage more dispersed development and automobile dependent transportation patterns that “induce” additional automobile travel, meaning additional vehicle travel that would not occur if the roadway capacity were not increased (for discussion of this impact see “Rebound Effects,” VTPI, 2002). Induced vehicle travel increases various costs, including downstream traffic congestion (i.e., on roads not included in the highway project), crashes, sprawl, energy consumption, and pollution emissions. An important question for this analysis is how much additional vehicle travel this project would induce. This analysis assumes that traffic will grow over a 5 year time period to fill up the additional capacity, and that half of these additional peak period trips consist of induced vehicle travel. This is a conservative estimate: even greater vehicle travel may be induced if increased highway capacity leads to more automobile dependent transportation and land use patterns, such as more households and businesses locating in rural areas that would otherwise locate closer to urban centers. This analysis assumes that increased highway capacity will provide the same congestion reduction benefits per additional vehicle-mile as other options, and that it will reduce per-mile vehicle operating costs from 25¢ to 12.5¢ per vehicle-mile, providing savings to motorists. These are both optimistic assumptions concerning the benefits of highway capacity expansion. Consumer Impacts: Highway capacity expansion benefits consumers who strongly prefer to drive, but provides no additional options for non-drivers and consumers who prefer transportation alternatives.

Light Rail Economic Opportunity Study Victoria Transport Policy Institute
19
Bus/HOV Priority Description: This option is to build an additional highway lane for buses in both directions, plus additional transit priority measures such as traffic signal preemption (some of which are already being implemented along this corridor). This involves the same costs as the Highway option, plus some additional expenses for added roadway design, traffic enforcement and transit service, estimated to total $325 million in capital costs plus $7 million in annual operating costs. A dedicated lane could accommodate as many as 500 buses per hour, about ten times the capacity needed in the foreseeable future, so it could be a Bus/HOV lane, which also accommodates carpools and vanpools, without degrading transit service. This increases passenger capacity and provides additional travel options, since carpools and vanpools can serve more diverse destinations than transit. If there is still excess capacity, it could be a High Occupancy Toll (HOT) lane, which also accommodates low-occupant vehicles that pay a toll. Such facilities may require additional design features and management to minimize conflicts at intersections and where vehicles merge into the lane. More detailed engineering analysis is needed to evaluate these issues. This facility could be managed as a:
Busway – transit buses only. High Occupancy Vehicle (HOV) lane – transit buses, vanpools and carpools only. High Occupancy Toll (HOT) lane – buses, vanpools and carpools are free, other vehicles can use the lane if they pay a toll.
Travel Impacts: This option allows bus and rideshare vehicles to avoid traffic congestion and so should attract more discretionary riders. The exact travel impacts are difficult to predict. As described earlier, rail tends to attract more discretionary riders within its service area (i.e., within walking distance of a rail station, or Park and Ride facility), while buses and HOVs can provide direct access to more destinations (e.g., Western Shore communities, the University of Victoria, the Saanich Peninsula, etc.), and so may attract more total riders, at least during peak periods. Our analysis assumes that this facility would result in an additional 2,000 to 4,000 transit/HOV riders per peak period, with modest increases in off-peak transit travel, resulting in 10,000 additional daily transit/HOV trips during the first few years, increasing to 20,000 additional daily trips over ten years. It also assumes somewhat longer average trip distances, since a bus network can serve more dispersed destinations. Since this increases total highway capacity, total automobile trips are unlikely to decline. Consumer Impacts: Bus/HOV Priority would increase travel options. Transit and rideshare passengers would be able to avoid congestion delay, while people who prefer can continue to drive, and would benefit from reduced congestion on existing lanes. Consumers who use this facility can be assumed to be better off compared with no such facilities.

Light Rail Economic Opportunity Study Victoria Transport Policy Institute
20
Road Pricing Description: Another way to reduce congestion, improve transit service and encourage alternative modes is to implement congestion pricing, a variable road toll structured to maintain optimal traffic volumes. These can use automated electronic toll systems that avoid the need for tollbooths. Many experts consider this an efficient solution to traffic problems. It has been implemented in several cities in Asia, Europe and North America (“Road Pricing,” VTPI, 2002). For this analysis we assume that a variable fee would be imposed for driving on the inbound direction in the morning, and outbound during the afternoon, with no tolls charged during uncongested periods. An example of a variable toll rate structure is illustrated below, based on experience in other regions, although it may be modified as needed to optimize traffic flow.
Example of Congestion Reduction Toll Structure Toll Eastbound Westbound
10¢/km 7:00-8:00 4:00-5:00 20¢/km 8:00-8:30 5:00-5:30 10¢/km 8:30-9:30 5:30-6:30
This program is estimated to cost $20 million to implement and $1 million annually to operate. We estimate that 12,000 vehicles per day would pay a toll averaging $1.50 per one-way peak-period trip, resulting in $6.5 million gross and $4.2 million net annual revenue (after repaying $2.3 million in capital recovery and operating costs). No assumption is made concerning how net revenues would be used. Travel Impacts: This option would cause motorists to make a variety of travel changes, including shifts from peak to off-period driving and shifts to transit and ridesharing, and reduced use of single-occupant vehicles, increasing use of transit and ridesharing. It may increase traffic congestion on some parallel roadways, although there are few on this corridor (most parallel roads, such as Burnside Road, Gorge Road, Highway 1A, Highway 17, and West Saanich Road are slower to use). This analysis assumes that pricing would increase peak-period transit and HOV ridership by 2,000 additional passengers per peak-period during the first few years, and 4,000 additional passengers per peak period after ten years, but have little impact at other times, when there are no tolls. Consumer Impacts: Road pricing tends to benefit some people and make others worse off, directly, although overall impacts depend on the quality of travel options available and how revenues are used (“Price Evaluation,” VTPI, 2002). Transit and rideshare passengers (including people who currently use these modes, and those who shift to them in response to service improvements), wealthy motorists, and commercial vehicle users (such as freight and service vehicles) all benefit directly, while motorists tolled off the roadway will consider themselves worse off, although their disbenefits may be minimized by improved travel alternatives, and offset if they benefit indirectly from the revenue (for example, by tax reductions).

Light Rail Economic Opportunity Study Victoria Transport Policy Institute
21
Basic LRT Description: This involves building an 18-kilometer rail system connecting downtown Victoria with downtown Langford. Using updated cost estimates from previous studies (ND Lea, 1996), the capital costs of this project, including rail systems, stations, and rolling stock, are estimated to be $350 million, and operating costs $12 million annually. Rail service would substitute for some bus service on the corridor (although some direct service routes would continue), providing bus operating cost savings. Travel Impacts: When fully developed the LRT system will have 6-minute headways (10 trains per hour in each direction) during peak periods, with 120-140 seats per train, providing up to 3,000 additional peak-hour trips, with expansion as needed over time. Our analysis assumes that ridership would grow from 2,000 to 4,000 riders per peak period, and from 15,000 to 30,000 daily riders, over a 10-year time period, and that 50% of LRT trips substitute for a car trip.6 This reflects additional travelers that would be attracted due to LRT relatively faster speed and greater comfort compared with current transit options. There are currently about 650 peak-hour transit passengers traveling between Victoria and the Western Communities (based on CRC screen lines at Highway 1 near Thetis Lake and Highway 1A at the Six Mile House). This analysis assumes that this LRT would approximately triple transit ridership on this corridor, resulting in about 10% of trips that would otherwise be made by automobile shifting to transit during the first few years, and increasing to about 20% of automobile trips over a ten-year period. An important feature of rail transit is that it tends to “leverage” land use changes (i.e., if rail stations become the center of a transit-oriented urban village) that improve accessibility and provide additional, indirect reductions in vehicle travel, for example, because transit commuters do not take car trips during lunch breaks and some households with transit commuters reduce their vehicle ownership (“Transit Evaluation,” VTPI, 2002). This analysis assumes a modest leverage effect: that each passenger-kilometre of transit travel reduces an equal distance of automobile travel, for example, by eliminating lunchtime and after-work car trips that would be made by automobile commuters. Consumer Impacts: LRT would increase travel options, allowing those who prefer transit to choose a high-quality service that avoids congestion delay. People who prefer will continue to drive and benefit from reduced highway congestion. Consumers who use this service are assumed to be better off compared with no LRT.
6 Based on BC Transit’s current 7.5 daily to peak ridership ratio, although many rail transit systems have a higher ratio, since rail transit tends to attract more off-peak and weekend riders (ND Lea, 1996, p. 6-25).

Light Rail Economic Opportunity Study Victoria Transport Policy Institute
22
LRT Plus Description: This is the same as the Basic LRT, but explicitly includes transport and land use policies to support transit, including transit-oriented development, and TDM programs such as commute trip reduction and parking management programs (see the “Opportunities for Maximizing Benefits” section later in this report, and the “Transit Oriented Development” chapter of VTPI, 2002). These are consistent with Regional Growth Strategies policies, objectives and targets. This is predicted to result in a relatively high leverage effect: each passenger-kilometre of transit travel is assumed to reduce four times its distance in automobile travel, for example, by reducing vehicle ownership among frequent transit users, and encouraging more clustered land use patterns around transit stations. This option is assumed to add $25 million in project costs for additional urban design features near transit stations, such as walking and cycling improvements, Transportation Management Associations and TDM programs, although these may be offset by public cost savings from reduced parking demand and more efficient infrastructure, so net incremental costs are probably much smaller than this estimate. Travel Impacts: Transit service would be the same under this option as with Basic LRT, but would attract greater ridership due to improved station accessibility (more residents and commercial activities within convenient walking distance) and greater ridership incentives (such as commute trip reduction programs). Our analysis assumes that this would increase transit ridership by 3,000 per peak-period during the first year and 6,000 per peak period after 10 years, daily ridership would increase by 22,500 the first year up to 45,000 riders after 10-years, and that 50% of these trips substitute for a car trip. This reflects the number of travelers that would be attracted due to LRT relatively faster speed, greater comfort, increased accessibility and incentives compared with current conditions. This means that after ten years about 30% of peak-period trips and about 17% of total trips on this corridor would be made by transit. Consumer Impacts: LRT Plus would increase travel and housing options. People who prefer can continue to drive and purchase homes outside of the transit-oriented community, although they may face disincentives to sprawl, such as greater utility charges for homes in low-density areas and lower utility charges for clustered homes. Consumers who use this service can be assumed to be better off compared with no LRT, and most households that choose more transit-oriented communities are likely to be better off, although this depends on the quality of housing and travel options, and the types of incentives that are used: If most incentives are positive, LRT riders and Transit Oriented Community residents can be considered better off overall. If most incentives are negative, some households may consider themselves worse off.

Light Rail Economic Opportunity Study Victoria Transport Policy Institute
23
Summary Table 5 summarizes these five options. Note that cost data are not completely comparable since LRT options include vehicle costs, while roadway options do not include the costs of providing vehicles or parking. Table 6 summarizes projected travel impacts. Table 5 Summary of Options (Values in 2002 Canadian Dollars) Highway Bus/HOV Road Pricing LRT LRT PlusCapital costs (millions) $300 $325 $20 $350 $375Annual operating expense (million) $5.0 $7.0 $1.0 $12.0 $12.0Average door-to-door trip distance (kms) 15.0 15.0 15.0 10.0 10.0 Average fares/tolls $0.00 $1.75 $1.50 $1.75 $1.75This table summarizes data on the five options considered in this analysis. Table 6 Projected Travel Impacts7 Peak Period Daily Vehicle Trips Year 1 Year 10 Year 20 Year 1 Year 10 Year 20 Base Case 15,000 17,500 20,000 115,385 161,538 207,692Highway Lane 16,440 20,380 24,320 116,825 164,418 212,012HOV Lane 15,050 17,600 20,150 115,435 161,638 207,842Road Pricing 12,000 12,000 12,000 112,385 156,038 199,692LRT 13,500 15,750 18,000 113,885 159,788 205,692LRT Plus 12,000 14,000 16,000 112,385 158,038 203,692Transit Passenger Trips Base Case 650 951 1,268 4,875 7,313 9,751Highway Lane 650 951 1,268 4,875 7,313 9,751HOV Lane 2,650 4,951 7,251 14,875 27,313 39,751Road Pricing 2,650 4,951 7,251 6,875 11,313 15,751LRT 2,650 4,951 7,251 19,875 37,313 54,751LRT Plus 3,650 6,951 10,251 27,375 52,313 77,251Total Passenger Trips Base Case 18,650 21,951 25,268 189,490 265,775 342,059Highway Lane 20,378 25,407 30,452 191,794 270,383 348,971HOV Lane 20,710 26,071 31,431 199,570 285,935 372,299Road Pricing 17,050 19,351 21,651 186,690 260,975 335,259LRT 18,850 23,851 28,851 202,090 292,975 383,859LRT Plus 18,050 23,751 29,451 207,190 305,175 403,159Percent Transit Trips Base Case 3.5% 4.3% 5.0% 2.6% 2.8% 2.9%Highway Lane 3.2% 3.7% 4.2% 2.5% 2.7% 2.8%HOV Lane 12.8% 19.0% 23.1% 7.5% 9.6% 10.7%Road Pricing 15.5% 25.6% 33.5% 3.7% 4.3% 4.7%LRT 14.1% 20.8% 25.1% 9.8% 12.7% 14.3%LRT Plus 20.2% 29.3% 34.8% 13.2% 17.1% 19.2%This table compares projected travel impacts of the five travel options and the base case. 7 “Base Case” refers to travel trends if no improvements are implemented. Automobiles occupancy average 1.2 during peak periods and 1.6 overall, which is why Vehicle Trips and Transit Passenger Trips do not equal Total Passenger Trips.

Light Rail Economic Opportunity Study Victoria Transport Policy Institute
24
Evaluation Framework This section describes the evaluation framework used in this analysis, which is more comprehensive than conventional roadway investment models, reflecting best current practices. An important feature of this framework is that it evaluates transport based on accessibility, the ability to reach desired goods and activities, rather than treating mobility as an end in itself. This study uses a multi-criteria, lifecycle cost analysis to evaluate and compare the value of these five options. This means that the framework includes a variety of impacts, some of which are quantified and others are not, and that economic impacts that occur in future years are depreciated to a base year to facilitate comparisons. This is considered the most appropriate way to evaluate long-term projects with diverse impacts. This framework reflects best current practices for evaluating multi-modal transportation projects (Cambridge Systematics, 1998; FTA, 1998: TRB, 2000; Phillips, Karachepone and Landis, 2001; HLB, 2002). It is more comprehensive than most conventional transport project evaluation models, as summarized in Table 7. The report Evaluating Public Transit Benefits and Costs (Litman, 2002) describes this framework in detail. Table 7 Conventional and Comprehensive Transport Planning Compared8
Description Conventional ComprehensiveModeling Practices
Whether transport modeling uses current best practices to predict travel and economic impacts.
Limited analysis capability
More comprehensive
Measuring Transportation
Methods and perspectives used to measure travel (vehicle traffic, mobility or accessibility)
Measures vehicle traffic
Measures accessibility
Generated Traffic
Whether planning takes into account the full impacts of generated traffic and induced travel.
Ignores many components
Includes all components
Downstream Congestion
Additional congestion on surface streets that results from increased highway capacity.
Ignores for individual projects
Includes
Consumer Impacts
Techniques used to evaluate the consumer impacts of changes in the transport system.
Travel time changes
Consumer surplus analysis
Vehicle Costs Whether all vehicle costs and savings are considered, including long-term costs.
Only short-term operating costs
All affected vehicle costs
Parking Costs Parking costs, including costs borne by motorists, businesses and governments.
Only if paid by motorist
Includes
Construction Impacts
Whether increased congestion delays during construction periods are considered in evaluation.
Ignores Includes
Nonmotorized Travel Impacts
Accessibility, convenience, safety, comfort and cost off walking and cycling.
Ignores Includes
Transportation Diversity
Quantity and quality of travel options (particularly those used by non-drivers) are considered.
Limited analysis Comprehensive analysis
Environmental Impacts
Impacts on air, noise and water pollution; greenspace preservation and community livability.
Limited analysis Comprehensive analysis
Impacts on Land Use
The degree to which each option supports or contradicts strategic land use objectives.
Ignores Includes
Equity Impacts The degree to which each option supports or contradicts community equity objectives.
Limited analysis Comprehensive analysis
Safety and Health
How safety and health risks are measured. Per vehicle-mile crash risks
Per-capita health risks
This table summarizes differences between conventional and comprehensive transport evaluation. 8 “Comprehensive Transport Planning,” Online TDM Encyclopedia (www.vtpi.org/tdm/tdm76.htm).
Light Rail Economic Opportunity Study Victoria Transport Policy Institute
25
An important feature of this framework is that it evaluates transport system quality using the principle of accessibility (or just access), that is, people’s ability to reach desired goods, services and destinations (“Evaluating Accessibility,” VTPI, 2002). Accessibility is affected by several factors, including mobility, transport options (the quality of walking, cycling, transit and ridesharing opportunities), mobility substitutes (such as telecommunications and delivery services) and land use patterns (where services and activities are located). This reflects a fundamental shift occurring in the field of transport planning. Until recently, transport system quality was evaluated primarily in terms vehicle traffic. Travel was assumed to mean motor vehicle travel, increased traffic speed and volume was assumed to benefit society, and constraints on vehicle travel were considered harmful. Transport is increasingly evaluated in terms of mobility, that is, the movement of people and goods, and accessibility. In other words, vehicle travel is a subset of mobility, and mobility is a subset of accessibility, the ultimate goal of most transportation. Some transport improvements increase vehicle traffic but reduce other forms of accessibility. For example, highway expansions that increase traffic volumes and speeds tend to reduce the convenience of walking, and therefore transit access. Automobile oriented, urban-fringe development with abundant parking may seem convenient to motorists, but reduces access for non-automobile transportation. This is not to ignore the benefits of mobility and motor vehicle travel, or to suggest that automobile transportation is “bad.” Many trips are best suited to automobile travel. Many jobs are unsuited to telecommuting. Truck travel is essential for goods delivery, and many types of business activity rely on road vehicles. Many personal trips are unsuited to transit travel. Many businesses and households choose, more automobile-dependent locations for a variety of economic and personal reasons. However, motor vehicle travel imposes significant costs on society, and policies and projects that improve automobile accessibility may reduce other forms of accessibility. As a result, all else being equal, policies and projects that improve transportation alternatives, reduce total motor vehicle traffic and result in more efficient land use patterns will provide greater benefits to society than policies and projects that attempt to address transportation problems by continuing to increase roadway capacity. Like any consumer good or activity, mobility experiences declining marginal benefits: although some vehicle travel is very beneficial, beyond an optimal level consumers can benefit from reduced driving. There are indications that consumers often prefer to use alternative modes, provided that they are convenient, fast, comfortable and affordable. Similarly, there are indications that many households would like to live in urban neighborhoods with good walking, cycling and transit access, provided that they are safe, attractive, affordable and offer good quality services. This suggests that policies and programs that improve transit and support efficient land use can provide direct consumer benefits, as well as other economic, social and environmental benefits to society.

Light Rail Economic Opportunity Study Victoria Transport Policy Institute
26
Evaluation The five options are evaluated below based on criteria described below. A spreadsheet containing the analysis calculations is available from the Victoria Transport Policy Institute (www.vtpi.org).
Project Costs and Revenues This includes all incremental capital and operating costs of providing new facilities and services, including facilities, stations, transit vehicles and operating subsidies. These costs may be partly offset if a particular transit project substitutes for other public expenditures that would otherwise be made (such as if LRT substitutes for bus service), or if it increases revenues. The table below summarizes the assumptions used in this evaluation. Table 8 Summary of Project Costs and Revenues (millions)
Highway BUS/HOV Road Pricing
LRT LRT Plus
Capital costs $300.0 $325.0 $20.0 $350.0 $375.0Annualized capital costs (20 yrs, 7%) $28.3 $30.7 $1.9 $33.0 $35.4Annual operating expense $5.0 $7.0 $1.0 $12.0 $12.0Additional annual revenue $0.0 $3.2 $2.2 $6.4 $11.1
Consumer Accessibility and Mobility Benefits This refers to user benefits from increased accessibility and mobility provided by transport improvements. In particular, increased travel capacity on this corridor allows more people to live on the Western Shore and travel to jobs, schools and services in the Metropolitan Core. Transit and HOV have the greatest potential capacity (i.e., with enough trains or buses the transit options described here could carry many thousand more people than an additional general purpose highway lane) and so can provide greater total mobility benefits if there is sufficient demand. However, if transit fails to attract riders it may provide little mobility benefit, regardless of potential capacity. Highway and HOV facilities would provide the greatest increase in total regional mobility (measured in passenger-kilometres), followed by LRT and LRT Plus, while road pricing would probably reduce regional mobility. LRT Plus is predicted to cause the greatest increase in accessibility (the ability to reach desired goods and activities), followed by LRT and Bus/HOV. The Highway option is predicted to reduce overall accessibility by encouraging more dispersed land use patterns. Pricing reduces mobility, but has mixed effects on accessibility, since it improves alternative modes. Table 9 Summary of Accessibility and Mobility Benefits
Highway Bus/ HOV
Road Pricing
LRT LRT Plus
Improved regional mobility +3 +3 -1 +2 +2 Improved regional accessibility -1 +2 0 +2 +3 Rating from 3 (very beneficial) to –3 (very harmful). A 0 indicates no impact or mixed impacts.

Light Rail Economic Opportunity Study Victoria Transport Policy Institute
27
Vehicle Cost Savings (“Vehicle Costs,” VTPI, 2002) This includes vehicle ownership and operating cost savings. Operating costs (fuel, oil and tire wear) average about 10¢ per vehicle-kilometre. Increased annual mileage increases the frequency of vehicle maintenance and repairs, reduces vehicle operating life and resale value, and increases the risks of crashes, traffic citations and parking fines. These long-term mileage-related costs typically average 10-15¢ per kilometre. As a result, reduced driving provides total savings average 20-25¢ per vehicle-kilometre. Highway capacity expansion that reduces extreme congestion (i.e. roadway Level of Service F, extreme congestion) provides vehicle cost savings, but smaller congestion reductions (level of service D or C, i.e.) provide little or no vehicle cost savings. Consumers can gain additional savings if transit allows a household to reduce its vehicle ownership. For example, if improved transit commuting services allow 10% of users to reduce their household vehicle ownership by one car, the savings average $300 annually per user (assuming a second car has $3,000 annual ownership costs), averaging 6¢ per passenger-kilometre of transit travel (assuming an average of 20 kms of transit travel a day, 250 days per year). If transit is a catalyst for more efficient land use, it can provide additional vehicle cost savings. Table 10 Vehicle Cost Savings Summary (Average Annual Values)9
Highway Bus/ HOV
Road Pricing
LRT LRT Plus
Direct Vehicle Operating Costs $37,875,838 $159,246,347 $63,698,539 $159,246,347 $238,869,520Direct Vehicle Ownership Cost $0 $38,219,123 $15,287,649 $38,219,123 $57,328,685Indirect Vehicle Operating Cost -$10,815,948 $151,156,344 $30,293,592 $263,026,651 $394,539,977Indirect Vehicle Ownership Cost -$5,191,655 $36,277,523 $7,270,462 $63,126,396 $94,689,594
Totals $21,868,235 $384,899,337 $25,830,242 $523,618,518 $785,427,776
Chauffeuring Transit improvements can reduce the need for drivers to chauffeur non-driving family and friends to medical appointments, school, work, and other activities. This can be particularly beneficial because some chauffeured trips involve a round-trip automobile trip. For example, chauffeuring a family member 5-kilometres to work may require a driver to making two 10-kilometre round trips each day. Since transit service already exists on this corridor, these options are unlikely to reduce a large number of chauffeured automobile travel. However, if transit provides a catalyst for more accessible land use patterns, larger reductions in chauffeured trips may occur. Table 11 Summary of Reduced Chauffeuring Cost Savings
Highway Bus/ HOV
Road Pricing
LRT LRT Plus
Chauffeuring Cost Savings 0 1 1 1 3 Rating from 3 (very beneficial) to –3 (very harmful). A 0 indicates no impact or mixed impacts.
9 Averaged over a 20-year period.

Light Rail Economic Opportunity Study Victoria Transport Policy Institute
28
Traffic Congestion (“Congestion Costs,” Litman, 2002) All options reduce traffic congestion on the corridor. When a road is congested, even small reductions in traffic volumes can significantly increase traffic speeds. For example, reducing traffic volumes on a highway lane from 2,000 to 1,800 vehicles per hour (i.e., LOS F to LOS E) will typically increase traffic speeds by 20 kilometers per hour or more, and eliminate stop-and-go conditions. A reduction of 200 vehicles per hour can provide even greater delay reductions on congested surface streets. Table 12 LOS, Capacity and Speed Relationships (Litman, 2002, Table 5.5-1)
Level of Service (LOS)
Capacity veh./hour/lane
Speed M/h (km/h)
A Under 700 Over 60 (100) B 700-1,100 57-60 (95-100) C 1,100-1,550 54-57 (90-95) D 1,550-1,850 46-54 (77-90) E 1,850-2,000 30-46 (50-77) F Unstable Under 30 (50)
When traffic volumes approach a road’s capacity, a reduction of just 200 vehicles per hour can raise LOS ratings and increase traffic speeds by 20 kilometres per hour or more. Urban traffic congestion tends to maintain equilibrium. If congestion increases, people change destinations, routes, travel time and modes to avoid delays, and if it declines they take additional peak-period trips. Reducing this point of equilibrium is the only way to reduce congestion over the long term. The quality of travel alternatives (including speed, comfort and price) can affect this point of congestion equilibrium. If transit and rideshare options are inferior, few travelers will shift mode and the level of equilibrium will be relatively high. If there are good travel alternatives, travelers are more likely to shift modes, resulting in a lower equilibrium. Although congestion is never eliminated, it will never get as bad as it would if competitive transit were not available. Highway capacity expansion reduces congestion in the short term, but this benefit tends to decline over the long run due to induced travel. This induced travel increases downstream traffic congestion. Induced vehicle trips are assumed to average 2 kilometres of “downstream” travel on urban roadways. Bus/HOV and LRT options reduce congestion delays to the people who use these modes and to motorists on parallel roadways, rewarding people who use space-efficient modes with reduced congestion delay. Road Pricing reduces highway congestion, although it can cause spillover congestion on parallel roadways. These options also reduce traffic discharged onto surface streets, providing “downstream” congestion reduction benefits. Rail transit can cause traffic delays at at-grade rail crossings and where tracks are on mixed right-of-way. Park & Ride transit trips add vehicle congestion on surface streets at the origin but not the destination.

Light Rail Economic Opportunity Study Victoria Transport Policy Institute
29
The highway capacity expansion option would increase road traffic volumes. Transit options and road pricing would reduce traffic volumes on surface streets in the Victoria area and Western Shores, improving pedestrian and cycling conditions. The most practical approach to measuring congestion is to assign a congestion cost to vehicle travel under congested conditions, and therefore a savings for traffic reductions. This is typically estimated at 10-20¢ per urban-peak vehicle-kilometre, and even more under highly congested conditions. A value of 25¢ per peak-period automobile-kilometre reduced is used in this analysis, reflecting the relatively high level of congestion on this corridor. Table 13 Traffic Congestion Benefits (Average Annual Values)10
Highway Bus/HOV Road Pricing LRT LRT Plus Direct benefits $75,751,676 $127,397,077 $63,698,539 $21,232,846 $31,849,269Indirect benefits -$18,066,240 $120,925,075 $30,293,592 $35,070,220 $52,605,330
Totals $57,685,436 $248,322,153 $93,992,131 $56,303,066 $84,454,600
Parking Cost Savings (“Parking Costs,” Litman, 2002) Most automobile trips require parking spaces at its destination, a cost that is reduced or avoided by trips made by transit and ridesharing. A typical urban parking space has a total cost of $50-100 per month, and more for structured or underground parking facilities. This analysis uses an average parking cost value of $2.00 per day, or $1.00 per one-way trip, although average cost savings would be higher in major commercial centers such as downtown Victoria, hospitals and university campuses. Reduced parking demand benefits users (where parking is priced), businesses (from reduced parking costs), local governments (from reduced parking problems and subsidies), and other motorists (from reduced parking congestion). Parking To the degree that transportation improvements reduce automobile trips, they reduce parking costs. Reductions in vehicle ownership provide additional parking cost savings, for example, at residences. To the degree that the Highway option increases total vehicle trips and vehicle ownership, it tends to increase total parking costs. Table 14 Parking Cost Savings (Average Annual Values)
Highway Bus/HOV Road Pricing
LRT LRT Plus
Direct parking costs -$20,200,447 $6,912,516 $4,072,056 $26,204,889 $15,553,162Indirect parking costs -$5,768,505 $10,077,090 $4,039,146 $61,320,977 $157,815,991
Totals -$25,968,952 $16,989,606 $8,111,201 $87,525,866 $173,369,153
10 “Direct benefits” refers to benefits from travel shifted from automobile to transit. “Indirect benefits” includes benefits that result when transit improvements provide a catalyst for more efficient land use which reduces per capita vehicle travel, or conversely, if highway capacity expansion leverages increased sprawl which increases per capita vehicle travel.

Light Rail Economic Opportunity Study Victoria Transport Policy Institute
30
Safety, Security and Health (Safety and Health Impacts,” Litman, 2002) Shifts from automobile to transit travel can affect safety, health and security in several ways. These issues are discussed below.
Traffic Safety (Reduced Crashes) Public transit is a relatively safe form of travel. Transit passengers have about one-tenth the risk of a crash injury per passenger-kilometre as automobile occupants. As mentioned earlier, transit use can leverage additional reductions in automobile travel. People usually increase their total mobility when they travel by automobile. As a result, the total safety benefits of mode shifting may be far greater than a simple mile-for-mile comparison would indicate. Per capita traffic deaths tend to be lower in more transit-oriented urban areas (Newman and Kenworthy, 1999, p. 118).
Health Impacts (Increased Physical Activity) Inadequate physical activity is a major contributor to cardiovascular disease, diabetes, hypertension, obesity, osteoporosis and some cancers, which contribute to more than 10% of all deaths. Even modest increases in physical fitness can provide significant health benefits. Many health experts believe that increased walking and cycling is one of the most practical ways to increase community health and fitness. Transit and active transportation are complementary. Most transit trips involve walking or cycling links, and transit riders often walk rather than drive for local errands. Efforts to encourage transit and create transit-oriented development often increase pedestrian and cycling, which can increase fitness and health (Frank and Engelke, 2000).
Personal Security Transit travel is sometimes considered to reduce personal security (i.e., increase risk of physical assault or theft), for passengers. Although these risks may sometimes be real, they do not necessarily represent an increase in total risks, since motorists also face personal security risks, such as “road rage” and car thefts. These risks can be reduced by programs to improve security for transit users. Increased transit ridership tends to increase overall security, because pedestrian facilities and transit waiting areas tend to be self-patrolling (fellow transit riders discourage and report crimes), and increased ridership can justify more safety programs.
In this analysis, automobile trips shifted to public transit (both bus and rail) are estimated to provide net safety and health benefits of 5¢ per passenger-kilometre. Personal security risks are assumed to be approximately the same for all modes. Table 15 Safety, Security and Health Benefits (Average Annual Values)
Highway Bus/HOV Road Pricing LRT LRT Plus Direct health and safety -$12,201,775 $31,849,269 $12,739,708 $31,849,269 $47,773,904Indirect health and safety -$3,802,363 $30,231,269 $6,058,718 $52,605,330 $78,907,995
Totals -$16,004,138 $62,080,538 $18,798,426 $84,454,600 $126,681,899

Light Rail Economic Opportunity Study Victoria Transport Policy Institute
31
Roadway Cost Savings (“Roadway Costs” Litman, 2002) Roadway costs include the costs of building and maintaining public roads, and providing related services such as traffic planning, policing, emergency response and lighting. Numerous “cost allocation” studies have investigated the share of roadway costs imposed by various types of vehicles. This information can be used to compare roadway costs for various modes and calculate the net savings that can result from a shift from automobile to transit. Larger and faster vehicles require more road space, and heavier vehicles impose more road surface wear. Shifts from automobile to bus tend to increase road maintenance costs (since heavy vehicles cause more road wear than lighter vehicles), but reduce the need to increase roadway capacity (a long-term result of the traffic congestion reduction benefits described earlier), so no savings are project for Bus/HOV and Road Pricing (since they increase bus travel). LRT systems may impose roadway costs by increasing maintenance requirements where tracks cross or are located in the roadway. Automobile use imposes roadway costs estimated to average about 3-5¢ per vehicle kilometre, with higher costs in congested urban areas. Fuel taxes average about 30¢ per litre, of which 10¢ can be considered general taxes (i.e., equal to 14.5% GST and PST), and about 20¢ a litre can be considered a roadway user fee. This averages about 2¢ per kilometre, about half of total roadway costs. Local roadway costs are locally funded, so from the perspective of a local government, reduced automobile travel provides the full, 3-5¢ per vehicle-kilometre roadway cost savings. Table 16 Roadway Cost Savings (Average Annual Values)
Highway Bus/HOV Road Pricing
LRT LRT Plus
Direct roadway cost savings -$6,060,134 $0 $0 $12,739,708 $19,109,562Indirect roadway cost savings -$1,520,945 $0 $0 $21,042,132 $31,563,198
Totals -$7,581,079 $0 $0 $33,781,840 $50,672,760

Light Rail Economic Opportunity Study Victoria Transport Policy Institute
32
Environmental Impacts Energy consumption and pollution emissions of the different options are described below. Transit improvements that reduce transit delays (such as HOV lanes and transit priority measures) and incentives that increase average load factors (such as commute trip reduction programs) can provide greater energy savings and emission reductions. Transit improvements that provide a catalyst for more efficient land use patterns and reduced per capita vehicle ownership provide additional environmental benefits.
Energy Consumption (“Resource Externalities,” Litman, 2002) A fully-loaded bus uses less than one-tenth the energy per passenger-mile as a typical automobile, and LRT can be even more energy efficient. Actual energy savings are smaller because transit vehicles usually carry partial loads. In the U.S., buses consume about two-thirds the energy, and electric rail about a sixth of the energy per passenger-kilometer as an average automobile. Energy savings are probably greater on this route due to higher load factors (Shapiro, Hassett and Arnold, 2002).
Air Pollution (“Air Pollution Costs,” Litman, 2002) A loaded diesel bus produces significantly lower emissions of most air pollutants than an automobile, and even with average load levels all emissions except NOx decline significantly. The air emissions from electric rail systems depend on the marginal source of electricity they use, which is hydro and natural gas in this region. Diesel buses emit CO, particulates and air toxics that cause local health problems. Because urban air quality in this region is better than average, NOx and VOC emission impose relatively low costs. Greenhouse gases have negative impacts regardless of where they are emitted.
Noise Pollution (“Noise Pollution Costs,” Litman, 2002) Traffic noise and vibration are moderate to large costs in urban areas. Buses tend to produce more noise than lighter vehicles because of their relatively large engines and low power to weight ratio, although if some bus riders would otherwise drive a noisy vehicle (such as a motorcycle or car with a faulty muffler) it can reduce overall traffic noise. Light rail is quieter than a diesel bus, but still causes noise and vibration.
Water Pollution (“Water Pollution Costs,” Litman, 2002) Motor vehicle ownership and use contributes to water pollution due to leaks from engines and brake systems, fuel distribution, and waste fluids (such as used crankcase oil) improperly disposed of. Transit tends to produce less water pollution because it uses fewer vehicles and has higher maintenance standards than many private vehicles.
Because this region has minimal air quality problems, a relatively low value of 1¢ per passenger-kilometre shifted from driving to bus transit, and 2¢ per passenger-kilometer shifted to LRT or eliminated altogether, are used for this analysis. Higher values may be justified to account for other environmental impacts, such as climate change emissions and resource depletion.

Light Rail Economic Opportunity Study Victoria Transport Policy Institute
33
Table 17 Energy and Emission Reduction Benefits (Average Annual Values)
Highway Bus/HOV Road Pricing
LRT LRT Plus
Direct emission reductions -$3,030,067 $12,739,708 $5,095,883 $12,739,708 $19,109,562Indirect emission reductions -$760,473 $12,092,508 $2,423,487 $21,042,132 $31,563,198
Totals -$3,790,540 $24,832,215 $7,519,370 $33,781,840 $50,672,760
Travel Time Impacts (“Travel Time Costs,” Litman, 2002) Travel time costs are a component of consumer impacts. Research indicates that on average, consumers value time spent on personal travel at 1/4 to 1/2 prevailing wage rates, with higher values for drivers on congested roads and transit users in uncomfortable conditions (e.g., walking or waiting in the rain, standing in a crowded bus or train), and lower rates for transit or rideshare passengers who have a comfortable seat. These travel time cost factors have several implications for evaluating transportation improvements: • Strategies that reduce traffic congestion, or give travelers an attractive travel alternative to
driving on congested roads, can reduce travel time costs. • Strategies that increase travel speeds and reliability, rider comfort, security or access (for
example by making it easier to walk or cycle to transit stops) reduce travel time costs. • Travelers who voluntarily shift from driving to other modes in response to transit
improvements or positive incentives (such as financial benefits to transit users) can be assumed to experience net benefits, even if their travel speeds decline.
Conventional transportation models are generally not very sensitive to these qualitative factors, and therefore tend to undervalue improvements to rider comfort and convenience. Some models incorrectly assume that any shift from automobile to transit increases travel time costs, even if travelers voluntarily choose to make this shift. The LRT, Bus/HOV and Road Pricing options considered here all improve transit travel speeds and therefore reduce transit users travel time costs. The Bus/HOV option would also improve travel times for carpoolers and vanpoolers, and the Road Pricing option would improve travel speeds for all highway traffic, although some people priced out of their automobiles may experience increased total travel times. The Highway option would improve travel speeds for all road users, including transit passengers, but this is likely to be modest and temporary, since congestion would likely return within a few years.

Light Rail Economic Opportunity Study Victoria Transport Policy Institute
34
Impacts on Regional Transportation and Land Use Objectives (“Land Use Impacts,” Litman, 2002) Transportation decisions can significantly affect land use, which can have a variety of economic, social and environmental impacts. The proposed Regional Growth Strategy includes goals and objectives to encourage clustering, land use mix and greenspace preservation, and reduce sprawl. Specific land use impacts are discussed below.
Direct Land Use Impacts This refers to the amount of land used for transport facilities. Electronic Road Pricing requires no additional roadway land. The LRT option primarily uses existing public right-of-way, much of which is currently used for trails or roads. It requires less additional pavement than the Highway or Bus/HOV options, since part of the LRT right of way can be left as greenspace or shared with nonmotorized vehicles. By reducing automobile trips, LRT, Bus/HOV and Road Pricing options can reduce the amount of land required for parking, particularly if users walk or cycle to transit stops. Park & Ride facilities substitute for parking at destinations.
Indirect Impacts Indirect land use impacts include changes in development patterns that affect land use accessibility, clustering, mix, preservation of cultural and ecological resources, and community livability. Increase travel capacity between Victoria and the Western Shore is likely to stimulate additional sprawl. Options that encourage transit-oriented development can reduce sprawl. The Highway option is likely to increase sprawl the most, because it increases traffic capacity and provides no incentive for transit use. Bus/HOV and Road Pricing options may also increase sprawl unless implemented in conjunction with other strategies that encourage transit use and clustered development. Conventional diesel buses can discourage clustering and reduce urban center livability due to air and noise pollution. The LRT option tends to provide a catalyst for more efficient land use patterns. LRT stations can stimulate transit-oriented, mixed-use, walkable centers. Compared with diesel buses or automobiles, electric rail creates more attractive urban centers by reducing traffic, air pollution and noise. As a result, it can do more to achieve strategic land use objectives, although this requires other supportive transportation and land use policies. LRT Plus assumes that transit has significant land use impacts.
Table 18 Summary of Regional Objectives Highway Bus/HOV Road
Pricing LRT LRT
Plus Direct impact - facility land requirements -3 -2 0 -1 0 Indirect impact – reduced sprawl -3 0 -1 2 3 Rating from 3 (very beneficial) to –3 (very harmful). A 0 indicates no impact or mixed impacts.

Light Rail Economic Opportunity Study Victoria Transport Policy Institute
35
Economic Development Impacts (“Economic Development,” VTPI, 2002) Economic development refers to productivity, employment and business activity in an area. Some specific economic development impacts associated with public transit are discussed below.
Direct Project Expenditures This refers to the jobs and business activity created directly by project expenditures. The LRT, Highway and Bus/HOV options all create about the same number of construction jobs and business activity. The Road Pricing option involves smaller capital expenditures and so creates few jobs. The net employment impacts depend on the source of the funding. If a significant portion of project funding is generated from outside this region it can be considered to increase regional employment and business activity here, but if funding is raised within the region, it can only be considered to increase employment and business activity if this type of expenditure has relatively high economic multipliers. Major construction projects such as roads and rails produce relatively few regional jobs per dollar compared with other types of public or consumer expenditures, so net employment generation is relatively small. Consumer Expenditure Shift This refers to changes in consumer expenditures “leveraged” by a project. Consumer expenditures on automobile travel (particularly on fuel) tend to provide relatively little regional employment and business activity, while transit is a labor-intensive activity. Automobile expenditures provide about one third, and petroleum about a fifth of the jobs per dollar spent as transit expenditures, as indicated in the table below. To the degree that the LRT, Bus/HOV and Road Pricing options reduce consumer expenditures on fuel, they will tend to increase overall employment and business activity in this region.
Table 19 Jobs Created in BC by Transportation Expenditures
$1 Million Expenditure On Full Time Jobs Created Petroleum 4.5 General Automobile Expenses 7.5 Public Transit 21.4
This table shows economic impacts of transportation expenditures in British Columbia. (B.C. Input/Output Table, British Columbia Treasury Board, Victoria, 1996)
Cost Savings and Productivity A transport program that increases efficiency or reduces congestion, road and parking costs, vehicle costs or crashes can improve productivity and economic development. The Road Pricing option best reflects economic efficiency principles, and so should provides the greatest productivity benefits. Bus/HOV and LRT also tend to increase efficiency and reduce numerous costs. The Highway option reduces congestion but increases other costs and so appears to provide the least productivity benefit.

Light Rail Economic Opportunity Study Victoria Transport Policy Institute
36
Efficient Land Use Transit-oriented land use patterns can increase local property values due to improved accessibility, agglomeration efficiencies (productivity gains due to more clustered, accessible land use), and local environmental quality benefits. This is particularly important for business activities that require frequent face-to-face interaction, such as public and corporate planning, retail sales, education, and many types of creative professions. This is why certain activities tend to cluster in commercial centers. In addition, a significant portion of downtown Victoria’s attraction as a tourist destination is its relatively pedestrian-friendly environment. Valuation studies typically find that residential properties are worth 5-10% more, and commercial properties 10-20% more when located within 500 metres of a rail station. The added tax revenue could offset a significant portion of LRT investment costs (Smith, 2001). To the degree that transit improvements support clustering in downtown Langford and Victoria, and at stops along the route (such as the Mayfair Mall and Town and Country shopping center), and helps preserve the pedestrian-friendly character of these areas, they can help increase regional economic development. The LRT option is most effective at this objective because transit stations can provide a centralizing influence. Bus/HOV or Road Pricing options may also encourage more transit-oriented development if supported by suitable land use and transportation policies.
Tourism and Community Identity A unique transit service can be a popular tourist activity, help create community identity, and provide a catalyst for urban redevelopment. This can be particularly effective in Victoria, which attracts visitors from around the world with high urban amenity values. The article on the next page describes how rail transit has helped encourage economic development in one community. Similar results are possible in this region from a suitable transit service. Of the five options, LRT is the only one likely to have this effect. Additional highway lanes or Bus/HOV facilities are not unique, and road pricing is only likely to attract an occasional convention of transport economists, not a large tourist market. A busway can accommodate novelty vehicles, such as buses styled to look like heritage trolleys, but their effect would probably be small. This corridor is likely to be receptive to these benefits, for the following reasons:
• Tourism is a major regional industry, and there is growing interest in “eco-tourist” activities, including hiking, cycling and camping. Many tourists may appreciate opportunities to visit Western Shore communities.
• Downtown Victoria is pedestrian oriented, and many tourists arrive without a car. A unique transit system could expand the range of activities available to tourists.
• Downtown Victoria and James Bay harbour frontages are currently experiencing major redevelopment (including a possible new multiplex and art centers) and residential infill. Transit service improvements support this trend.

Light Rail Economic Opportunity Study Victoria Transport Policy Institute
37
• Western Shore communities are experiencing commercial and residential growth and are seeking opportunities to attract tourists. Downtown Langford in particular is being redeveloped as a pedestrian-oriented center. A major transit center could provide a catalyst for this type of development.
Figure 5 Rail Transit Economic Development Impacts
This article describes how a downtown trolley became a popular tourist activity and a catalyst for downtown redevelopment in Memphis. (Metro Magazine, May 2002, p. 32)
Table 20 Summary of Economic Development Benefits
Highway Bus/HOV Road Pricing
LRT LRT Plus
Direct Project Expenditures 3 3 1 3 3 Consumer Expenditure Shift -3 1 1 2 3 Cost Savings and Productivity -1 2 3 1 3 Land Use Efficiency -3 2 2 2 3 Tourism and Community Redevelopment 0 0 0 2 3

Light Rail Economic Opportunity Study Victoria Transport Policy Institute
38
Equity, Affordability and Livability (“Equity Evaluation,” VTPI, 2002) Transit improvements can support community equity, affordability and livability objectives by increasing accessibility, improving affordable travel options, reducing neighborhood travel impacts, encouraging community interaction and pride. LRT and Bus/HOV options improve mobility for non-drivers. Bus/HOV provides access to a greater range of destinations that Basic LRT. LRT Plus improves land use accessibility by creating multi-modal centers where activities are clustered. Basic LRT and Bus/HOV increase affordability by improving transit service to some destinations, which may allow some households to reduce their vehicle ownership. LRT Plus can reduce both transport and housing costs by improving access and creating more flexible parking requirements. LRT Plus also provides the greatest community livability benefits, due to minimal noise and its ability to be a catalyst for more pedestrian-oriented development. Increased highway capacity tends to reduce community livability by increasing traffic volumes. Table 21 Summary of Livability Impacts
Highway Bus/HOV Road Pricing
LRT LRT Plus
Mobility for nondrivers 0 3 1 2 3 Affordability 1 2 -2 1 3 Livability -2 -1 0 2 3
Community Support and Political Feasibility A final issue of consideration is the degree of community support for these options and their political feasibility (including, for example, ability to be funded by other levels of government. There is little qualitative research on these issues, so the following is highly speculative, and will be modified as additional information becomes available. LRT has generally received community and political support. It is difficult to determine how the additional features of the LRT Plus option would affect this support. Some Western Shore residents have opposed land use reforms imposed by external agencies, but they may support these policies as part of downtown Langford redevelopment. Highways and road pricing are likely to be more controversial within the community, although provincial agencies are likely to provide planning support and funding. Road pricing tends to be highly controversial and politically difficult. Table 22 Summary of Community Support and Political Feasibility
Highway Bus/HOV Road Pricing
LRT LRT Plus
Community support -2 -1 -3 3 3 Political feasibility 1 2 -2 2 2

Light Rail Economic Opportunity Study Victoria Transport Policy Institute
39
Analysis Summaries For this study we develop a spreadsheet model to calculate the net present value (NPV) of the five options.11 Table 23 summarizes the results. Figure 6 illustrates the net present value ratings. Based on the impacts that are quantified in this study, the Bus/HOV, Road Pricing and LRT options provide significant net benefits. LRT Plus, which includes additional features to improve accessibility and increase transit ridership, provides the greatest net benefits. The Highway option provides negative benefits (costs exceed benefits) because congestion reduction and vehicle cost savings benefits are more than offset by increases in other costs such as parking demand and downstream congestion. Road Pricing option has the highest benefit/cost ratio, since its project costs are minimal. Table 23 Benefit-Cost Analysis Summary (Millions)
Highway Bus/HOV Road Pricing LRT LRT Plus Total Costs -$372 -$421 -$32 -$503 -$530Direct Benefits $95 $376 $255 $302 $430Indirect Benefits -$25 $361 $80 $517 $842
Net Benefits -$302 $316 $303 $316 $742Benefit/Cost Ratio 0.2 1.8 10.4 1.6 2.4
This table summarizes key values used in the spreadsheet analysis. This shows total estimated benefits and costs over a 20-year period. These results are consistent with other studies that compare the full benefits of public transit investments with highway capacity expansion (HLB, 2002). Figure 6 Quantitative Analysis (20-year totals)
($400)
($200)
$0
$200
$400
$600
$800
Highway Bus/HOV Road Pricing LRT LRT Plus
Net
Pre
sent
Val
ues
(mill
ions
)
This figure illustrates the net benefits (benefits minus costs) of the five options. The Highway option has negative net value because it increases total vehicle traffic, increasing costs such as parking demand, downstream congestion and crashes, which more than offsets its benefits from reduced highway congestion and vehicle operating costs.
11 This spreadsheet is available for review from the Victoria Transport Policy Institute (www.vtpi.org).

Light Rail Economic Opportunity Study Victoria Transport Policy Institute
40
Table 24 Qualitative Analysis Summary
Highway Bus/HOV Road Pricing LRT LRT Plus Improved mobility 3 3 -1 2 2 Improved accessibility -1 2 0 2 3 Chauffeuring cost savings 0 1 1 1 3 Facility land requirements -3 -2 0 -1 0 Reduced Sprawl -3 0 -1 2 3 Direct project expenditures 3 3 1 3 3 Consumer expenditure shift -3 1 1 2 3 Cost savings and productivity -1 2 3 1 3 Land use efficiency -3 2 2 2 3 Tourism and redevelopment 0 0 0 2 3 Mobility for nondrivers 0 3 1 2 3 Affordability 1 2 -2 1 3 Livability -2 -1 0 2 3 Community support -2 -1 -3 3 3 Political feasibility 1 2 -2 2 2
Totals -10 17 0 26 40 Table 24 summarizes the qualitative analysis, based on rating each option according to various criteria. The approach ranks LRT Plus highest, followed by basic LRT, HOV, Road Pricing and Highway options. Figure 7 illustrates the totals of these ratings. Figure 7 Qualitative Analysis
-20
-10
0
10
20
30
40
50
Highway Bus/HOV Road Pricing LRT LRT Plus
Rat
ing
Tota
ls
This figure illustrates qualitative objective rating totals for the five options. The Highway option has a negative rating overall because it contradicts many strategic planning objectives related to economic development, land use, social objectives and environmental quality.

Light Rail Economic Opportunity Study Victoria Transport Policy Institute
41
Sensitivity Analysis Several factors that may affect the accuracy of this analysis are described in this section.
Project Construction and Operating Costs Any of the options could turn out to be more expensive than assumed in this analysis. For example, the Trans-Canada Highway capacity expansion along this corridor ended up costing about 20% more than originally projected, and some rail systems have had cost overruns. A significant cost overrun will reduce the project net benefits. For sensitivity analysis we tested a 20% project construction cost overrun.
Predicted Travel Changes The analysis is based on predicted travel changes, including reductions in automobile travel from the transit and pricing options, and induced travel from the Highway option. If the transit demand is lower than expected, benefits would be smaller. For sensitivity analysis we tested a 33% lower projected transit ridership.
Travel and Land Use Leverage Another significant factor is the assumption that transit leverages additional automobile travel reductions by changing land use and transport patterns. These provide additional benefits, including reductions in downstream congestion, parking costs, crashes and environmental impacts.
Monetized Values Economic analysis results are also sensitive to the monetized values assigned to benefits. For sensitivity analysis we tested using 50% of the standard monetized values assigned to congestion reduction, parking cost savings and emission reduction benefits. Table 25 summarizes the results of this sensitivity analysis. These alternative assumptions result in lower benefit/cost ratios and lower net benefit estimates, but these changes generally do not affect the ranking of options. Even with pessimistic assumptions, the LRT, LRT Plus, Bus/HOV and Road Pricing options have ratios significantly higher than 1.0, and the Highway option has ratios less than 1.0. Table 25 Benefit-Cost Ratio Sensitivity Analysis Summary
Highway Bus/HOV Road Pricing LRT LRT Plus Standard analysis 0.2 1.8 10.4 1.6 2.4 20% Cost overrun 0.2 1.5 9.2 1.4 2.1 33% lower transit ridership 0.2 1.2 7.0 1.1 1.6 50% smaller travel leverage factor 0.2 1.3 9.2 1.1 1.6 50% smaller benefit values 0.1 0.9 6.6 0.8 1.2 This table summarizes results of sensitivity analysis, in which various factors were varied.

Light Rail Economic Opportunity Study Victoria Transport Policy Institute
42
Factors Affecting Rail Ridership Some experts claim that rail transit requires a city that exceeds a certain population, typically estimated between 500,000 and one million residents. This would indicate that the Victoria region is too small for rail. However, this assumption is not necessarily true. The important factor is transit ridership demand on a particular corridor, not regional population. This is affected by population density, employment density, geographic conditions, development patterns, demographics, and ridership incentives. All of these tend to be favorable to rail transit in this corridor. • Much of the regional population is concentrated along this corridor, which has some of the
heaviest travel demand in the region, and various geographic factors constrain the sort of urban dispersion that occurs in most North American cities.
• Much of the regional employment and tourist activity is clustered along this corridor.
Downtown Victoria is an established employment and tourist center, and Langford is working to attract business to its downtown.
• The proposed Regional Growth Strategies includes goals, strategies and targets to create
multi-modal, transit-oriented land use patterns. • The Victoria region has demographic patterns, including a high portion of students and
seniors, which tend to favor transit more than other groups. This is one of the reasons that this region has significantly higher per capita transit ridership, and a higher rate of downtown transit commuting, than most other Canadian cities of comparable size.
• Transportation management strategies described above can significantly increase transit
ridership, and tend to be most effective when implemented in conjunction with high-quality transit services, such as the LRT option considered here. These strategies increase transit ridership for a given population. Strategies such as Parking Cash Out, transit oriented development and fare discounts can individually double transit trips among people affected, for example, increasing the portion of transit commuters in an area from 10% to 20%.
These factors effectively reduce the minimum population needed for rail transit. For example, if it is true that an average North American city needs one million residents to justify rail, then a city with 38% higher-than-average per capita transit ridership only needs 620,000 residents, and if rail transit can be implemented in conjunction with incentives that doubles transit commuting rates by employees and students on that corridor, the minimum declines to 310,000, in which case this region already qualifies. Experience in other cities also indicates that our region may already qualify for rail transit. The cities of St Louis, Pittsburgh, Kassel, Graz, Orleans and Grenoble have populations equal or smaller than this region. Calgary and Edmonton first established their rail systems when their populations were little larger than Victoria’s is now.

Light Rail Economic Opportunity Study Victoria Transport Policy Institute
43
Opportunities For Maximizing Benefits There is much more to creating a successful and cost effective transportation system than simply building facilities. A particular transit project may be considered ineffective and wasteful if it only attracts 1,000 riders per day, but successful and worthwhile if it attracts 2,000 riders per day. Transit tends to experience economies of scale: increased ridership reduces unit costs, making the system more cost effective, reducing per-trip costs, increasing total benefits and justifying support for further transit improvements. Since many of transit benefits result from reduced automobile travel, benefits increase as transit service becomes more attractive to discretionary riders (people who have the option of driving). Several policies and programs can increase transit ridership and operating efficiency (IBI, 2001; “Transit Improvements, VTPI, 2002; Lodden, 2002). These are often justified on various economic, social and environmental grounds. For example, commute trip reduction programs and parking management can often pay for themselves in parking cost savings, and strategies such as parking cash out are justified on equity grounds. In the past, most transit investment studies have ignored these strategies. They basically asked, “How many people would ride transit if current policies that favor automobile commuting are unchanged?” The results frequently indicated relatively low ridership. However, several strategies can help support transit use. If fully implemented to the degree that these strategies are justified they could significantly increase transit ridership, increasing total benefits from transit options. These strategies are described briefly below, and in greater detail in CIT (2001), VTPI (2002), and various publications available from the U.S. Federal Transit Administration.
Transit-Oriented Development Policies (“Transit Oriented Development,” VTPI, 2002) Transit Oriented Development (also called Smart Growth and New Urbanism) means that land use policies encourage clustered, mixed-use, infill development with good pedestrian access along transit routes. This can be achieved in various ways, including correcting any existing public policies and practices that encourage more dispersed development, reward desired development practices, target public investments in transit-oriented areas, and educate developers and designers concerning desired design practices. People who live or work in such areas tend to drive less and use transit significantly more than those who live and work in more automobile dependent areas. Even relatively modest changes (such as clustering the multi-family housing that would be built in the region into urban villages along transit routes, and encouraging large employers to locate within existing commercial centers) can double or triple transit ridership and reduce automobile trips by 10-20% among those people affected.

Light Rail Economic Opportunity Study Victoria Transport Policy Institute
44
Parking Management (“Parking Management,” VTPI, 2002) Parking management includes shared parking, regulating parking facility use (such as duration and vehicle type), unbundling parking (so households renting a home and businesses renting an office or store are not forced to pay for more parking than what they need), Cashing Out free parking (so employees who are offered a free parking space can choose to receive the cash equivalent if they commute by another mode), and charging motorists directly for the parking they use. Parking management reduces the amount of land needed for parking facilities, which allows more infill, clustered development. Transit management can significantly increase transit ridership and help create more pedestrian-friendly, transit-oriented land use patterns.
Commute Trip Reduction Programs (“Commute Trip Reduction,” VTPI, 2002) Commute Trip Reduction (CTR) programs implemented by individual employers or transportation management associations provide a variety of support services and incentives to encourage commuters to use alternative modes. Transit benefits, Parking Cash Out (offering commuters who don’t drive the cash equivalent of any parking subsidies they receive if they drive), guaranteed ride home programs (an occasional free or discounted ride by taxi or company vehicle when needed by a transit or rideshare commuter), flextime and transit promotion are CTR strategies that tend to be particularly effective at supporting transit ridership.
Nonmotorized Improvements (“Nonmotorized Transport Planning,” VTPI, 2002) Most transit trips involve walking or cycling links, so improving non-motorized travel conditions can make transit more convenient. This can include improving sidewalks, paths and crosswalks; bike parking; bikeracks on buses; and encouragement efforts.
Transit Marketing and Price Reforms (“Transit Improvements,” VTPI, 2002) A variety of transit marketing and price reforms have proven useful in attracting new riders, including advertising campaigns, promotions and fare discounts targeting special groups (students, downtown employees, tourists, participants at special events, etc.). Off-peak fare discounts and other strategies to encourage off-peak ridership can make transit service more cost effective.
Non-Commute Trip Promotion Transit is often viewed primarily in terms of commute trips, but in this situation there may also be significant opportunities to encourage transit use for non-commute trips, including tourist and recreational travel, travel to special events, and personal errands such as medical visits and shopping. Each of these requires special planning and marketing. For example, tourist trips require maps and schedule information conveniently available to visitors and the ability to carry baggage. Some communities have been successful promoting rail transit travel to reduce traffic and parking congestion at major sporting and cultural events.

Light Rail Economic Opportunity Study Victoria Transport Policy Institute
45
Evaluating Criticism of LRT (“Evaluating TDM Criticism,” VTPI, 2002)
LRT is not economically justified. The analysis in this report indicates that an LRT system can provide net benefits (total economic benefits exceed total economic costs), and is more cost effective than highway capacity expansion. When transportation improvements are justified on this corridor, some sort of high-quality transit system is probably the best investment.
Bus transit is more cost effective than LRT. LRT has higher direct costs per passenger-kilometre than bus, but provides greater comfort, imposes less environmental impacts, tends to attract more discretionary ridership, and generally has greater political support (meaning that voters are more likely to approve special funding). LRT tends to have a positive impact on land use development patterns, which can provide a variety of additional benefits. Because of these additional benefits, LRT can be more cost effective overall, particularly if supported by suitable transportation and land use policies.
Motorists will not give up their car. Few discretionary travelers will use LRT. The CRD already has relatively high transit ridership compared with similar size cities. However, there is currently little incentive for discretionary riders (people who can drive) to use transit, since buses are delayed by congestion and lack luxury features or prestige. High quality, grade-separated transit tends to lower the point of congestion equilibrium on parallel highways, by providing a competitive alternative to driving that attracts discretionary riders. The resulting shifts from automobile to transit by some travelers benefits both those who shift mode and those who continue to drive. Although congestion is not eliminated, it is far less than what occurs if competitive transit were not available.
The CRD is too small for LRT. As mentioned above, some experts argue that rail transit is only appropriate in cities with more than a half-million residents. The CRD has only about two-thirds of this population threshold. However, regional population is not the real issue. The important factor is whether there is sufficient potential ridership in a particular corridor. Some experts suggest that LRT can be suitable for towns with as few as 100,000 residents if there are distinct travel corridors that can generate 5,000 - 15,000 passengers per hour (Houghton, 1994). Several factors make this corridor particularly suitable for high capacity rail: CRD residents use transit a third more than average for comparable cities, this corridor is already congested and additional roadway expansion would be costly due to geographic constraints, the corridor already contains most major regional facilities, the Regional Growth Strategies includes many objectives and actions to increase transit ridership and support transit oriented development.

Light Rail Economic Opportunity Study Victoria Transport Policy Institute
46
Funding Options Table 26 compares the per capita costs of the five options. Although not insignificant, these costs are modest compared with total personal transportation expenditures. This suggests that such investments can be considered acceptable if they significantly improve regional accessibility and support other community objectives. If consumers willingly spend thousands annually on personal vehicles, they may be willing to spend one or two hundred more on additional public investments to improve transportation. Table 26 Project Costs
Highway Bus/ HOV
Road Pricing
LRT LRT Plus
Annualized capital costs, 20 yr, 7% (million) $28.3 $30.7 $1.9 $33.0 $35.4Annual operating expense (million) $5.0 $7.0 $1.0 $12.0 $12.0Total annual costs (millions) $33.3 $37.7 $2.9 $45.0 $47.4Annual per capita cost $102 $115 $8.90 $138 $145Relative to personal transportation expenditures.12 3.7% 4.2% 0.3% 5.0% 5.3%This table show estimated annualized costs of the five options, including per capita average costs. If CRD residents decide that they are willing to make such an investment, there are a number of possible funding sources, described below. A combination of these may be needed to fund most options.
Federal Infrastructure Grants The federal government occasionally provides grants to local and regional infrastructure improvement projects. Some future federal grant programs may focus on sustainability or urban service projects, which could include transit investments. However, such grants are uncertain, and usually require matching funds.
Provincial Transit Funds The provincial government is traditionally the main funder of transit projects. Just as the province helps fund BC Transit service and SkyTrain improvements, and funded the Trans-Canada Highway, it could fund an LRT system. In the past, provincial funding tended to favor highway projects over transit (some provinces have discontinued funding transit altogether, although this has not occurred in BC), but it may be possible to demonstrate to provincial officials that LRT is a better investment on this corridor.
Local Fuel Tax Victoria and Vancouver already receive a portion of motor vehicle fuel tax revenues collected in this region to fund transit, and it may be possible to increase this, either by transferring a larger share of existing taxes, or through a vote to add an optional fuel tax. This may require provincial legislation and approval by local officials or voters, and so depends on public support.
12 Statistics Canada consumer expenditure survey indicate $6,433 average annual expenditure per household on transportation, and 2.35 average residents per household.

Light Rail Economic Opportunity Study Victoria Transport Policy Institute
47
Local Property Tax Special property tax assessments are a common way to fund for local and regional projects. Such taxes can apply to all property in the region, or just property within a special assessment district, such as within the area directly served by transit (i.e., within a kilometre or so of stations). This would probably require approval by local officials and voters, and so depends on public support.
Value Capture Rail transit service tends to increase nearby land values. Under the right conditions, this increased value can help repay at least part of transit project capital costs (Smith, 2001). Some jurisdictions form partnerships with private companies to maximize development near transit stations, or special taxes can be assessed on land near transit stations based on the increased value.
Visitors Tax A special tax on hotel rooms or vehicle rentals could be used to generate funding. Such taxes, often in the 5-10% range, are common as a way to help fund infrastructure and services for visitors. Victoria currently has a 2% hospitality tax that is used to finance the Victoria Convention Centre and future multiplex. If visitor taxes increase to a level that is considered excessive, they could discourage some tourist activity.
Roadway Fee Road tolls or other vehicle fees can be used to fund transportation improvements. The Road Pricing option considered in this study is designed as a congestion management strategy, and so only applies under congested conditions. As a result, it provides relatively little net revenue. If applied to all vehicle trips on this corridor, rather than just trips during congested period, a $1 toll would raise about $15 million annually in net revenue (assuming 50,000 average daily trips on this corridor).
Parking Tax Special taxes on commercial parking transactions or on parking facilities are used to fund transportation improvements and other special projects in some regions. Fuel tax increases, road tolls and parking taxes are sometimes criticized as an unfair subsidy from motorists to transit users. However, in situations such as this, transit service improvements may be the least cost way to reduce long-term roadway traffic congestion, and so may be a cost effective investment for motorist. Such taxes may also be justified a way to help internalize and offset social costs of driving such as air pollution, uncompensated crash risk and delays to pedestrians. Motorists may also perceive a benefit from having quality transit service available if they ever need it in the future, just as ship passengers pay for lifeboats that they don’t currently use.

Light Rail Economic Opportunity Study Victoria Transport Policy Institute
48
Summary and Conclusions This study evaluates the value of Light Rail Transit and compares it with other options for improving transport between the Western Shore and Metropolitan Core, on southern Vancouver Island. It uses a comprehensive analysis framework that accounts for a wide range of consumer, economic, social and environmental impacts. This framework incorporates impacts that are often overlooked in transport planning, including vehicle cost savings, parking cost savings, benefits from improved consumer transport options, safety and health benefits, land use efficiency benefits, economic development impacts, community livability and environmental benefits. It includes both direct travel impacts, and indirect impacts resulting from changes in travel and land use patterns. Where possible these impacts are quantified and monetized (measured in monetary units). We use middle-range estimates of their magnitude, modified to reflect conditions in the CRD. Impacts that are unsuited to monetization are incorporated using a qualitative rating system. Although some benefits are difficult to quantify (such as the value of improving travel options for non-drivers and preserving greenspace), they appear to be significant, particularly in this region due to geographic constraints on urban expansion and the high value placed on environmental quality. Because monetized estimates exclude benefits unsuited to quantification, total benefits from transit improvements are probably significantly greater than indicated by net present value or benefit/cost ratio values. The basic results are robust: Both quantitative and qualitative evaluation methods provide similar ranking, and the rankings change little when key factors are varied for sensitivity analysis. The results indicate that an LRT system can be a cost effective investment, and provides greater net benefits than highway capacity expansion, even if the LRT has higher initial project costs. This occurs because LRT travel provides additional benefits, such as vehicle and parking cost savings, reduced downstream traffic congestion, traffic safety, pollution reduction, and support for equity and land use objectives. These benefits are greatest if LRT is implemented in conjunction with transportation and land use policies identified in the Regional Growth Strategy, such as more clustered, multi-modal development, commute trip reduction programs, and parking management. These reforms are justified on their own merits, and they become particularly beneficial when implemented with major transit improvements such as LRT. A bus or High Occupancy Vehicle (HOV) lane that improves transit and rideshare service also provides significant benefits. The different transit options each have advantages and disadvantages. A Bus/HOV facility accommodates a wider range of vehicles, including buses, vanpools and carpools, and so can provide direct service to more destinations. LRT tends to provide a more comfortable ride, greater potential to encourage efficient land use, and a unique community identity. LRT tends to have greater popular and political support than bus-based transit system.

Light Rail Economic Opportunity Study Victoria Transport Policy Institute
49
Road pricing on the existing highway could reduce peak-period traffic volumes to an optimal level, reducing traffic congestion, increasing transit and rideshare travel, and providing revenues. This option has the highest benefit/cost ratio, but is likely to be politically difficult to implement. All five options would reduce traffic congestion and provide mobility benefits. Highway capacity expansion provides the largest congestion reduction benefits in the short-run but these decline over time due to generated traffic. Bus/HOV and LRT options provide smaller congestion reduction benefits in the short-run, but these increase over time as ridership grows. LRT can provide the greatest indirect benefits, including more efficient land use patterns, more accessibility, more livable urban centers, and a unique community identity. LRT is likely to be the best transport improvement option if implemented as part of a regional plan to encourage more efficient land use patterns, urban redevelopment, and alternative transportation modes. With supportive policies, LRT can provide a catalyst for land use development patterns identified in the proposed Regional Growth Strategy. The route described here could be the beginning of a regional LRT network, in which case its long-term and indirect benefits can be even greater. Some previous studies concluded that LRT is not a worthwhile investment until many years in the future, after regional population increases, congestion problems worsen and Western Shore residents are more amenable to riding transit, perhaps due to higher fuel prices. However, the more comprehensive analysis used in this study indicates that LRT is justified much sooner, because it recognizes additional benefits from improved transit service, and the potential for increased transit ridership by implementing Regional Growth Strategies’ transportation and land use policies. Figure 8 Cost Effectiveness of LRT
0.0
0.2
0.4
0.6
0.8
1.0
1.2
Years ==>
Ben
efit/
Cos
t Rat
io
With Additional Ridership IncentivesWith Additional BenefitsConventional
C B A
Conventional analysis indicates that LRT is not cost effective (benefit/cost ratio greater than 1.0) for many years (indicated by A). This study suggests that LRT is justified sooner if we recognize additional benefits from improved transport options and reduced vehicle traffic (indicated by B), and the greater ridership growth that can be achieved if the transportation management components of the Regional Growth Strategy plan are implemented (indicated by C).

Light Rail Economic Opportunity Study Victoria Transport Policy Institute
50
Research Recommendations This is a preliminary study, based largely on available information. The additional research described below could improve this analysis.
• Investigate in greater detail the costs of the five options described in this study, including construction costs, operating costs, land requirements, user costs and indirect costs.
• Perform research on regional travel demand, particularly factors that affect mode
choice and location decisions, and the amount of additional vehicle traffic that is likely to be induced if highway capacity increases.
• Market research on consumer preferences, including the service features and
amenities that are likely to attract discretionary travelers (people who can drive a car) to alternative modes.
• Market research on demand for more transit-oriented housing and commercial
locations.
• Model the travel impacts of the options described here, including impacts on traffic congestion, mobility and pollution emissions.
• Investigate voter preferences and willingness to approve various types of
transportation improvements and their funding packages.
• Perform more research on various difficult-to-quantify benefits, including improved mobility for non-drivers, energy and emission impacts, land use impacts and accessibility effects.

Light Rail Economic Opportunity Study Victoria Transport Policy Institute
51
Bibliography BTS, National Transportation Statistics, Bureau of Transportation Statistics (www.bts.gov/btsprod/nts), annual report. Cambridge Systematics, Economic Impact Analysis of Transit Investments: Guidebook for Practioners, Report 35, Transit Cooperative Research Program, TRB (www.trb.org), 1998. CIT, Study of European Best Practice in the Delivery of Integrated Transport, Commission for Integrated Transport (www.cfit.gov.uk/research/ebp/exec/index.htm), 2001. CRD, Capital Regional Profile – Transportation, CRD (www.crc.bc.ca), 1997. CRD, Capital Regional District Regional Growth Strategy, Capital Regional District (www.crd.bc.ca), February 2002. CUTA, Canadian Transit Fact Book 2000, Canadian Urban Transit Association (www.cutaactu.on.ca), 2001. Henry Ewert, Victoria’s Streetcar Era, Sono Nis Press (Victoria), 1992. FTA, Transit Economic Requirements Model (TERM), FTA (www.fta.dot.gov), 1998. GAO, Mass Transit; Bus Rapid Transit Shows Promise, USGAO, (www.gao.gov), 2001. HLB, Economic Study to Establish A Cost-Benefit Framework For The Evaluation of Various Types of Transit Investments, Transport Canada (www.tc.gc.ca), 2002. HLB, Northeast Corridor Greater Cincinnati Transit Benefit-Cost Analysis, Metropolitan Mobility Alliance (available at www.vtpi.org/cincinnati.pdf), 25 March 2002. John Holtzclaw, Does A Mile In A Car Equal A Mile On A Train?, The Sierra Club, (www.sierraclub.org/sprawl/articles/reducedriving.asp), 2000. Alan Horwitz and Edward Beimborn, “Methods and Strategies for Transit Benefit Measurement,” Transportation Research Record 1496, 1996, pp. 9-16. Sir John Houghton (Commission Chairman) Royal Commission on Environmental Pollution: Transport and the Environment, Report 18, HMSO, Oct. 1994 IBI, National Vision for Urban Transit in 2020, Transport Canada (www.tc.gc.ca), 2001. Kittleson & Associates, Transit Capacity and Quality of Service Manual, TCRP Web Doc. 6 (http://nationalacademies.org/trb/publications/tcrp/tcrp_webdoc_6-a.pdf), TRB (www.trb.org), 1999. Todd Litman, Evaluating Public Transit Benefits and Costs, VTPI (www.vtpi.org), 2002. Todd Litman, Transportation Cost And Benefit Analysis Guidebook: Techniques, Estimates and Implications, VTPI (www.vtpi.org/tca), 2002.

Light Rail Economic Opportunity Study Victoria Transport Policy Institute
52
MRC, Urban Transit in Canada: Taking Stock, Transport Canada (www.tc.gc.ca), 2002. ND Lea Consultants, Victoria Light Rail Transit Implementation Strategy: Phase 1 – Alignment Evaluation Study, BC Transit (www.bctransit.com), 1996. Unni B. Lodden, “Simplifying Public Transport,” Nordic Road & Transport Research, (www.toi.no/toi_data/attachments/823/summary.pdf) Institute of Transport Economics, Norway (www.toi.no), No. 1, 2002. Kenneth Orski, “Can Alternatives to Driving Reduce Auto Use?” Innovation Briefs, Vol. 11, No. 1, Jan/Feb 2000. Glenn Pascall, The Rail Transit Debate; An Assessment Of The Arguments, Discovery Institute (www.discovery.org), 2001. Rhonda Phillips, John Karachepone and Bruce Landis, Multi-Modal Quality of Service Project, Florida Department of Transportation, Contract BC205 (www.dot.state.fl.us/Planning/systems/sm/los/FinalMultiModal.pdf), 2001. Richard H. Pratt, Traveler Response to Transportation System Changes, Interim Handbook, TCRP Web Document 12 (www4.nationalacademies.org/trb/crp.nsf/all+projects/tcrp+b-12), DOT-FH-11-9579, 1999. Project for Public Spaces and Multisystems, The Role of Transit Amenities and Vehicle Characteristics in Building Transit Ridership, Transit Cooperative Research Program Report 46, National Academy Press (www.trb.org), 1999. Timothy Rood, Local Index of Transit Availability (LITA), Local Government Commission (www.lgc.org), 1999. Robert J. Shapiro, Kevin A. Hassett and Frank S. Arnold, Conserving Energy and Preserving the Environment: The Role of Public Transit, APTA (www.apa.com), 2002. Jeffery J. Smith, Does Mass Transit Raise Site Values Around Its Stops Enough To Pay For Itself (Were The Value Captured)?, Geonomy Society (www.progress.org/geonomy), 2001, also available at the Victoria Transport Policy Institute (www.vtpi.org). TSI, 2001 CRD Origin and Destination Household Travel Survey, CRD (www.crd.bc.ca), 2002. TRB, Highway Capacity Manual, Special Report 209, Transportation Research Board (www.trb.org), 2000. Vic Vreeland, Railroading America Website (www.railroadingamerica.com), 2002. VTPI, Online TDM Encyclopedia, Victoria Transport Policy Institute (www.vtpi.org), 2002. Paul M. Weyrich and William S. Lind, Twelve Anti-Transit Myths: A Conservative Critique, Free Congress Research and Education Foundation and the APTA (www.apta.com), 2001. www.vtpi.org/LREO.pdf