Embed Size (px)
Citation preview

2
Juhayna Annual Report
2011
Our Mission
Our Vision
“Striving to offer the highest quality products that are both tasty and healthy”
Our mission is to continue to distinguish ourselves as a leading producer, distributor and innovator in the Dairy
and Juice sector, as we offer our customers a wide range of high quality nutritious products at reasonable
prices.
“Our unique products cater to a wide range of consumers with different tastes and needs”
Juhayna’s vision focuses on pursuing serious and relentless efforts to offer the highest quality products.
Highlights.................................................................................................................................
Chairman’s Note.......................................................................................................................
About Juhayna..........................................................................................................................
Manufacturing Sector................................................................................................................
Commercial & Logistics............................................................................................................
Agricultural Operations & Raw Milk Production........................................................................
Juhayna’s Products..................................................................................................................
Juhayna’s Principles and Values..............................................................................................
Executives & Members of the Board........................................................................................
Financial Analysis.....................................................................................................................
Consolidated Financial Statements..........................................................................................
4-5
6
7
10
14
18
21
28
30
36
41
Contents
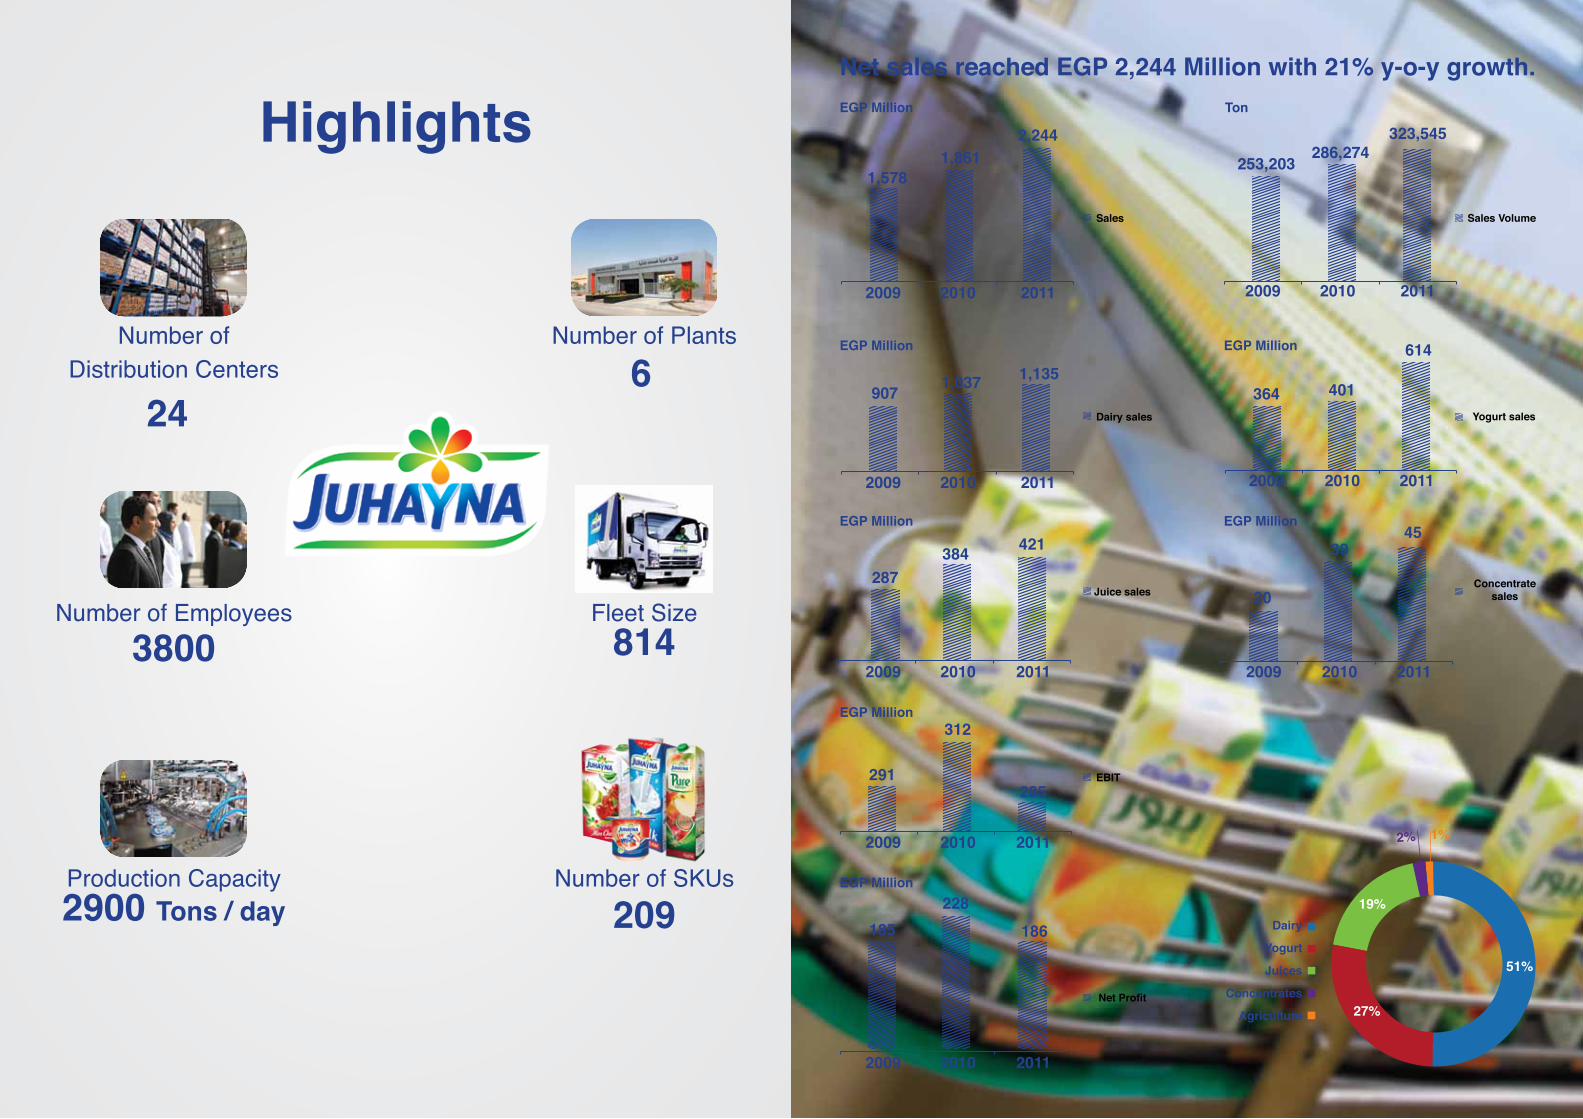
Number of SKUs209
Production Capacity2900 Tons / day
Number ofDistribution Centers
24
Number of Plants6
Fleet Size 814
Number of Employees3800
Highlights
Net Profit
1,8612,244
1,578
323,545286,274253,203
907 1,037 1,135614
401364
421384287
312
285291
185228
186
4539
20
Sales VolumeSales
Dairy sales Yogurt sales
Juice salesConcentrate
sales
EBIT
2009 2010 2011 2009 2010 2011
2009 2010 2011
2009 2010 2011
2009 2010 2011
2009 2010 2011
2009 2010 2011
2009 2010 2011
TonEGP Million
EGP Million
EGP Million
EGP Million
EGP Million
EGP Million
EGP Million
Dairy
Yogurt
Juices
Concentrates
Agriculture
19%
27%
51%
2% 1%
Net sales reached EGP 2,244 Million with 21% y-o-y growth.
7
Juhayna Annual Report 2011
Chairman’s NoteSafwan ThabetChairman of the Board of Directors, Juhayna
Safwan ThabetChairman of the Board of
Directors, Juhayna
Dear Shareholders, It gives me great pleasure to present to you our First Annual Report for 2011.
The year witnessed major political changes in Egypt, which subjected the Egyptian economy to serious challenges — from the security vacuum after protests began, to the diminished economic performance during and after the events. Juhayna like other Egyptian companies, felt the impact of these difficulties. From the start of the protests, Juhayna laid down its list of priorities. This included, in order of importance: Ensuring the safety of the employees, safeguarding the Group’s assets, adjusting our investment plan in accordance with events on-the-ground, and minimizing the negative effects of the economic slowdown that ensued.
Under the guidance of the Board of Directors, Juhayna has accomplished several programs and projects which have reflected positively on its growth and development. Among these are the following:
• The implementation of plans to increase sales capacity through enlarging the distribution fleet, hiring 600 new employees and opening new distribution branches.• A 21% increase in sales Year-on-Year reaching EGP 2.2 billion in 2011, despite the negative impact on exports due to the Arab Spring particularly exports to Libya, which account for 12% of our milk sales.
In general, 2011 also saw a decrease in profit margins. This was due to a number of factors- including, but not limited to- rising costs of raw materials, rising distribution costs as the fleet for direct sales grew larger (with the aim of maintaining our market share) and rising operational costs particularly rents and services.
Net profits were also affected this year, due to unprecedented and one-off events such as the EgyFood factory fire - which resulted in an EGP 40.7 million loss. Notably, profits in 2010 included approximately EGP 20 million in capital gains from the sale of unused land.
On the agricultural front, Juhayna was able in 2011 to reclaim and plant 4,500 feddans in the New Valley Governorate and the Bahareya Oasis, producing a total of 42,000 tons of agricultural crops. A new dairy farm is being designed and construction should commence early 2013 in Baherya Oasis. In 2011, Juhayna finalized the insurance settlement for the EgyFood factory fire, receiving EGP 100 million in compensation. The Group also submitted a signed letter of reference to begin construction work on an EGP 328 million yogurt, buttermilk and Zabado factory, with a loan for EGP 300 million already finalized for construction, buildings, production lines and packaging in Sixth October City.
We are optimistic that 2012 will prove to be a much more stable and prosperous for Egypt and the Middle East as a whole. Plans are drawn to increase our capacity to realize growth in domestic sales, as well as to restore our share of export markets. We plan on beginning construction of a new yogurt factory, increasing the area of our reclaimed lands, establishing a dairy farm, opening new sales and distribution branches, as well as solidifying and developing the organizational structure of the Group. All told, we expect to invest EGP 750 million in 2012 as we grow our domestic and regional operations.
I would like to extend my thanks and appreciation to the Juhayna team for their distinguished performance, without which Juhayna would not have been able to maintain its pioneering position in Egypt. I would also like to thank all our investors for their continuous support which has allowed Juhayna to become an important player in the food industry in Egypt.
Finally, we at Juhayna remain confident in our outlook. We will continue to proceed with our investment and operational plans towards developing and expanding our manufacturing, commercial, agricultural and dairy farming operations.
Juhayna Food Industries
Our StrategyBy focusing on core strengths - our state-of-the-art factories, farms and integrated companies - we are able to provide rewarding returns for our shareholders and continuously develop all sectors.
The company strategy is implemented through:
• Improving professional competence in the management of operations.• Developing strategic investments in the milk, yoghurt and juice sectors.• Utilizing the best in management and technological systems to achieve company goals.• Providing our shareholders and clients with added value.• Participating in the development of the national economy.
98
Juhayna Annual Report 2011
Juhayna Annual Report
2011
Who We AreJuhayna Food Industries is a leading Egypt-based manufacturer specialized in the production, processing and packaging of milk, yogurt, juice and juice concentrate. During the past three decades, Juhayna has succeeded in winning the loyalty of consumers, who have come to view our wide variety of quality products as trusted household names. The company began operations in 1983 under the leadership of Safwan Thabet, who saw strong opportunities for growth in the dynamics of the Egyptian market, including:
• The high population growth rate. • The young demographic profile of the country. • Low rates of per capita consumption. • Low rates of packaged milk consumption versus loose milk. • Consumer Conversion to packaged products.
In 1987, Juhayna introduced its first packaged production of milk, yogurt and juice, manufactured in accordance with the highest technological standards and to the highest quality. Since then, the company has continued to expand its market share and product mix by investing in technology and adopting a flexible approach — which allows the Group to best adapt to changing global trends and local market needs. Today, Juhayna has the well-earned reputation as a trendsetter in both manufacturing know-how and product innovation.
Business Lines: The Juhayna Group is divided into three sectors:
1. ManufacturingComposed of four distinct production lines for milk, yoghurt, juice and juice concentrate that are manufactured at six factories, with each factory specializing in one product category.
2. Commercial and LogisticsJuhayna has 24 distribution centers spread throughout Egypt, from Alexandria in the north to Aswan in the south. Juhayna’s distribution network is able to serve 36,000 retail outlets with a transportation fleet of over 800 vans and trucks.
3. Agricultural and Raw Milk ProductionSince 2008, Juhayna has taken major steps to secure a supply of high quality raw materials at reasonable cost. In order to implement expansion plans, the company purchased 18,000 feddans of land for planting fruit trees and producing animal fodder. The Group also reclaimed and cultivated 4,500 feddans of desert land in the New Valley and Bahareya Oasis areas, and will begin establishing a dairy farm for the production of raw milk.
Juhayna owns six factories at the 6th of October City on the outskirts of Cairo which specialize in the production of milk, yogurt, juices and juice concentrates. The Group also possesses two arms: One specializing in commercial and distribution activities, covering all of Egypt’s governorates; the other specializing in agricultural activities. We have always believed that our strong infrastructure represents one of the essential cornerstones of our success.
In 2010, Juhayna’s IPO on the Egyptian Exchange (EGX) of 205,972,632 shares worth EGP 999 million was six times oversubscribed. Shares began trading on the EGX on June 15, 2010 for EGP 4.6 per share.
The capital raised from the IPO was used to finance a number of vertical integration projects, including setting up new farms to secure a steady supply of raw milk, cattle feed, fruit trees and agricultural produce. Proceeds are also to be used for expansion in the food and beverage segment.
In 2011 the company’s capital had reached EGP 706 million. Juhayna now employs a total of 3,800 people, with its production capacity now standing at 2,900 tons per day.
By adhering to a carefully devised strategy and guaranteeing an optimum utilization of resources, Juhayna has been able to grow steadily and achieve the best possible returns for its owners and shareholders.
1110
Juhayna Annual Report 2011
Juhayna Annual Report
2011Manufacturing Sector
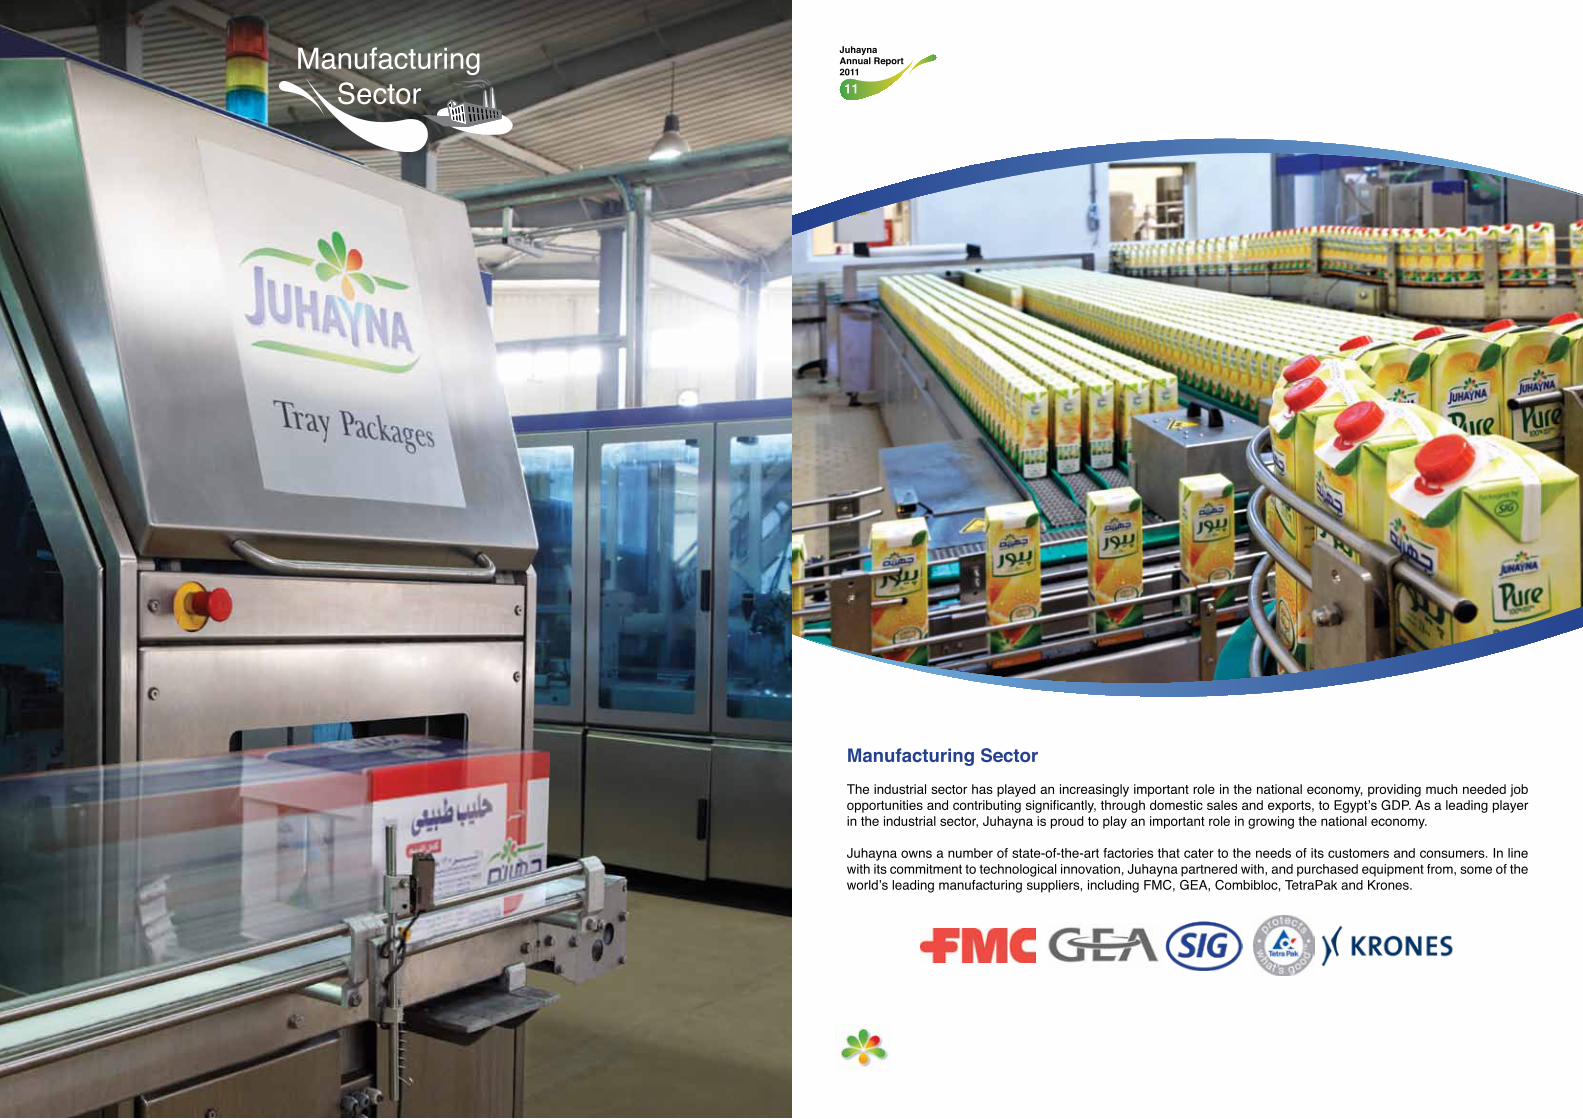
Manufacturing SectorThe industrial sector has played an increasingly important role in the national economy, providing much needed job opportunities and contributing significantly, through domestic sales and exports, to Egypt’s GDP. As a leading player in the industrial sector, Juhayna is proud to play an important role in growing the national economy.
Juhayna owns a number of state-of-the-art factories that cater to the needs of its customers and consumers. In line with its commitment to technological innovation, Juhayna partnered with, and purchased equipment from, some of the world’s leading manufacturing suppliers, including FMC, GEA, Combibloc, TetraPak and Krones.
1312
Juhayna Annual Report 2011
Juhayna Annual Report
2011
Our Factories
The Juhayna Factory
Established in 1983, the Juhayna Factory is the company’s main headquarters located in 6th of October City on the outskirts of Cairo, covering an area of 22,000 square meters. The plant began producing milk, yoghurt, juices and fruit concentrates and has undergone several modernization and upgrading plans throughout the past 29 years. Today, operations at the factory are fully automated, starting with the arrival of the raw milk, to pasteurization, testing and sterilization (which is conducted via advanced thermal systems), through to modern packaging and equipment cleaning, all of which are done in accordance with industry best practices.
The Juhayna Factory was streamlined to specialize in the production of milk, flavored milk, cream, and other specialty products for global food manufacturers and restaurant chains. The Juhayna Factory is also the sole supplier of the dairy and frozen products used in desserts for McDonald’s Egypt and a number of other well-known restaurant chains.
The Juhayna Factory holds a number of certificates that make it one of the most important production facilities in Egypt and the Arab region. These include the ISO: 22000, BRC, SQMS, and YUM certificates, as well as the OHSAS: 18001 certificate for safety, health and security.
The plant employs 350 factory workers, engineers, and administrative staff, and has a production capacity of 1,000 ton per day.
Al Masreya Factory
Situated at the 6th of October City, Al Masreya Factory covers 25,000 square meters and was acquired by Juhayna in 2005 as part of its expansionary policies. All stages of production are automated at the factory, which is equipped with the latest technology for milk, flavored milk and white cheese production and packaging.The factory has a production capacity of 1,000 tons per day, and employs a total of 300 workers including
technicians, engineers and administrators. It is only the third factory in the world to use the TetraPak TBA Edge packaging and also holds a number of internationally recognized certifications including ISO 22000:2005.
The Dawleya Factory
Located at the 6th of October City and covering 55,000 square meters of land, the Dawleya Factory was established in 2009 for the production of juices and drinks. The Factory has an average production capacity of 750 tons per day— with all stages of production fully automated— and uses the latest state-of-the-art technology for pasteurization, water desalination and the reduction of waste. The factory employs a total of 170 workers, and holds the highest-standard certifications available including ISO 18000, ISO 14000, ISO 22000 and FSSC.
Al Marwa Factory
The Al Marwa Factory was established in 1998 on 10,000 square meters of land in 6th of October City. It has been continually modernized and equipped with the latest technologies over a period of ten years.
Al Marwa specializes in the processing and packaging of seasonal fruits such as mango, guava, strawberries, peaches and apricots, turning them into the concentrates or fruit pulp which Juhayna uses to produce its quality juices. The Factory also supplies local and international factories engaged in the manufacture and packaging of juice concentrate or fruit pulp-based products such as juices and ice cream.
Production capacity at Al Marwa is 300 tons per day of juice concentrate. The Factory employs 130 workers in partnership with the Modern Concentrates Factory.
The Factory also holds HACCP and SGF certification (the latter conferring upon it the status of an approved supplier to the European Union), as well as the OHSAS 18001 and ISO 22000 certificates. Juhayna is currently in the process of obtaining FSSC certification for the Factory.
The Modern Concentrates Factory
Established in 2007, the Modern Concentrates Factory covers a total area of 7,000 square meters in 6th of October City. The factory is specialized in the production and packaging of concentrate derived from citrus fruits such as orange, lemon and grapefruit, and has a production capacity of 720 tons of juice concentrate per day. The Modern Concentrates Factory is HACCP, SGF, OHSAS 18001 and ISO 22000 certified.
EgyFood Factory
Acquired by Juhayna in 2007, EgyFood is specialized in the production of Yogurt, Buttermilk and Zabado, and has a production capacity of 250 tons per day. In April 2010, a large fire caused significant damage to buildings and machinery. As part of Juhayna’s expansion plans for the yogurt sector, the Group has begun rebuilding the factory, and expanded its area from 14,000 square meters (prior to the fire) to 35,000 square meters. Juhayna signed an EGP328 million construction contract with SIAG Industrial Construction and Engineering Company for the construction of the new yogurt plant. As a temporary measure until the factory is rebuilt, EgyFood resumed operations in May 2010 at the Juhayna and Al Masreya Factories’ premises.
Planning and Production Operations
Planning
Juhayna’s strategic plans and Board directives are aligned to ensure both efficiency and accountability. Individual departments and divisions present their plans, which are then merged seamlessly into the Group’s overall strategy.
Sales plans are developed taking into account past trends, current market research, competitive intelligence, and external and internal studies. These plans represent the basis on which Juhayna determines the amount of raw material needed to fully meet demand. Financial Planning offers assistance to all departments through budget reports and spending plans for various activities.
Also taken into account is current technical data, in addition to studies on the amount of raw milk required from our farms relative to herd capacity
Production Process
All Juhayna production facilities are equipped with the latest machinery and surveillance systems, meeting the requirements demanded by the HACCP and ISO 22000 certifications. All critical control points, including the pasteurization process, are subject to continuous monitoring and follow-up. All details of the production process are recorded, allowing the company to effectively monitor and follow up on all products.
An organized monitoring and follow-up process is also applied to packaging (the final stage in the production process), with immediate steps taken in the event of any deviation from recommended procedures. All Juhayna finished products are subject to quality control testing in addition to continuous monitoring of all sterilization points.
Quality Control
Juhayna’s strict adherence to quality ensures that its products reach the consumer in the best possible condition. By using the finest raw materials, investing in the latest technological innovations, and carrying numerous tests on final products —the Group has been able to win the trust of consumers and successfully maintain its competitive edge over other milk and juice producers in Egypt and the MENA region.
1514
Juhayna Annual Report 2011
Juhayna Annual Report
2011
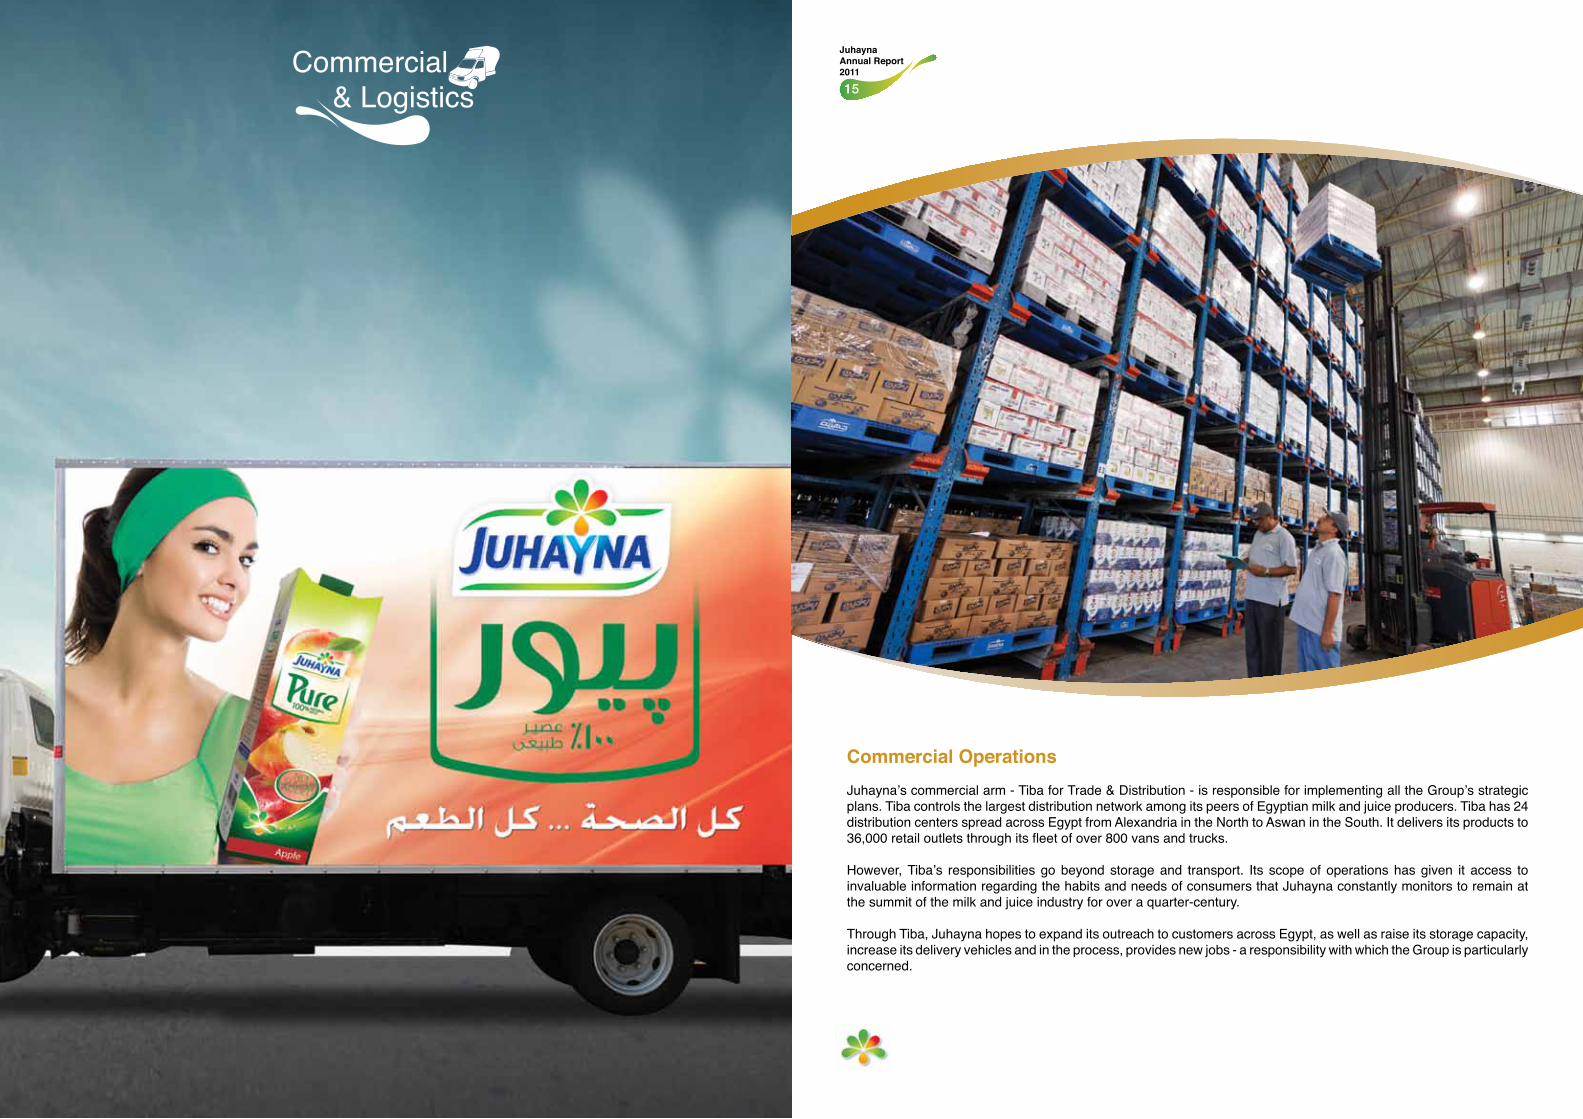
Commercial OperationsJuhayna’s commercial arm - Tiba for Trade & Distribution - is responsible for implementing all the Group’s strategic plans. Tiba controls the largest distribution network among its peers of Egyptian milk and juice producers. Tiba has 24 distribution centers spread across Egypt from Alexandria in the North to Aswan in the South. It delivers its products to 36,000 retail outlets through its fleet of over 800 vans and trucks.
However, Tiba’s responsibilities go beyond storage and transport. Its scope of operations has given it access to invaluable information regarding the habits and needs of consumers that Juhayna constantly monitors to remain at the summit of the milk and juice industry for over a quarter-century.
Through Tiba, Juhayna hopes to expand its outreach to customers across Egypt, as well as raise its storage capacity, increase its delivery vehicles and in the process, provides new jobs - a responsibility with which the Group is particularly concerned.
Commercial & Logistics
1716
Juhayna Annual Report 2011
Juhayna Annual Report
2011
Juhayna’s Distribution Fleet
During 2011, Juhayna increased its sales and distribution fleet to more than 800 vehicles, including:
• 700 sales vehicles for direct sales to customers.• 90 sales vehicles for sales to chain clients. • 20 vehicles for transporting products to retail branches.
This distribution fleet — the largest among its peers gives Juhayna a distinct edge over rival milk and juice producers, enabling it to deliver both its dry and chilled products efficiently and to reach large pockets of consumers.
Sales and Distribution Team
Tiba for Trade & Distribution offers the highest standard of sales services to all Juhayna’s clients through a strong sales team composed of more than 2,000 individuals throughout all Egypt. It serves five different sales channels:
• The retail sector, via direct delivery vehicles.• The wholesale sector, via our pre-sales system and distribution vehicles.• Chains and hypermarkets, via our pre-sales system.• Private establishments, via our pre-sales system.• Exports.
Skills Development
Tiba for Trade & Distribution takes great care in developing the skills of its team, through regular training and performance-enhancing programs. To further improve performance, we have established the Juhayna Academy to train all members of the sales team- from delegates to supervisors and branch managers- through a clear academic program that includes the following:
• The Various Stages of a Sales Visit.• Leadership Skills.• Negotiation Skills.• Presentation and Speaking Skills.• Time Management Skills.
Courses are taught by managers from the Sales and Commercial Marketing teams from across Egypt.
The Marketing Team
The marketing team plays an essential role in the retail and distribution process, supporting the sales team in a variety of ways:
• Preparing sales strategies in coordination with the Sales department, leading to growth in all of Juhayna’s sales channels, and in line with each channel’s nature and internal competitive conditions.• Preparing loyalty programs for retailers to increase their connection to Juhayna’s products, as well as conducting publicity campaigns.• Coordinating with the Sales and Marketing teams to implement effective strategies and marketing campaigns.
Future Distribution Centers
In 2012, Tiba will add eight new distribution centers, in order to broaden the reach of Juhayna’s products, improving access to customers nationwide. The new distribution centers will be located at:
• Fifth Settlement, Greater Cairo.• El Tor, South Sinai.• Assiut, Upper Egypt.• Sohag, Upper Egypt.• Kafr El Sheikh, Lower Egypt.• Qalyubiya, Lower Egypt.• Obour City, East Cairo.• Central Alexandria.
1918
Juhayna Annual Report 2011
Juhayna Annual Report
2011Agricultural Operations& Raw Milk Production
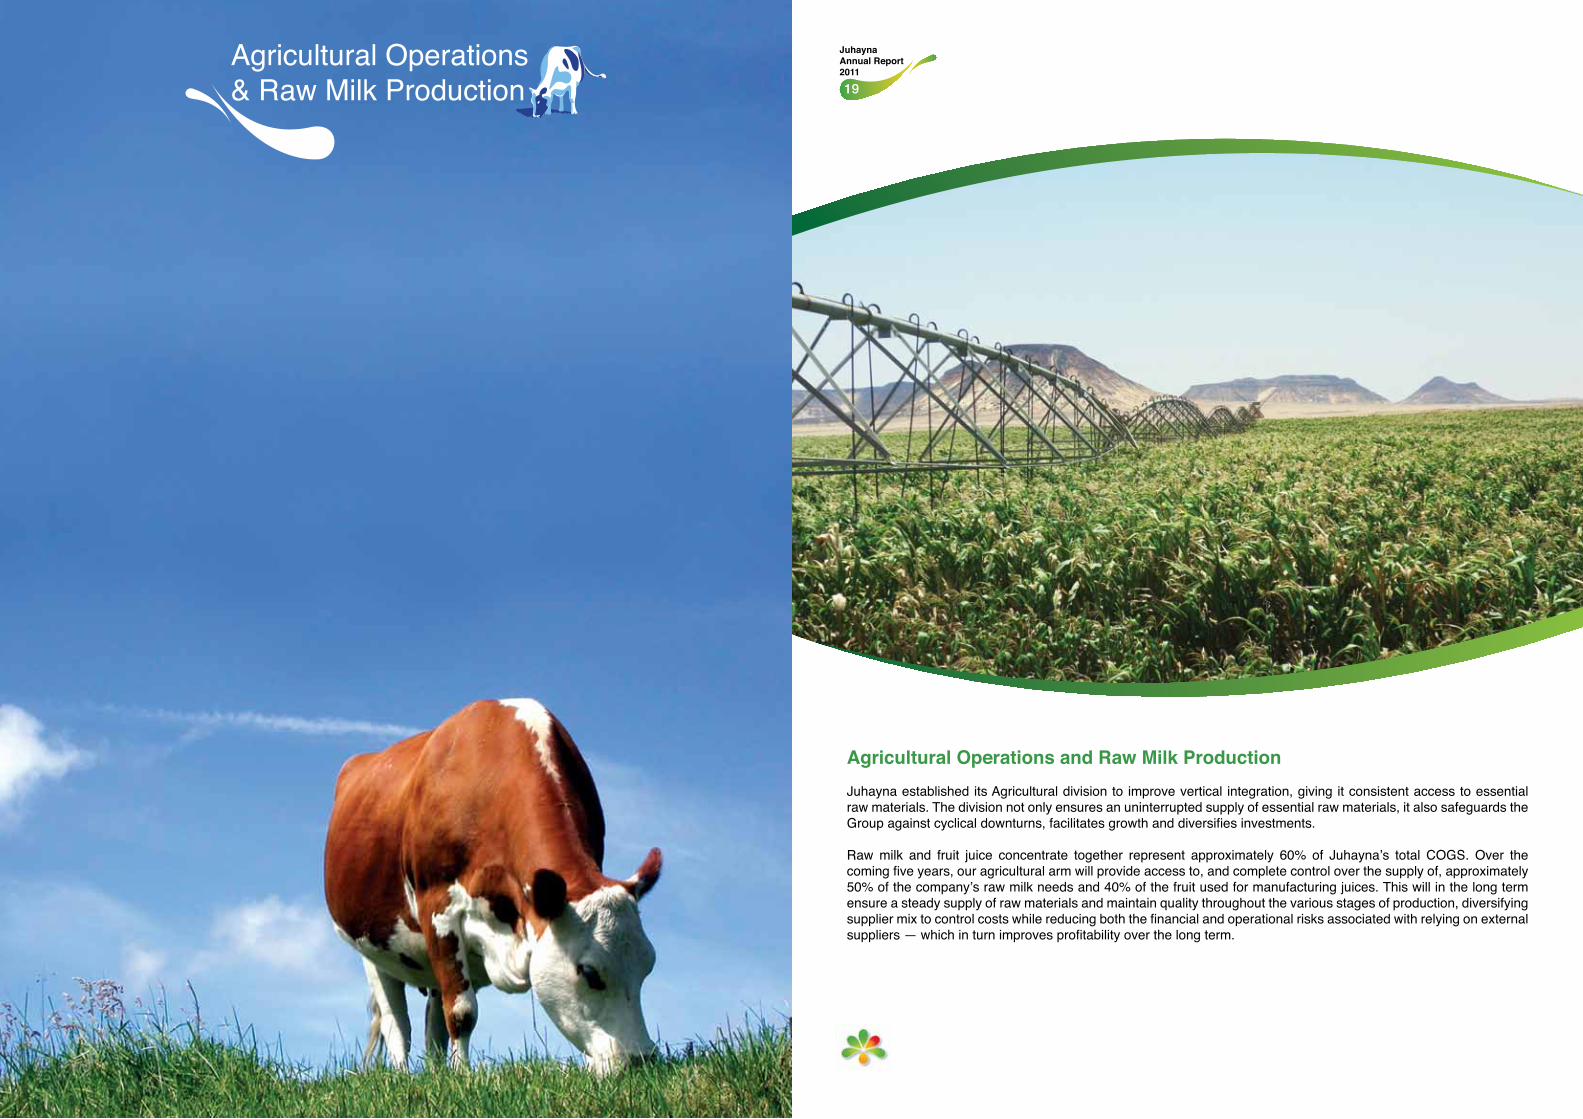
Agricultural Operations and Raw Milk ProductionJuhayna established its Agricultural division to improve vertical integration, giving it consistent access to essential raw materials. The division not only ensures an uninterrupted supply of essential raw materials, it also safeguards the Group against cyclical downturns, facilitates growth and diversifies investments.
Raw milk and fruit juice concentrate together represent approximately 60% of Juhayna’s total COGS. Over the coming five years, our agricultural arm will provide access to, and complete control over the supply of, approximately 50% of the company’s raw milk needs and 40% of the fruit used for manufacturing juices. This will in the long term ensure a steady supply of raw materials and maintain quality throughout the various stages of production, diversifying supplier mix to control costs while reducing both the financial and operational risks associated with relying on external suppliers — which in turn improves profitability over the long term.
2120
Juhayna Annual Report 2011
Juhayna Annual Report
2011
Al Enmaa for Agricultural Development & Livestock
Al Enmaa for Agricultural Development & Livestock was established in 2008 as Juhayna’s agricultural arm. Within three years of its establishment, the company’s investments increased to EGP 250 million.
Al Enmaa owns three main companies:
1. Enmaa for Livestock: Currently responsible for the building of Juhayna’s new dairy farm, the company owns 550 feddans of land in the Bahareya Oasis (Al-Aseela) area allocated for raw milk production. Al Enmaa owns a 99.9% stake in Enmaa for Livestock.
2. Enmaa for Reclamation and Agriculture: Specialized in reclaiming lands for cultivation, and owns 7,450 feddans of land in the Bahareya Oasis area. Al Enmaa owns a 99.9% stake in Enmaa for Reclamation and Agriculture.
3. Milky’s for Milk Production: Specialized in the production of milk and owns approximately 3,200 cows. Al Enmaa owns a 40% stake in Milky’s.
Al Enmaa currently owns 2,500 feddans of land in the Farafra area in Egypt’s New Valley Governorate, which the company intends to increase to 10,000 feddans. In the Bahareya Oasis area, the company owns a total of 8,000 feddans, of which 550 feddans will be used to establish a dairy farm, with the rest earmarked for agricultural produce.
Al Enmaa has also reclaimed 4,500 feddans of land, of which 2,200 feddans are in the Farafra area in the New Valley Governorate and 2,300 feddans in Al-Aseela in the Bahareya Oasis. The company uses modern water-saving processes including drip irrigation. Primary agricultural products include potatoes, corn, wheat, alfalfa and fruit trees (especially orange); the company will introduce mango trees in the future.
On the dairy farming front, the Company has partnered with some of the largest farms in Egypt in order to ensure it uses the finest raw milk for its dairy products. Juhayna has also begun the process of setting up its new dairy farm, which will be built in the Bahareya Oasis (Al-Aseela) area. The farm will house 3,500 cows of the finest breed, and will utilize automated milking techniques. It is expected that the number of cows at the farm will increase to 14,000 within five years, enabling Juhayna to produce 50% of the Group’s total raw milk requirements. Currently, Al Enmaa owns 40% of Milky’s for milk Production, which provides the Group with 3,200 top-quality dairy cows.
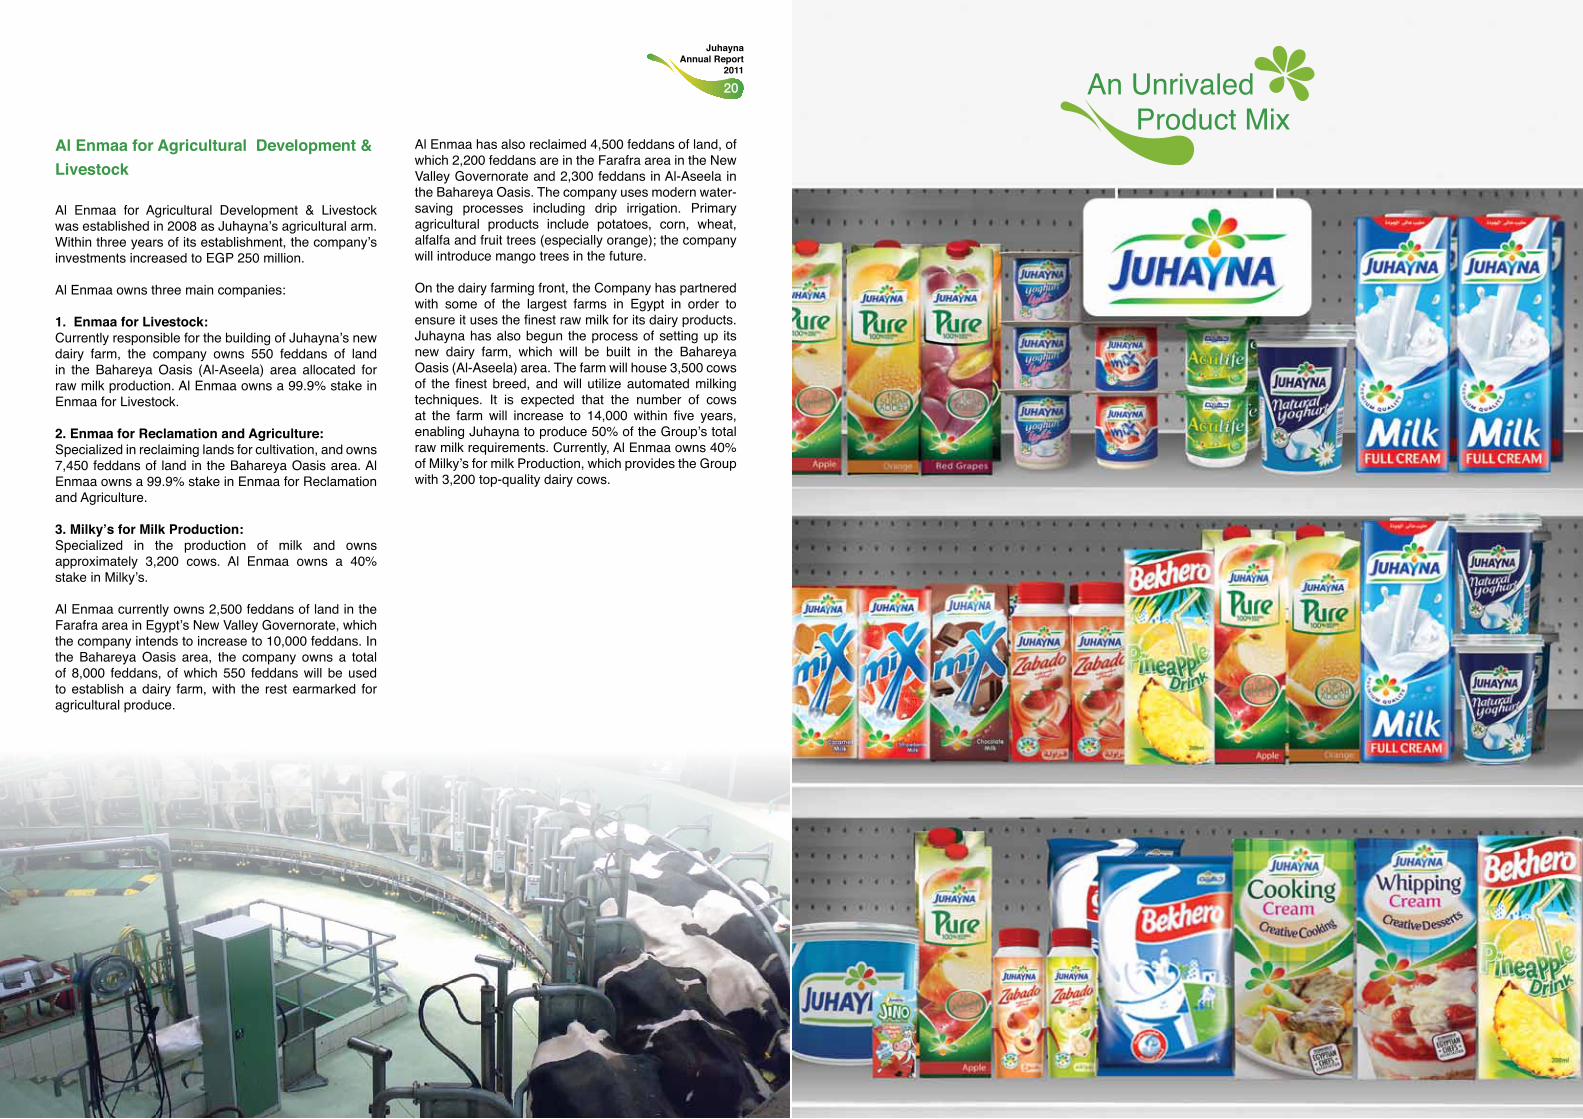
An Unrivaled Product Mix
2322
Juhayna Annual Report 2011
Juhayna Annual Report
2011
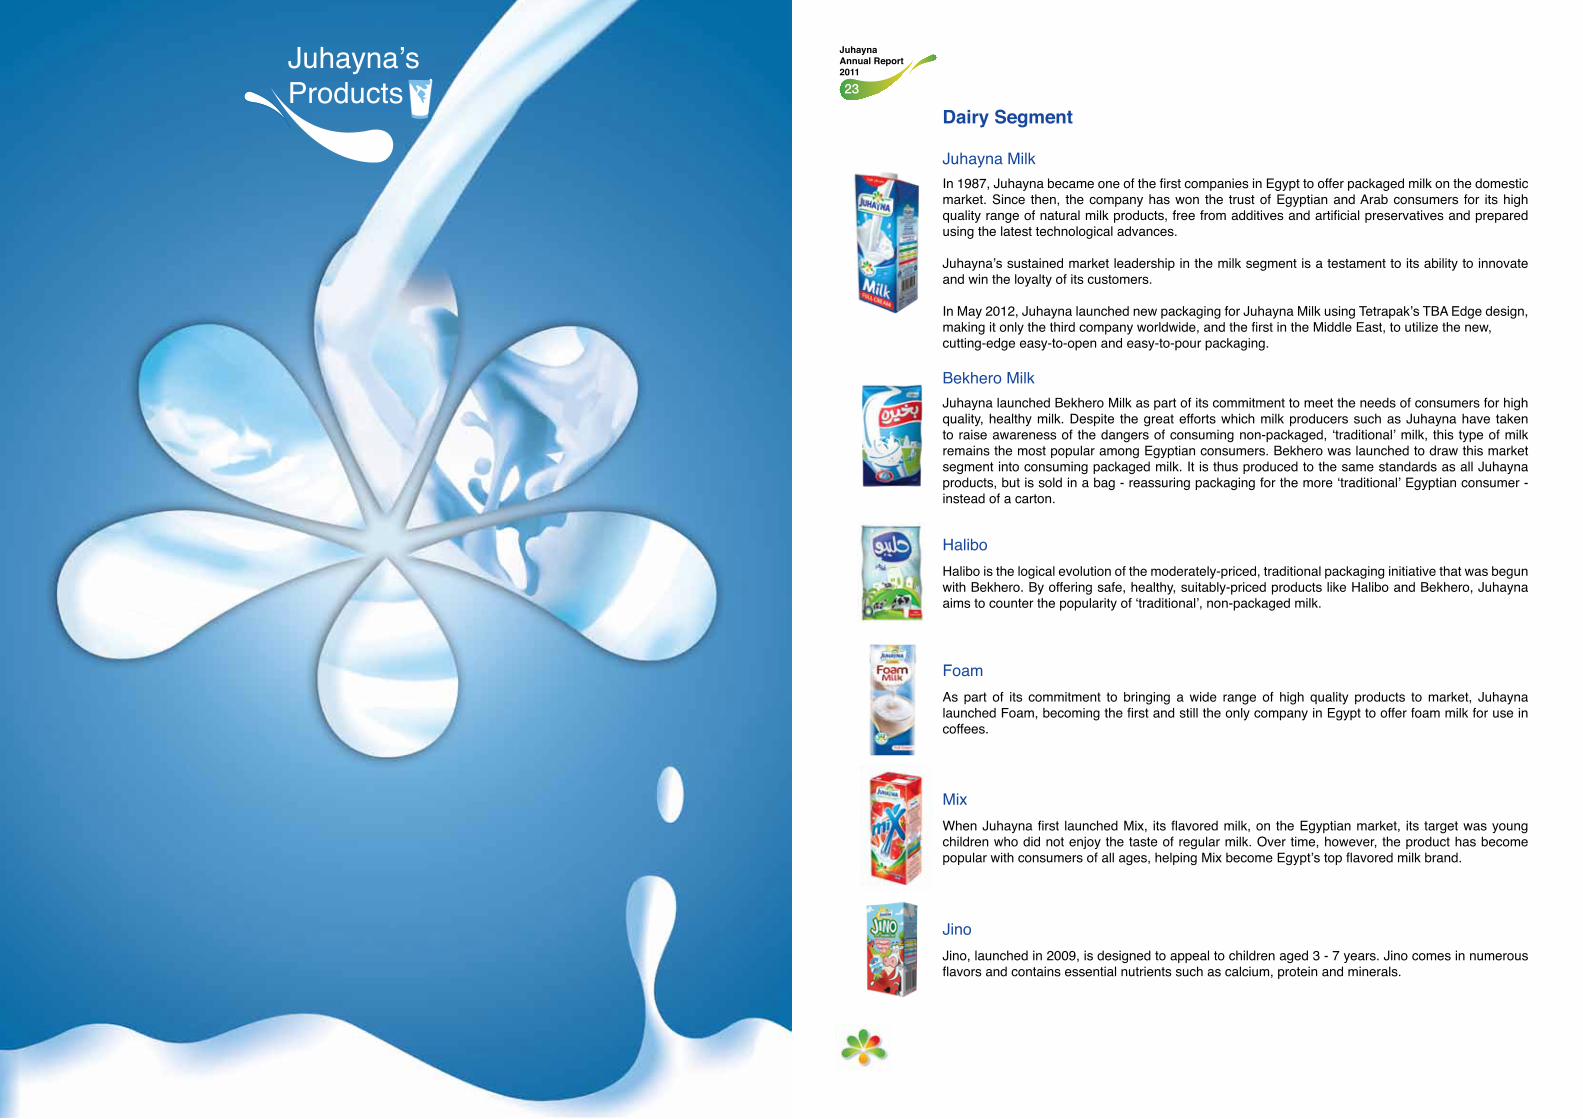
Juhayna MilkIn 1987, Juhayna became one of the first companies in Egypt to offer packaged milk on the domestic market. Since then, the company has won the trust of Egyptian and Arab consumers for its high quality range of natural milk products, free from additives and artificial preservatives and prepared using the latest technological advances.
Juhayna’s sustained market leadership in the milk segment is a testament to its ability to innovate and win the loyalty of its customers.
In May 2012, Juhayna launched new packaging for Juhayna Milk using Tetrapak’s TBA Edge design, making it only the third company worldwide, and the first in the Middle East, to utilize the new, cutting-edge easy-to-open and easy-to-pour packaging.
Bekhero MilkJuhayna launched Bekhero Milk as part of its commitment to meet the needs of consumers for high quality, healthy milk. Despite the great efforts which milk producers such as Juhayna have taken to raise awareness of the dangers of consuming non-packaged, ‘traditional’ milk, this type of milk remains the most popular among Egyptian consumers. Bekhero was launched to draw this market segment into consuming packaged milk. It is thus produced to the same standards as all Juhayna products, but is sold in a bag - reassuring packaging for the more ‘traditional’ Egyptian consumer - instead of a carton.
HaliboHalibo is the logical evolution of the moderately-priced, traditional packaging initiative that was begun with Bekhero. By offering safe, healthy, suitably-priced products like Halibo and Bekhero, Juhayna aims to counter the popularity of ‘traditional’, non-packaged milk.
MixWhen Juhayna first launched Mix, its flavored milk, on the Egyptian market, its target was young children who did not enjoy the taste of regular milk. Over time, however, the product has become popular with consumers of all ages, helping Mix become Egypt’s top flavored milk brand.
FoamAs part of its commitment to bringing a wide range of high quality products to market, Juhayna launched Foam, becoming the first and still the only company in Egypt to offer foam milk for use in coffees.
JinoJino, launched in 2009, is designed to appeal to children aged 3 - 7 years. Jino comes in numerous flavors and contains essential nutrients such as calcium, protein and minerals.
Dairy Segment
Juhayna’s Products
2524
Juhayna Annual Report 2011
Juhayna Annual Report
2011
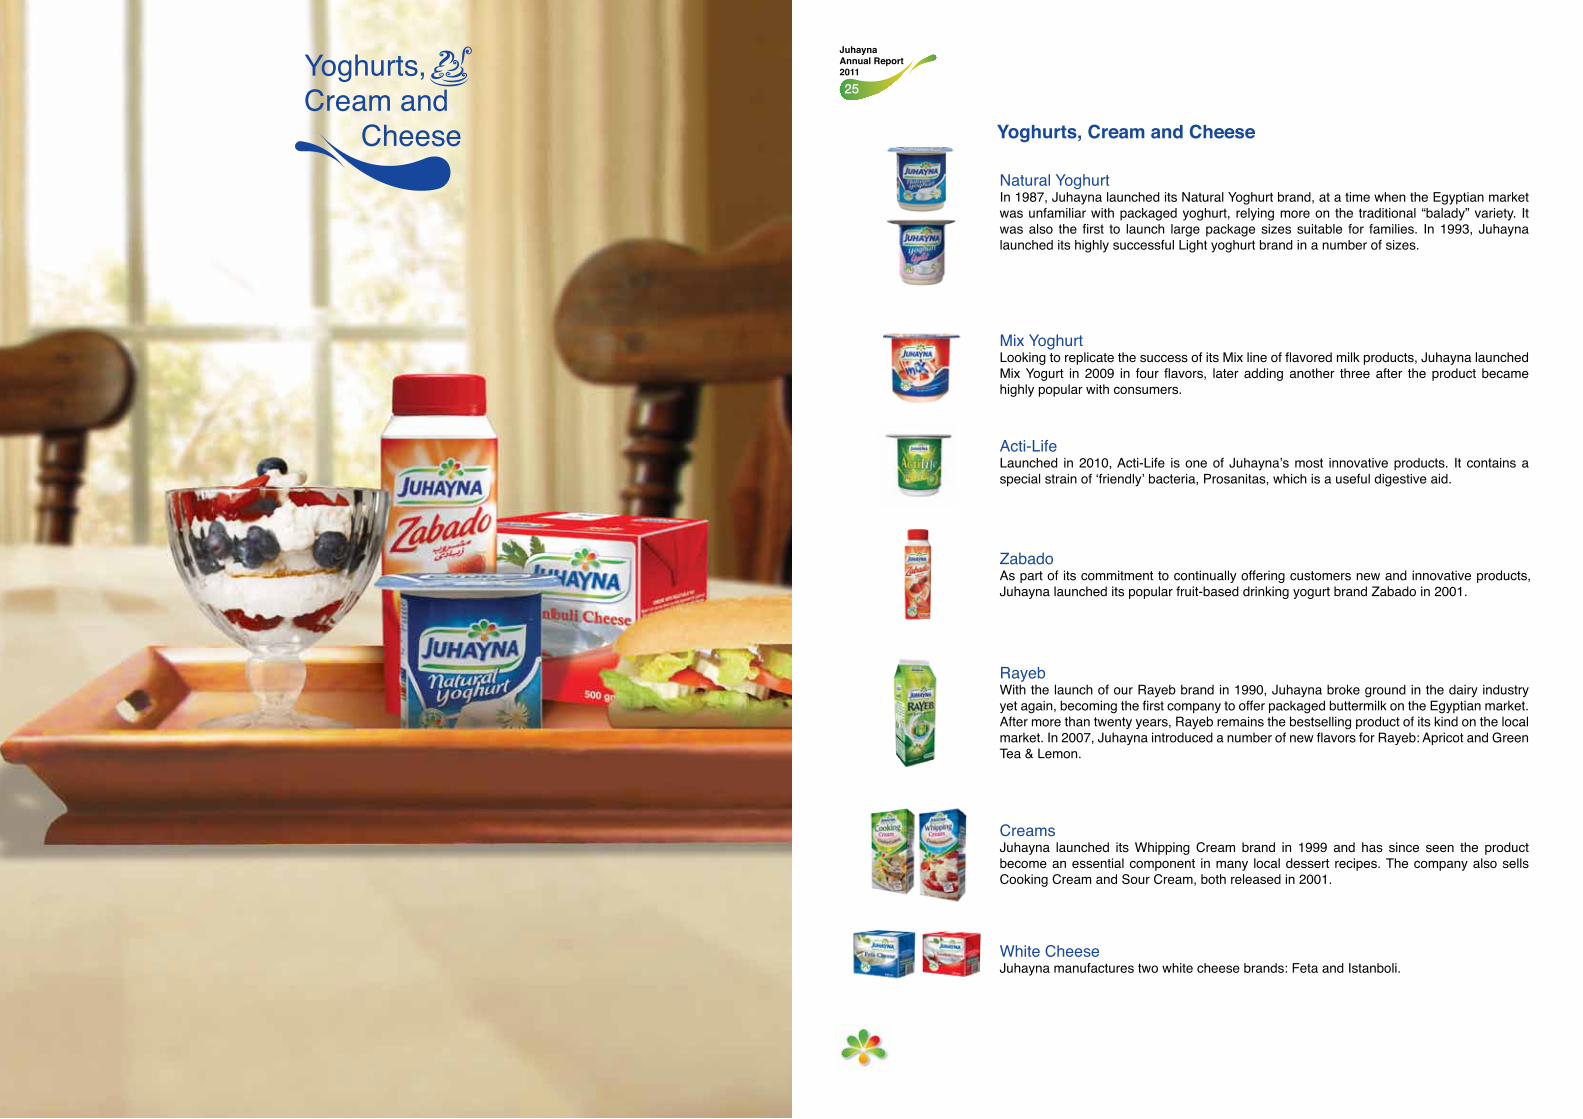
Natural YoghurtIn 1987, Juhayna launched its Natural Yoghurt brand, at a time when the Egyptian market was unfamiliar with packaged yoghurt, relying more on the traditional “balady” variety. It was also the first to launch large package sizes suitable for families. In 1993, Juhayna launched its highly successful Light yoghurt brand in a number of sizes.
Yoghurts, Cream and Cheese
Mix YoghurtLooking to replicate the success of its Mix line of flavored milk products, Juhayna launched Mix Yogurt in 2009 in four flavors, later adding another three after the product became highly popular with consumers.
Acti-LifeLaunched in 2010, Acti-Life is one of Juhayna’s most innovative products. It contains a special strain of ‘friendly’ bacteria, Prosanitas, which is a useful digestive aid.
ZabadoAs part of its commitment to continually offering customers new and innovative products, Juhayna launched its popular fruit-based drinking yogurt brand Zabado in 2001.
RayebWith the launch of our Rayeb brand in 1990, Juhayna broke ground in the dairy industry yet again, becoming the first company to offer packaged buttermilk on the Egyptian market. After more than twenty years, Rayeb remains the bestselling product of its kind on the local market. In 2007, Juhayna introduced a number of new flavors for Rayeb: Apricot and Green Tea & Lemon.
CreamsJuhayna launched its Whipping Cream brand in 1999 and has since seen the product become an essential component in many local dessert recipes. The company also sells Cooking Cream and Sour Cream, both released in 2001.
White CheeseJuhayna manufactures two white cheese brands: Feta and Istanboli.
Yoghurts, Cream and Cheese
2726
Juhayna Annual Report 2011
Juhayna Annual Report
2011
Juices
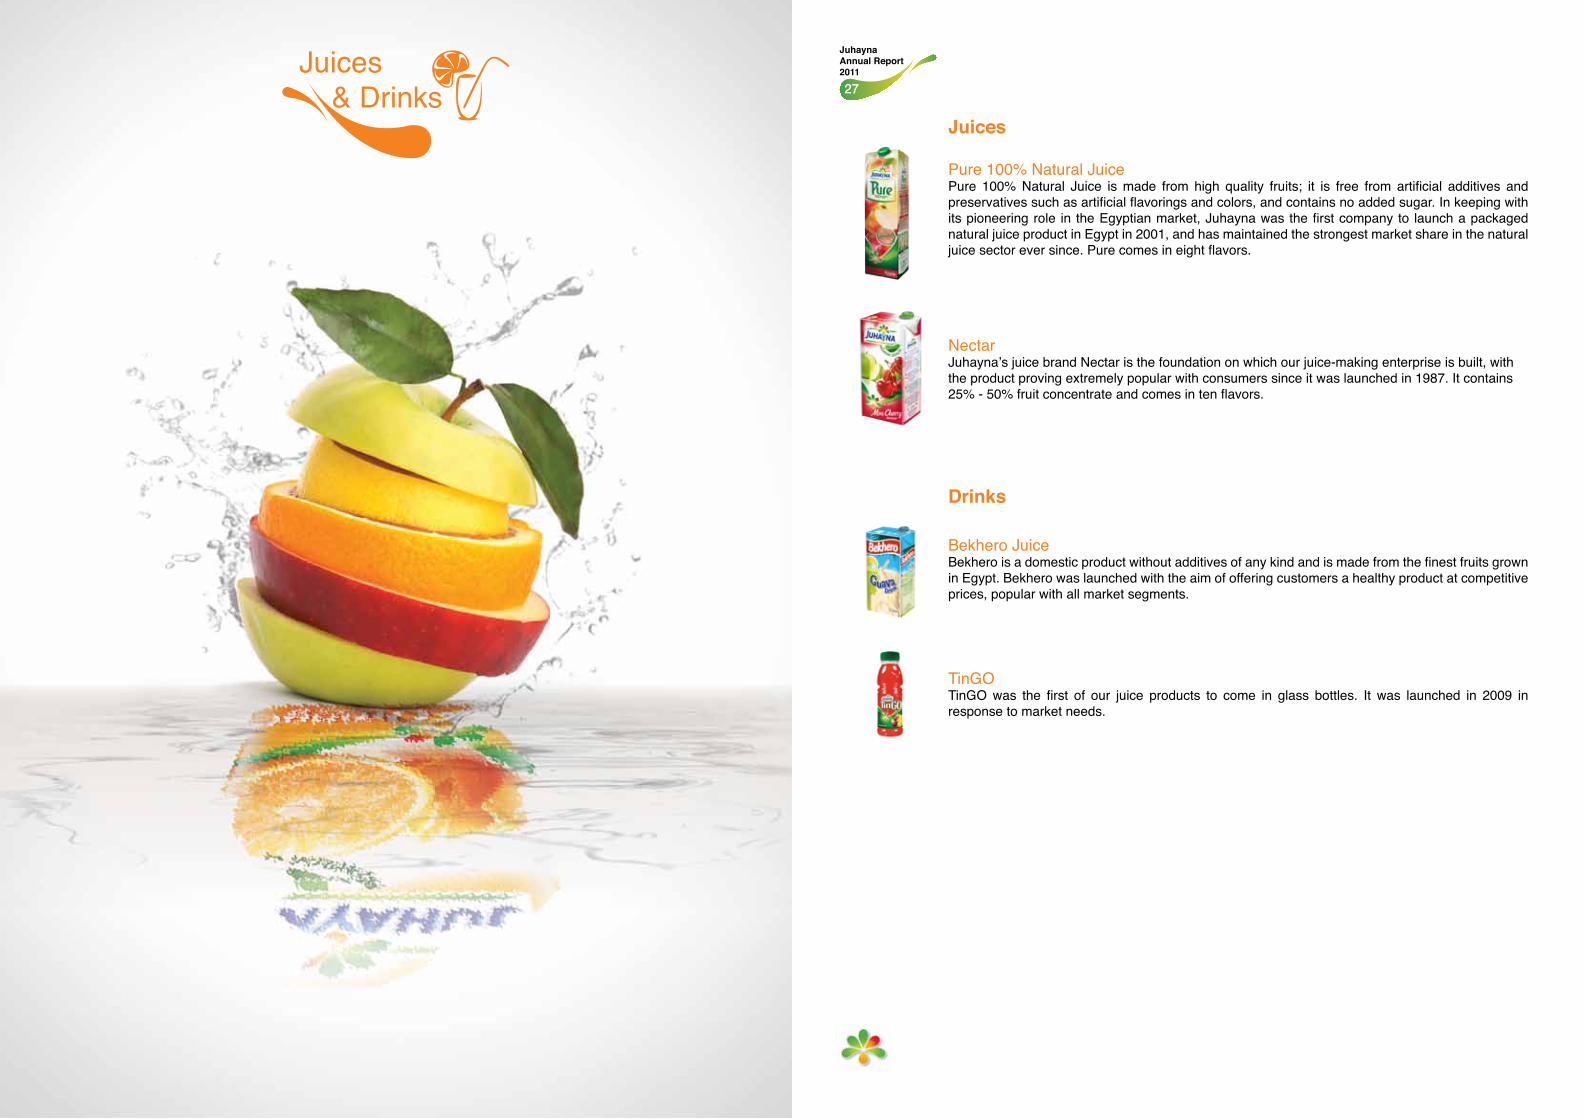
Pure 100% Natural JuicePure 100% Natural Juice is made from high quality fruits; it is free from artificial additives and preservatives such as artificial flavorings and colors, and contains no added sugar. In keeping with its pioneering role in the Egyptian market, Juhayna was the first company to launch a packaged natural juice product in Egypt in 2001, and has maintained the strongest market share in the natural juice sector ever since. Pure comes in eight flavors.
NectarJuhayna’s juice brand Nectar is the foundation on which our juice-making enterprise is built, with the product proving extremely popular with consumers since it was launched in 1987. It contains 25% - 50% fruit concentrate and comes in ten flavors.
Drinks
Bekhero JuiceBekhero is a domestic product without additives of any kind and is made from the finest fruits grown in Egypt. Bekhero was launched with the aim of offering customers a healthy product at competitive prices, popular with all market segments.
TinGOTinGO was the first of our juice products to come in glass bottles. It was launched in 2009 in response to market needs.
Juices & Drinks

2928
Juhayna Annual Report 2011
Juhayna Annual Report
2011
Juhayna’s Principles and Values PrinciplesTo ensure clarity and consistency, Juhayna has set forth a number of principles that serve as the basis for all internal and external communication.
• Cooperating Internally… Competing Externally.• A Focus on Results. • Lead… Don’t follow.• Methodical thinking… Timely Execution.• Striving for Excellence.• Diversity, Innovation, Uniqueness.
ValuesAt Juhayna, we strive to be unique in everything that we do, and we have adopted values that support this goal. We work to enable our employees to be creative, feel empowered and present management with effective ideas and solutions.
We are committed to fostering cooperation between our departments, as well as between the Group as a whole and our clients. We also exert great efforts to ensure a safe and healthy working environment, and to ensure that our activities do not harm the surrounding environment.
Integrity and HonestyFor Juhayna, integrity and honesty are not merely props used to bolster our image; they are values that ensure we have a productive environment in which we are proud to work. We are proud to be a part of a team in which everyone behaves with honesty and integrity. Our customers, clients, partners and suppliers are also treated with fairness and dignity which reflects positively on the image and the reputation of our company and our brand.
Decisive LeadershipDecisive leadership is a central component of Juhayna’s vision. The Group seeks to promote and cultivate the natural leadership qualities of our employees, supporting them with training and guidance as they achieve expertise in their fields.
The Pursuit of ExcellencePerseverance and teamwork are qualities essential for achieving the best results for our shareholders and the best, most innovative products for our customers.
Efficiency and Error ReductionJuhayna activities are conducted according to strict timetables and quality control standards, as well as accurate calculations and scientific methods. The goal of producing error-free work is always at the forefront of everything we do, allowing us to maintain our edge and perform to the highest standards possible. We enforce strict timetables and accurate calculations to ensure efficiency and top-quality end products within all divisions.
Health and Safety Health, Safety and Environment (HSE) issues are essential pillars in the success of Juhayna’s operations.
Transparency and TrustTimely disclosure and accountability are also essential to the success of our organization.
Juhayna’s Principles and Values
3130
Juhayna Annual Report 2011
Juhayna Annual Report
2011Executives and Members of the Board
Executive Management
Safwan ThabetChairman of the Board of Directors and Chief Executive Officer
Safwan Thabet has been Chairman of the Board of Directors and Chief Executive Officer of Juhayna since founding the Group in 1983. Mr. Thabet has left a distinctive mark on the investment map in Egypt and played a central role in the development of the food sector for more than 30 years through various appointments and positions including:
• Member of the Board of the Federation of Egyptian Industries (FEI)• Member of the Board of the Chamber of Food Industries• Chairman of the Board of the 6th of October Investors’ Association (OIA)• Member of the Board of 6th of October Development & Investment Company (SODIC)

3332
Juhayna Annual Report 2011
Juhayna Annual Report
2011
Hugo Harbo - Projects DirectorMr. Harbo has been with Juhayna for 14 years, first assuming the role of General Manager of Factories. Before joining Juhayna, Mr. Harbo held the position of General Manager at some of Denmark’s most prominent dairy companies, including Bornholm, Denmark Protein and Dairy Denmark, in addition to MD Foods which later merged with Arla Foods.
Hisham Zaki - Administrative Affairs and Government Relations DirectorMr. Zaki has been Administrative Affairs and Government Relations Director at Juhayna since 2006. Mr. Zaki began his career with Juhayna in 1982, taking on a variety of positions including Sales Manager for Juhayna (1999-2001) and General Manager of both Tiba for Trade & Distribution and El Masreya for Dairy and Juice Company (El Masreya).
Gaydaa El Fakahany - Director of Human ResourcesMs. Fakahany became Director of Human Resources in December 2011. She has over 15 years’ experience in Human Resources working for firms such as Nestle, Johnson & Johnson and HSBC. She was also Regional Manager of Human Resources at Schlumberger.
Wael Zakaria - Supply Chain DirectorMr. Zakaria serves as Group Supply Chain Director. He was appointed in May 2012. Prior to joining Juhayna, he spent 14 years at Procter & Gamble (Middle East and Africa). He occupied a number of positions including Head of Production, Operations and Packaging in Saudi Arabia and as a Manager of one of the firm’s factories in Morocco. He also worked as Head of Planning at Procter & Gamble’s Headquarters in Geneva, where he was responsible for allocating production at the firm’s factories and for the distribution of the firm’s nappy brand in the Middle East and Africa. From 2006 till 2012, Mr. Zakaria was Vice President Manufacturing & Technology at Savola Foods.
Niels Thomsen - Factories Director Mr. Thomsen has occupied the position of Factories Director at Juhayna since 2006. Before joining the Group, he served as Director of Manufacturing at Danish Meat Processing, Tulip Food (1999-2006) and Danbo (1996-1999). He was also Director of Production at Binzagr Coro in Saudi Arabia and a Manager at Royal Greenland Seafood.
Sameh El Hodaiby - Financial Affairs Director Mr. El Hodaiby is currently Director of Financial Affairs at Juhayna, having begun his tenure with the Group in 2006 as Chief Financial Officer of one of Juhayna’s factories, later becoming Chief Financial Officer and then Financial Controller for Juhayna in 2008. Before joining Juhayna, Mr. El Hodaiby was Accounts Manager at SODIC and an Auditor at Grant Thornton in Cairo. He is a member of the Accountants and Auditors Register.
Amr Ghazaly - General Manager of Tiba for Trade & DistributionMr. Ghazaly joined Juhayna in 2011, as General Manager for subsidiary company Tiba for Trade & Distribution. Mr. Ghazaly spent 7 years at Coca-Cola Egypt (1995-2002) as a General Manager of Sales Development and General Manager of Factories in North Upper Egypt. He was also appointed Regional Sales Manager at Coca-Cola Saudi Arabia (2002-2007) and General Manager of the Commercial Sector at Coca-Cola Libya (2009-2011).
Hany Kamel - General Manager of El Enmaa for Agricultural Development & Livestock, Managing Director of Milky’s Mr. Kamel has occupied the position of Managing Director of Milky’s since its founding in 2008, on the back of a partnership and cooperation agreement between Juhayna and the Kamel family. He is also General Manager of El Enmaa for Agricultural Development & Livestock and Founder and Managing Director of Organic Foods.

3534
Juhayna Annual Report 2011
Juhayna Annual Report
2011
Board of Directors
Safwan ThabetChairman of the Board of Directors and Chief Executive OfficerSafwan Thabet has been Chairman of the Board of Directors and Managing Director of Juhayna since founding the Group in 1983. Mr. Thabet has left a distinctive mark on the investment map in Egypt and played a central role in the development of the food sector for more than 30 years through various appointments and positions including:
• Member of the Board of the Federation of Egyptian Industries (FEI)• Member of the Board of the Chamber of Food Industries• Chairman of the Board of the 6th of October Investors’ Association (OIA)• Member of the Board of 6th of October Development & Investment Company (SODIC)
Akil Hamid Beshir - Non-Executive MemberMr. Beshir has been a Non-Executive Member at Juhayna since 2010. Mr. Beshir acted as Chairman and Chief Executive Officer of Telecom Egypt (2000-2009) and Chairman of the Board of the Directors (2009-2012). Mr. Beshir worked as General Manager and Managing Director at Giza Systems Engineering (1978-2000). He also acted as Vice Chairman of Al Ahly Computer Equipment and Vice President of Misria Computer Systems.
Ahmed Amin El Abin - Non-Executive MemberMr. El Abin has been a Non-Executive Member at Juhayna since 1985. He has been a member Board of Directors of the Scientific Centre of Documents and Information at Cairo University since 2009. Mr. El Abin is founder of the Academic Library in Cairo and co-founder of Mars Publishing House in Riyadh, Saudi Arabia. He was also responsible for the Foreign Language Books department at Al Ahram Institute.
Seif El-Din Thabet - Non-Executive MemberMr. Thabet was admitted to the Board of Directors in February 2006. He is currently Operations Director at Juhayna, and was also previously Director of Human Resources. Mr. Thabet began his career at Juhayna in 2004, holding a number of managerial positions including Sales and Marketing Manager and Project Manager. Previously, he held positions at German-based Müller Dairy. He was appointed the first plant manager to Juhayna’s Juice Factory, El Dawleya. He is currently also Vice President of the Dairy Division at the Chamber of Food Industries and was previously the Treasurer at the Food Export Council.
Mohammed Abdallah El Dogheim - Non-Executive MemberMr. El Dogheim has been a Non-Executive Member at Juhayna since 1983. In addition to his position on the Group’s Board of Directors, Mr. El Dogheim is a member of the Saudi Egyptian Business Council and the Chamber of Commerce of El Dawadmi Governorate, Saudi Arabia. Mr. El Dogheim held a variety of positions at the Ministry of Finance in Dammam, Ministry of Transport and the Ministry of Islamic Affairs and Endowments in Riyadh, all in Saudi Arabia. He also worked as a Financial Controller, Financial Director and Budget Director at the Ministry of Water and Electricity in Riyadh.
Yasser Suleiman El Mallawany - Non-Executive MemberMr. El Mallawany has been a Non-Executive Member at Juhayna since 2000. He acted as Chief Executive Officer of EFG Hermes Holding Company S.A.E. since 2008 and Vice President of the Board of Trustees of the EFG Hermes Foundation since 2006. He was also appointed as the Chairman of the Board of EFG Hermes Private Equity and as a Non-Executive Chairman at ACE Insurance Company. He also served as Vice Chairman of the Commercial International Investment Company (CIIC) since 2003 and spent 16 years at Commercial International Bank (CIB) as General Manager of the Corporate Banking Division. Mr. El. Mallawany is a member of the Advisory Council of the Emerging Markets Private Equity Association (EMPEA).
Ayman Ismail Suleiman - Non-Executive MemberMr. Suleiman has been a Non-Executive Member at Juhayna since January 2010. Before joining the Group, Mr. Suleiman was a partner and Chairman of Dar Al Mimar Group from 2008 to January 2010. Mr. Soliman also worked for PepsiCo (2006-2008) as Chief Executive Officer and President of the Egypt and North Africa region. Prior to this, Mr. Soliman spent 19 years at Procter & Gamble (1987-2006), occupying various sales and marketing roles. He also acted as General Manager for Global Oral Care from 2003 to 2006.
Heba Safwan Thabet - Non-Executive MemberHeba Thabet has been a Non-Executive Member at Juhayna since February 2006. Ms. Thabet is currently Associate Director of Marketing for the Juice Division. Previously, she was the Associate Director of External Affairs where she was responsible for the Group’s media and public relations activities. Since joining Juhayna in 2001, Ms. Thabet worked in the Marketing Department for the Fresh Produce Division. Ms. Thabet is also a member of the Business Advisory Board for SIFE Egypt, the International Public Relations Association (IPRA), and the Committee for Social Responsibility at the American Chamber of Commerce in Egypt.
Mariam Thabet - Non-Executive MemberMs. Thabet has been a Non-Executive Director at Juhayna since 2010. Ms. Thabet currently focuses on Strategic Planning at the Group, where her goal is to develop all production divisions at Juhayna. Previously, she was Assistant Procurement Manager for the Group.
3736
Juhayna Annual Report 2011
Juhayna Annual Report
2011
Juhayna Food IndustriesEarnings Release: Fourth Quarter & Full Year 2011Juhayna Food Industries (JUFO.CA), one of the leading dairy, yogurt and juice manufacturers and distributors in Egypt, announced its consolidated results for 4Q2011 and full year 2011 results.
I- FINANCIAL HIGHLIGHTS
Full Year 2011* Revenue reached EGP2,244 million, 21% increase over 2010.* Gross profit reached EGP634 million, 9% increase over 2010.* EBIT reached EGP285 million, 9% decline over 2010. * Net income totaled EGP186 million, 19% decline over 2010. * Dairy sales grew 9% y-o-y to EGP1,135 million, with gross margins at 26%.* Yogurt sales increased 53% y-o-y to EGP614 million, with gross margin at 35%.* Juice sales grew 10% to EGP421 million, with gross margins at 27%.* Concentrates sales grew 16% to EGP45 million, with gross margins at 15%* Agriculture sales reached EGP29 million, with gross margins at 35%.
Fourth Quarter 2011* Revenue reached EGP576 million, 14% increase over 4Q10.* Gross profit reached EGP154 million, 6% increase over 4Q10.* EBIT reached EGP49 million, 22% drop over 4Q10.* Net income totaled EGP0.2million, 97% drop over 4Q10.* Dairy sales grew 9% y-o-y to EGP315 million, with gross margins at 23%.* Yogurt sales increased 32% y-o-y to EGP140 million, with gross margin at 36%.* Juice sales grew 2% to EGP107 million, with gross margins at 25%.* Concentrates sales dropped 60% to EGP2 million, with gross margins at 47%.* Agriculture sales reached EGP11 million, with gross margins at 18%.
Financial AnalysisJuhayna Food industries reported a net profit of EGP 186 million in 2011 compared to EGP228 million one year earlier. The results were negatively impacted due to the following:
• EGP 40 million loss on insurance settlement regarding burnt yogurt plant.
• Increase in raw material prices, which have been passed on gradually to the selling price.
• Distribution expense increase on the back of expansion in the distribution fleet, with the aim of preserving our market share. This contributed positively to increase our local sales and compensate for the decline in export sales. These investments will positively influence our upward trend during the coming years.
• Events following January 25th revolution from higher costs especially wages, in addition to the consumer feeling pressured to reduce expenses and shifting to the cheaper and smaller sized packages.
Note: 2010 earnings included a one-time item sale of land for EGP 20 million.
Financial Analysis
3938
Juhayna Annual Report 2011
Juhayna Annual Report
2011
II-OPERATIONAL HIGHLIGHTS1- January 25th revolution:
With the turbulent events that followed the Jan 25th Revolution due to absence of law and order, Juhayna took firm measures to ensure the safety of the employees, secure the company’s assets while continue supplying the consumers with their needs.
2- Commercial sector expansion:The commercial sector underwent significant expansion, almost doubling the distribution fleet, hiring 600 new supervisors, drivers and sales managers. Two new branches were inaugurated to drive up sales in the local market in an attempt to make up for the loss in export sales.
3- Investments in agriculture sector & dairy farming:A total area of 4,500 feddans has been reclaimed and cultivated with agricultural crops and fruit trees at the New Valley Governorate and Al Wahat District. 42,000 tons of agricultural crops were produced.
4- Insurance settlement:Juhayna finalized insurance settlement for damages related to the fire incident in the yogurt plant for EGP 97 million including the value of salvages.
5- Commencing construction on yogurt plant: Juhayna signed EGP 300 million loan contract to be used to partially finance the construction of the new yogurt plant. Furthermore, the construction contract for the new plant for EGP 328 million has been awarded to SIAC Industrial Construction and Engineering Company.
III- SEGMENT ANALYSISI- LOCAL SALES
Below is an overview of the net sales generated by each of the Group’s segments from the Egyptian market for full year 2011.
Net Sales by Segment (EGP Mil)4Q Growth Growth
2011 2010 2011 2010Dairy 306 274 12% 1,086 921 18%Yogurt 140 106 32% 614 402 53%Juice 104 101 3% 411 373 10%
Concentrates 2 4 -48% 11 21 -46%Agriculture 11 - NM 29 - NM
Total 564 485 16% 2,150 1,716 25%
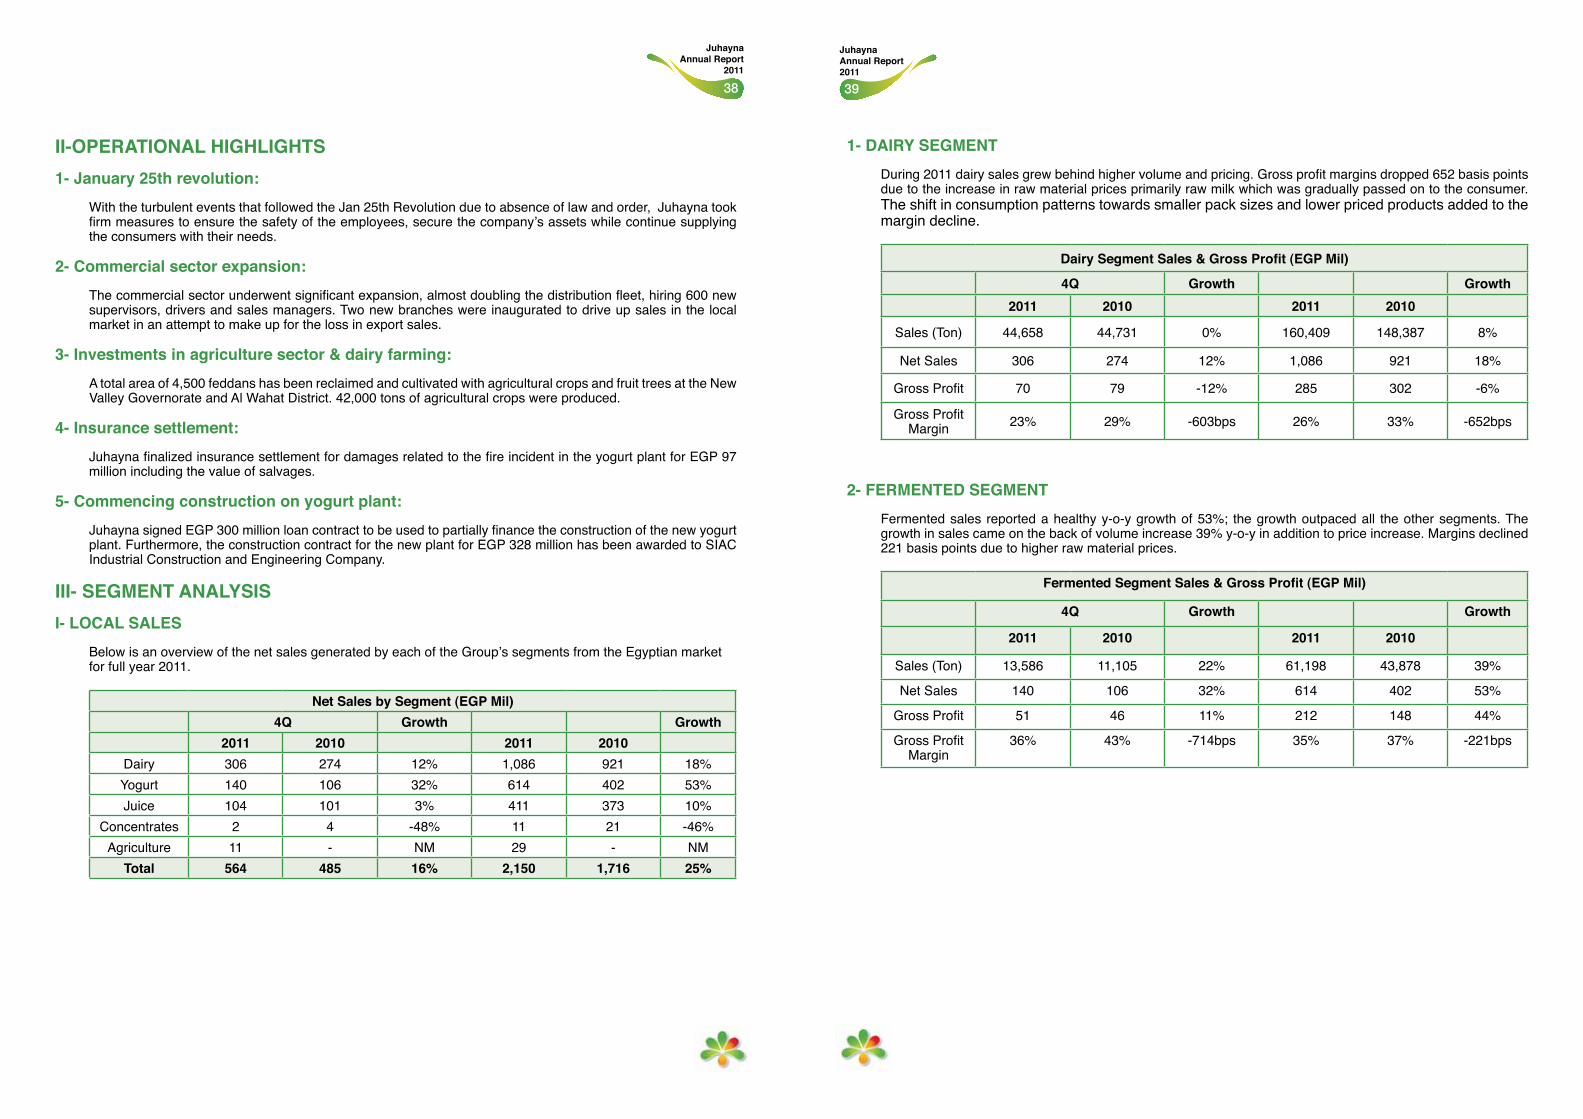
1- DAIRY SEGMENTDuring 2011 dairy sales grew behind higher volume and pricing. Gross profit margins dropped 652 basis points due to the increase in raw material prices primarily raw milk which was gradually passed on to the consumer. The shift in consumption patterns towards smaller pack sizes and lower priced products added to the margin decline.
Dairy Segment Sales & Gross Profit (EGP Mil)
4Q Growth Growth2011 2010 2011 2010
Sales (Ton) 44,658 44,731 0% 160,409 148,387 8%
Net Sales 306 274 12% 1,086 921 18%
Gross Profit 70 79 -12% 285 302 -6%
Gross Profit Margin 23% 29% -603bps 26% 33% -652bps
2- FERMENTED SEGMENT Fermented sales reported a healthy y-o-y growth of 53%; the growth outpaced all the other segments. The growth in sales came on the back of volume increase 39% y-o-y in addition to price increase. Margins declined 221 basis points due to higher raw material prices.
Fermented Segment Sales & Gross Profit (EGP Mil)
4Q Growth Growth
2011 2010 2011 2010
Sales (Ton) 13,586 11,105 22% 61,198 43,878 39%
Net Sales 140 106 32% 614 402 53%
Gross Profit 51 46 11% 212 148 44%
Gross Profit Margin
36% 43% -714bps 35% 37% -221bps
40
Juhayna Annual Report
2011
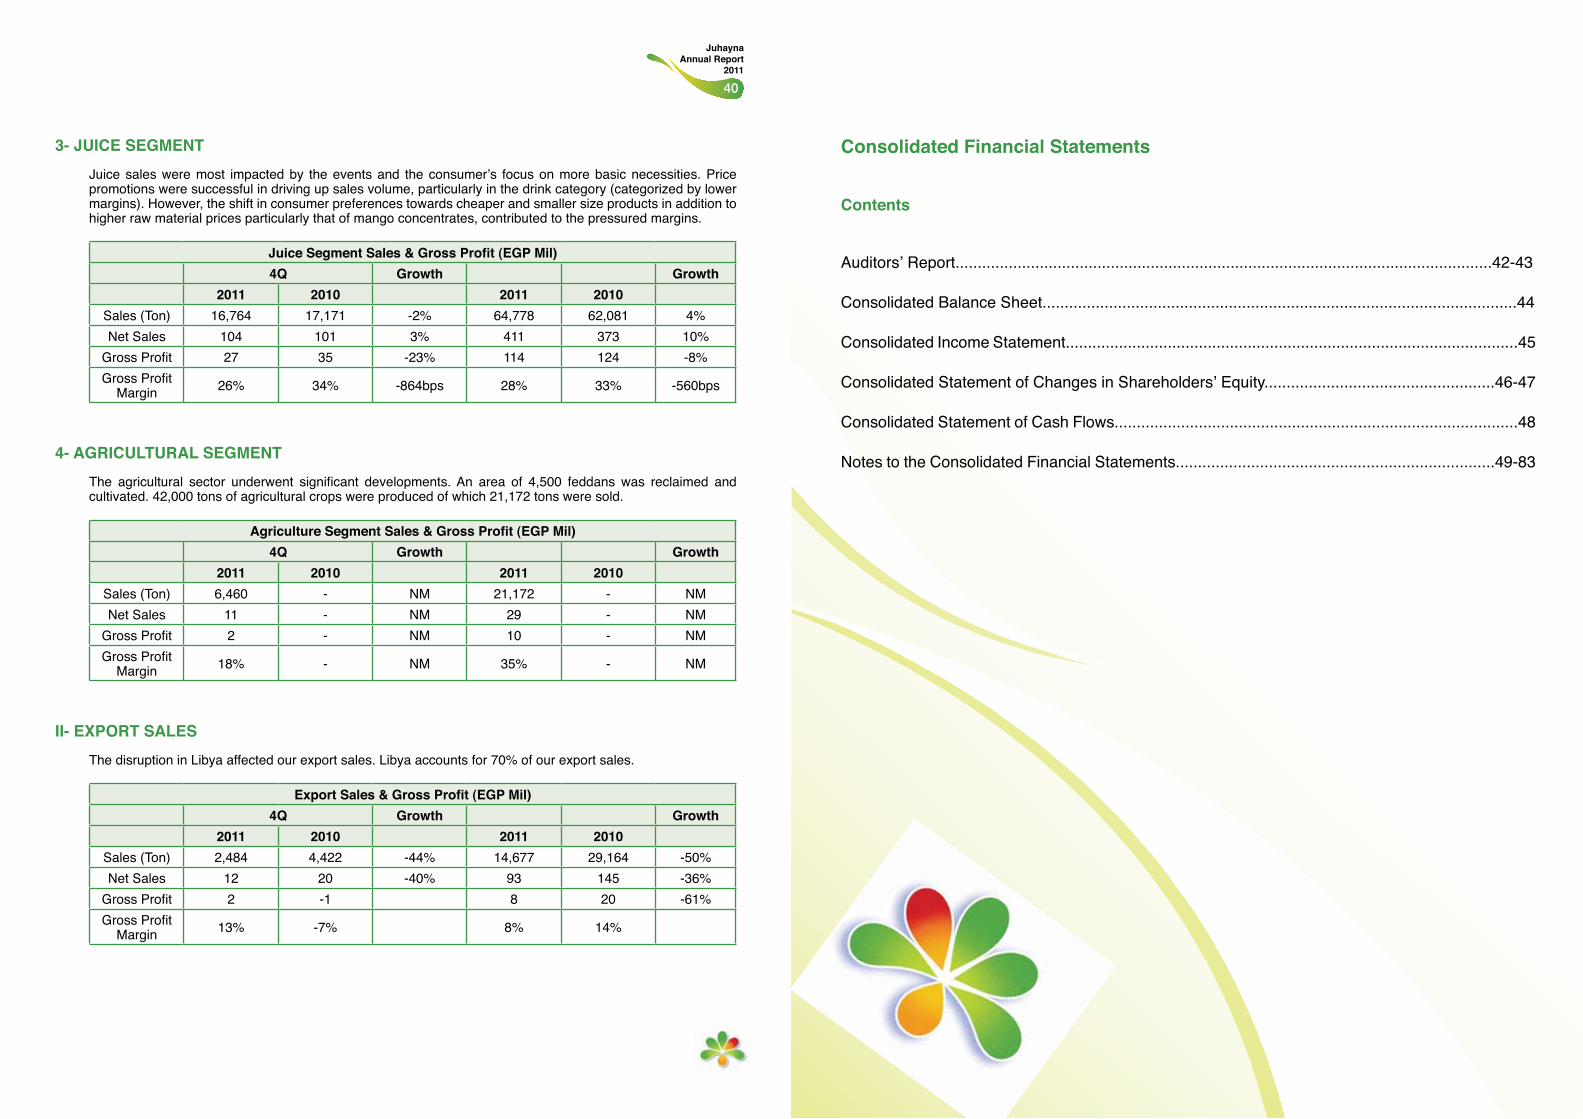
3- JUICE SEGMENTJuice sales were most impacted by the events and the consumer’s focus on more basic necessities. Price promotions were successful in driving up sales volume, particularly in the drink category (categorized by lower margins). However, the shift in consumer preferences towards cheaper and smaller size products in addition to higher raw material prices particularly that of mango concentrates, contributed to the pressured margins.
Juice Segment Sales & Gross Profit (EGP Mil)4Q Growth Growth
2011 2010 2011 2010Sales (Ton) 16,764 17,171 -2% 64,778 62,081 4%Net Sales 104 101 3% 411 373 10%
Gross Profit 27 35 -23% 114 124 -8%Gross Profit
Margin 26% 34% -864bps 28% 33% -560bps
4- AGRICULTURAL SEGMENTThe agricultural sector underwent significant developments. An area of 4,500 feddans was reclaimed and cultivated. 42,000 tons of agricultural crops were produced of which 21,172 tons were sold.
Agriculture Segment Sales & Gross Profit (EGP Mil)4Q Growth Growth
2011 2010 2011 2010Sales (Ton) 6,460 - NM 21,172 - NMNet Sales 11 - NM 29 - NM
Gross Profit 2 - NM 10 - NMGross Profit
Margin 18% - NM 35% - NM
II- EXPORT SALESThe disruption in Libya affected our export sales. Libya accounts for 70% of our export sales.
Export Sales & Gross Profit (EGP Mil)4Q Growth Growth
2011 2010 2011 2010Sales (Ton) 2,484 4,422 -44% 14,677 29,164 -50%Net Sales 12 20 -40% 93 145 -36%
Gross Profit 2 -1 8 20 -61%Gross Profit
Margin 13% -7% 8% 14%
Consolidated Financial Statements
Contents
Auditors’ Report.........................................................................................................................42-43
Consolidated Balance Sheet...........................................................................................................44
Consolidated Income Statement......................................................................................................45
Consolidated Statement of Changes in Shareholders’ Equity....................................................46-47
Consolidated Statement of Cash Flows...........................................................................................48
Notes to the Consolidated Financial Statements........................................................................49-83
4342
Juhayna Annual Report 2011
Juhayna Annual Report
2011
KPMG Hazem HassanPublic Accountants & Consultancies
Pyramids Heights Office ParkKm 22 Cairo/Alex Road
Giza- Cairo – Egypt
Mohamed Helal – Grant ThorntonPublic Accountants
A member of Grant Thornton international87 Ramsis St., Cairo
AUDITORS’ REPORT
The Shareholders of Juhayna Food Industries Company
“An Egyptian Joint Stock Company”
Report on the consolidated financial statements
We have audited the accompanying consolidated financial statements of Juhayna Food Industries Company ”An Egyptian Joint Stock Company“, which comprise the consolidated balance sheet as at 31 December 2011 and the consolidated statements of income, changes in shareholders’ equity, and cash flows for the financial year then ended, and a summary of significant accounting policies and other explanatory notes.
Management’s responsibility for the consolidated financial statements
These consolidated financial statements are the responsibility of Company’s management. Management is responsible for the preparation and fair presentation of these consolidated financial statements in accordance with the Egyptian Accounting Standards and in the light of the prevailing Egyptian laws, management responsibility includes: designing, implementing and maintaining internal control relevant to the preparation and fair presentation of the consolidated financial statements that are free from material misstatement, whether due to fraud or error; management responsibility also includes selecting and applying appropriate accounting policies; and making accounting estimates that are reasonable in the circumstances.
Auditor’s responsibility
Our responsibility is to express an opinion on these consolidated financial statements based on our audit. We conducted our audit in accordance with the Egyptian Standards on Auditing and in the light of the prevailing Egyptian laws. Those standards require that we comply with ethical requirements and plan and perform the audit to obtain reasonable assurance whether the financial statements are free from material misstatement.
An audit involves performing procedures to obtain audit evidence about the amounts and disclosures in the financial statements. The procedures selected depend on the auditor’s judgment, including the assessment of the risks of material misstatement of the financial statements, whether due to fraud or error. In making those risk assessments, the auditor considers internal control relevant to the entity’s preparation and fair presentation of the financial statements in order to design audit procedures that are appropriate in the circumstances, but not for the purpose of expressing an opinion on the effectiveness of the entity’s internal control. An audit also includes evaluating the appropriateness of accounting policies used and the reasonableness of accounting estimates made by management, as well as evaluating the overall presentation of the financial statements.
We believe that the audit evidence we have obtained is sufficient and appropriate to provide a basis for our audit opinion on the consolidated financial statements.
Opinion
In our opinion, the consolidated financial statements referred to above present fairly, in all material respects, the consolidated financial position of Juhayna Food Industries Company as at 31 December 2011, and of its financial performance and its cash flows for the year then ended in accordance with the Egyptian Accounting Standards and the Egyptian laws and regulations relating to the preparation of these consolidated financial statements.
Cairo 6 March, 2012
Mohamed Helal Grant Thornton
KPMG Hazem Hassan
4544
Juhayna Annual Report 2011
Juhayna Annual Report
2011
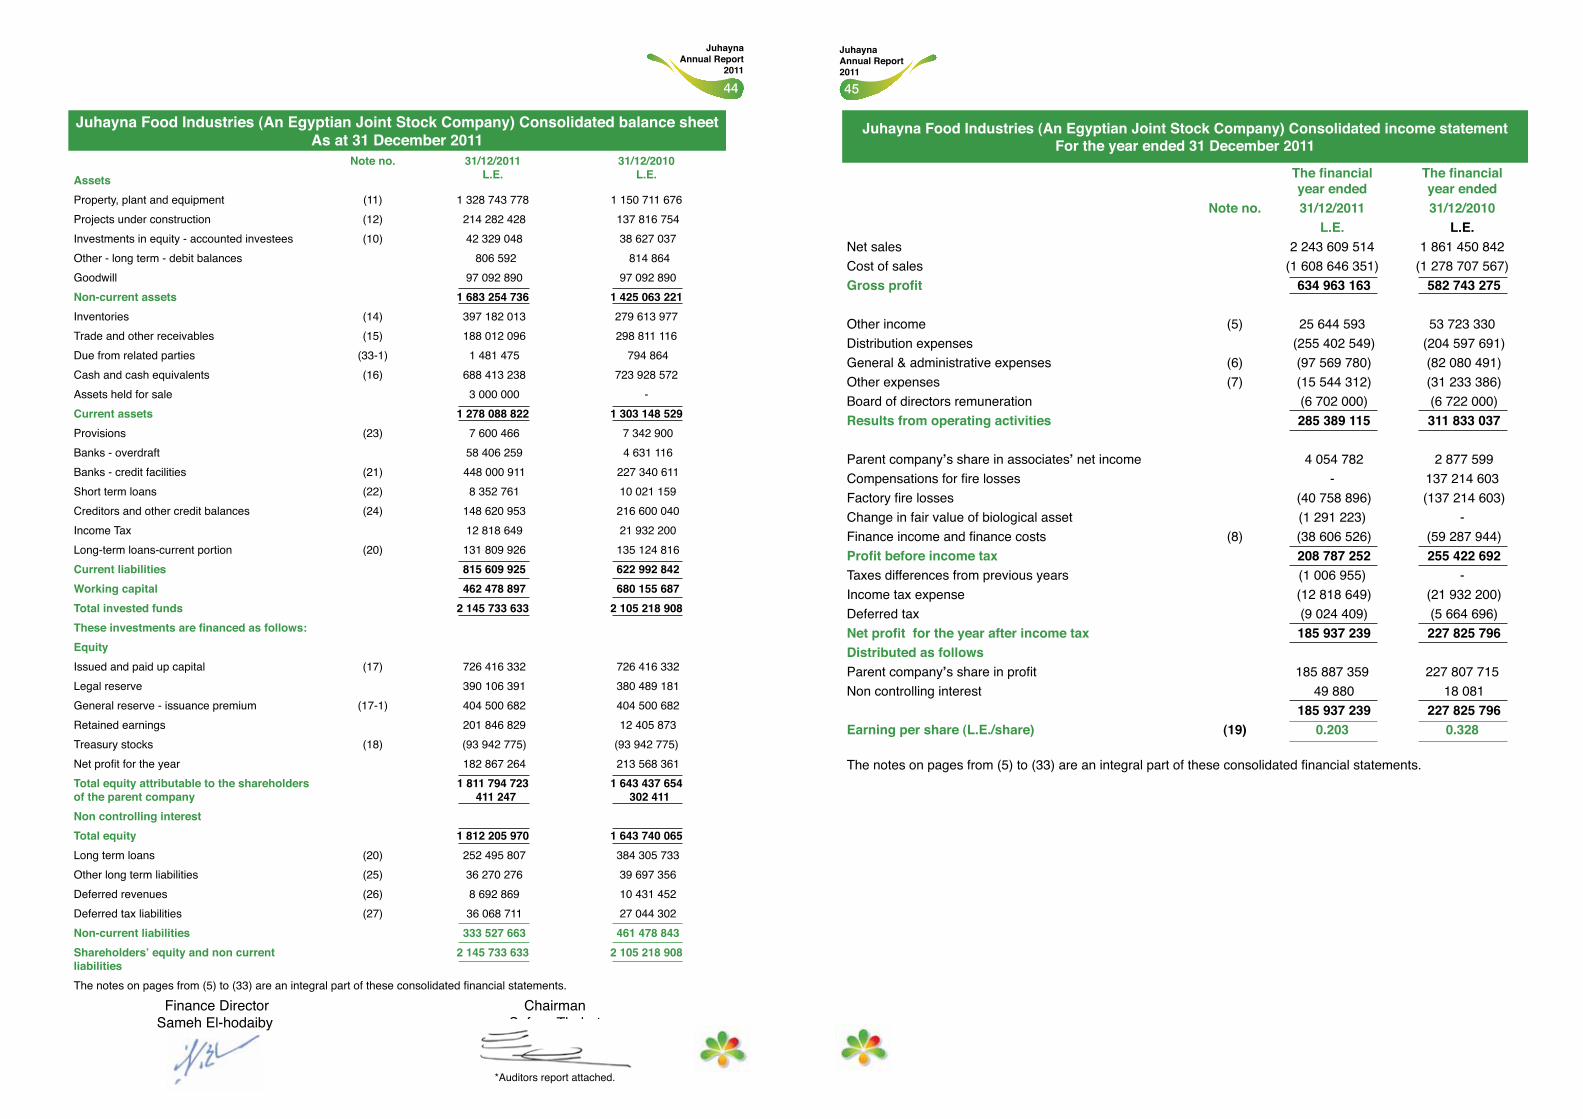
Juhayna Food Industries (An Egyptian Joint Stock Company) Consolidated balance sheet As at 31 December 2011
Note no. 31/12/2011L.E.
31/12/2010L.E.Assets
Property, plant and equipment (11) 1 328 743 778 1 150 711 676Projects under construction (12) 214 282 428 137 816 754Investments in equity - accounted investees (10) 42 329 048 38 627 037Other - long term - debit balances 806 592 814 864Goodwill 97 092 890 97 092 890Non-current assets 1 683 254 736 1 425 063 221Inventories (14) 397 182 013 279 613 977Trade and other receivables (15) 188 012 096 298 811 116Due from related parties (33-1) 1 481 475 794 864Cash and cash equivalents (16) 688 413 238 723 928 572Assets held for sale 3 000 000 -Current assets 1 278 088 822 1 303 148 529Provisions (23) 7 600 466 7 342 900Banks - overdraft 58 406 259 4 631 116Banks - credit facilities (21) 448 000 911 227 340 611Short term loans (22) 8 352 761 10 021 159Creditors and other credit balances (24) 148 620 953 216 600 040Income Tax 12 818 649 21 932 200Long-term loans-current portion (20) 131 809 926 135 124 816Current liabilities 815 609 925 622 992 842Working capital 462 478 897 680 155 687Total invested funds 2 145 733 633 2 105 218 908These investments are financed as follows:EquityIssued and paid up capital (17) 726 416 332 726 416 332Legal reserve 390 106 391 380 489 181General reserve - issuance premium (17-1) 404 500 682 404 500 682Retained earnings 201 846 829 12 405 873Treasury stocks (18) (93 942 775) (93 942 775)Net profit for the year 182 867 264 213 568 361Total equity attributable to the shareholders of the parent company
1 811 794 723 411 247
1 643 437 654 302 411
Non controlling interest Total equity 1 812 205 970 1 643 740 065Long term loans (20) 252 495 807 384 305 733Other long term liabilities (25) 36 270 276 39 697 356Deferred revenues (26) 8 692 869 10 431 452Deferred tax liabilities (27) 36 068 711 27 044 302Non-current liabilities 333 527 663 461 478 843Shareholders’ equity and non current liabilities
2 145 733 633 2 105 218 908
The notes on pages from (5) to (33) are an integral part of these consolidated financial statements.
Finance Director Sameh El-hodaiby
ChairmanSafwanThabet
*Auditors report attached.
Juhayna Food Industries (An Egyptian Joint Stock Company) Consolidated income statement For the year ended 31 December 2011
The financial year ended
The financial year ended
Note no. 31/12/2011 31/12/2010L.E. L.E.
Net sales 2 243 609 514 1 861 450 842Cost of sales (1 608 646 351) (1 278 707 567)Gross profit 634 963 163 582 743 275
Other income (5) 25 644 593 53 723 330Distribution expenses (255 402 549) (204 597 691)General & administrative expenses (6) (97 569 780) (82 080 491)Other expenses (7) (15 544 312) (31 233 386)Board of directors remuneration (6 702 000) (6 722 000)Results from operating activities 285 389 115 311 833 037
Parent company’s share in associates’ net income 4 054 782 2 877 599 Compensations for fire losses - 137 214 603Factory fire losses (40 758 896) (137 214 603)Change in fair value of biological asset (1 291 223) -Finance income and finance costs (8) (38 606 526) (59 287 944)Profit before income tax 208 787 252 255 422 692 Taxes differences from previous years (1 006 955) -Income tax expense (12 818 649) (21 932 200)Deferred tax (9 024 409) (5 664 696)Net profit for the year after income tax 185 937 239 227 825 796 Distributed as followsParent company’s share in profit 185 887 359 227 807 715Non controlling interest 49 880 18 081
185 937 239 227 825 796 Earning per share (L.E./share) (19) 0.203 0.328
The notes on pages from (5) to (33) are an integral part of these consolidated financial statements.
4746
Juhayna Annual Report 2011
Juhayna Annual Report
2011
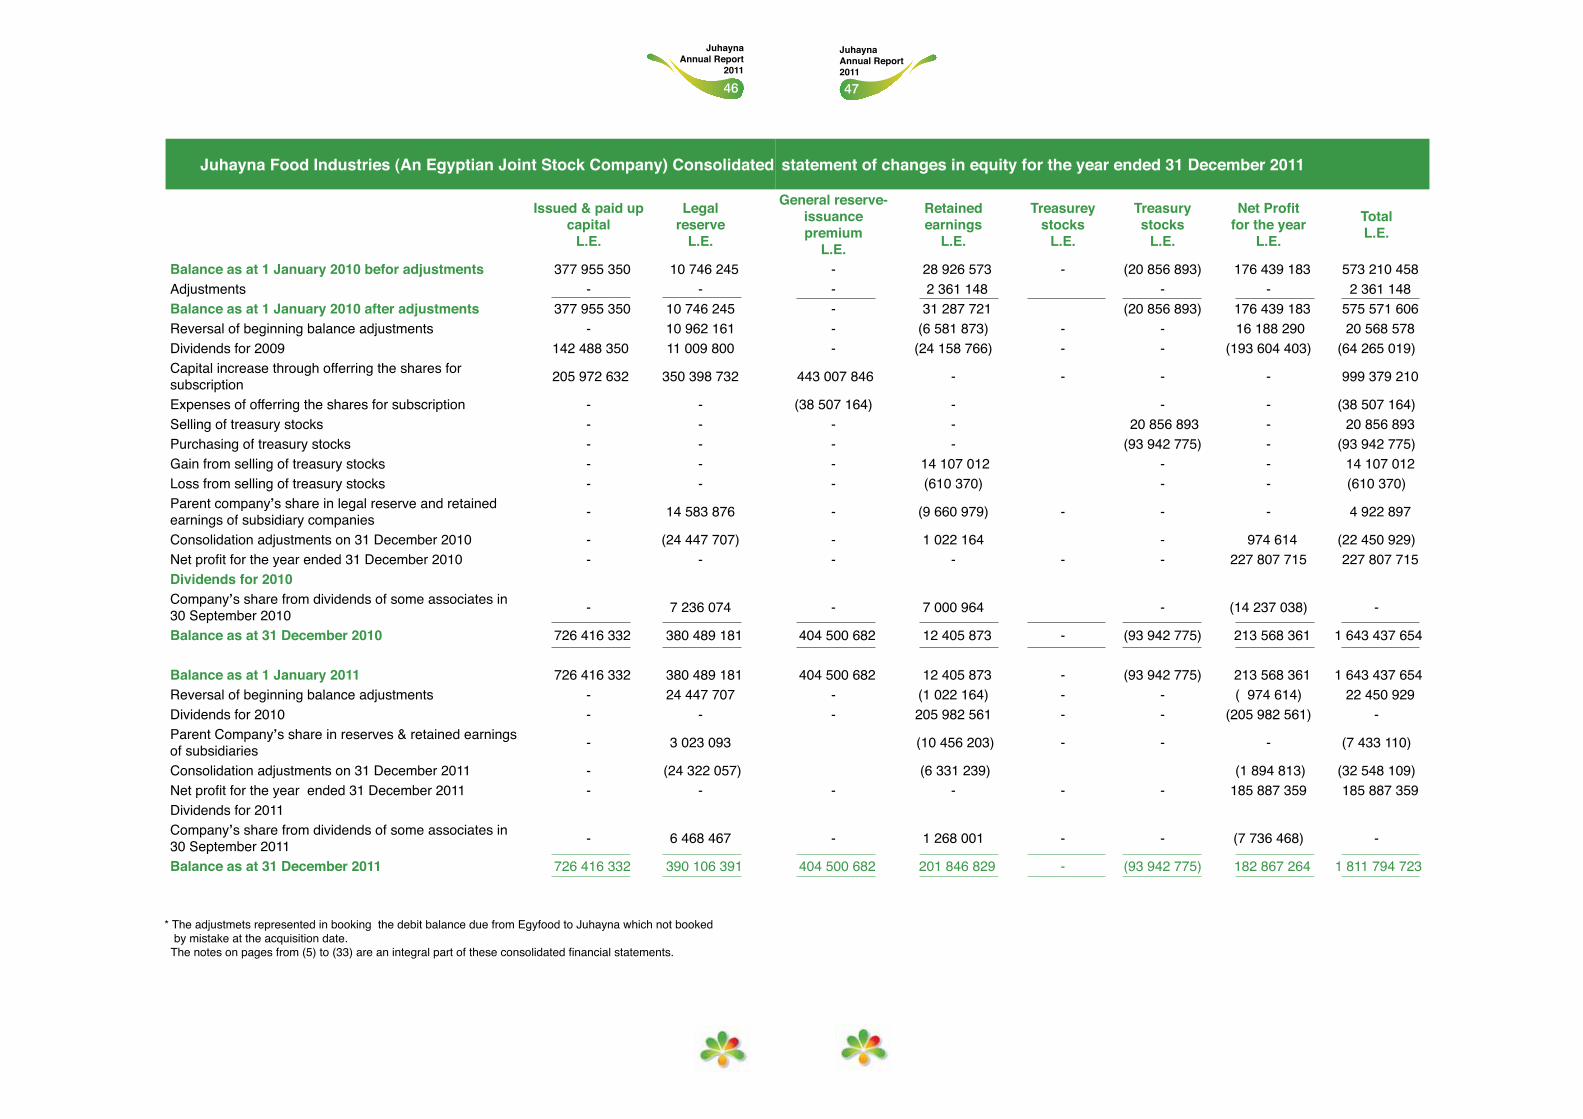
* The adjustmets represented in booking the debit balance due from Egyfood to Juhayna which not booked by mistake at the acquisition date. The notes on pages from (5) to (33) are an integral part of these consolidated financial statements.
statement of changes in equity for the year ended 31 December 2011
Issued & paid upcapital
L.E.
General reserve-issuance premium
L.E.
Retained earnings
L.E.
Treasureystocks
L.E.
Treasurystocks
L.E.
Net Profitfor the year
L.E.
TotalL.E.
Balance as at 1 January 2010 befor adjustments 377 955 350 - 28 926 573 - (20 856 893) 176 439 183 573 210 458Adjustments - - 2 361 148 - - 2 361 148Balance as at 1 January 2010 after adjustments 377 955 350 - 31 287 721 (20 856 893) 176 439 183 575 571 606Reversal of beginning balance adjustments - - (6 581 873) - - 16 188 290 20 568 578Dividends for 2009 142 488 350 - (24 158 766) - - (193 604 403) (64 265 019)Capital increase through offerring the shares for subscription 205 972 632 443 007 846 - - - - 999 379 210
Expenses of offerring the shares for subscription - (38 507 164) - - - (38 507 164)Selling of treasury stocks - - - 20 856 893 - 20 856 893Purchasing of treasury stocks - - - (93 942 775) - (93 942 775)Gain from selling of treasury stocks - - 14 107 012 - - 14 107 012Loss from selling of treasury stocks - - (610 370) - - (610 370)Parent company›s share in legal reserve and retained earnings of subsidiary companies - - (9 660 979) - - - 4 922 897
Consolidation adjustments on 31 December 2010 - - 1 022 164 - 974 614 (22 450 929)Net profit for the year ended 31 December 2010 - - - - - 227 807 715 227 807 715Dividends for 2010Company›s share from dividends of some associates in 30 September 2010 - - 7 000 964 - (14 237 038) -
Balance as at 31 December 2010 726 416 332 404 500 682 12 405 873 - (93 942 775) 213 568 361 1 643 437 654
Balance as at 1 January 2011 726 416 332 404 500 682 12 405 873 - (93 942 775) 213 568 361 1 643 437 654Reversal of beginning balance adjustments - - (1 022 164) - - ( 974 614) 22 450 929Dividends for 2010 - - 205 982 561 - - (205 982 561) -Parent Company›s share in reserves & retained earnings of subsidiaries - (10 456 203) - - - (7 433 110)
Consolidation adjustments on 31 December 2011 - (6 331 239) (1 894 813) (32 548 109)Net profit for the year ended 31 December 2011 - - - - - 185 887 359 185 887 359Dividends for 2011Company›s share from dividends of some associates in 30 September 2011 - - 1 268 001 - - (7 736 468) -
Balance as at 31 December 2011 726 416 332 404 500 682 201 846 829 - (93 942 775) 182 867 264 1 811 794 723
Juhayna Food Industries (An Egyptian Joint Stock Company) Consolidated
Issued & paid upcapital
L.E.
Legalreserve
L.E.
Retained earnings
L.E.
Treasureystocks
L.E.
Treasurystocks
L.E.
Net Profitfor the year
L.E.
TotalL.E.
Balance as at 1 January 2010 befor adjustments 377 955 350 10 746 245 28 926 573 - ( 20 856 893) 176 439 183 573 210 458Adjustments - - 2 361 148 - - 2 361 148Balance as at 1 January 2010 after adjustments 377 955 350 10 746 245 31 287 721 ( 20 856 893) 176 439 183 575 571 606Reversal of beginning balance adjustments - 10 962 161 (6 581 873) - - 16 188 290 20 568 578Dividends for 2009 142 488 350 11 009 800 (24 158 766) - - (193 604 403) ( 64 265 019)Capital increase through offerring the shares for subscription 205 972 632 350 398 732 - - - - 999 379 210
Expenses of offerring the shares for subscription - - - - - ( 38 507 164)Selling of treasury stocks - - - 20 856 893 - 20 856 893Purchasing of treasury stocks - - - ( 93 942 775) - ( 93 942 775)Gain from selling of treasury stocks - - 14 107 012 - - 14 107 012Loss from selling of treasury stocks - - ( 610 370) - - ( 610 370)Parent company’s share in legal reserve and retained earnings of subsidiary companies - 14 583 876 (9 660 979) - - - 4 922 897
Consolidation adjustments on 31 December 2010 - (24 447 707) 1 022 164 - 974 614 ( 22 450 929)Net profit for the year ended 31 December 2010 - - - - - 227 807 715 227 807 715Dividends for 2010Company’s share from dividends of some associates in 30 September 2010 - 7 236 074 7 000 964 - (14 237 038) -
Balance as at 31 December 2010 726 416 332 380 489 181 12 405 873 - ( 93 942 775) 213 568 361 1 643 437 654
Balance as at 1 January 2011 726 416 332 380 489 181 12 405 873 - ( 93 942 775) 213 568 361 1 643 437 654Reversal of beginning balance adjustments - 24 447 707 ( 1 022 164) - - ( 974 614) 22 450 929Dividends for 2010 - - 205 982 561 - - (205 982 561) -Parent Company’s share in reserves & retained earnings of subsidiaries - 3 023 093 (10 456 203) - - - ( 7 433 110)
Consolidation adjustments on 31 December 2011 - (24 322 057) (6 331 239) (1 894 813) ( 32 548 109)Net profit for the year ended 31 December 2011 - - - - - 185 887 359 185 887 359Dividends for 2011Company’s share from dividends of some associates in 30 September 2011 - 6 468 467 1 268 001 - - (7 736 468) -
Balance as at 31 December 2011 726 416 332 390 106 391 201 846 829 - ( 93 942 775) 182 867 264 1 811 794 723

4948
Juhayna Annual Report 2011
Juhayna Annual Report
2011
Juhayna Food Industries (An Egyptian Joint Stock Company) Consolidated state-ment of cash flows For the year ended 31 December 2011
The Financial year ended31/12/2011
L.E.
The Financial year ended31/12/2010
L.E.
Note no.
Cash flows from operating activitiesProfit for the period before income tax 208 787 252 255 422 692 Adjustments for:Fixed assets’ depreciation 138 565 308 126 340 692Capital gains (7 259 884) (19 263 094)Factory fire losses (Egyfood) 40 758 896 -Impairment in fixed assets 216 512 522 851Reversal of impairment in fixed assets (113 425) -Change in Investments in equity accounted investees (investments in associates) (3 702 011) -
Change in fair value of biological asset 1 291 223 -Impairment in debtors and other debit balances 1 483 707 11 128 308Reversal of impairment in debtors and other debit balances (461 231) (881 582)
Write down of inventories 341 807 1 203 298Reversal of write down of inventories - (3 663 102)Provision for claims-formed 689 414 4 360 000Provision for claims-used (431 848) (5 827 131)Financial lease installments 12 101 325 12 101 325Time deposits interests (48 012 541) -Finance interests & expenses 83 733 952 86 041 420
427 988 456 467 485 677Changes in:Inventories (119 201 066) (58 956 114)Changes in debtors & other debit balances 67 418 154 46 974 193Due from related parties (865 760) 2 149 999Creditors & other credit balances (112 575 953) (66 725 027)Due to related parties - (145 201)Collected time deposits interests 46 649 656 -Paid finance interests & expenses (84 642 925) (84 253 458)Provision for claims - usedNet cash flows from operating activities 224 770 562 306 530 069
Cash flows from investing activitiesAcquisition of fixed assets & projects under construction (404 347 212) (287 753 287)
Proceeds from sale of fixed assets 18 440 925 39 018 178Change in investments in subsidiaries - 14 985 000Net cash flows used in investing activities (385 906 287) (233 750 109)Cash flows from financing activitiesProceeds from capital increase - 999 379 210proceeds /payment for bank credit facilities 220 660 300 (120 689 551)Payment for bank loans (136 793 214) (156 474 144)Payments for lease installments- sale with the right of lease back (12 101 325) (12 101 325)
Expenses of offerring the shares for subscription - (38 507 164)Change in other long-term debit balances - (814 864)Payments for purchase of treasurey stocks - (99 509 048)Proceeds from sale of treasurey stocks - 34 963 903Dividends paid - (26 398 293)Increase in minority interest 108 836 (249 526)Net cash flows from financing activities 71 874 597 579 599 198Change in cash & cash equivalents during the year (89 261 128) 652 379 158
Cash & cash equivalents at 1 January 714 168 107 61 788 949Cash & cash equivalents at 31 December (16) 624 906 979 714 168 107
The notes on pages from (5) to (33) are an integral part of these consolidated financial statements.
Juhayna Food Industries
(An Egyptian Joint Stock Company)
Notes to the consolidated financial statements
For the financial year ended 31 December 2011
1 Reporting the entityThe Company was established in 1995 according to the Investment Law No.(230) of 1989 as replaced by the investment incentives and guarantees law No. (8) Of 1997 and the decree of the Minister of Economic and Foreign Trade No. 636 of 1994 approving the Company’s establishment.The Company was registered in the commercial registry under No. 100994 on 10/1/1995. Company’s period is 25 years starting from the date of registration in the commercial registry.The Company is domiciled in Egypt. The address of the Company’s registered office is 11 Al Jihad Street- Lebanon Square- Al Mohandessien, and the address of the company’s factories is 6th of October City- First Industrial Zone- piece no. 39 and 40, Arab Republic of Egypt. Mr. Safwan Thabet is the Chairman of the Board of Directors. The Company is considered a holding Company.
The Company’s purpose
The Company primarily is involved in the production, manufacture, packaging and packing of all types of dairy, products and all its derivatives, all types of cheeses, fruit juices, drinks and frozen material, preparing, manufacturing, packaging and packing all types of food materials and in general manufacturing of agriculture products. Registration in the Stock Exchange
The Company is listed in [1] of Egyptian Stock Exchanges.
2 Basis of preparation2-1 Statement of compliance
The financial statements have been prepared in accordance with Egyptian Accounting Standards (“EAS”), and in the light of prevailing Egyptian laws.The financial statements were authorised for issue by the Board of Directors on 4/3/2012.
2-2 Basis of measurement
The consolidated financial statements have been prepared on the historical cost basis except for the following material items in the balance sheet.
Non-derivative financial liabilities (note 4-1).Biological assets and Agricultural crops for fair value (note 4-2).The methods used to measure fair values are discussed further in note (4).
2-3 Functional and presentation currency
These consolidated financial statements are presented in Egyptian pound, which is the Company’s and its subsidiaries’ functional currency.
2-4 Use of estimates and judgments
The preparation of financial statements in conformity with Egyptian Accounting Standards requires management to make judgments, estimates and assumptions that affect the application of accounting policies and the reported
5150
Juhayna Annual Report 2011
Juhayna Annual Report
2011
amounts of assets, liabilities, income and expenses. Actual results may differ from these estimates. Estimates and underlying assumptions are reviewed on an ongoing basis. Revisions to accounting estimates are recognized in the year in which the estimate is revised and in any future periods affected. Information about critical judgments in applying accounting policies that have the most significant effect on the amounts recognised in the financial statements is included in the following notes:• Note (3-8): lease classification. Information about assumptions and estimation uncertainties that have a significant risk of resulting in a material adjustment within the next financial statements are included in the following notes:• Note (14): property, plant and equipment.• Note (15): impairment of trade and notes receivable.• Note (31): provisions.• Note (27): deferred tax.
3 Significant accounting policiesThe accounting policies set out below have been applied consistently to all periods presented in these consolidated financial statements.
3-1 Basis of consolidation
SubsidiariesSubsidiaries are entities controlled by the Company. When assessing the extent of control it is taken into consideration the current and potential voting rights in the date of preparation of the consolidated financial statements.
Investments in equity accounted investees (associates)Associates are those entities in which the Company has significant influence, but not control, over the financial and operating policies. Associates are accounted for using the equity method. The consolidated financial statements include the Company’s share of the income and expenses of equity accounted investees, after adjustments to align the accounting policies with those of the Company, from the date that significant influence or joint control commences until the date that significant influence or joint control ceases. When the Company’s share of losses exceeds its interest in an equity accounted investee, the carrying amount of that interest (including any long-term investments) is reduced to nil and the recognition of further losses is discontinued except to the extent that the Company has an obligation or has made payments on behalf of the investee.
Transactions eliminated on consolidationUnrealized losses are eliminated in the same way as unrealized gains, but only to the extent that there is no evidence of impairment.
3-2 Foreign currency
Foreign currency transactionsTransactions in foreign currencies are translated to the respective functional currency at exchange rates at the dates of the transactions. Monetary assets and liabilities denominated in foreign currencies at the reporting date are retranslated to the functional currency at the exchange rate at that date. Non-monetary assets and liabilities denominated in foreign currencies that are measured at fair value are retranslated to the functional currency at the exchange rate at the date that the fair value was determined. Non-monetary items in a foreign currency that are measured in terms of historical cost are translated using the exchange rate at the date of the transaction. Foreign currency differences arising on retranslation are recognised in profit or loss, except for the difference which is recognized in equity arising on the retranslation of:
• Available-for-sale equity investments (except on impairment in which case foreign currency differ ences that have been recognized in equity are reclassified to profit or loss).
3-3 Financial instruments
Non-derivative financial assetsThe Company initially recognises loans and receivables and deposits on the date that they are originated. All other financial assets (including assets designated at fair value through profit or loss) are recognised initially on the trade date, which is date that the Company becomes a party to the contractual provisions of the instrument. The Company derecognises a financial asset when the contractual rights to the cash flows from the asset expire, or it transfers the rights to receive the contractual cash flows on the financial asset in a transaction in which substantially all the risks and rewards of ownership of the financial asset are transferred. Any interest in transferred financial assets that is created or retained by the Company is recognised as a separate asset or liability.
Financial assets and liabilities are offset and the net amount presented in the balance sheet when, and only when, the Company has a legal right to offset the amounts and intends either to settle on a net basis or to realise the asset and settle the liability simultaneously.
The Company classifies non – derivative financial assets into the following categories: financial assets at fair value through profit or loss, held-to-maturity financial assets, loans and receivables and available-for sale financial assets.
ReceivablesReceivables are financial assets with fixed or determinable payments that are not quoted in an active market. Such assets are recognised initially at fair value plus any directly attributable transaction costs. Generally, short-duration trade and other receivables with no stated interest rate are stated at their nominal value (original invoice amount) less an allowance for any doubtful debts. receivables comprise cash and cash equivalents, and trade and other receivables.
Cash and cash equivalents Cash and cash equivalents comprise cash balances and call deposits with original maturities of three months or less from the acquisition date that are subject to an insignificant risk of changes in their fair value, and are used by the Company in the management of its short-term commitments.
Available-for-sale financial assetsAvailable-for-sale financial assets are non-derivative financial assets that are designated as available-for-sale or are not classified in any of the above categories of financial assets. Available-for-sale financial assets are recognized initially at fair value plus any directly attributable transaction costs.Subsequent to initial recognition, they are measured at fair value and changes therein, other than impairment losses and foreign currency differences on available-for-sale debt instruments, presented in fair value reserve in equity. When an investment is derecognised, the gain or loss accumulated in equity is reclassified to profit or loss.Available-for-sale financial assets comprise equity securities and debt securities.
Non-derivative financial liabilitiesThe Company initially recognizes debt securities issued and subordinated liabilities on the date that they are originated. All other financial liabilities (including liabilities designated as at fair value through profit or loss) are recognized initially on the trade date, which is the date that the Company becomes a party to the contractual provisions of the instrument. The Company derecognises a financial liability when its contractual obligations are discharged, cancelled or expire.The Company classifies non – derivative financial liabilities into the other financial liabilities category. Such financial liabilities are recognised initially at the fair value plus any directly attributable transaction costs. Subsequent to initial recognition, these financial liabilities are measured at amortised cost using the effective interest method.Other financial liabilities comprise loans and borrowings, bank overdrafts, and trade and other payables. Generally, trade payables are recorded at their nominal value.
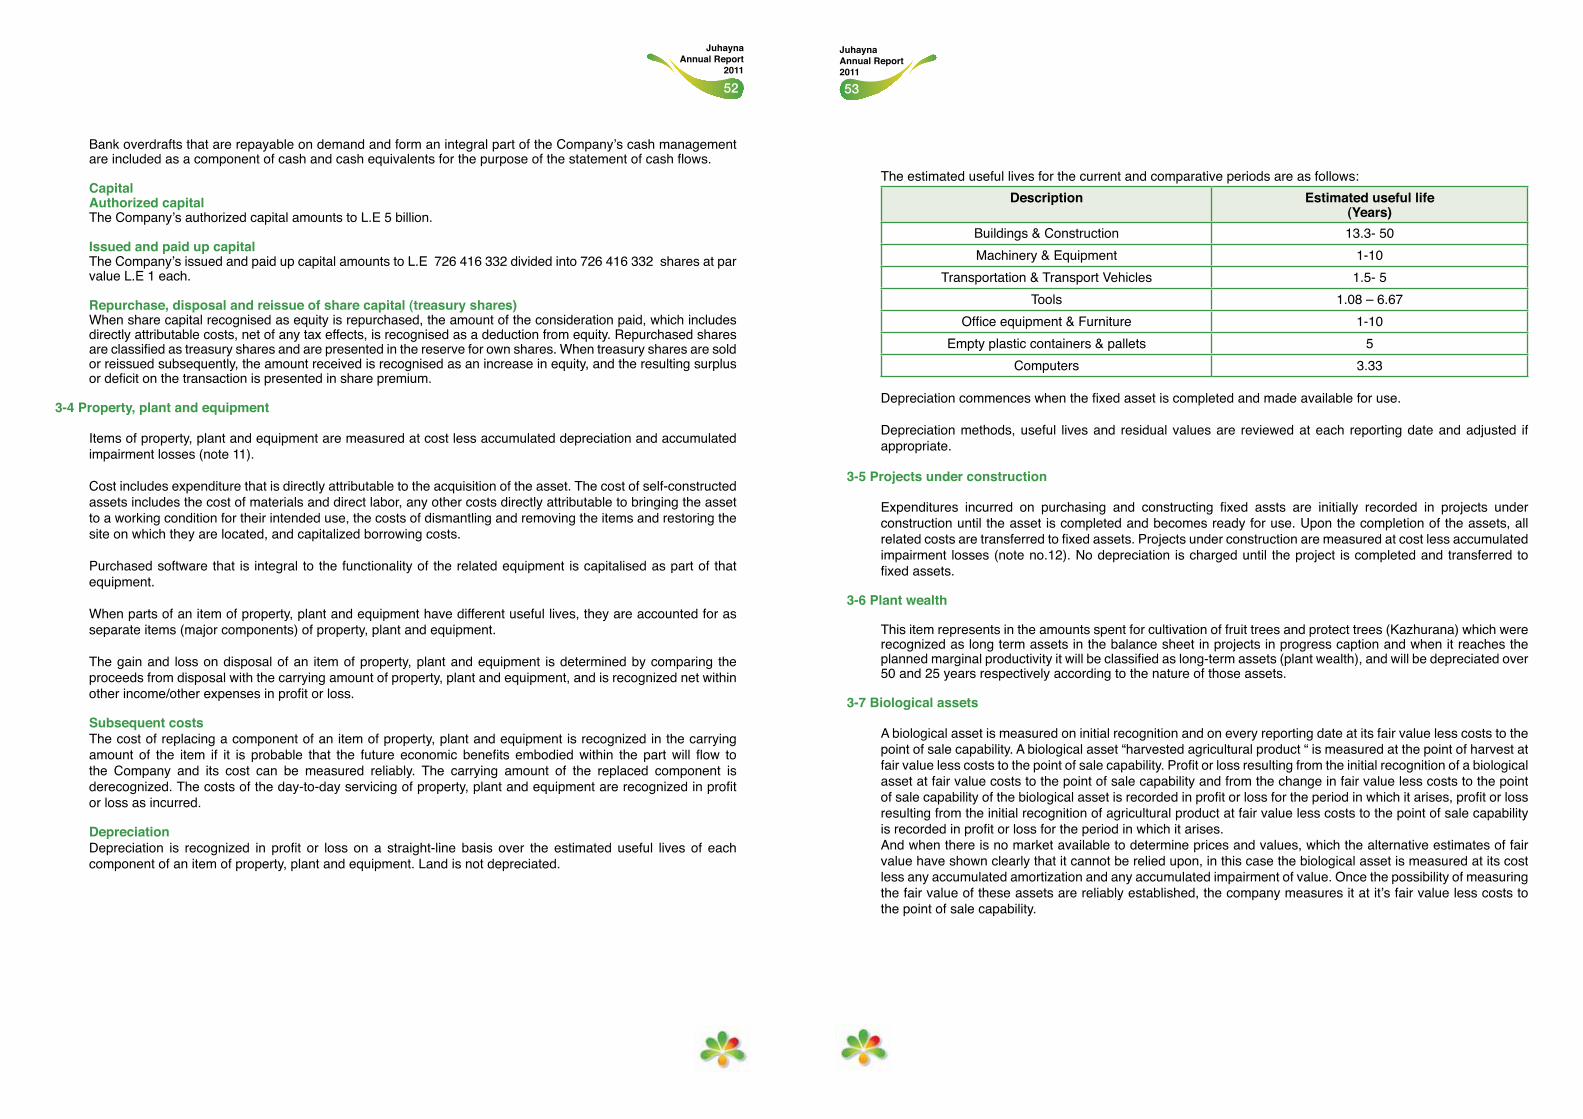
5352
Juhayna Annual Report 2011
Juhayna Annual Report
2011
Bank overdrafts that are repayable on demand and form an integral part of the Company’s cash management are included as a component of cash and cash equivalents for the purpose of the statement of cash flows.
CapitalAuthorized capitalThe Company’s authorized capital amounts to L.E 5 billion.
Issued and paid up capitalThe Company’s issued and paid up capital amounts to L.E 726 416 332 divided into 726 416 332 shares at par value L.E 1 each.
Repurchase, disposal and reissue of share capital (treasury shares)When share capital recognised as equity is repurchased, the amount of the consideration paid, which includes directly attributable costs, net of any tax effects, is recognised as a deduction from equity. Repurchased shares are classified as treasury shares and are presented in the reserve for own shares. When treasury shares are sold or reissued subsequently, the amount received is recognised as an increase in equity, and the resulting surplus or deficit on the transaction is presented in share premium.
3-4 Property, plant and equipment
Items of property, plant and equipment are measured at cost less accumulated depreciation and accumulated impairment losses (note 11).
Cost includes expenditure that is directly attributable to the acquisition of the asset. The cost of self-constructed assets includes the cost of materials and direct labor, any other costs directly attributable to bringing the asset to a working condition for their intended use, the costs of dismantling and removing the items and restoring the site on which they are located, and capitalized borrowing costs.
Purchased software that is integral to the functionality of the related equipment is capitalised as part of that equipment.
When parts of an item of property, plant and equipment have different useful lives, they are accounted for as separate items (major components) of property, plant and equipment.
The gain and loss on disposal of an item of property, plant and equipment is determined by comparing the proceeds from disposal with the carrying amount of property, plant and equipment, and is recognized net within other income/other expenses in profit or loss.
Subsequent costsThe cost of replacing a component of an item of property, plant and equipment is recognized in the carrying amount of the item if it is probable that the future economic benefits embodied within the part will flow to the Company and its cost can be measured reliably. The carrying amount of the replaced component is derecognized. The costs of the day-to-day servicing of property, plant and equipment are recognized in profit or loss as incurred.
DepreciationDepreciation is recognized in profit or loss on a straight-line basis over the estimated useful lives of each component of an item of property, plant and equipment. Land is not depreciated.
The estimated useful lives for the current and comparative periods are as follows:Description Estimated useful life
(Years)Buildings & Construction 13.3- 50Machinery & Equipment 1-10
Transportation & Transport Vehicles 1.5- 5Tools 1.08 – 6.67
Office equipment & Furniture 1-10Empty plastic containers & pallets 5
Computers 3.33
Depreciation commences when the fixed asset is completed and made available for use.
Depreciation methods, useful lives and residual values are reviewed at each reporting date and adjusted if appropriate.
3-5 Projects under construction
Expenditures incurred on purchasing and constructing fixed assts are initially recorded in projects under construction until the asset is completed and becomes ready for use. Upon the completion of the assets, all related costs are transferred to fixed assets. Projects under construction are measured at cost less accumulated impairment losses (note no.12). No depreciation is charged until the project is completed and transferred to fixed assets.
3-6 Plant wealth
This item represents in the amounts spent for cultivation of fruit trees and protect trees (Kazhurana) which were recognized as long term assets in the balance sheet in projects in progress caption and when it reaches the planned marginal productivity it will be classified as long-term assets (plant wealth), and will be depreciated over 50 and 25 years respectively according to the nature of those assets.
3-7 Biological assets
A biological asset is measured on initial recognition and on every reporting date at its fair value less costs to the point of sale capability. A biological asset “harvested agricultural product “ is measured at the point of harvest at fair value less costs to the point of sale capability. Profit or loss resulting from the initial recognition of a biological asset at fair value costs to the point of sale capability and from the change in fair value less costs to the point of sale capability of the biological asset is recorded in profit or loss for the period in which it arises, profit or loss resulting from the initial recognition of agricultural product at fair value less costs to the point of sale capability is recorded in profit or loss for the period in which it arises.And when there is no market available to determine prices and values, which the alternative estimates of fair value have shown clearly that it cannot be relied upon, in this case the biological asset is measured at its cost less any accumulated amortization and any accumulated impairment of value. Once the possibility of measuring the fair value of these assets are reliably established, the company measures it at it’s fair value less costs to the point of sale capability.
5554
Juhayna Annual Report 2011
Juhayna Annual Report
2011
3-8 Leases
Company is the lessee:Leases are classified as operating leases. The costs in respect of operating leases are charged on a straight-line basis over the lease term. The value of any lease incentive received to take on an operating lease (for example, rent-free periods) is recognized as deferred income and is released over the life of the lease.
3-9 Goodwill
Goodwill is initially measured at its cost, being the excess of the cost of the business combination over the Group’s interest in the net fair value of identifiable assets, liabilities and contingent liabilities. After initial recognition, the group measures acquired goodwill at cost less impairment losses. Recognized goodwill impairment losses are not subsequently reversed.
3-10 Inventories
Inventories of raw materials, supplies, packaging & packing materials and spare parts are measured at the lower of cost or net realizable value. The cost of inventories is based on the weighted average principle, and includes expenditure incurred in acquiring the inventories, production or conversion costs and other costs incurred in bringing them to their existing location and condition. Net realizable value is the estimated selling price, in the ordinary course of business, less estimated costs of the completion and selling expenses.
The inventory of work in process is measured at the lower of cost, which is determined based on the lower of the cost last process the work in process reached, or net realizable value.
Finished production is measured at the lower of manufacturing cost or net realizable value. The manufacturing cost comprises raw materials, direct labor, and cost includes an appropriate share of overheads based on normal operating capacity.
3-11 Impairment
Non – derivative financial assetsA financial asset not carried at fair value through profit or loss is assessed at each reporting date to determine whether there is objective evidence that it is impaired. A financial asset is impaired if objective evidence indicates that a loss event has occurred after the initial recognition of the asset, and that the loss event had a negative effect on the estimated future cash flows of that asset that can be estimated reliably.
Non-financial assetsThe carrying amounts of the Company’s non-financial assets, other than biological assets, investment property, inventories and deferred tax assets, are reviewed at each reporting date to determine whether there is any indication of impairment. If any such indication exists, then the asset’s recoverable amount is estimated. For intangible assets that have indefinite useful lives, the recoverable amount is tested annually for impairment.
An impairment loss is recognised if the carrying amount of an asset or cash – generating unit (CGU) exceeds its recoverable amount.
The recoverable amount of an asset or CGU is the greater of its value in use and its fair value less costs to sell. In assessing value in use, the estimated future cash flows are discounted to their present value using a pre-tax discount rate that reflects current market assessments of the time value of money and the risks specific to the asset or CGU. For the purpose of impairment testing, assets are grouped together into the smallest group of assets that generates cash inflows from continuing use that are largely independent of the cash inflows of other assets or CGU.
Impairment losses are recognised in profit or loss. For other assets, an impairment loss is reversed only to the extent that the asset’s carrying amount does not exceed the carrying amount that would have been determined, net of depreciation or amortisation, if no impairment loss had been recognised.
3-12 Defined contribution plans
The Company contributes to the government social insurance system for the benefits of its personnel in accordance with according to the social insurance Law No. 79 of 1975 and its amendments. Under this Law, the employees and the employers contribute into the system on a fixed percentage-of-salaries basis. The Company’s contributions are recognized in income statement using the accrual basis of accounting. The company’s obligation in respect of employees’ pensions is confined to the amount of aforementioned contributions.
3-13 Provisions
A provision is recognised if, as a result of a past event, the Company has a present legal or constructive obligation that can be estimated reliably, and it is probable that an outflow of economic benefits will be required to settle the obligation.
3-14 Revenue
Goods soldRevenue from the sale of goods in the course of ordinary activities is measured at the fair value of the consideration received or receivable, net of returns, trade discounts and volume rebates.
Revenue is recognised when persuasive evidence exists, usually in the form of an executed sales agreement, that the significant risks and rewards of ownership have been transferred to the customer, recovery of the consideration is probable, the associated costs and possible return of goods can be estimated reliably, there is no continuing management involvement with the goods, and the amount of revenue can be measured reliably. If it is probable that discounts will be granted and the amount can be measured reliably, then the discount is recognised as a reduction of revenue as the sales are recognised.
3-15 Finance income and finance costs
Finance income comprises interest income on funds invested (including available-for-sale financial assets), dividend income, gains on the disposal of available-for-sale financial assets, fair value gains on financial assets at fair value through profit or loss. Interest income is recognised as it accrues in profit or loss, using the effective interest method. Dividend income received from investments is recognised in profit or loss on the date of collection.
Finance costs comprise interest expense on borrowings, fair value losses on financial assets at fair value through profit or loss, impairment losses recognized on financial assets.
Borrowing costs that are not directly attributable to the acquisition, construction or production of a qualifying asset are recognized in profit or loss using the effective interest method.
Foreign currency gains and losses are reported on a net basis as either finance income or finance cost depending on whether foreign currency movements are in a net gain or net loss position.
3-16 Income tax
Income tax on profit or loss for the year comprises current and deferred tax. Income tax is recognized in the income statement except to the extent that it relates to items recognized directly on equity, in which case it is recognized in equity. Current tax is the expected tax payable on the taxable income for the year, using tax rates enacted or substantially enacted at the balance sheet date, and any adjustment to tax payable in respect of previous years.
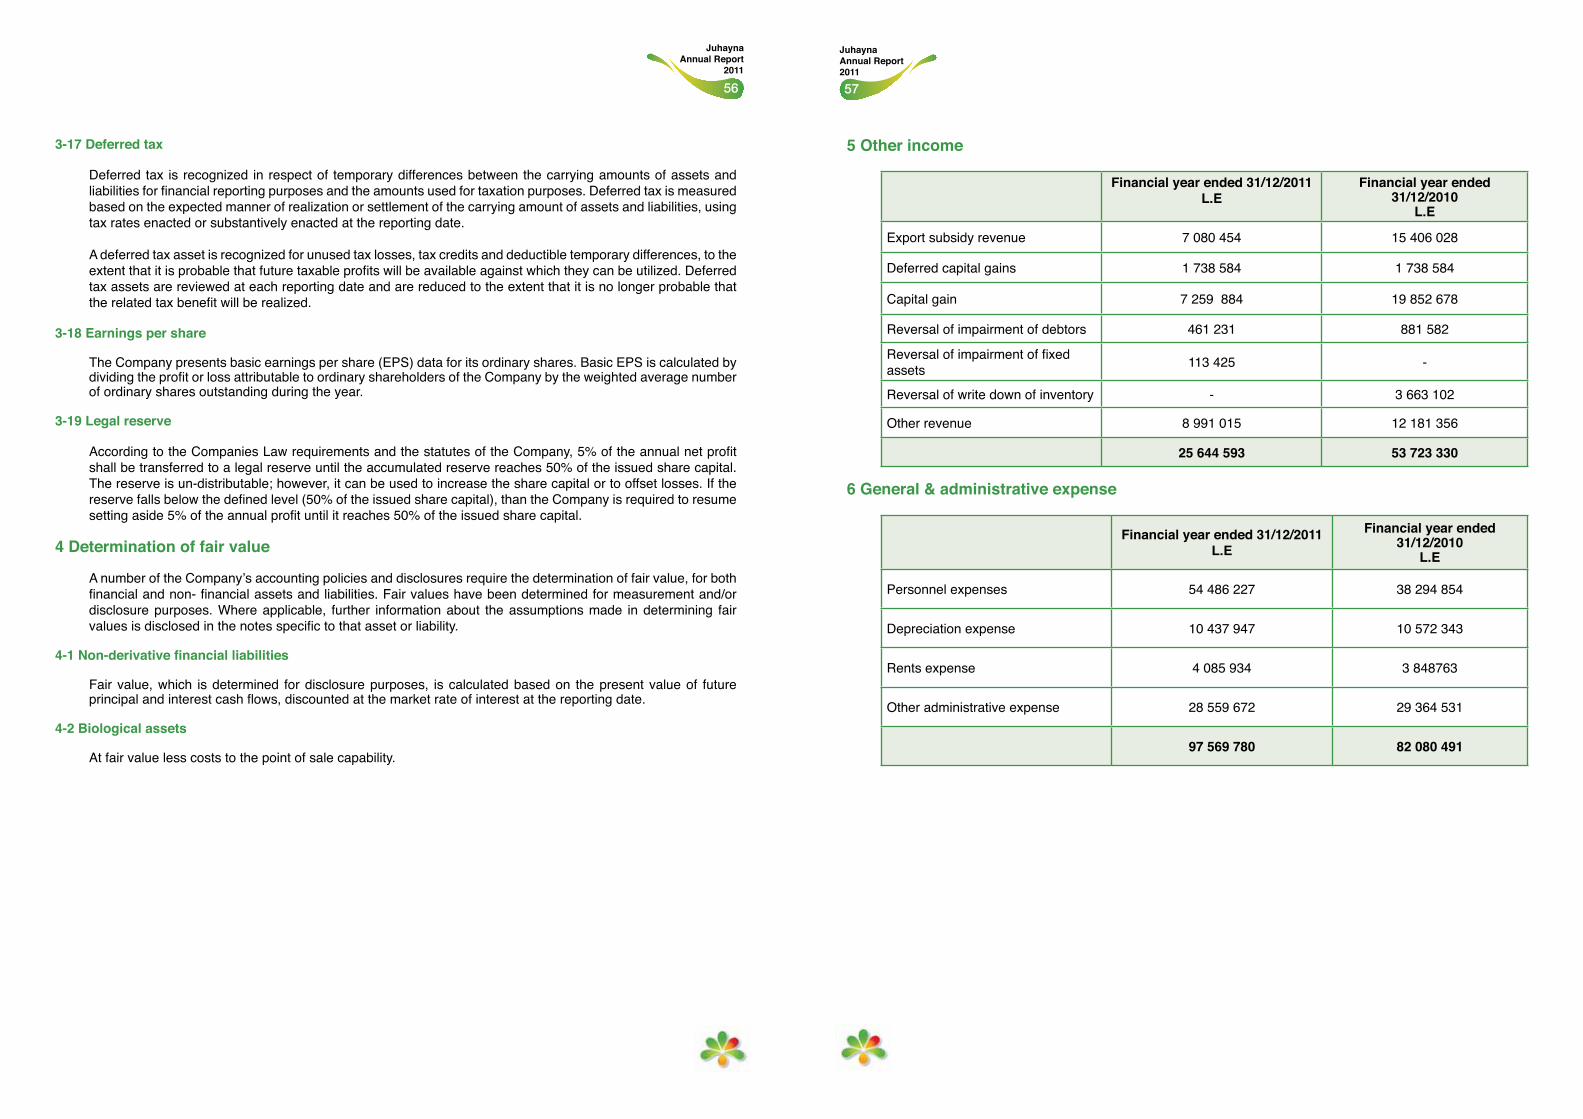
5756
Juhayna Annual Report 2011
Juhayna Annual Report
2011
3-17 Deferred tax
Deferred tax is recognized in respect of temporary differences between the carrying amounts of assets and liabilities for financial reporting purposes and the amounts used for taxation purposes. Deferred tax is measured based on the expected manner of realization or settlement of the carrying amount of assets and liabilities, using tax rates enacted or substantively enacted at the reporting date.
A deferred tax asset is recognized for unused tax losses, tax credits and deductible temporary differences, to the extent that it is probable that future taxable profits will be available against which they can be utilized. Deferred tax assets are reviewed at each reporting date and are reduced to the extent that it is no longer probable that the related tax benefit will be realized.
3-18 Earnings per share
The Company presents basic earnings per share (EPS) data for its ordinary shares. Basic EPS is calculated by dividing the profit or loss attributable to ordinary shareholders of the Company by the weighted average number of ordinary shares outstanding during the year.
3-19 Legal reserve
According to the Companies Law requirements and the statutes of the Company, 5% of the annual net profit shall be transferred to a legal reserve until the accumulated reserve reaches 50% of the issued share capital. The reserve is un-distributable; however, it can be used to increase the share capital or to offset losses. If the reserve falls below the defined level (50% of the issued share capital), than the Company is required to resume setting aside 5% of the annual profit until it reaches 50% of the issued share capital.
4 Determination of fair value
A number of the Company’s accounting policies and disclosures require the determination of fair value, for both financial and non- financial assets and liabilities. Fair values have been determined for measurement and/or disclosure purposes. Where applicable, further information about the assumptions made in determining fair values is disclosed in the notes specific to that asset or liability.
4-1 Non-derivative financial liabilities
Fair value, which is determined for disclosure purposes, is calculated based on the present value of future principal and interest cash flows, discounted at the market rate of interest at the reporting date.
4-2 Biological assets
At fair value less costs to the point of sale capability.
5 Other income
Financial year ended 31/12/2011 L.E
Financial year ended 31/12/2010
L.E
Export subsidy revenue 7 080 454 15 406 028
Deferred capital gains 1 738 584 1 738 584
Capital gain 7 259 884 19 852 678
Reversal of impairment of debtors 461 231 881 582
Reversal of impairment of fixed assets 113 425 -
Reversal of write down of inventory - 3 663 102
Other revenue 8 991 015 12 181 356
25 644 593 53 723 330
6 General & administrative expense
Financial year ended 31/12/2011L.E
Financial year ended 31/12/2010
L.E
Personnel expenses 54 486 227 38 294 854
Depreciation expense 10 437 947 10 572 343
Rents expense 4 085 934 3 848763
Other administrative expense 28 559 672 29 364 531
97 569 780 82 080 491
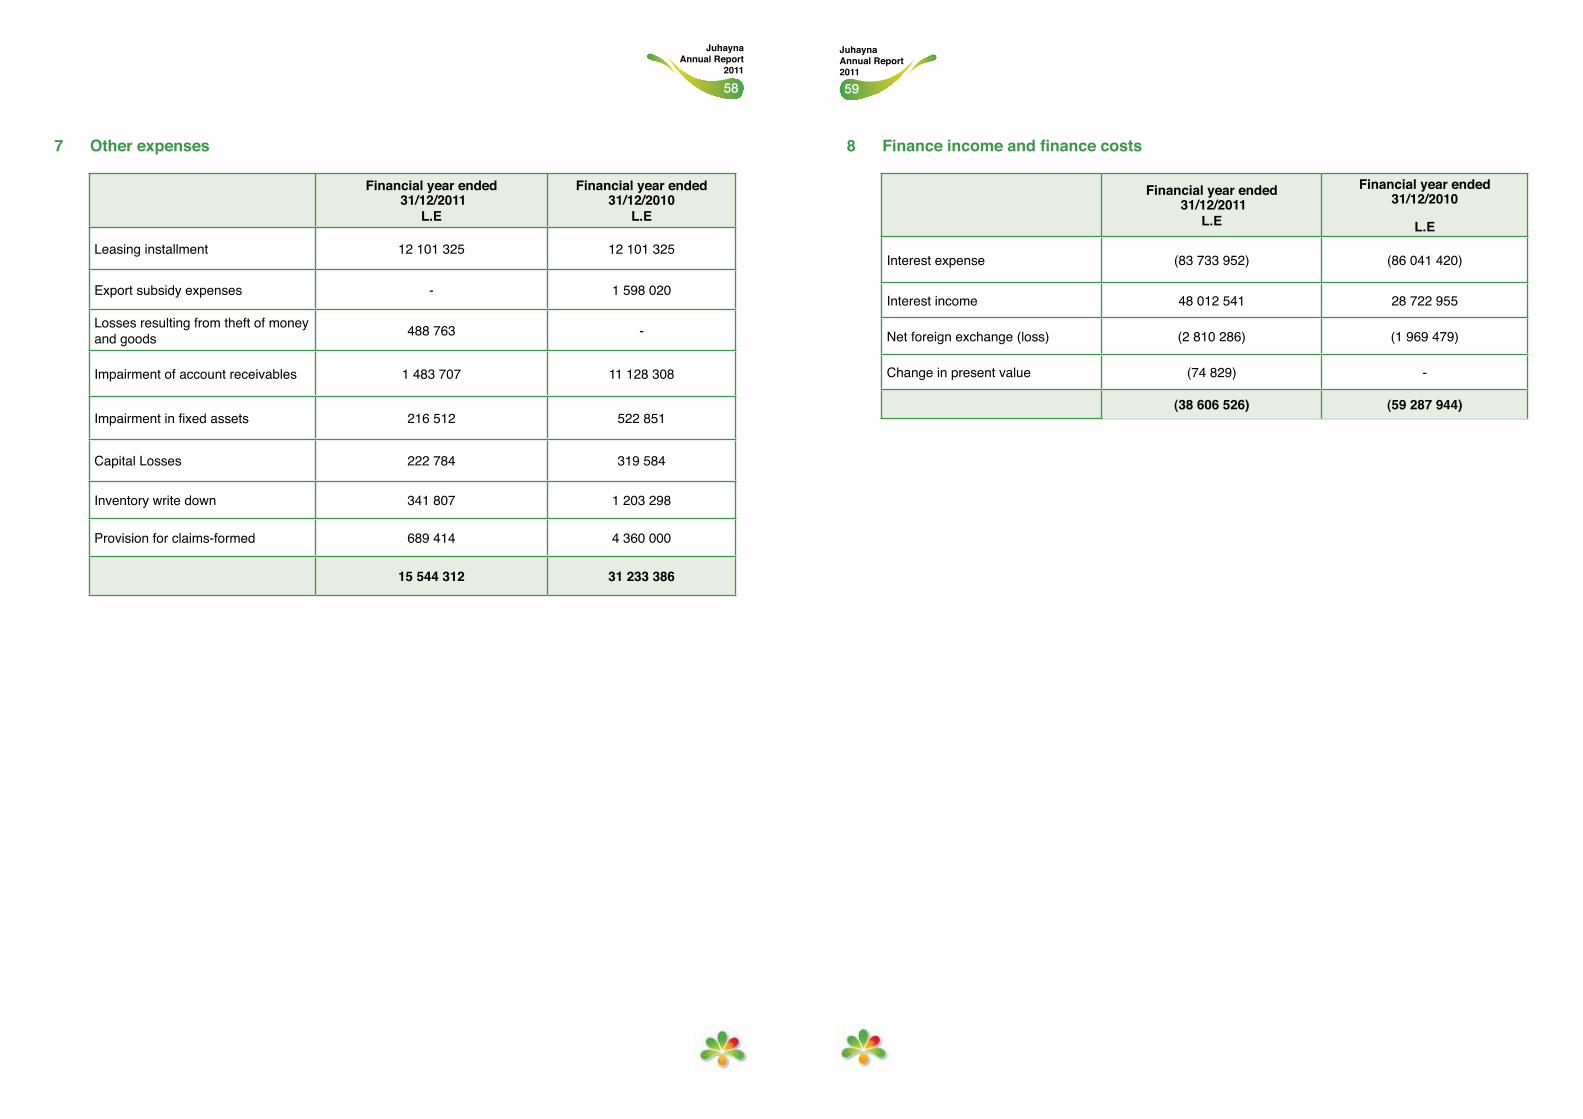
5958
Juhayna Annual Report 2011
Juhayna Annual Report
2011
7 Other expenses
Financial year ended 31/12/2011
L.E
Financial year ended 31/12/2010
L.E
Leasing installment 12 101 325 12 101 325
Export subsidy expenses - 1 598 020
Losses resulting from theft of money and goods 488 763 -
Impairment of account receivables 1 483 707 11 128 308
Impairment in fixed assets 216 512 522 851
Capital Losses 222 784 319 584
Inventory write down 341 807 1 203 298
Provision for claims-formed 689 414 4 360 000
15 544 312 31 233 386
8 Finance income and finance costs
Financial year ended 31/12/2011
L.E
Financial year ended 31/12/2010
L.E
Interest expense (83 733 952) (86 041 420)
Interest income 48 012 541 28 722 955
Net foreign exchange (loss) (2 810 286) (1 969 479)
Change in present value (74 829) -
(38 606 526) (59 287 944)
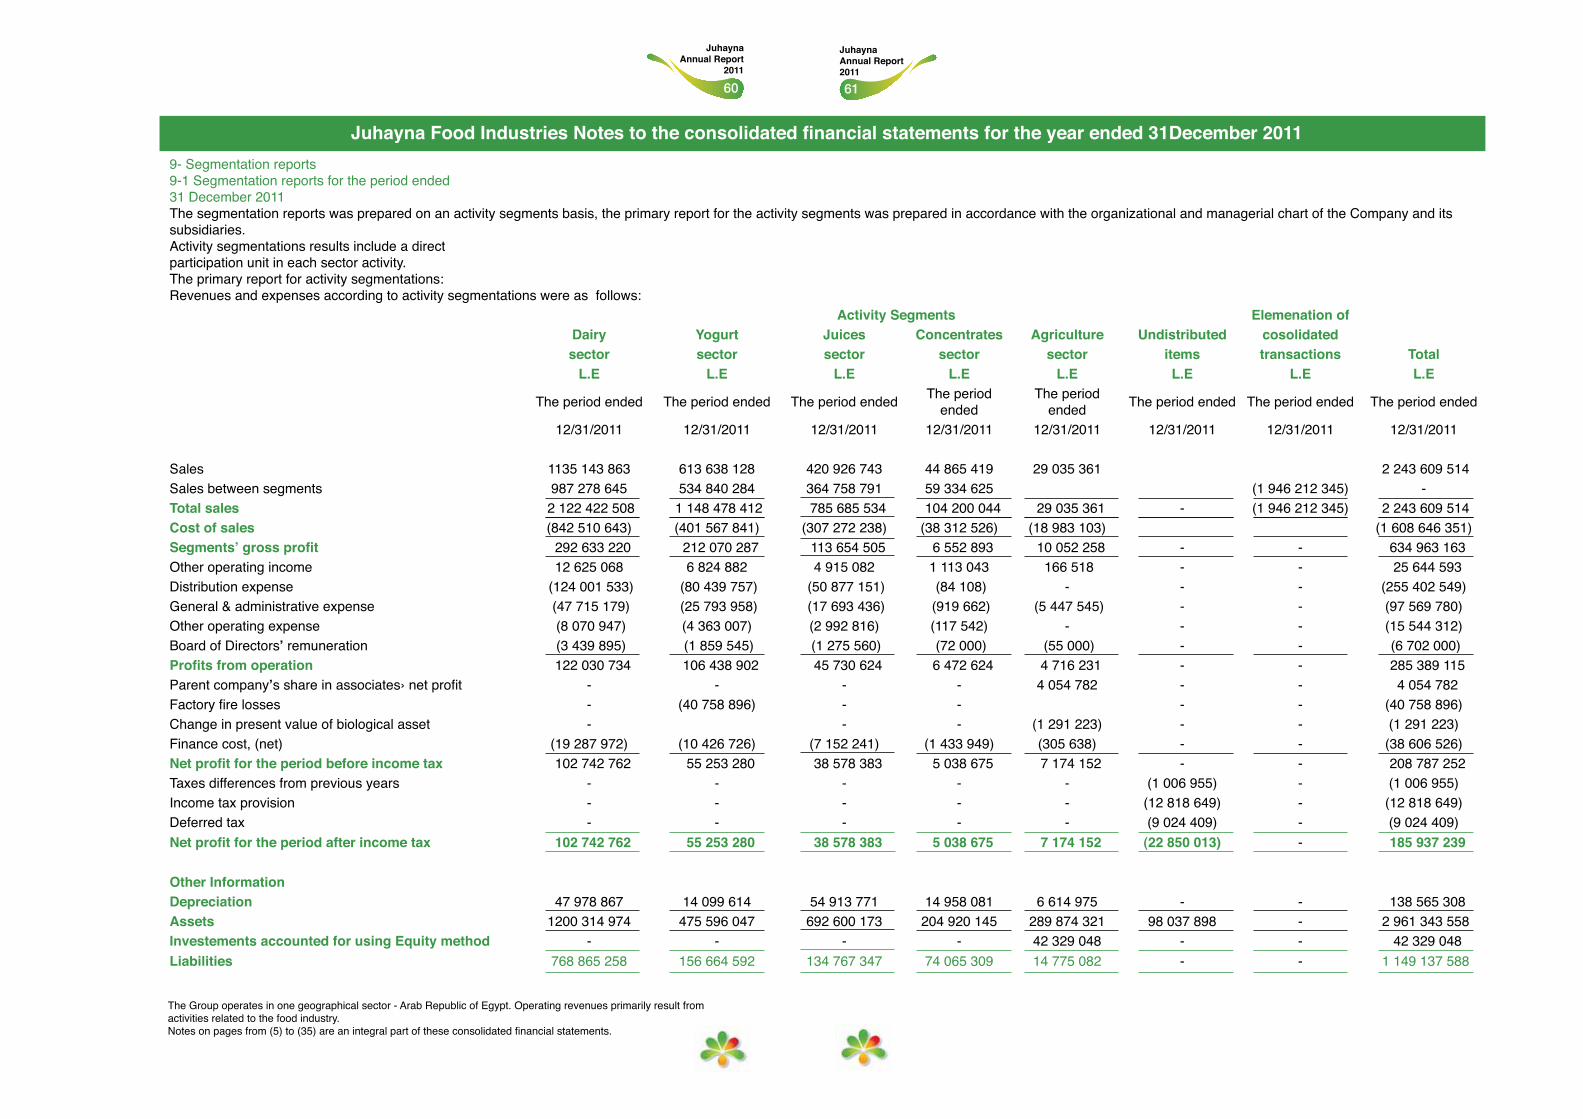
6160
Juhayna Annual Report 2011
Juhayna Annual Report
2011
The Group operates in one geographical sector - Arab Republic of Egypt. Operating revenues primarily result from activities related to the food industry.Notes on pages from (5) to (35) are an integral part of these consolidated financial statements.
Juhayna Food Industries Notes to the consolidated financial statements for the year ended 31December 20119- Segmentation reports 9-1 Segmentation reports for the period ended 31 December 2011 The segmentation reports was prepared on an activity segments basis, the primary report for the activity segments was prepared in accordance with the organizational and managerial chart of the Company and its subsidiaries.Activity segmentations results include a direct participation unit in each sector activity.The primary report for activity segmentations:Revenues and expenses according to activity segmentations were as follows:
Activity Segments Elemenation ofDairy Yogurt Juices Concentrates Agriculture Undistributed cosolidatedsector sector sector sector sector items transactions Total
L.E L.E L.E L.E L.E L.E L.E L.E
The period ended The period ended The period ended The period ended
The period ended The period ended The period ended The period ended
12/31/2011 12/31/2011 12/31/2011 12/31/2011 12/31/2011 12/31/2011 12/31/2011 12/31/2011
Sales 1135 143 863 613 638 128 420 926 743 44 865 419 29 035 361 2 243 609 514Sales between segments 987 278 645 534 840 284 364 758 791 59 334 625 (1 946 212 345) -Total sales 2 122 422 508 1 148 478 412 785 685 534 104 200 044 29 035 361 - (1 946 212 345) 2 243 609 514Cost of sales (842 510 643) (401 567 841) (307 272 238) (38 312 526) (18 983 103) (1 608 646 351)Segments’ gross profit 292 633 220 212 070 287 113 654 505 6 552 893 10 052 258 - - 634 963 163Other operating income 12 625 068 6 824 882 4 915 082 1 113 043 166 518 - - 25 644 593Distribution expense (124 001 533) (80 439 757) (50 877 151) (84 108) - - - (255 402 549)General & administrative expense (47 715 179) (25 793 958) (17 693 436) (919 662) (5 447 545) - - (97 569 780)Other operating expense (8 070 947) (4 363 007) (2 992 816) (117 542) - - - (15 544 312)Board of Directors’ remuneration (3 439 895) (1 859 545) (1 275 560) (72 000) (55 000) - - (6 702 000)Profits from operation 122 030 734 106 438 902 45 730 624 6 472 624 4 716 231 - - 285 389 115Parent company’s share in associates› net profit - - - - 4 054 782 - - 4 054 782Factory fire losses - (40 758 896) - - - - (40 758 896)Change in present value of biological asset - - - (1 291 223) - - (1 291 223)Finance cost, (net) (19 287 972) (10 426 726) (7 152 241) (1 433 949) (305 638) - - (38 606 526)Net profit for the period before income tax 102 742 762 55 253 280 38 578 383 5 038 675 7 174 152 - - 208 787 252Taxes differences from previous years - - - - - (1 006 955) - (1 006 955)Income tax provision - - - - - (12 818 649) - (12 818 649)Deferred tax - - - - - (9 024 409) - (9 024 409)Net profit for the period after income tax 102 742 762 55 253 280 38 578 383 5 038 675 7 174 152 (22 850 013) - 185 937 239
Other InformationDepreciation 47 978 867 14 099 614 54 913 771 14 958 081 6 614 975 - - 138 565 308Assets 1200 314 974 475 596 047 692 600 173 204 920 145 289 874 321 98 037 898 - 2 961 343 558Investements accounted for using Equity method - - - - 42 329 048 - - 42 329 048Liabilities 768 865 258 156 664 592 134 767 347 74 065 309 14 775 082 - - 1 149 137 588
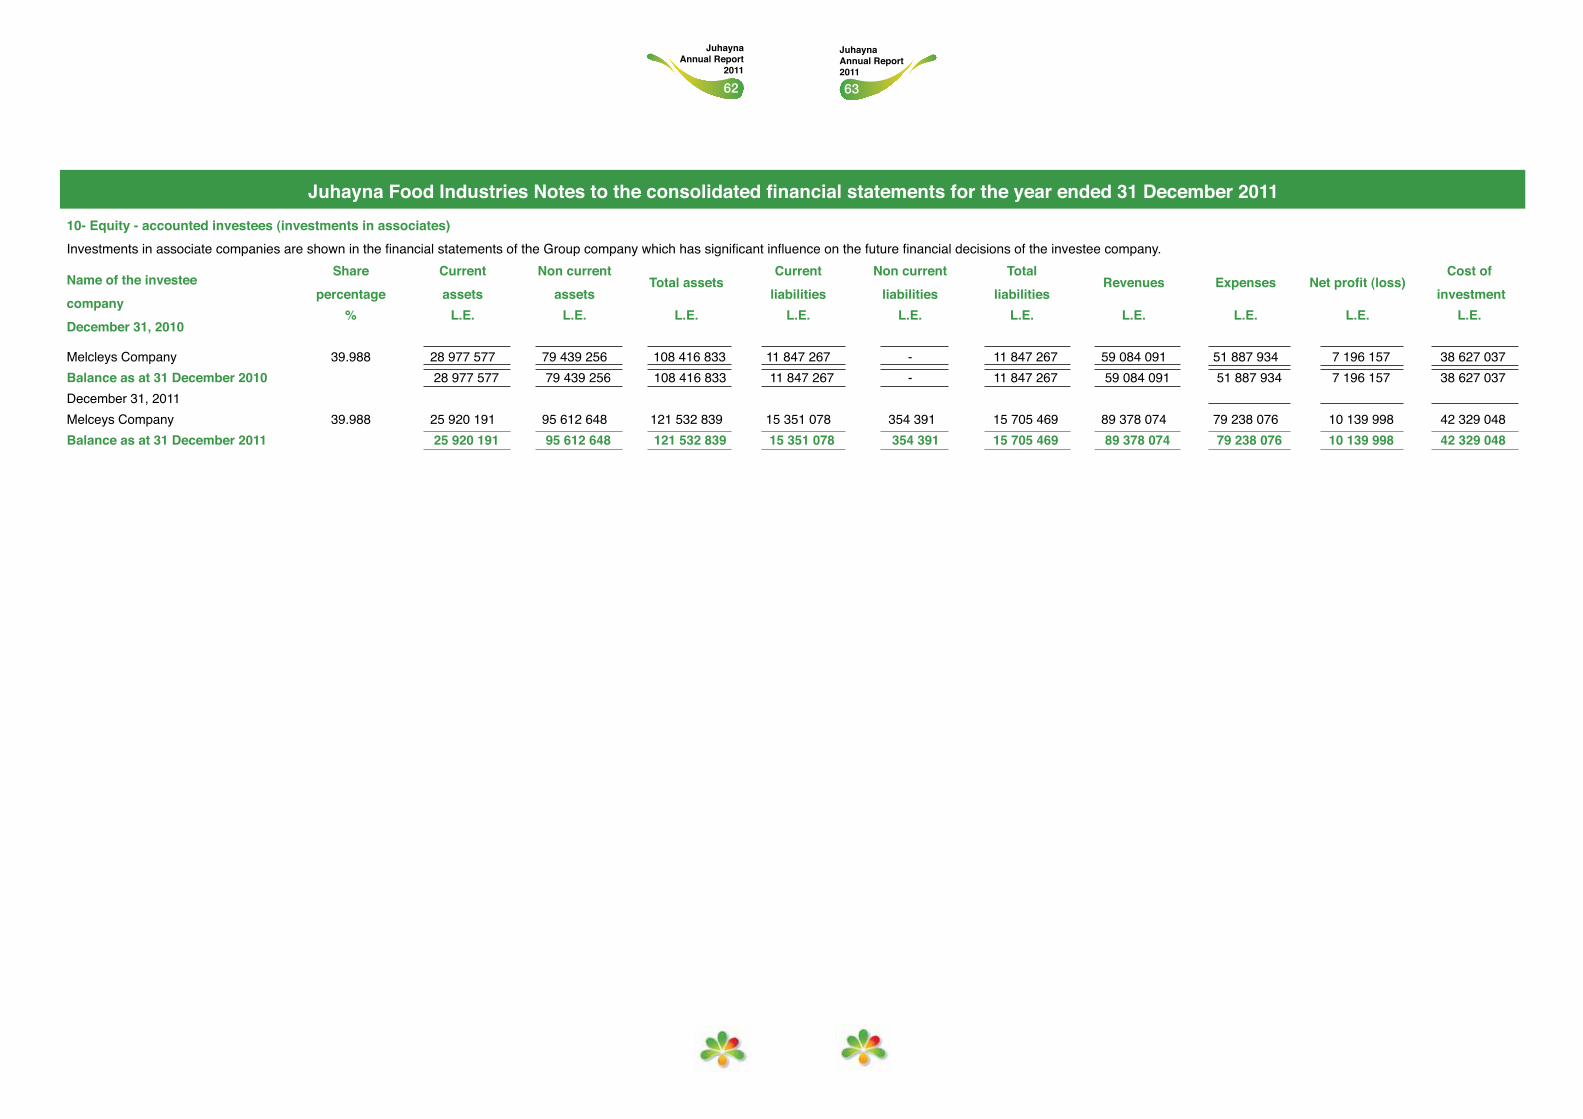
6362
Juhayna Annual Report 2011
Juhayna Annual Report
2011
Juhayna Food Industries Notes to the consolidated financial statements for the year ended 31 December 201110- Equity - accounted investees (investments in associates)Investments in associate companies are shown in the financial statements of the Group company which has significant influence on the future financial decisions of the investee company.
Name of the investee company December 31, 2010
Share percentage
Current assets
Non current assets
Total assetsCurrent
liabilitiesNon current
liabilitiesTotal
liabilitiesRevenues Expenses Net profit (loss)
Cost of investment
% L.E. L.E. L.E. L.E. L.E. L.E. L.E. L.E. L.E. L.E.
Melcleys Company 39.988 28 977 577 79 439 256 108 416 833 11 847 267 - 11 847 267 59 084 091 51 887 934 7 196 157 38 627 037Balance as at 31 December 2010 28 977 577 79 439 256 108 416 833 11 847 267 - 11 847 267 59 084 091 51 887 934 7 196 157 38 627 037December 31, 2011Melceys Company 39.988 25 920 191 95 612 648 121 532 839 15 351 078 354 391 15 705 469 89 378 074 79 238 076 10 139 998 42 329 048Balance as at 31 December 2011 25 920 191 95 612 648 121 532 839 15 351 078 354 391 15 705 469 89 378 074 79 238 076 10 139 998 42 329 048
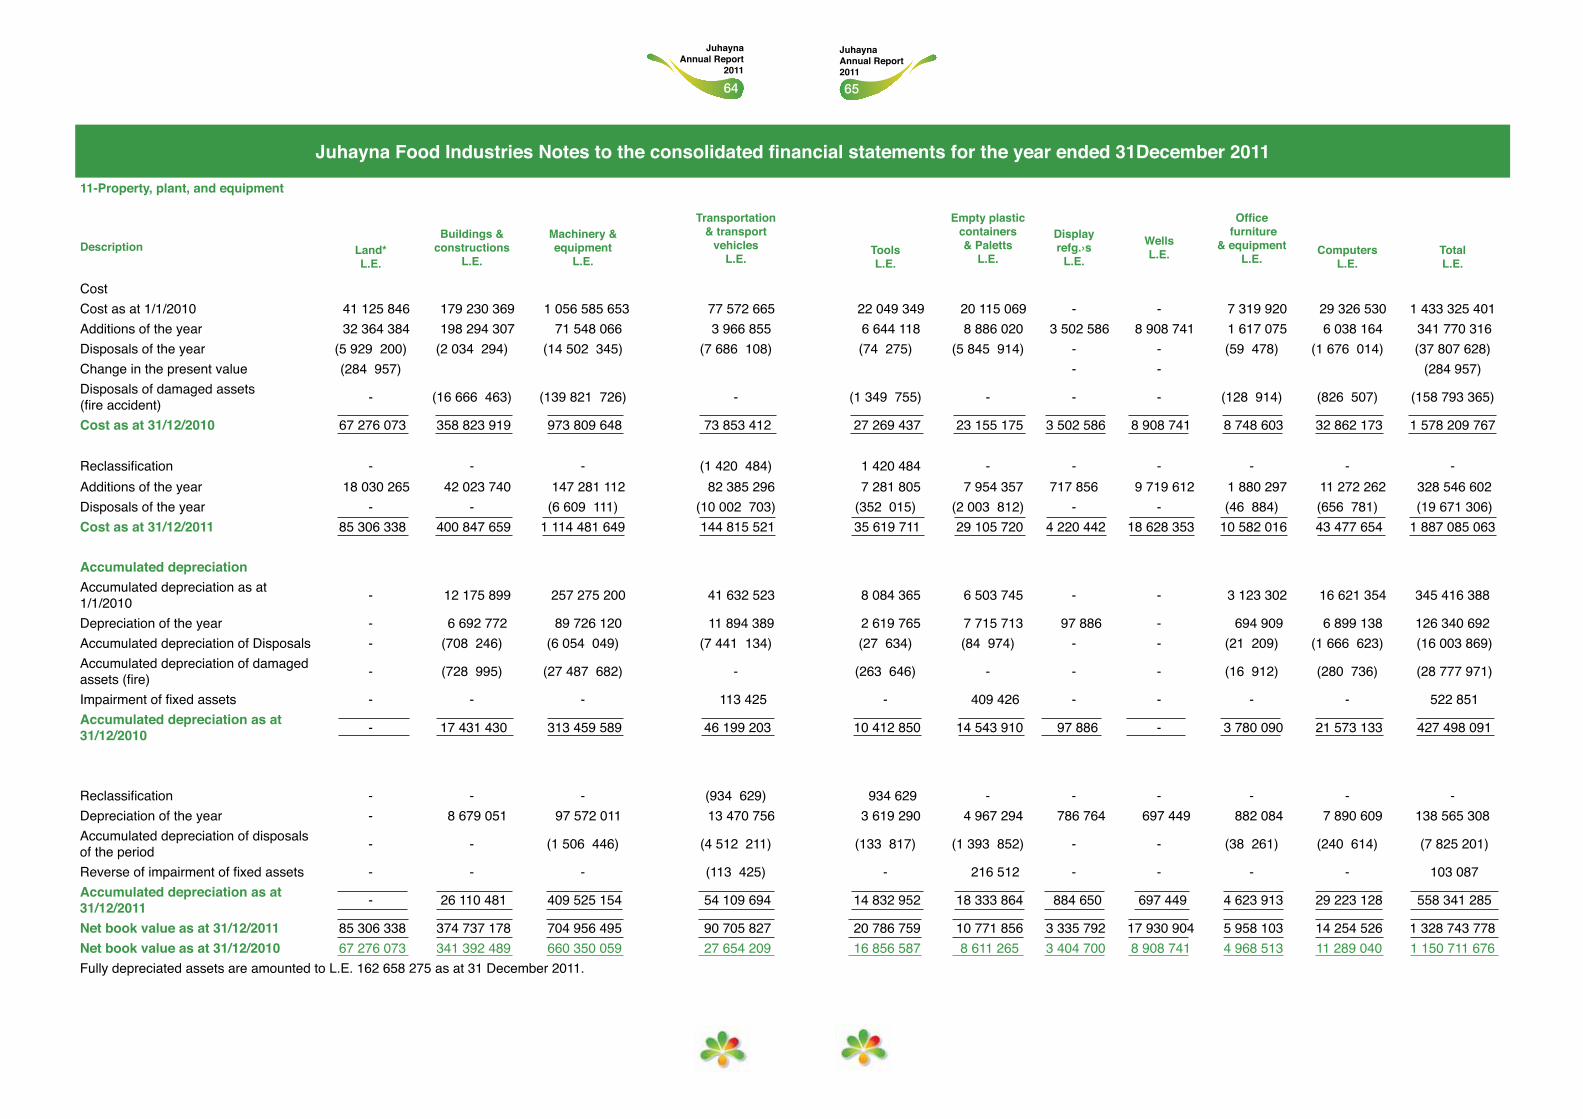
6564
Juhayna Annual Report 2011
Juhayna Annual Report
2011
Juhayna Food Industries Notes to the consolidated financial statements for the year ended 31December 2011
11-Property, plant, and equipment
Transportation& transport
vehicles L.E.
Empty plasticcontainers& Paletts
L.E.
Office furniture
& equipment L.E.
Buildings &constructions
L.E.
Machinery &equipment
L.E.
Display refg.›s
L.E.WellsL.E.Description Land*
L.E.Tools L.E.
ComputersL.E.
TotalL.E.
CostCost as at 1/1/2010 41 125 846 179 230 369 1 056 585 653 77 572 665 22 049 349 20 115 069 - - 7 319 920 29 326 530 1 433 325 401Additions of the year 32 364 384 198 294 307 71 548 066 3 966 855 6 644 118 8 886 020 3 502 586 8 908 741 1 617 075 6 038 164 341 770 316Disposals of the year (5 929 200) (2 034 294) (14 502 345) (7 686 108) (74 275) (5 845 914) - - (59 478) (1 676 014) (37 807 628)Change in the present value (284 957) - - (284 957)Disposals of damaged assets (fire accident) - (16 666 463) (139 821 726) - (1 349 755) - - - (128 914) (826 507) (158 793 365)
Cost as at 31/12/2010 67 276 073 358 823 919 973 809 648 73 853 412 27 269 437 23 155 175 3 502 586 8 908 741 8 748 603 32 862 173 1 578 209 767
Reclassification - - - (1 420 484) 1 420 484 - - - - - -Additions of the year 18 030 265 42 023 740 147 281 112 82 385 296 7 281 805 7 954 357 717 856 9 719 612 1 880 297 11 272 262 328 546 602Disposals of the year - - (6 609 111) (10 002 703) (352 015) (2 003 812) - - (46 884) (656 781) (19 671 306)Cost as at 31/12/2011 85 306 338 400 847 659 1 114 481 649 144 815 521 35 619 711 29 105 720 4 220 442 18 628 353 10 582 016 43 477 654 1 887 085 063
Accumulated depreciationAccumulated depreciation as at 1/1/2010 - 12 175 899 257 275 200 41 632 523 8 084 365 6 503 745 - - 3 123 302 16 621 354 345 416 388
Depreciation of the year - 6 692 772 89 726 120 11 894 389 2 619 765 7 715 713 97 886 - 694 909 6 899 138 126 340 692Accumulated depreciation of Disposals - (708 246) (6 054 049) (7 441 134) (27 634) (84 974) - - (21 209) (1 666 623) (16 003 869)Accumulated depreciation of damaged assets (fire) - (728 995) (27 487 682) - (263 646) - - - (16 912) (280 736) (28 777 971)
Impairment of fixed assets - - - 113 425 - 409 426 - - - - 522 851Accumulated depreciation as at 31/12/2010 - 17 431 430 313 459 589 46 199 203 10 412 850 14 543 910 97 886 - 3 780 090 21 573 133 427 498 091
Reclassification - - - (934 629) 934 629 - - - - - -Depreciation of the year - 8 679 051 97 572 011 13 470 756 3 619 290 4 967 294 786 764 697 449 882 084 7 890 609 138 565 308Accumulated depreciation of disposals of the period - - (1 506 446) (4 512 211) (133 817) (1 393 852) - - (38 261) (240 614) (7 825 201)
Reverse of impairment of fixed assets - - - (113 425) - 216 512 - - - - 103 087Accumulated depreciation as at 31/12/2011 - 26 110 481 409 525 154 54 109 694 14 832 952 18 333 864 884 650 697 449 4 623 913 29 223 128 558 341 285
Net book value as at 31/12/2011 85 306 338 374 737 178 704 956 495 90 705 827 20 786 759 10 771 856 3 335 792 17 930 904 5 958 103 14 254 526 1 328 743 778Net book value as at 31/12/2010 67 276 073 341 392 489 660 350 059 27 654 209 16 856 587 8 611 265 3 404 700 8 908 741 4 968 513 11 289 040 1 150 711 676Fully depreciated assets are amounted to L.E. 162 658 275 as at 31 December 2011.
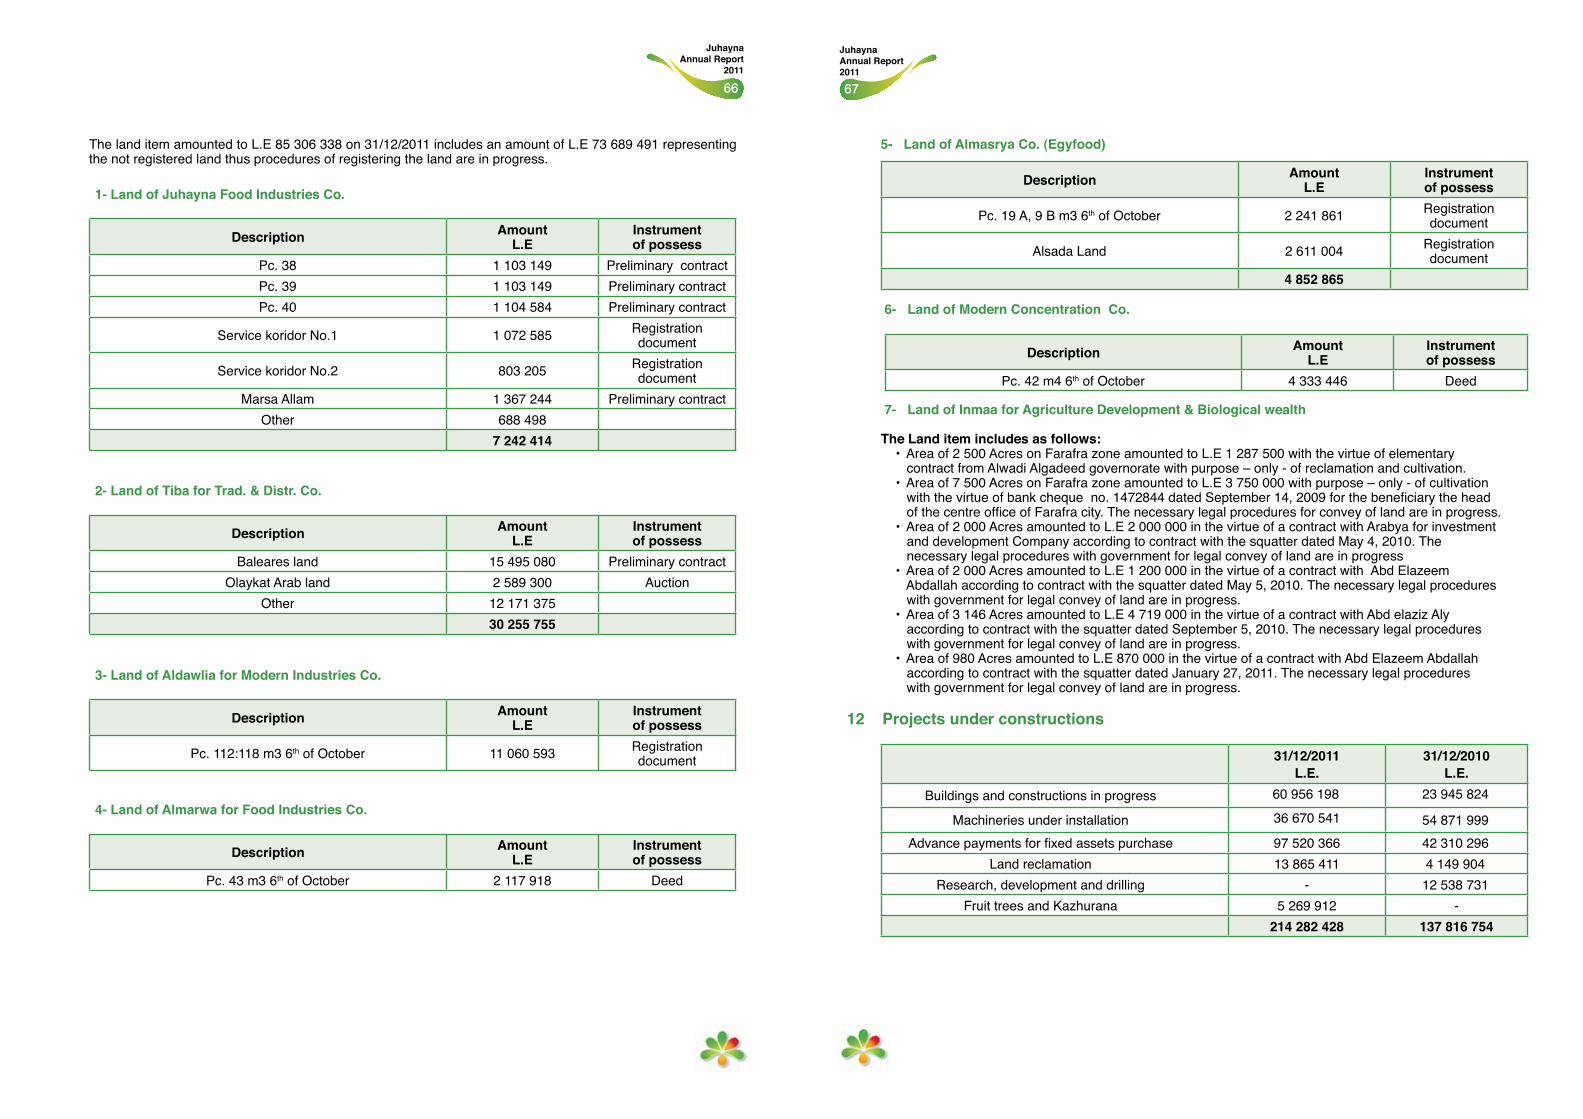
6766
Juhayna Annual Report 2011
Juhayna Annual Report
2011
The land item amounted to L.E 85 306 338 on 31/12/2011 includes an amount of L.E 73 689 491 representing the not registered land thus procedures of registering the land are in progress.
1- Land of Juhayna Food Industries Co.
Description AmountL.E
Instrumentof possess
Pc. 38 1 103 149 Preliminary contractPc. 39 1 103 149 Preliminary contractPc. 40 1 104 584 Preliminary contract
Service koridor No.1 1 072 585 Registration document
Service koridor No.2 803 205 Registration document
Marsa Allam 1 367 244 Preliminary contractOther 688 498
7 242 414
2- Land of Tiba for Trad. & Distr. Co.
Description AmountL.E
Instrumentof possess
Baleares land 15 495 080 Preliminary contractOlaykat Arab land 2 589 300 Auction
Other 12 171 37530 255 755
3- Land of Aldawlia for Modern Industries Co.
Description AmountL.E
Instrumentof possess
Pc. 112:118 m3 6th of October 11 060 593 Registration document
4- Land of Almarwa for Food Industries Co.
Description AmountL.E
Instrumentof possess
Pc. 43 m3 6th of October 2 117 918 Deed
Description AmountL.E
Instrumentof possess
Pc. 19 A, 9 B m3 6th of October 2 241 861 Registration document
Alsada Land 2 611 004 Registration document
4 852 865
6- Land of Modern Concentration Co.
Description AmountL.E
Instrumentof possess
Pc. 42 m4 6th of October 4 333 446 Deed
7- Land of Inmaa for Agriculture Development & Biological wealth
The Land item includes as follows: • Area of 2 500 Acres on Farafra zone amounted to L.E 1 287 500 with the virtue of elementary contract from Alwadi Algadeed governorate with purpose – only - of reclamation and cultivation. • Area of 7 500 Acres on Farafra zone amounted to L.E 3 750 000 with purpose – only - of cultivation with the virtue of bank cheque no. 1472844 dated September 14, 2009 for the beneficiary the head of the centre office of Farafra city. The necessary legal procedures for convey of land are in progress. • Area of 2 000 Acres amounted to L.E 2 000 000 in the virtue of a contract with Arabya for investment and development Company according to contract with the squatter dated May 4, 2010. The necessary legal procedures with government for legal convey of land are in progress • Area of 2 000 Acres amounted to L.E 1 200 000 in the virtue of a contract with Abd Elazeem Abdallah according to contract with the squatter dated May 5, 2010. The necessary legal procedures with government for legal convey of land are in progress. • Area of 3 146 Acres amounted to L.E 4 719 000 in the virtue of a contract with Abd elaziz Aly according to contract with the squatter dated September 5, 2010. The necessary legal procedures with government for legal convey of land are in progress. • Area of 980 Acres amounted to L.E 870 000 in the virtue of a contract with Abd Elazeem Abdallah according to contract with the squatter dated January 27, 2011. The necessary legal procedures with government for legal convey of land are in progress.
12 Projects under constructions
31/12/2011L.E.
31/12/2010L.E.
Buildings and constructions in progress 60 956 198 23 945 824
Machineries under installation 36 670 541 54 871 999Advance payments for fixed assets purchase 97 520 366 42 310 296
Land reclamation 13 865 411 4 149 904Research, development and drilling - 12 538 731
Fruit trees and Kazhurana 5 269 912 -214 282 428 137 816 754
5- Land of Almasrya Co. (Egyfood)
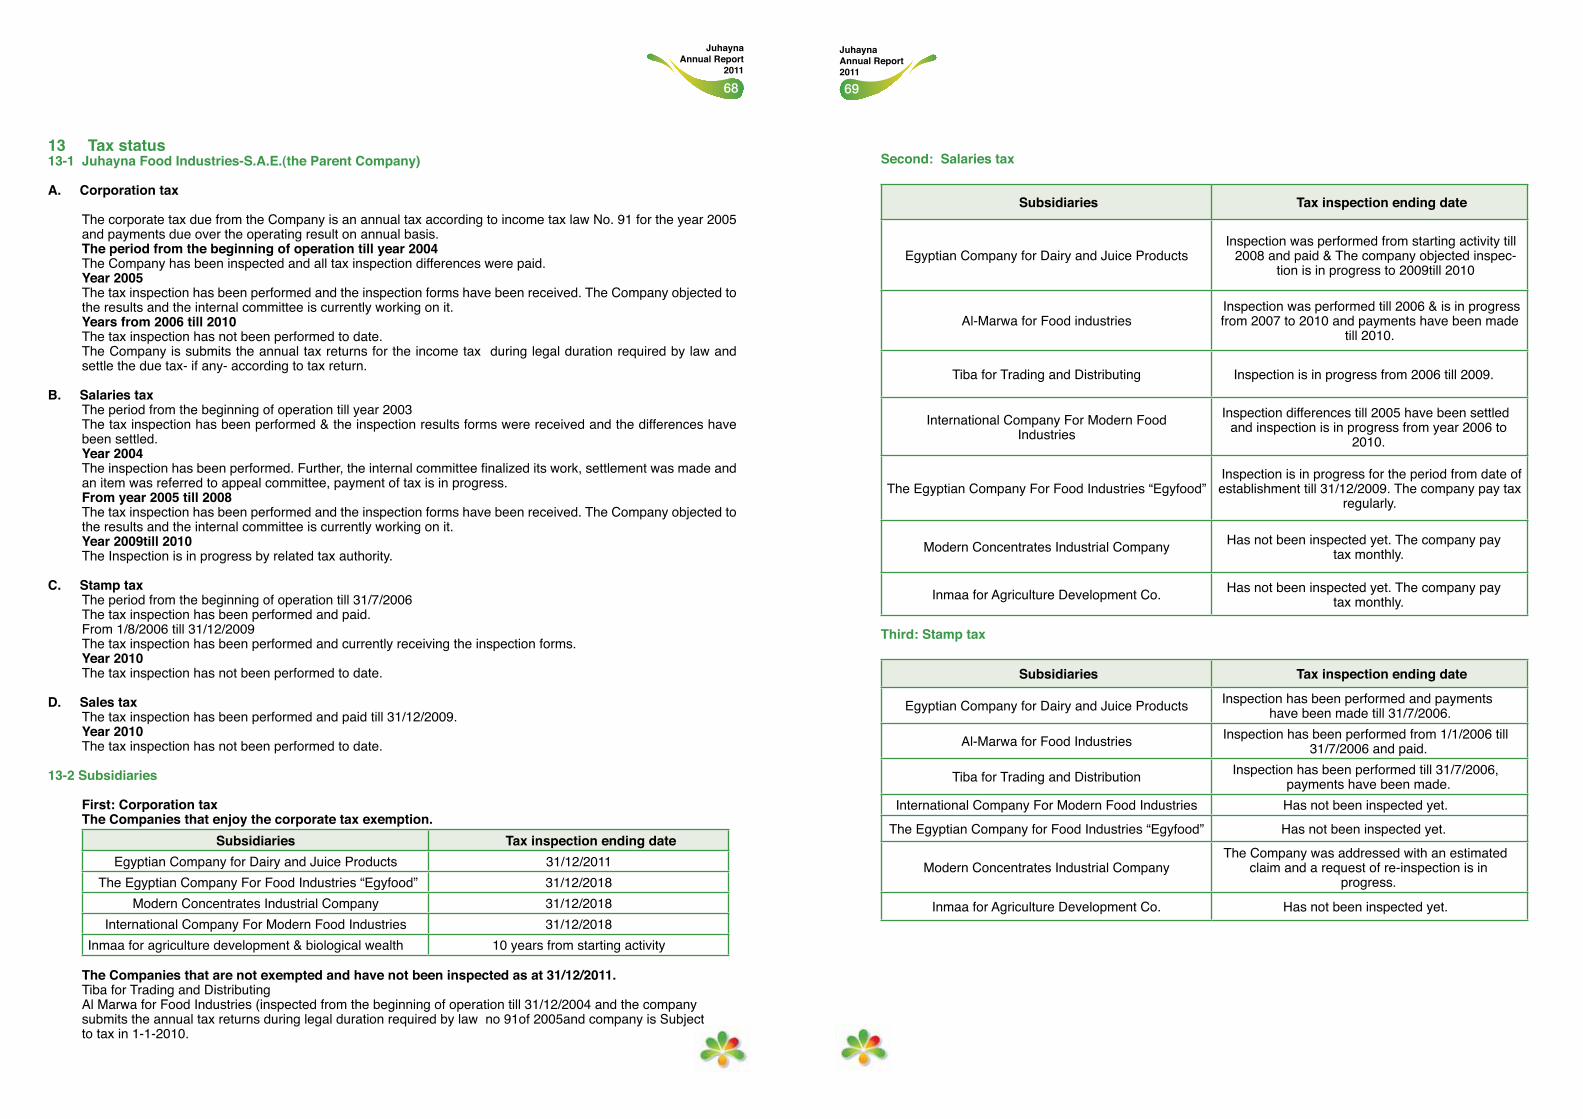
6968
Juhayna Annual Report 2011
Juhayna Annual Report
2011
13 Tax status 13-1 Juhayna Food Industries-S.A.E.(the Parent Company)
A. Corporation tax
The corporate tax due from the Company is an annual tax according to income tax law No. 91 for the year 2005 and payments due over the operating result on annual basis.The period from the beginning of operation till year 2004The Company has been inspected and all tax inspection differences were paid.Year 2005The tax inspection has been performed and the inspection forms have been received. The Company objected to the results and the internal committee is currently working on it.Years from 2006 till 2010 The tax inspection has not been performed to date.The Company is submits the annual tax returns for the income tax during legal duration required by law and settle the due tax- if any- according to tax return.
B. Salaries taxThe period from the beginning of operation till year 2003The tax inspection has been performed & the inspection results forms were received and the differences have been settled.Year 2004The inspection has been performed. Further, the internal committee finalized its work, settlement was made and an item was referred to appeal committee, payment of tax is in progress. From year 2005 till 2008The tax inspection has been performed and the inspection forms have been received. The Company objected to the results and the internal committee is currently working on it.Year 2009till 2010The Inspection is in progress by related tax authority.
C. Stamp taxThe period from the beginning of operation till 31/7/2006The tax inspection has been performed and paid.From 1/8/2006 till 31/12/2009The tax inspection has been performed and currently receiving the inspection forms. Year 2010The tax inspection has not been performed to date.
D. Sales taxThe tax inspection has been performed and paid till 31/12/2009.Year 2010The tax inspection has not been performed to date.
13-2 Subsidiaries
First: Corporation taxThe Companies that enjoy the corporate tax exemption.
Subsidiaries Tax inspection ending dateEgyptian Company for Dairy and Juice Products 31/12/2011
The Egyptian Company For Food Industries “Egyfood” 31/12/2018Modern Concentrates Industrial Company 31/12/2018
International Company For Modern Food Industries 31/12/2018Inmaa for agriculture development & biological wealth 10 years from starting activity
The Companies that are not exempted and have not been inspected as at 31/12/2011.Tiba for Trading and DistributingAl Marwa for Food Industries (inspected from the beginning of operation till 31/12/2004 and the companysubmits the annual tax returns during legal duration required by law no 91of 2005and company is Subjectto tax in 1-1-2010.
Second: Salaries tax
Subsidiaries Tax inspection ending date
Egyptian Company for Dairy and Juice ProductsInspection was performed from starting activity till
2008 and paid & The company objected inspec-tion is in progress to 2009till 2010
Al-Marwa for Food industries Inspection was performed till 2006 & is in progress from 2007 to 2010 and payments have been made
till 2010.
Tiba for Trading and Distributing Inspection is in progress from 2006 till 2009.
International Company For Modern Food Industries
Inspection differences till 2005 have been settled and inspection is in progress from year 2006 to
2010.
The Egyptian Company For Food Industries “Egyfood” Inspection is in progress for the period from date of establishment till 31/12/2009. The company pay tax
regularly.
Modern Concentrates Industrial Company Has not been inspected yet. The company pay tax monthly.
Inmaa for Agriculture Development Co. Has not been inspected yet. The company pay tax monthly.
Third: Stamp tax
Subsidiaries Tax inspection ending date
Egyptian Company for Dairy and Juice Products Inspection has been performed and payments have been made till 31/7/2006.
Al-Marwa for Food Industries Inspection has been performed from 1/1/2006 till 31/7/2006 and paid.
Tiba for Trading and Distribution Inspection has been performed till 31/7/2006, payments have been made.
International Company For Modern Food Industries Has not been inspected yet.
The Egyptian Company for Food Industries “Egyfood” Has not been inspected yet.
Modern Concentrates Industrial Company The Company was addressed with an estimated
claim and a request of re-inspection is in progress.
Inmaa for Agriculture Development Co. Has not been inspected yet.
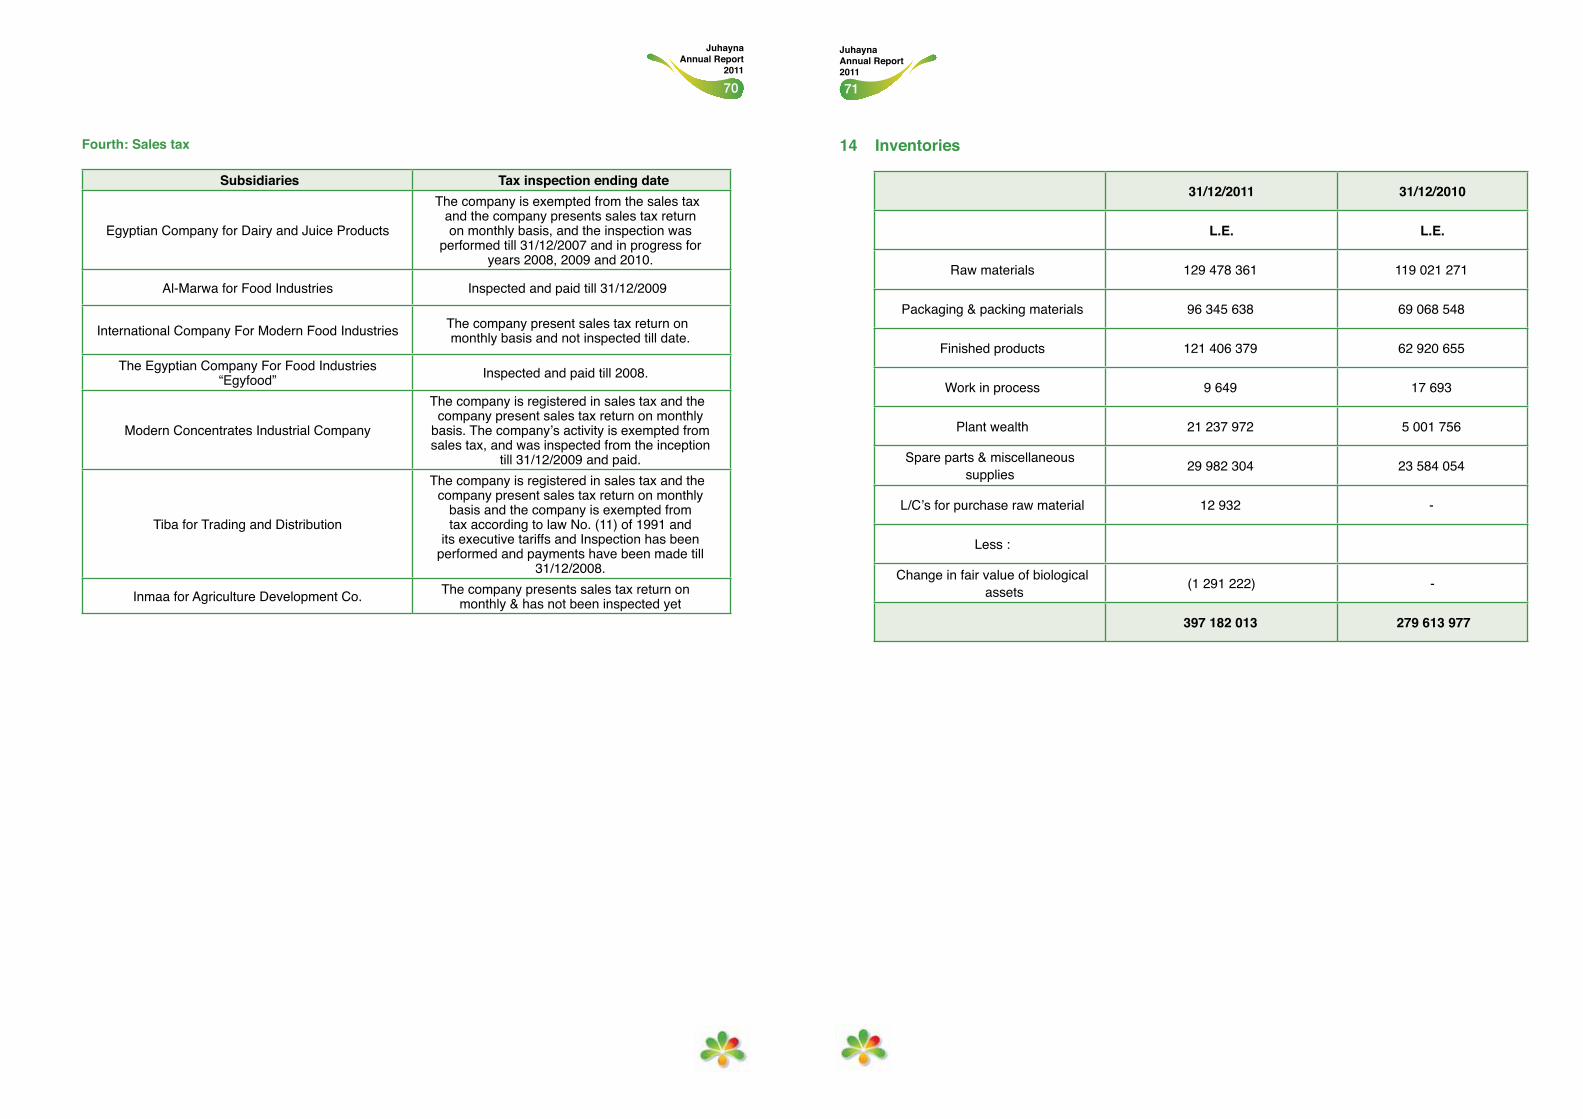
7170
Juhayna Annual Report 2011
Juhayna Annual Report
2011
Fourth: Sales tax
Subsidiaries Tax inspection ending date
Egyptian Company for Dairy and Juice Products
The company is exempted from the sales tax and the company presents sales tax return on monthly basis, and the inspection was
performed till 31/12/2007 and in progress for years 2008, 2009 and 2010.
Al-Marwa for Food Industries Inspected and paid till 31/12/2009
International Company For Modern Food Industries The company present sales tax return on monthly basis and not inspected till date.
The Egyptian Company For Food Industries “Egyfood” Inspected and paid till 2008.
Modern Concentrates Industrial Company
The company is registered in sales tax and the company present sales tax return on monthly
basis. The company’s activity is exempted from sales tax, and was inspected from the inception
till 31/12/2009 and paid.
Tiba for Trading and Distribution
The company is registered in sales tax and the company present sales tax return on monthly
basis and the company is exempted from tax according to law No. (11) of 1991 and
its executive tariffs and Inspection has been performed and payments have been made till
31/12/2008.
Inmaa for Agriculture Development Co. The company presents sales tax return on monthly & has not been inspected yet
14 Inventories
31/12/2011 31/12/2010
L.E. L.E.
Raw materials 129 478 361 119 021 271
Packaging & packing materials 96 345 638 69 068 548
Finished products 121 406 379 62 920 655
Work in process 9 649 17 693
Plant wealth 21 237 972 5 001 756
Spare parts & miscellaneous supplies 29 982 304 23 584 054
L/C’s for purchase raw material 12 932 -
Less :
Change in fair value of biological assets (1 291 222) -
397 182 013 279 613 977
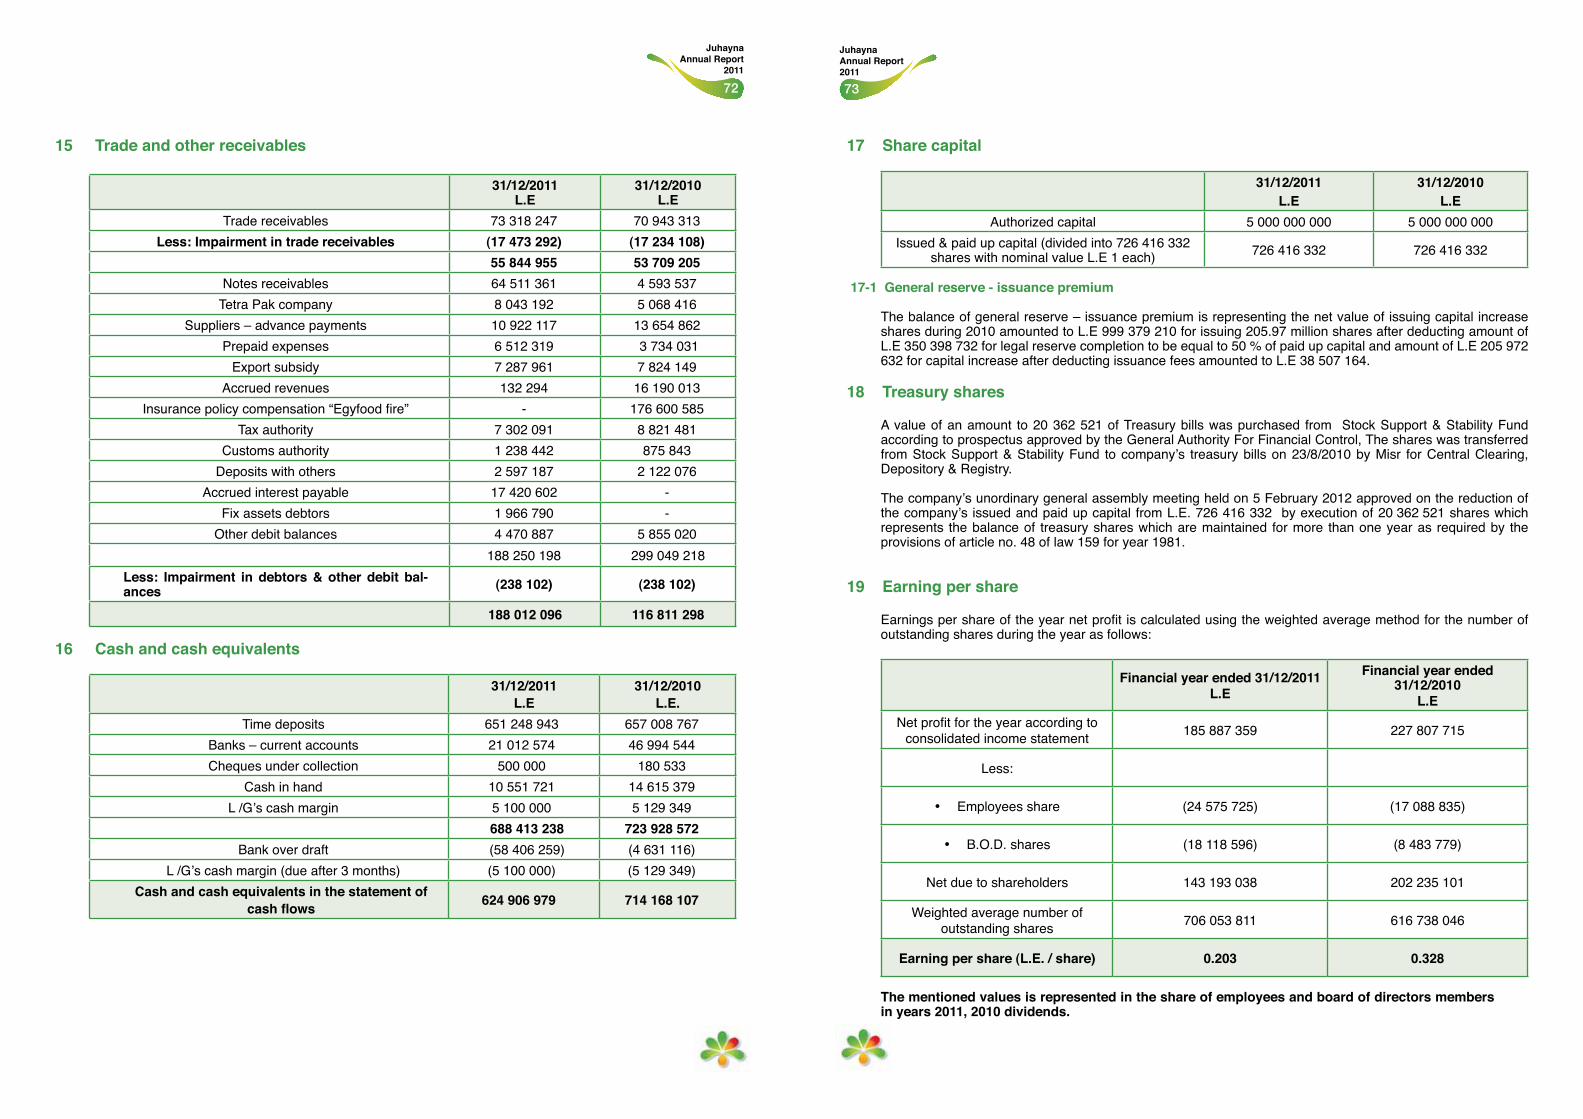
7372
Juhayna Annual Report 2011
Juhayna Annual Report
2011
15 Trade and other receivables
31/12/2011L.E
31/12/2010L.E
Trade receivables 73 318 247 70 943 313Less: Impairment in trade receivables (17 473 292) (17 234 108)
55 844 955 53 709 205Notes receivables 64 511 361 4 593 537
Tetra Pak company 8 043 192 5 068 416Suppliers – advance payments 10 922 117 13 654 862
Prepaid expenses 6 512 319 3 734 031Export subsidy 7 287 961 7 824 149
Accrued revenues 132 294 16 190 013Insurance policy compensation “Egyfood fire” - 176 600 585
Tax authority 7 302 091 8 821 481Customs authority 1 238 442 875 843
Deposits with others 2 597 187 2 122 076Accrued interest payable 17 420 602 -
Fix assets debtors 1 966 790 -Other debit balances 4 470 887 5 855 020
188 250 198 299 049 218Less: Impairment in debtors & other debit bal-ances (238 102) (238 102)
188 012 096 116 811 298
16 Cash and cash equivalents
31/12/2011L.E
31/12/2010L.E.
Time deposits 651 248 943 657 008 767Banks – current accounts 21 012 574 46 994 544Cheques under collection 500 000 180 533
Cash in hand 10 551 721 14 615 379L /G’s cash margin 5 100 000 5 129 349
688 413 238 723 928 572Bank over draft (58 406 259) (4 631 116)
L /G’s cash margin (due after 3 months) (5 100 000) (5 129 349)Cash and cash equivalents in the statement of
cash flows 624 906 979 714 168 107
17 Share capital
31/12/2011L.E
31/12/2010L.E
Authorized capital 5 000 000 000 5 000 000 000Issued & paid up capital (divided into 726 416 332
shares with nominal value L.E 1 each) 726 416 332 726 416 332
17-1 General reserve - issuance premium
The balance of general reserve – issuance premium is representing the net value of issuing capital increase shares during 2010 amounted to L.E 999 379 210 for issuing 205.97 million shares after deducting amount of L.E 350 398 732 for legal reserve completion to be equal to 50 % of paid up capital and amount of L.E 205 972 632 for capital increase after deducting issuance fees amounted to L.E 38 507 164.
18 Treasury shares
A value of an amount to 20 362 521 of Treasury bills was purchased from Stock Support & Stability Fund according to prospectus approved by the General Authority For Financial Control, The shares was transferred from Stock Support & Stability Fund to company’s treasury bills on 23/8/2010 by Misr for Central Clearing, Depository & Registry.
The company’s unordinary general assembly meeting held on 5 February 2012 approved on the reduction of the company’s issued and paid up capital from L.E. 726 416 332 by execution of 20 362 521 shares which represents the balance of treasury shares which are maintained for more than one year as required by the provisions of article no. 48 of law 159 for year 1981.
19 Earning per share
Earnings per share of the year net profit is calculated using the weighted average method for the number of outstanding shares during the year as follows:
Financial year ended 31/12/2011L.E
Financial year ended 31/12/2010
L.ENet profit for the year according to
consolidated income statement 185 887 359 227 807 715
Less:
• Employees share (24 575 725) (17 088 835)
• B.O.D. shares (18 118 596) (8 483 779)
Net due to shareholders 143 193 038 202 235 101
Weighted average number of outstanding shares 706 053 811 616 738 046
Earning per share (L.E. / share) 0.203 0.328 The mentioned values is represented in the share of employees and board of directors members in years 2011, 2010 dividends.
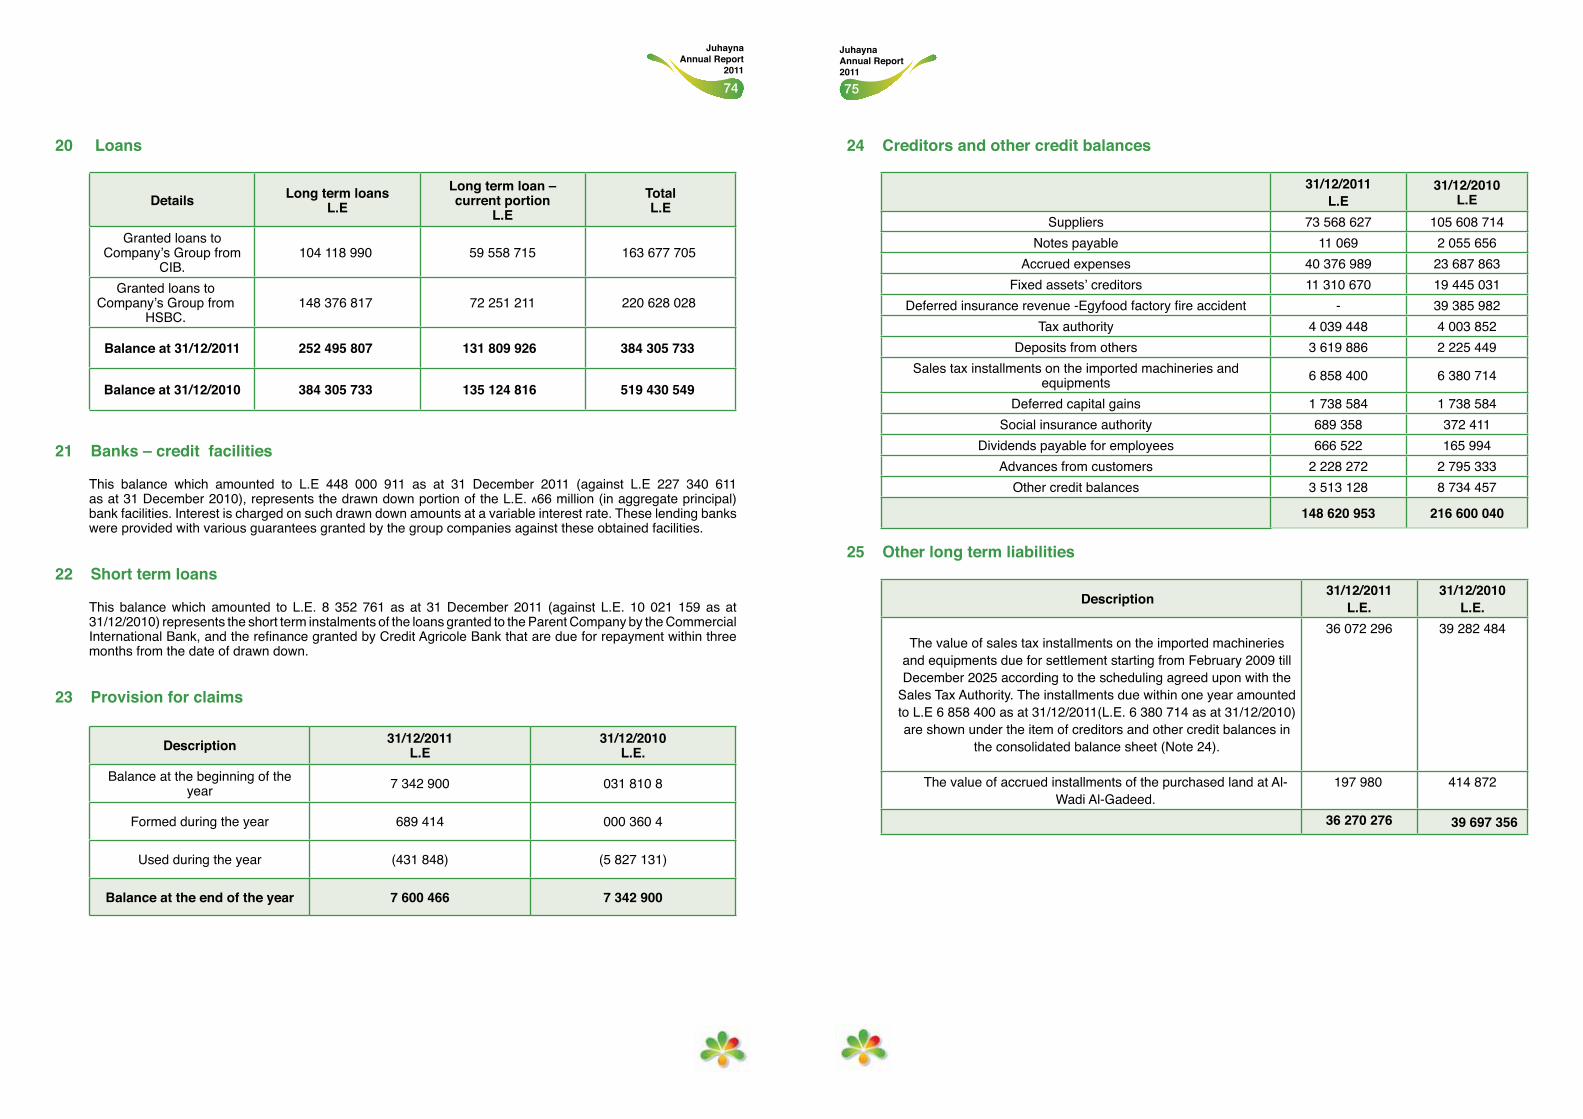
7574
Juhayna Annual Report 2011
Juhayna Annual Report
2011
20 Loans
Details Long term loansL.E
Long term loan – current portion
L.ETotalL.E
Granted loans to Company’s Group from
CIB.104 118 990 59 558 715 163 677 705
Granted loans to Company’s Group from
HSBC.148 376 817 72 251 211 220 628 028
Balance at 31/12/2011 252 495 807 131 809 926 384 305 733
Balance at 31/12/2010 384 305 733 135 124 816 519 430 549
21 Banks – credit facilities
This balance which amounted to L.E 448 000 911 as at 31 December 2011 (against L.E 227 340 611 as at 31 December 2010), represents the drawn down portion of the L.E. 866 million (in aggregate principal) bank facilities. Interest is charged on such drawn down amounts at a variable interest rate. These lending banks were provided with various guarantees granted by the group companies against these obtained facilities.
22 Short term loans
This balance which amounted to L.E. 8 352 761 as at 31 December 2011 (against L.E. 10 021 159 as at 31/12/2010) represents the short term instalments of the loans granted to the Parent Company by the Commercial International Bank, and the refinance granted by Credit Agricole Bank that are due for repayment within three months from the date of drawn down.
23 Provision for claims
Description 31/12/2011L.E
31/12/2010L.E.
Balance at the beginning of the year 7 342 900 031 810 8
Formed during the year 689 414 000 360 4
Used during the year (431 848) (5 827 131)
Balance at the end of the year 7 600 466 7 342 900
24 Creditors and other credit balances
31/12/2011L.E
31/12/2010L.E
Suppliers 73 568 627 105 608 714Notes payable 11 069 2 055 656
Accrued expenses 40 376 989 23 687 863Fixed assets’ creditors 11 310 670 19 445 031
Deferred insurance revenue -Egyfood factory fire accident - 39 385 982Tax authority 4 039 448 4 003 852
Deposits from others 3 619 886 2 225 449Sales tax installments on the imported machineries and
equipments 6 858 400 6 380 714
Deferred capital gains 1 738 584 1 738 584Social insurance authority 689 358 372 411
Dividends payable for employees 666 522 165 994Advances from customers 2 228 272 2 795 333
Other credit balances 3 513 128 8 734 457
148 620 953 216 600 040
25 Other long term liabilities
Description 31/12/2011L.E.
31/12/2010L.E.
The value of sales tax installments on the imported machineries and equipments due for settlement starting from February 2009 till December 2025 according to the scheduling agreed upon with the
Sales Tax Authority. The installments due within one year amounted to L.E 6 858 400 as at 31/12/2011(L.E. 6 380 714 as at 31/12/2010) are shown under the item of creditors and other credit balances in
the consolidated balance sheet (Note 24).
36 072 296 39 282 484
The value of accrued installments of the purchased land at Al-Wadi Al-Gadeed.
197 980 414 872
36 270 276 39 697 356
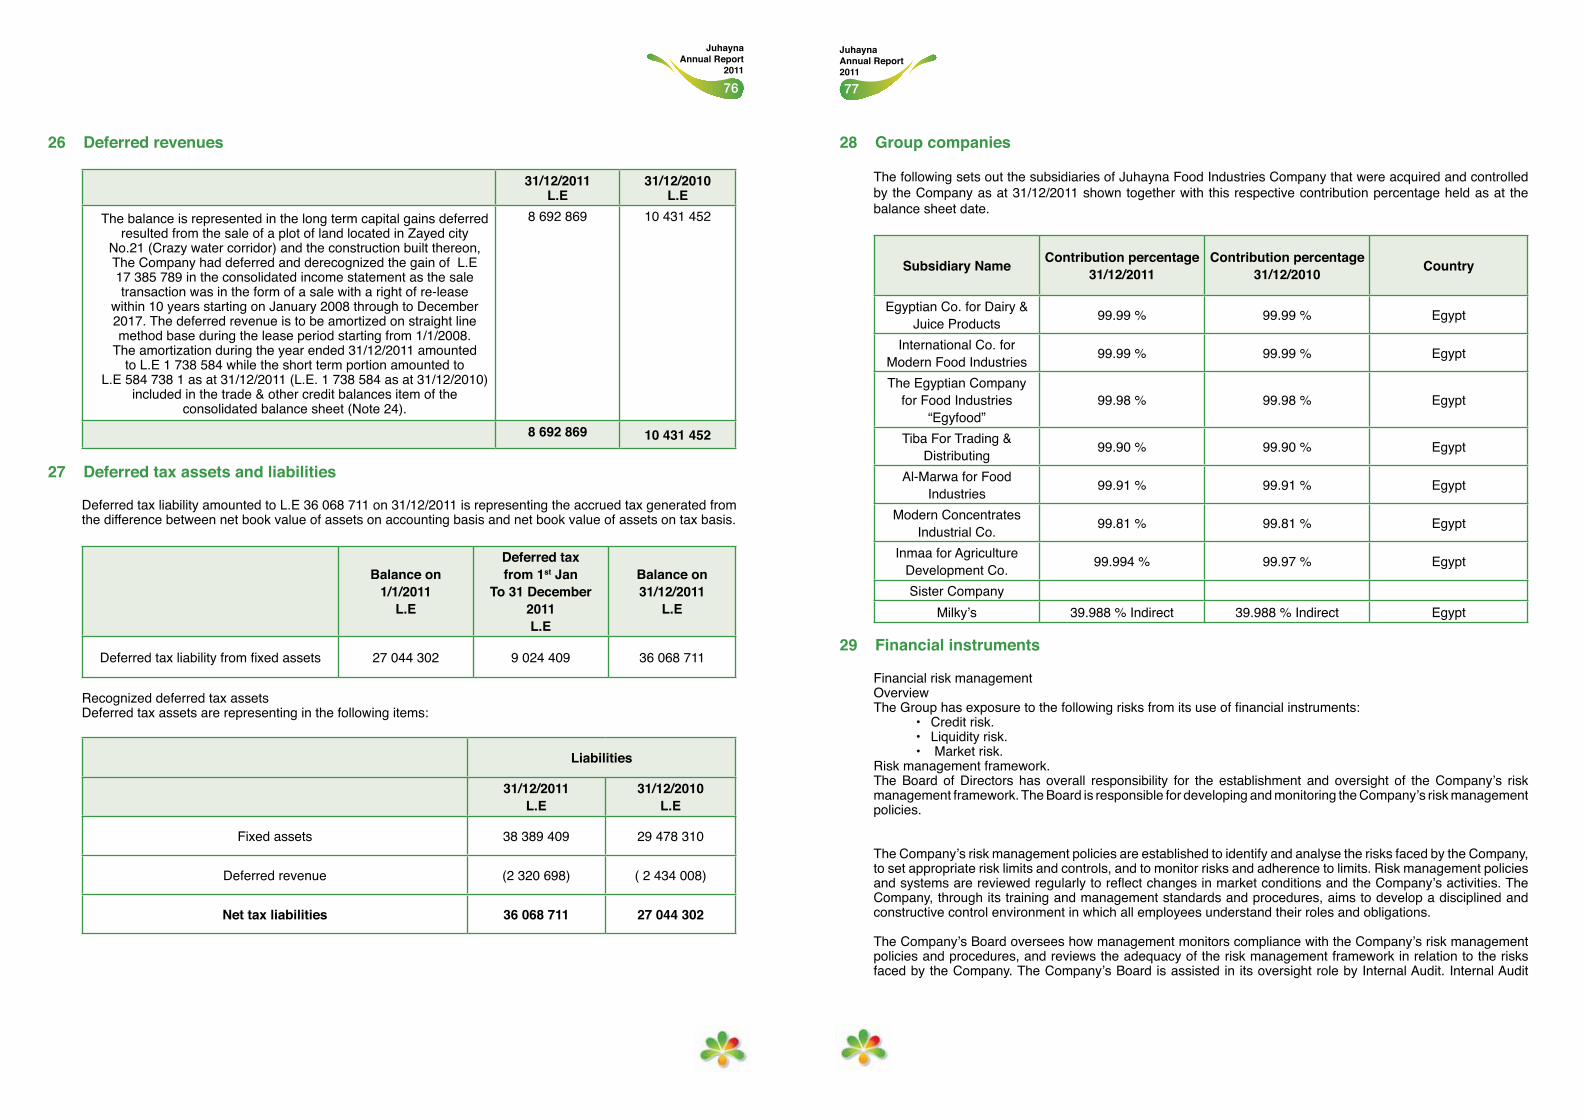
7776
Juhayna Annual Report 2011
Juhayna Annual Report
2011
26 Deferred revenues
31/12/2011L.E
31/12/2010L.E
The balance is represented in the long term capital gains deferred resulted from the sale of a plot of land located in Zayed city
No.21 (Crazy water corridor) and the construction built thereon, The Company had deferred and derecognized the gain of L.E 17 385 789 in the consolidated income statement as the sale transaction was in the form of a sale with a right of re-lease
within 10 years starting on January 2008 through to December 2017. The deferred revenue is to be amortized on straight line method base during the lease period starting from 1/1/2008.
The amortization during the year ended 31/12/2011 amounted to L.E 1 738 584 while the short term portion amounted to
L.E 584 738 1 as at 31/12/2011 (L.E. 1 738 584 as at 31/12/2010) included in the trade & other credit balances item of the
consolidated balance sheet (Note 24).
8 692 869 10 431 452
8 692 869 10 431 452
27 Deferred tax assets and liabilities
Deferred tax liability amounted to L.E 36 068 711 on 31/12/2011 is representing the accrued tax generated from the difference between net book value of assets on accounting basis and net book value of assets on tax basis.
Balance on1/1/2011
L.E
Deferred taxfrom 1st Jan
To 31 December 2011L.E
Balance on31/12/2011
L.E
Deferred tax liability from fixed assets 27 044 302 9 024 409 36 068 711
Recognized deferred tax assetsDeferred tax assets are representing in the following items:
Liabilities
31/12/2011L.E
31/12/2010L.E
Fixed assets 38 389 409 29 478 310
Deferred revenue (2 320 698) ( 2 434 008)
Net tax liabilities 36 068 711 27 044 302
28 Group companies
The following sets out the subsidiaries of Juhayna Food Industries Company that were acquired and controlled by the Company as at 31/12/2011 shown together with this respective contribution percentage held as at the balance sheet date.
Subsidiary Name Contribution percentage 31/12/2011
Contribution percentage 31/12/2010 Country
Egyptian Co. for Dairy & Juice Products 99.99 % 99.99 % Egypt
International Co. for Modern Food Industries 99.99 % 99.99 % Egypt
The Egyptian Company for Food Industries
“Egyfood”99.98 % 99.98 % Egypt
Tiba For Trading & Distributing 99.90 % 99.90 % Egypt
Al-Marwa for Food Industries 99.91 % 99.91 % Egypt
Modern Concentrates Industrial Co. 99.81 % 99.81 % Egypt
Inmaa for Agriculture Development Co. 99.994 % 99.97 % Egypt
Sister CompanyMilky’s 39.988 % Indirect 39.988 % Indirect Egypt
29 Financial instruments
Financial risk management OverviewThe Group has exposure to the following risks from its use of financial instruments:
• Credit risk.• Liquidity risk. • Market risk.
Risk management framework.The Board of Directors has overall responsibility for the establishment and oversight of the Company’s risk management framework. The Board is responsible for developing and monitoring the Company’s risk management policies.
The Company’s risk management policies are established to identify and analyse the risks faced by the Company, to set appropriate risk limits and controls, and to monitor risks and adherence to limits. Risk management policies and systems are reviewed regularly to reflect changes in market conditions and the Company’s activities. The Company, through its training and management standards and procedures, aims to develop a disciplined and constructive control environment in which all employees understand their roles and obligations.
The Company’s Board oversees how management monitors compliance with the Company’s risk management policies and procedures, and reviews the adequacy of the risk management framework in relation to the risks faced by the Company. The Company’s Board is assisted in its oversight role by Internal Audit. Internal Audit
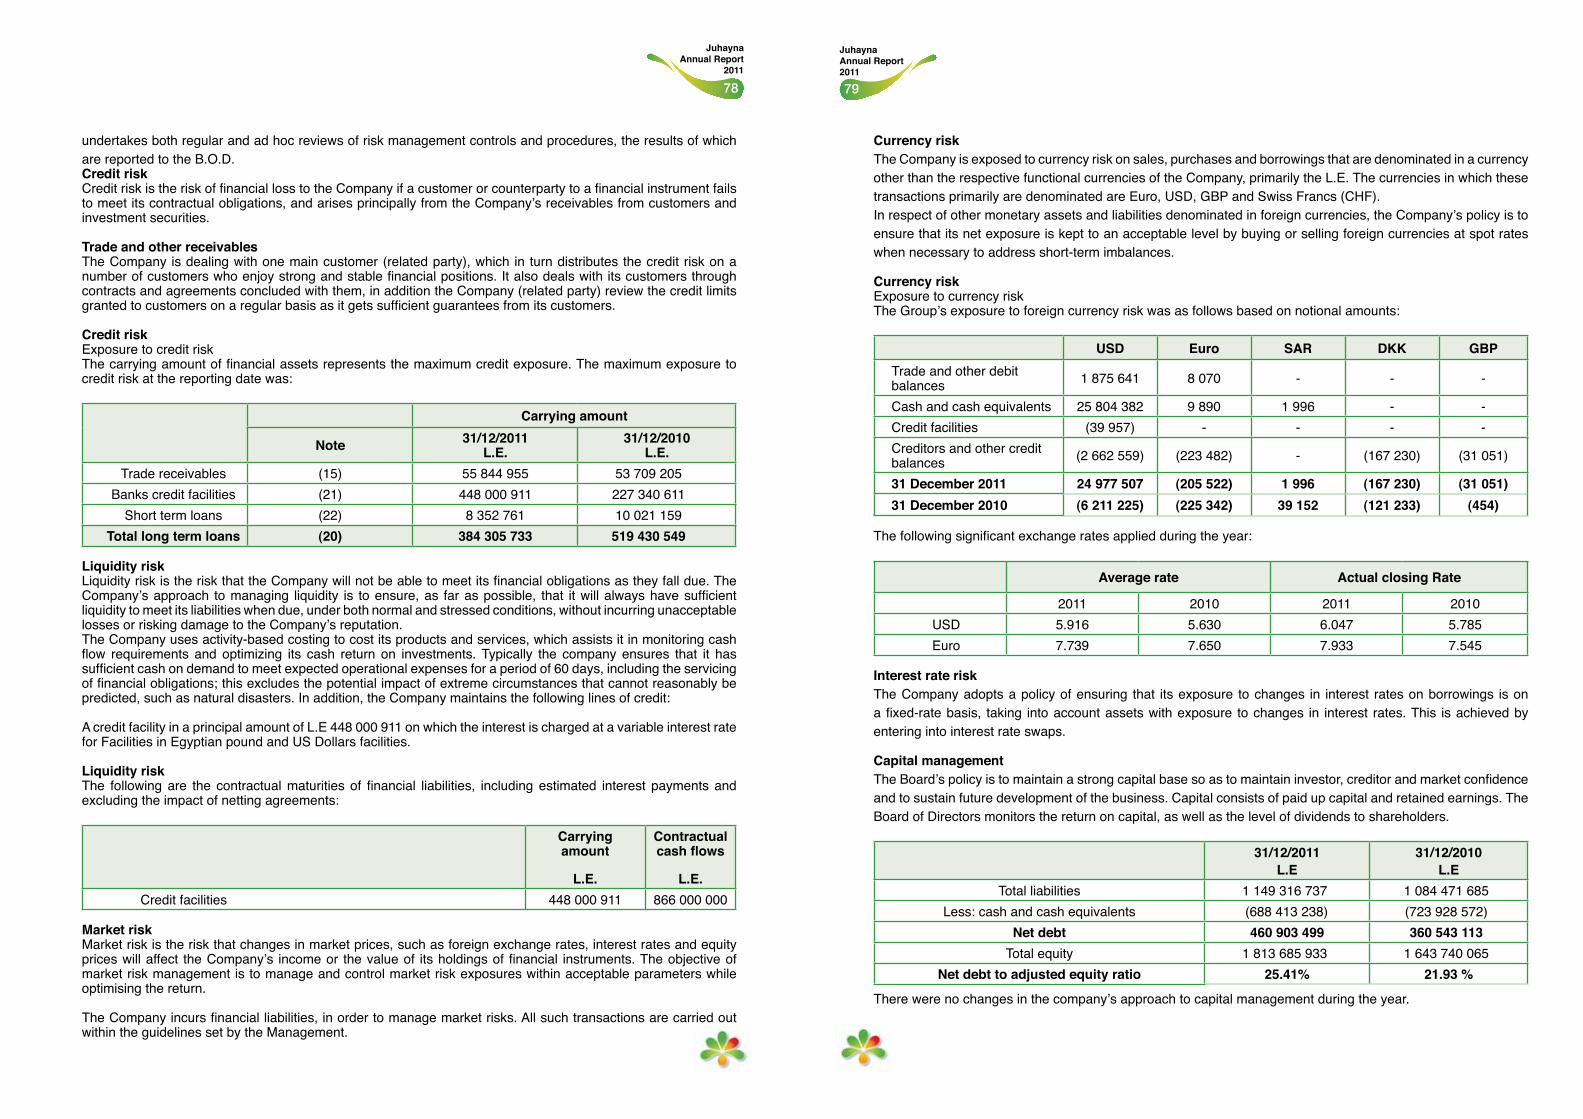
7978
Juhayna Annual Report 2011
Juhayna Annual Report
2011
undertakes both regular and ad hoc reviews of risk management controls and procedures, the results of which are reported to the B.O.D. Credit risk Credit risk is the risk of financial loss to the Company if a customer or counterparty to a financial instrument fails to meet its contractual obligations, and arises principally from the Company’s receivables from customers and investment securities.
Trade and other receivablesThe Company is dealing with one main customer (related party), which in turn distributes the credit risk on a number of customers who enjoy strong and stable financial positions. It also deals with its customers through contracts and agreements concluded with them, in addition the Company (related party) review the credit limits granted to customers on a regular basis as it gets sufficient guarantees from its customers.
Credit riskExposure to credit riskThe carrying amount of financial assets represents the maximum credit exposure. The maximum exposure to credit risk at the reporting date was:
Carrying amount
Note 31/12/2011L.E.
31/12/2010L.E.
Trade receivables (15) 55 844 955 53 709 205Banks credit facilities (21) 448 000 911 227 340 611
Short term loans (22) 8 352 761 10 021 159Total long term loans (20) 384 305 733 519 430 549
Liquidity riskLiquidity risk is the risk that the Company will not be able to meet its financial obligations as they fall due. The Company’s approach to managing liquidity is to ensure, as far as possible, that it will always have sufficient liquidity to meet its liabilities when due, under both normal and stressed conditions, without incurring unacceptable losses or risking damage to the Company’s reputation. The Company uses activity-based costing to cost its products and services, which assists it in monitoring cash flow requirements and optimizing its cash return on investments. Typically the company ensures that it has sufficient cash on demand to meet expected operational expenses for a period of 60 days, including the servicing of financial obligations; this excludes the potential impact of extreme circumstances that cannot reasonably be predicted, such as natural disasters. In addition, the Company maintains the following lines of credit:
A credit facility in a principal amount of L.E 448 000 911 on which the interest is charged at a variable interest rate for Facilities in Egyptian pound and US Dollars facilities.
Liquidity riskThe following are the contractual maturities of financial liabilities, including estimated interest payments and excluding the impact of netting agreements:
Carrying amount
L.E.
Contractual cash flows
L.E.Credit facilities 448 000 911 866 000 000
Market riskMarket risk is the risk that changes in market prices, such as foreign exchange rates, interest rates and equity prices will affect the Company’s income or the value of its holdings of financial instruments. The objective of market risk management is to manage and control market risk exposures within acceptable parameters while optimising the return.
The Company incurs financial liabilities, in order to manage market risks. All such transactions are carried out within the guidelines set by the Management.
Currency riskThe Company is exposed to currency risk on sales, purchases and borrowings that are denominated in a currency other than the respective functional currencies of the Company, primarily the L.E. The currencies in which these transactions primarily are denominated are Euro, USD, GBP and Swiss Francs (CHF).In respect of other monetary assets and liabilities denominated in foreign currencies, the Company’s policy is to ensure that its net exposure is kept to an acceptable level by buying or selling foreign currencies at spot rates when necessary to address short-term imbalances.
Currency riskExposure to currency riskThe Group’s exposure to foreign currency risk was as follows based on notional amounts:
USD Euro SAR DKK GBPTrade and other debit balances 1 875 641 8 070 - - -
Cash and cash equivalents 25 804 382 9 890 1 996 - -Credit facilities (39 957) - - - -Creditors and other credit balances (2 662 559) (223 482) - (167 230) (31 051)
31 December 2011 24 977 507 (205 522) 1 996 (167 230) (31 051)31 December 2010 (6 211 225) (225 342) 39 152 (121 233) (454)
The following significant exchange rates applied during the year:
Average rate Actual closing Rate
2011 2010 2011 2010USD 5.916 5.630 6.047 5.785Euro 7.739 7.650 7.933 7.545
Interest rate riskThe Company adopts a policy of ensuring that its exposure to changes in interest rates on borrowings is on a fixed-rate basis, taking into account assets with exposure to changes in interest rates. This is achieved by entering into interest rate swaps.
Capital managementThe Board’s policy is to maintain a strong capital base so as to maintain investor, creditor and market confidence and to sustain future development of the business. Capital consists of paid up capital and retained earnings. The Board of Directors monitors the return on capital, as well as the level of dividends to shareholders.
31/12/2011L.E
31/12/2010L.E
Total liabilities 1 149 316 737 1 084 471 685Less: cash and cash equivalents (688 413 238) (723 928 572)
Net debt 460 903 499 360 543 113Total equity 1 813 685 933 1 643 740 065
Net debt to adjusted equity ratio 25.41% 21.93 %
There were no changes in the company’s approach to capital management during the year.
8180
Juhayna Annual Report 2011
Juhayna Annual Report
2011
30 Financial lease contracts
The company signed a contract with Sajulis Leasing company to lease land and buildings and of system construction and leasing, as follows:
Land lease contracts (Sale with the right of lease back)On 30/10/2007 the Company signed a contract with regard to a land lease (including the building built thereon), of land located on plot no. 21 of the Crazy water’s corridor in Zayed City with a total area of 15 374.47 m². The contract terms became effective starting 1/1/2008. The following is a summary of the above mentioned contract:
Description
Lease valueLease period
Months
Purchase value at end of
contract
L.E
Monthly lease value
L.E
Contractual value
L.E
Accrued interest
L.Econtract from 1/1/2008 to
31/12/2017 73 453 985 47 559 261 120 1 1 008 444
• Juhayna for Food Industries Company acquired the above mentioned land and constructed a building thereon. Subsequently, the Company sold the land including the buildings to Segolease subject to the right of finance releases.
• The Company has leased the administration building of Tiba for Trading and Distributing Company (Subsidiary) following the operating lease system for a monthly lease rent of L.E. 195 500 based upon the approval from the leaser’s company.
• The monthly finance lease’s installments and the expenses related to the issue of this lease contract (sale with the right of re-sale) were allocated to the General and administrative expenses and other operating expenses item in the income statement Thus, total installments of the financial year ended 31/12/2011 amounted to L.E. 12 101 325.
31 Contingencies
On 31 December 2011 the Company had contingent liabilities in respect of bank and other guarantees and other matters arising in the ordinary course of business from which it is anticipated that no material liabilities will arise. In the ordinary course of business the Company has given guarantees amounting to LE 11 155 934 the cover amount to L.E 5 100 000.
32 Capital commitments
The capital commitments related to setting up and acquiring fixed assets amounted to L.E 902 274 334 on 31/12/2011.
33 Related party transactions
The related parties are represented in the Company’s shareholders and companies in which they own directly or indirectly shares giving them significant influence or controls over these companies.
The following is a summary of significant transactions concluded, during the current year, between the Company and its related parties.
33-1 Due from related parties
Company’s name Nature of transaction
Total value of transactions Balance as at
31/12/2011 31/12/201031/12/2011
L.E.
31/12/2010
L.EBonian for
Development & Investment
Currentaccount (500 000) 2 150 000 294 863 794 864
Milky’s Customer 1 516 543 - 1 186 612 -Vendor 299 149 -
1 481 475 794 864
34 The fire accident of the factory of The Egyptian Company for Food Industries “Egyfood” (subsidiary company)
The factory of one of the Group Company’s (The Egyptian Company for Food Industries “Egyfood”) located in 6th
of October city has been exposed to fire accident on 22/4/2010 which resulted in losses and damages in most of the Company’s assets which are insured with a total value of L.E. 299 million. The said company managed to determine the final losses as per the book balances resulting from such assets with the amount of L.E. 137.21 million, and the said company evidenced a claim against Al Mohandes Insurance Company within the extent of the redemption value of such assets with the amount of L.E. 176.6 million while the insurance company did not finish counting and approving the damaged assets resulting from the fire and Al Mohandes Insurance Company is currently in process of carrying out an adjustment of the value of the said damaged assets. The company send another claim to the insurance company amounted to L.E 170 million represent the replacement value of damaged assets because of fire accident which has a book value of L.E. 137.21 million.
On 24/11/2011 a final settlement agreement contract was signed between The Egyptian Company for Food Industries “Egyfood” (the company) and Al Mohandes Insurance Company. This contract stipulates that the company will obtain a monetary compensation which amounted to L.E. 82.5 million in addition to the value of assets wastes and rescued assets which amounted to L.E. 16.9 million and considered integral part of the agreed total compensation value. This compensation is to be paid on four instalments upon checks were received and deposited at the bank to be collected at due dates.
35 Political and economical events
The Arab Republic of Egypt has encountered certain events that have a significant impact on the economic sectors in general, a matter which may lead to a substantial decline in the economic activities in the foreseeable future.
Therefore, there is a possibility that the above mentioned events will have a significant impact on the Company’ssettlement amounts and the results of operations in the foreseeable future./assets, liabilities, their recoverableAt the present, it is not possible to quantify the effect on the Company’s assets and liabilities included in the company’s financial statements, since quantifying the effect of these events relies on the expected extent and the time frame, when these events and their consequences, are expected to be finished.
83
Juhayna Annual Report 2011
Investor Relations Department Fadwa Hossam IssaHead of Investor RelationsEmail: [email protected] Mostafa IbrahemSection Head Investor RelationsEmail: [email protected] Telephone: +202 38286417Fax: +202 38286567
Head Office:Address: 6 October City, Industrial zone number 1, Egypt
Tel: +202 38333655Fax: +202 38333663
Email: [email protected]: www.juhayna.com
www.juhayna.com