Embed Size (px)
Citation preview

2752
Nutr Hosp. 2015;31(6):2752-2763ISSN 0212-1611 • CODEN NUHOEQ
S.V.R. 318
Original / OtrosRelationship between the domains of the Multidimensional Students’ Life Satisfaction Scale, satisfaction with food-related life and happiness in university studentsBerta Schnettler1, Ligia Orellana2, Germán Lobos3, Horacio Miranda1, José Sepúlveda2, Soledad Etchebarne4, Marcos Mora5, Cristian Adasme-Berríos6 and Klaus G. Grunert7
1Departamento de Producción Agropecuaria, Facultad de Ciencias Agropecuarias y Forestales, Universidad de La Frontera (Temuco), Chile. 2Centro de Psicología Económica y del Consumo, Universidad de La Frontera (Temuco), Chile. 3Escuela de Ingeniería Comercial, Facultad de Economía y Negocios, Universidad de Talca (Talca), Chile. 4Departamento de Administración, Facultad de Economía y Negocios, Universidad de Chile (Santiago), Chile. 5Departamento de Economía Agraria, Facultad de Ciencias Agronómicas, Universidad de Chile (Santiago), Chile. 6 Departamento de Economía y Administración, Facultad de Ciencias Sociales y Económicas, Universidad Católica del Maule (Talca), Chile. 7MAPP Centre for Research on Customer Relations in the Food Sector, Aarhus University (Aarhus), Denmark.
Abstract
Aim: to characterize types of university students based on satisfaction with life domains that affect eating habits, satisfaction with food-related life and subjective happi-ness.
Materials and methods: a questionnaire was applied to a nonrandom sample of 305 students of both genders in five universities in Chile. The questionnaire included the abbreviated Multidimensional Student’s Life Satisfac-tion Scale (MSLSS), Satisfaction with Food-related Life Scale (SWFL) and the Subjective Happiness Scale (SHS). Eating habits, frequency of food consumption in and outside the place of residence, approximate height and weight and sociodemographic variables were measured.
Results: using factor analysis, the five-domain structu-re of the MSLSS was confirmed with 26 of the 30 items of the abbreviated version: Family, Friends, Self, Envi-ronment and University. Using cluster analysis four types of students were distinguished that differ significantly in the MSLSS global and domain scores, SWFL and SHS scores, gender, ownership of a food allowance card fun-ded by the Chilean government, importance attributed to food for well-being and socioeconomic status.
RELACIÓN ENTRE LOS DOMINIOS DE LA ESCALA MULTIDIMENSIONAL DE
SATISFACCIÓN CON LA VIDA, SATISFACCIÓN CON LA ALIMENTACIÓN Y FELICIDAD EN
ESTUDIANTES UNIVERSITARIOS
Abstract
Resumen
Objetivo: caracterizar tipologías de estudiantes uni-versitarios según la satisfacción en dominios de la vida que afectan a los hábitos alimentarios, satisfacción con la alimentación y nivel de felicidad subjetiva.
Material y método: se aplicó un cuestionario a una muestra no probabilística de 305 estudiantes de ambos géneros de cinco universidades de Chile. El cuestionario incluyó: Escala Multidimensional de Satisfacción con la Vida para Estudiantes (MSLSS) abreviada, Satisfacción con la Alimentación (SWFL) y la Escala de Felicidad Subjetiva (SHS). Se consultaron hábitos de consumo de alimentos, frecuencia de comidas dentro y fuera del lugar de residencia, peso y estatura aproximada y variables so-ciodemográficas.
Resultados: mediante análisis factorial se confirmó la estructura de cinco dominios de la MSLSS, con 26 de los 30 ítems de la versión abreviada: Familia, Amigos, Sí mismo, Entorno de vida y Universidad. Mediante análisis clúster se distinguieron cuatro tipologías que difirieron significativamente en los puntajes de los dominios de la MSLSS y en su puntaje global, en los puntajes de la SWFL, SHS, género, contar con una tarjeta de alimenta-ción financiada por el Estado chileno, importancia asig-nada a la alimentación para el bienestar personal y nivel socioeconómico.Correspondence: Berta Schnettler Morales.
Universidad de La Frontera. Casilla 54-D (Temuco), Chile E-mail: [email protected]: 30-XII-2014. 1.ª Revisión: 6-III-2015. Aceptado: 28-III-2015.
056_8593 Relacion entre los dominios de la escala.indd 2752 04/05/15 16:32

2753Nutr Hosp. 2015;31(6):2752-2763Relationship between the domains of the Multidimensional Students’ Life Satisfaction Scale, ...
Introduction
Subjective well-being (SWB) is an assessment peo-ple make of their own lives, including happiness, ple-asurable emotions, life satisfaction, and the relative absence of unpleasant emotional states1. Positive eva-luations of life satisfaction are linked to happiness and the achievement of the ‘good life’2. Numerous studies have addressed overall satisfaction with life and in cer-tain domains, including food. Recent studies with adult samples suggest that those who are satisfied with their food and eating habits are satisfied with their lives3-5. Others have concluded that healthful eating increases satisfaction with life6 and happiness7. However, the re-lation between these variables has not been analysed in younger populations, although recent studies show that eating is a domain that relates positively with life satisfaction8-10 and happiness in university students10,11.
The study of food as a life domain in university stu-dents is relevant because the period of university stu-dies is usually the first time youth take responsibility for their meals. Therefore, this critical stage in develo-pment of eating habits will affect their future health12-14. Satisfaction with food-related life is defined as a per-son’s overall assessment regarding their food and eating habits3. Evidence from adult population indicates that satisfaction with food-related life not only positively affects life satisfaction, it also relates with other life do-mains, like family and health5. Likewise, eating habits of university students are influenced by family10,13,15-18, living conditions13,14,16,19,20, university11,13,16,17,19, body image and self-concept9,13,17,20,21, friends and classma-tes10,11,13,16,17,19, among others. Therefore, if university students’ eating habits are influenced by these variables and satisfaction with food-related life reflects the ove-rall assessment regarding food and eating habits, it is expected that satisfaction with food-related life relates to students’ satisfaction in these life domains.
Much of the research on life satisfaction has relied upon global measures. Although this unidimensional perspective provides useful information, it may mask distinctions between life domains. A multidimensio-nal approach may provide richer, more differentiated profiles based on students’ educational, emotional and interpersonal needs22. Therefore, in this research
a typology of university students from various regions of Chile was developed based on satisfaction with life domains that affect students’ eating habits. The types were characterized by their level of satisfaction with food-related life, happiness, eating habits in and out of the place of residence, health-related aspects and so-cio-demographic characteristics. The abbreviated 30-item version of the Multidimensional Students’ Life Satisfaction Scale (MSLSS) proposed by Huebner et al.23 was used. Commonly used to provide a multidi-mensional profile of children and youth, the MSLSS assesses both overall life satisfaction and satisfaction across five domains: family, friends, school, living en-vironment and self24.
Materials and method
Participants
The convenience sample comprised 305 students from five state universities in different geographical areas of Chile (Universidad de Tarapacá-Arica, Uni-versidad de Chile-Santiago, Universidad de Talca-Tal-ca, Universidad de La Frontera-Temuco, Universidad de Magallanes-Punta Arenas). All participants were volunteers, with a mean age of 21.5 (SD=2.76); 39.8% were male and 60.2% female; 91.1% resided in an ur-ban area.
Instrument
The questionnaire included the following scales:
– Multidimensional Students’ Life Satisfaction Sca-le (MSLSS): a 40-item self-report scale designed for children of ages 8-18. It uses a 6-point Li-kert-type response scale, ranging from comple-tely disagree to completely agree23. Domain and global scores are computed by summing the va-lues of the items and then dividing them by the total number of items comprising each domain or by the total number of items of the scale, respecti-vely. Negatively worded items are reversed-keyed
Conclusions: higher levels of life satisfaction and ha-ppiness are associated with greater satisfaction with food-related life. Other major life domains that affect students’ subjective well-being are Family, Friends, Uni-versity and Self. Greater satisfaction in some domains may counterbalance the lower satisfaction in others.
(Nutr Hosp. 2015;31:2752-2763)
DOI:10.3305/nh.2015.31.6.8593Key words: Life satisfaction. Satisfaction with food-rela-
ted life. Happiness. Life domains. University students.
Conclusiones: mayores niveles de satisfacción con la vida y de felicidad se asocian con una mayor satisfacción con la alimentación. Otros dominios importantes que afectan al bienestar subjetivo de los estudiantes corres-ponden a la familia, los amigos, la universidad y el sí mis-mo. La mayor satisfacción en unos dominios compensa-ría la menor satisfacción en otros.
(Nutr Hosp. 2015;31:2752-2763)
DOI:10.3305/nh.2015.31.6.8593Palabras clave: Satisfacción con la vida. Satisfacción con
la alimentación. Felicidad. Dominios de la vida. Estudiantes universitarios.
056_8593 Relacion entre los dominios de la escala.indd 2753 04/05/15 16:32

2754 Nutr Hosp. 2015;31(6):2752-2763 Berta Schnettler Morales et al.
so that a higher mean score is indicative of higher levels of satisfaction with a particular domain. In this study, the abbreviated 30-item version of the MSLSS23 was used, which excludes the rever-se-keyed items. The internal consistency scores for the domain scores ranged from 0.71 to 0.9123. Although there is a Spanish-language version of the MSLSS available25, the scale was trans-lated from the original English version to adapt the language to Chilean culture. Two bilingual translators translated the MSLSS from English to Spanish, and a third translator back-translated the Spanish version into English. The differences were resolved by discussion, and all translators agreed on the final version. In addition, the items of the School domain were reworded using “uni-versity” instead of school.
– Satisfaction with Food-related Life Scale (SWFL): proposed and tested by Grunert et al.3, it consists of five items grouped into a single dimension (“Food and meals are positive elements”; “I am genera-lly pleased with my food”; “My life in relation to food and meals is close to ideal”; “With regard to food, the conditions of my life are excellent”; “Food and meals give me satisfaction in daily life”). Respondents must indicate their degree of agreement with the statements using a 6-point Li-kert scale (1: disagree completely, 6: agree com-pletely). This study used the Spanish versions of the SWFL, which has shown good levels of inter-nal consistency in previous studies with Chilean university student samples8-10. In this study, the SWFL scale presented adequate levels of internal consistency (Cronbach’s α=0.836). The average score of the SWFL was 19.18 (SD=4.92) out of a theoretical maximum of 30.
– Subjective Happiness Scale (SHS): Developed by Lyubomirsky and Lepper26, this instrument con-sists of four items on a 7-point Likert scale. The first item “is generally considered” goes from 1: a not very happy person, up to 7: a very happy person. The second item “compared with the ma-jority of their peers, is considered” goes from 1: less happy up to 7: happiest. Items 3 “Some peo-ple are very happy. They enjoy life despite what happens, taking benefits from almost everything. To what extent does this characterization descri-be you?” and 4 “Some people are not very ha-ppy. Although they are not depressed, they never seem as happy as they could be. To what extent does this characterization describe you?” go from 1: Not at all up to 7: totally. This study used the Spanish version of the SHS, which has previous-ly shown good levels of internal consistency in a study with Chilean university students10. In this study, the SHS presented good internal consisten-cy (Cronbach’s α=0.875). The average score of the SHS in the sample was 5.23 (SD=1.06) out of a theoretical maximum of 7.
Students were asked about the frequency of con-sumption of nine food groups categorized by the Na-tional Statistics Institute in the Surveys of Family Bu-dgets27. They were asked where they lived during the semester and the frequency of meals at their place of re-sidence. Those who ate daily at their place of residence were asked with whom they shared their meals. In case of eating outside the residence, they were asked where they usually had their meals. It was enquired whether they had a food allowance card provided by the Chi-lean government. They were also asked about the per-ceived importance of food for their well-being using a 6-point Likert scale (1: not important at all, 6: totally and completely important). The students were asked to indicate the education level and occupation of the head of the household to determine the socioeconomic status (SES) according to Adimark28. The combination of these two variables in a matrix made it possible to determine the SES of the household, corresponding to high and upper middle (ABC1), middle-middle (C2), lower middle (C3), low (D) and very low (E). Finally, their estimated weight and height were assessed in or-der to calculate their body mass index (BMI) (kg/m2).
Procedure
The execution of the study was approved by the Ethics Committee of the Universidad de La Fronte-ra. Prior to the survey, the questionnaire was pretes-ted with 30 students from said university with similar characteristics. As no problems were detected in the pretest, no changes were required in the questionnai-re. The survey was administered through the online survey program QuestionPro, during March and May 2014. QuestionPro is an online service for conducting online research. It allows the creation and administra-tion of survey and polls with different types of ques-tions and formats and the distribution may be private (through email or direct links) or public distribution through social networks or embebed links29. The par-ticipants signed informed consent statements before responding.
The MSLSS scale factors were extracted using principal component analysis, considering eigenva-lues greater than 1 and a varimax factor rotation30. To determine the adequacy of the factor analysis, the Kaiser-Meyer-Olkin (KMO) test and Bartlett’s test of sphericity were used. A cluster analysis (hierarchical conglomerates) was used to determine student types based on the MSLSS factors, with linkage by Ward’s method and the squared Euclidian distance as the me-asure of similarity between objects30. This analysis was applied to the Z-scores resulting from the MSLSS factor analysis. The number of groups was determi-ned based on the percentage change of the recompo-sed conglomeration coefficients. To describe the seg-ments, Pearson’s Chi2 test was applied to the discrete variables, and analyses of variance to the Z-scores re-
056_8593 Relacion entre los dominios de la escala.indd 2754 04/05/15 16:32
2755Nutr Hosp. 2015;31(6):2752-2763Relationship between the domains of the Multidimensional Students’ Life Satisfaction Scale, ...
sulting from the factor analysis of the benefits. Becau-se the Levene’s statistic indicated non-homogeneous variances in all the continuous variables analysed, the variables for which the analysis of variance resulted in significant differences (P<0.001) were subjected to Dunnett’s T3 multiple comparisons test. The program-me used was SPSS v. 16.0 (SPSS, 2007) for Windows.
Results
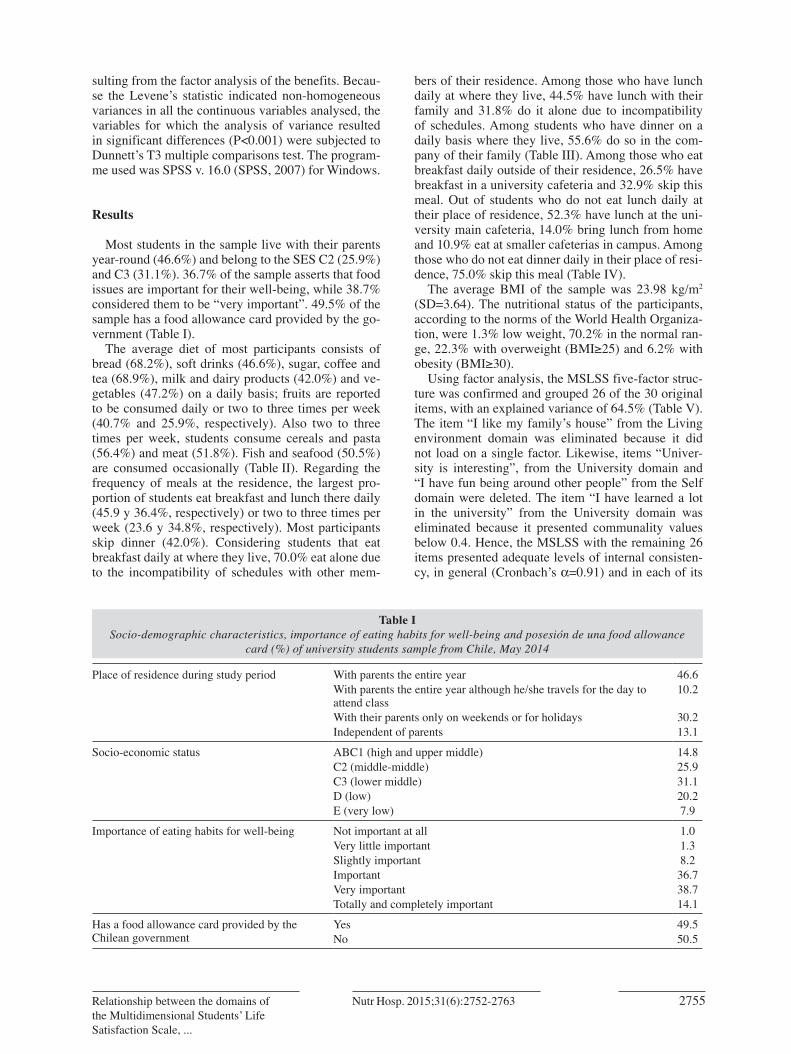
Most students in the sample live with their parents year-round (46.6%) and belong to the SES C2 (25.9%) and C3 (31.1%). 36.7% of the sample asserts that food issues are important for their well-being, while 38.7% considered them to be “very important”. 49.5% of the sample has a food allowance card provided by the go-vernment (Table I).
The average diet of most participants consists of bread (68.2%), soft drinks (46.6%), sugar, coffee and tea (68.9%), milk and dairy products (42.0%) and ve-getables (47.2%) on a daily basis; fruits are reported to be consumed daily or two to three times per week (40.7% and 25.9%, respectively). Also two to three times per week, students consume cereals and pasta (56.4%) and meat (51.8%). Fish and seafood (50.5%) are consumed occasionally (Table II). Regarding the frequency of meals at the residence, the largest pro-portion of students eat breakfast and lunch there daily (45.9 y 36.4%, respectively) or two to three times per week (23.6 y 34.8%, respectively). Most participants skip dinner (42.0%). Considering students that eat breakfast daily at where they live, 70.0% eat alone due to the incompatibility of schedules with other mem-
bers of their residence. Among those who have lunch daily at where they live, 44.5% have lunch with their family and 31.8% do it alone due to incompatibility of schedules. Among students who have dinner on a daily basis where they live, 55.6% do so in the com-pany of their family (Table III). Among those who eat breakfast daily outside of their residence, 26.5% have breakfast in a university cafeteria and 32.9% skip this meal. Out of students who do not eat lunch daily at their place of residence, 52.3% have lunch at the uni-versity main cafeteria, 14.0% bring lunch from home and 10.9% eat at smaller cafeterias in campus. Among those who do not eat dinner daily in their place of resi-dence, 75.0% skip this meal (Table IV).
The average BMI of the sample was 23.98 kg/m2 (SD=3.64). The nutritional status of the participants, according to the norms of the World Health Organiza-tion, were 1.3% low weight, 70.2% in the normal ran-ge, 22.3% with overweight (BMI≥25) and 6.2% with obesity (BMI≥30).
Using factor analysis, the MSLSS five-factor struc-ture was confirmed and grouped 26 of the 30 original items, with an explained variance of 64.5% (Table V). The item “I like my family’s house” from the Living environment domain was eliminated because it did not load on a single factor. Likewise, items “Univer-sity is interesting”, from the University domain and “I have fun being around other people” from the Self domain were deleted. The item “I have learned a lot in the university” from the University domain was eliminated because it presented communality values below 0.4. Hence, the MSLSS with the remaining 26 items presented adequate levels of internal consisten-cy, in general (Cronbach’s α=0.91) and in each of its
Table I Socio-demographic characteristics, importance of eating habits for well-being and posesión de una food allowance
card (%) of university students sample from Chile, May 2014
Place of residence during study period With parents the entire year 46.6With parents the entire year although he/she travels for the day to attend class
10.2
With their parents only on weekends or for holidays 30.2Independent of parents 13.1
Socio-economic status ABC1 (high and upper middle) 14.8C2 (middle-middle) 25.9C3 (lower middle) 31.1D (low) 20.2E (very low) 7.9
Importance of eating habits for well-being Not important at all 1.0Very little important 1.3Slightly important 8.2Important 36.7Very important 38.7Totally and completely important 14.1
Has a food allowance card provided by the Chilean government
Yes 49.5No 50.5
056_8593 Relacion entre los dominios de la escala.indd 2755 04/05/15 16:32

2756 Nutr Hosp. 2015;31(6):2752-2763 Berta Schnettler Morales et al.
domains. The value of the KMO sample adequacy test is considered excellent, and Bartlett’s test of spherici-ty was significant (p≤0.001)30. This finding is consis-tent with that obtained by Jovanovic and Zuljevic24 in Serbia, who found a better fit with a 25-item model, excluding all negatively worded and some positively
worded items. The average score the MSLSS was 4.45 (SD=0.59) out of a theoretical maximum of 6. The Pearson correlation between MSLSS and SWFL was 0.389 (p<0.01).
Using a cluster analysis, four student types were detected with significant differences in the Z-scores
Table II Eating habits (%) of university students sample from Chile, May 2014
Frequency of consumption of bread Daily 68.22-3 times a week 20.3Once a week 3.6Occasionally 4.9Does not consume 3.0
Frequency of consumption of cereals and pasta Daily 22.02-3 times a week 56.4Once a week 16.7Occasionally 3.6Does not consume 1.3
Frequency of consumption of meat Daily 23.32-3 times a week 52.8Once a week 11.1Occasionally 8.2Does not consume 5.6
Frequency of consumption of fish and seafood Daily 0.72-3 times a week 11.1Once a week 25.9Occasionally 50.5Does not consume 11.8
Frequency of consumption of milk and dairy products Daily 35.12-3 times a week 42.0Once a week 13.1Occasionally 7.9Does not consume 2.0
Frequency of consumption of fruits Daily 25.92-3 times a week 40.7Once a week 15.4Occasionally 15.7Does not consume 2.3
Frequency of consumption of vegetables Daily 47.52-3 times a week 36.7Once a week 8.9Occasionally 5.6Does not consume 1.3
Frequency of consumption of soft drinks Daily 46.62-3 times a week 26.6Once a week 10.2Occasionally 12.5Does not consume 4.3
Frequency of consumption of sugar, coffee and tea Daily 68.92-3 times a week 15.4Once a week 4.9Occasionally 5.9Does not consume 4.9
056_8593 Relacion entre los dominios de la escala.indd 2756 04/05/15 16:32

2757Nutr Hosp. 2015;31(6):2752-2763Relationship between the domains of the Multidimensional Students’ Life Satisfaction Scale, ...
Table III Frequency of meals at the residence and companions with whom the students eat daily at the place of residence (%)
of university students sample from Chile, May 2014
Frequency of breakfast at the residence Daily 45.9Two or three times a week 23.6Only on weekends 4.6Occasionally 17.4Never 5.2Does not have breakfast 3.3
Frequency of lunch at the residence Daily 36.4Two or three times a week 34.8Only on weekends 13.4Occasionally 11.1Never 3.6Does not have lunch 0.7
Frequency of diner at the residence Daily 26.9Two or three times a week 9.2Only on weekends 1.3Occasionally 10.8Never 9.8Does not have diner 42.0
Companions for breakfast at the place of residence (daily) With their family 19.3With roommates 3.6Alone, due to incompatible schedules 70.0Alone, because they live alone 7.1
Companions for lunch at the place of residence (daily) With their family 44.5With roommates 17.3Alone, due to incompatible schedules 31.8Alone, because they live alone 6.4
Companions for dinner at the place of residence (daily) With their family 55.6With roommates 17.2Alone, due to incompatible schedules 22.2Alone, because they live alone 4.9
Table IV Place where the student eats in case he/she doesn’t eat at the place of residence (%) of university students sample
from Chile, May 2014
Place where the student eats breakfast, in case it is not at the place of residence
University main cafeteria 17.4Smaller cafeteria in campus 26.5Food stand in campus or nearby 7.1Buys snacks in a store near campus 4.5Brings food from home and eats it anywhere 11.6Skips breakfast 32.9
Place where the student eats lunch, in case it is not at the place of residence
University main cafeteria 52.3Smaller cafeteria in campus 10.9Food stand in campus or nearby 3.1Fast food restaurant near campus 9.3Buys snacks in a store near campus 4.6Brings food from home and eats it anywhere 14.0Skips lunch 5.7
Place where the student eats dinner, in case it is not at the place of residence
University main cafeteria 3.1Smaller cafeteria in campus 5.2Food stand in campus or nearby 5.1Fast food restaurant near campus 6.2Brings food from home and eats it anywhere 5.3Skips dinner 75.0
056_8593 Relacion entre los dominios de la escala.indd 2757 04/05/15 16:32

2758 Nutr Hosp. 2015;31(6):2752-2763 Berta Schnettler Morales et al.
(Table VI) of the five components obtained from the MSLSS (p≤0.001). The types differed significantly in the scores of the SWFL, MSLSS and SHS (p≤0.001) (Table VII). They also differed in owning a food allowance card, gender, importance of food for the well-being and SES (p≤0.05) (Table VIII).
Group 1, Satisfied with their food-related life, with their self and university (33.4%): This group scored significantly higher than the other groups on the Self and University domains. Participants in this group had a low score on Friends (Table VI). These students scored significantly higher on SWLF and SHS scales
Table V Results of factor analysis of principal components for the MSLSS in university students from various regions of Chile,
May 2014.
Components
Family Friends Self Living environment University
My family gets along well 0.814 -0.014 0.065 0.149 0.081
I like being at home with my family 0.797 0.114 0.119 0.109 0.007
My family is better than most 0.794 0.103 0.129 0.152 -0.061
The members of my family speak well… 0.774 0.094 0.073 0.128 0.057
My parents and I do fun things together 0.746 0.142 0.142 0.139 0.060
My parents treat me fairly 0.739 0.185 0.087 0.000 0.024
I like spending time with my parents 0.731 0.170 0.128 0.048 0.083
My friends are excellent 0.172 0.857 0.099 0.073 0.128
My friends help me if I need it 0.089 0.824 0.125 0.125 0.127
I have a lot of fun with my friends 0.140 0.754 0.056 0.112 0.030
My friends treat me well 0.095 0.750 0.272 0.046 0.067
My friends are nice 0.217 0.694 0.234 0.019 -0.027
I have enough friends 0.062 0.664 0.160 0.153 0.112
Most people like me 0.059 0.084 0.813 0.087 0.097
I think I’m good looking 0.112 0.174 0.811 0.116 0.042
I consider myself a nice person 0.165 0.103 0.763 0.075 0.078
I like how I am 0.223 0.236 0.756 0.169 0.031
There are many things I do well 0.028 0.258 0.691 0.086 0.202
I like to try new things 0.109 0.084 0.554 -0.021 0.089
I like where I live 0.186 0.093 0.064 0.871 -0.059
I like my neighborhood 0.102 0.159 0.076 0.859 -0.047
I like my neighbors 0.214 0.083 0.032 0.676 0.211
There are many fun things to do where I live 0.090 0.114 0.219 0.655 0.116
I like being in the university 0.052 0.151 0.153 0.041 0.828
I look forward to going to the university 0.081 0.039 0.034 0.129 0.814
I like university activities 0.028 0.142 0.264 -0.002 0.743
Variance explained by component (%) 29.65 11.98 8.43 7.72 6.64
Cumulative variance (%) 29.65 41.64 50.08 57.80 64.45
Cronbach’s α per component 0.90 0.86 0.86 0.85 0.79Extraction method: principal components analysis. Rotation method: Varimax with Kaiser Normalization. Rotation converged in five iterations. Measure of sampling adequacy: Keiser-Meyer-Olkin (KMO) = 0.868. Bartlett’sTest of Sphericity, approximate Chi-square = 4297.013; gl = 325; p = 0.000. Note: the remaining item should qualified the following standards: the eigenvalues of each extracted factor should be more than 1.000; the factor loadings of each reserved item should be more than 0.40; each item should be only loaded on a single factor; each factor should include at least 3 items.
056_8593 Relacion entre los dominios de la escala.indd 2758 04/05/15 16:32

2759Nutr Hosp. 2015;31(6):2752-2763Relationship between the domains of the Multidimensional Students’ Life Satisfaction Scale, ...
than Groups 3 and 4. The MSLSS total score was sig-nificantly lower than Group 2 (Table VII). Group 1 had a higher proportion of students with a food allowance card (58.8%) and that belonged to the SES C3 (39.2%) (Table VIII).
Group 2, Satisfied with their food-related life, with their family, friends and living environment (20.7%): This group scored significantly higher than the rest of groups on Family, Friends and Living en-vironment domains (Table VI). This group had the hi-ghest scores on the SWFL and SHS scales, although there were no statistical differences with Group 1 (Ta-ble VII). Group 2 had the highest score on the MSLSS, significantly higher than the rest of the groups. Group 2 had more students who considered that food is “to-tally and completely important” for their well-being (26.4%) and that belonged to the SES E (15.1%) (Ta-ble VIII).
Group 3, Moderately satisfied with their food-re-lated life, dissatisfied with their family and self (21.3%). This group scored the lowest on Family and Self, although the latter did not differ statistically from Group 4 (Table VI). Group 3 scored significant-ly lower than Groups 1 and 2 on SWFL, MSLSS and SHS scales (Table VII). Group 3 consisted of a higher proportion of students that belonged to the SES C2 (45.5%).
Group 4, Moderately satisfied with their food-re-lated life, dissatisfied with their friends and univer-sity (24.6%). This group scored significantly lower
than the rest of the groups on Friends and Universi-ty. It also had a low score on Self, although it did not differ significantly from Groups 2 and 3 (Table VI). Students in this group had significantly lower scores on the SWFL, MSLSS and SHS scales than Groups 1 and 2. Group 4 consisted of a higher proportion of stu-dents who did not own a food allowance card (62.1%), male (57.6%), and who considered that food is not at all important for their well-being (4.5%) (Table VIII).
Discussion
The results confirm a five-factor structure for the MSLSS in a sample of university students from di-fferent regions of Chile, showing adequate global and domain internal consistency, with 26 out of the 30 ori-ginal items of the abbreviated version23. Therefore, the MSLSS may be useful to measure domain-specific life satisfaction in university students.
From the Z-scores of the Family, Friends, Self, Li-ving environment and University domains, four stu-dent types were distinguished, which differed in MSL-SS domain and global scores, SWFL and SHS scores. They also differed in ownership of a food allowance card, gender, assigned importance to food for well-be-ing and SES. The types did not differ in the frequency of consumption of food groups, place of residence du-ring the semester, frequency of meals in and out of the place of residence, nor BMI. These results contradict
Table VI Z-score averages of groups obtained from cluster analysis, students of state universities in Chile, May 2014
Component Group 1(n = 102)
Group 2(n = 63)
Group 3 (n = 65 )
Group 4 (n = 75) F P-value
Family 0.194 b 0.698 a -1.391 c 0.302 b 65.978 0.000 *
Friends -0.162 c 0.829 a 0.310 b -0.855 d 35.500 0.000 *
Self 0.493 a -0.114 bc -0.537 c -0.405 c 17.369 0.000 *
Living environment 0.143 b 0.712 a 0.248 b -0.051 b 92.050 0.000 *
University 0.600 a -0.181 b -0.193 b -0.753 c 27.044 0.000 **Significant at 1%. Letters in horizontal orientation indicate statically significant differences according to Dunnett’s T3 Comparison test (p≤0.001) for non-homogeneous variables.
Table VII Average scores for the SWFL, 26-item version MSLSS and SHS scales in groups obtained by cluster analysis in
university students from various regions in Chile. May 2014
Group 1(n = 102)
Group 2(n = 63)
Group 3 (n = 65 )
Group 4 (n = 75) F P-value
SWFL 20.19 a 20.67 a 17.85 b 17.33 b 6.046 0.000
MSLSS 4.73 b 5.04 a 3.95 c 4.17 c 69.285 0.000
SHS 5.50 a 5.53 a 4.75 b 4.97 b 7.056 0.000*Significant at 1%. Letters in horizontal orientation indicate statically significant differences according to Dunnett’s T3 Comparison test (p≤0.001) for non-homogeneous variables.
056_8593 Relacion entre los dominios de la escala.indd 2759 04/05/15 16:32

2760 Nutr Hosp. 2015;31(6):2752-2763 Berta Schnettler Morales et al.
reports indicating that university students living with their family have more healthful eating habits8,10,13,15-18, which relate to higher satisfaction with their life and food related-life8,10 and lower overweight and obesity prevalence8,10,18. Some studies also assert that living with friends and classmates during the semester may negatively influence students’ eating habits8,10,19. This in turn is linked to living conditions13,14,16,18-20, by asso-ciating the type of nutrition (healthful or unhealthful) to whether they are living with their family, peers or in dormitories during the semester. Evidence indicates that the quality of the living environment affects the SWB in adolescents2,24. According to Oberle et al.31, supportive and positive relationships with peers and non-related adults in the community are significant-ly and positively related to life satisfaction. This may help explain higher scores in Group 2 for the Living environment domain, as well as for the SWFL, SHS and MSLSS.
Inconsistencies between the literature cited and the results of this study on the Family and Friends domains may relate to the MSLSS items that make up these do-mains, which mainly focus on the social interaction of students with their families and friends. The pleasu-re of eating is associated with social interaction, es-
pecially in university students13. In this respect, it has been reported that students who receive more social support from their family are more satisfied with their life10,31-33, with their food-related life10 and experience more happiness10,33. This is consistent with the highest scores in Group 2, and the lowest scores in Group 3 in SWFL, MSLSS and SHS and the Family domain, respectively. However, the characteristics of Group 4, statistically similar to Group 3 on SWFL, MSLSS, SHS scores and an intermediate score on Family, sug-gest that satisfaction with family alone is not enough.
Peers, particularly roommates and partners, seem to have the largest influence on students, positively and negatively, by acting as role models and provi-ding both social support16 and social pressure16,17. In a qualitative study with UK university students, Brown et al.11 concluded that eating involved socialising and building relationships, and that being in company with friends enhanced the experience of eating, which in turn made them experience more happiness. The opposite can become a strong source of social pressure and it may be associated with feelings of loneliness and even stigmatization11. Also, there is evidence that social support from friends and peers has a major in-fluence on life satisfaction24,31. This is consistent with
Table VIII Characteristics (%) with statistically significant differences in groups of university students from various regions of Chile
obtained by cluster analysis. May 2014
Group 1(n = 102)
Group 2(n = 63)
Group 3 (n = 65 )
Group 4 (n = 75)
Food allowance card P = 0.027
Yes 58.8 49.1 40.0 37.9
No 41.2 50.9 60.0 62.1
Gender P = 0.014
Male 38.2 30.8 30.9 57.6
Female 61.8 69.2 69.1 42.4
Importance food on well-being P = 0.017
Not at all important 0.0 0.0 0.0 4.5
Very little important 2.0 1.9 0.0 1.5
A little important 5.9 5.7 12.7 12.1
Important 44.1 41.5 38.2 28.8
Very important 44.1 41.5 38.2 28.8
Totally and completely important 14.7 26.4 7.3 6.1
Socio-economic status P = 0.003
ABC1 (high and upper middle) 14.7 22.6 9.1 16.7
C2 (middle-middle) 17.6 18.9 45.5 31.8
C3 (lower middle) 39.2 24.5 25.5 31.8
D (low) 23.5 18.9 14.5 13.6
E (very low) 4.9 15.1 5.5 6.1
056_8593 Relacion entre los dominios de la escala.indd 2760 04/05/15 16:32

2761Nutr Hosp. 2015;31(6):2752-2763Relationship between the domains of the Multidimensional Students’ Life Satisfaction Scale, ...
the higher scores for Group 2 and lower scores for Group 4 on the SWFL, MSLSS, SHS and the Friends domain. However, the characteristics of Group 3, with statistically similar scores to Group 4 in SWFL, MSL-SS, SHS, and an intermediate score on Friends, allows suggesting that satisfaction with friends alone is not enough either. This may be associated with low sco-res on Self by groups 3 and 4, which had the lowest scores on the SWFL, MSLSS and SHS. Goodwin and Hernández32 found that perceived support from friends was significantly correlated with self-esteem. In uni-versity students, SWB is linked to positive relations to people who are the closest (especially friends) and po-sitive evaluations of oneself34. In this regard, students in Groups 3 and 4 scored particularly low on the Self items “Most people like me”, “I like how I am” and “I think I’m good looking”, which would partly explain the lower scores on the SHS, representing the affective component of SWB.
Similarly, although no significant differences in BMI were obtained among the student groups, these results may be linked to low satisfaction with food-re-lated life. There is evidence that people unsatisfied with their body image turn to eating as an immedia-te distraction to avoid and forget negative feelings on their corporeality, thus reducing anxiety and threats to the self21, which may affect negatively their satisfac-tion with food-related life. Students with important weight fluctuations are reportedly less satisfied with their food-related life than those who maintain their weight9 and thus may be more satisfied with their body image. This aspect is a highly relevant variable for uni-versity students, who generally aspire to be attractive to others17 and adjust to the sociocultural Thin Ideal image13. Additionally, students who reported greater body dissatisfaction had poorer social and academic adjustment20. This is in line with the low scores for Group 4 on Friends, Self and University. Therefore, it is reasonable to expect that adjustment problems may contribute to a declining SWB20, while the oppo-site happens in Group 1, with high scores on Self and University. Educational institutions may operate as a protective force for young individuals, and it is posi-tively relates to well-being, self-esteem, and acade-mic engagement, achievement and adjustment31. This is noteworthy and must be considered by university authorities, given that more positive perceptions of the university environment tend to be associated with greater student engagement in educational experiences and in the learning process and, in turn, academic suc-cess35.
Differences in the SES composition between Groups 1, 2 and 3 confirm that this variable is related to stu-dents’ life satisfaction2,10, satisfaction with food-re-lated life and happiness10. The budgetary restrictions that affect university students negatively impacts their SWB10,36, the quality of their eating habits11,14-16 and their food-related life10. However, contrary to the fin-dings of these studies, the present research reports that
the lowest scores for SWFL, MSLSS and SHS belon-ged to Group 3, with a higher proportion of students from the SES C2. On the other hand, Group 2 had the highest scores in these scales and had a higher pro-portion of students from families of the SES E. In this regard, Lyubomirsky et al.37 have asserted that family social support satisfies fundamental needs for accep-tance, belonging and love, which cannot be satisfied by economic security alone, as occurs in Group 2 (the highest score in the Family domain) and Group 3 (the lowest score). Regarding Group 1, with high scores on the SWFL and SHS scales, intermediate scores on the MSLSS and the Family domain, and higher presence of students from the SES C3, it can be suggested that budgetary constraints that may affect their SWB are counterbalanced by greater satisfaction in other do-mains such as Self and University.
In the case of the food domain, the highest level of satisfaction with food-related life may be linked to ownership of a food allowance card provided by the Chilean government. This may allow students to meet their food needs and experience positive levels of sa-tisfaction with food-related life and in the Universi-ty domain. This is in line with the findings of Gaines et al.15 in a sample of university students in the USA, in which they found that food assistance improves students’ nutrition. Also, this result is in contrast to studies indicating easy access to unhealthful food in campus which affects students negatively13,17,19. On the contrary, holders of the food allowance card provided by the Chilean government have access to healthful food.
Finally, Group 2 had the highest proportion of stu-dents who believe that food is “totally and completely important” to their well-being, and the higher presence of students from Group 4 who believe that food is “not at all important” to their well-being. In part, these di-fferences may be due to a higher presence of men in Group 4, because women tend to be more concerned with food and eating behaviour than men19. Additio-nally, this confirms that students’ assigned importance to food for their well-being relates to satisfaction with life and with food-related life8,9. Therefore, there is a need to foster educational campaigns about the impor-tance of food for a higher well-being, physical but also psychological.
Thus, it is possible to indicate that life satisfaction, measured through the MSLSS, relates to satisfaction with food-related life and subjective happiness in uni-versity students. These components of SWB are rela-ted to satisfaction in other domains, such as family, friends, self, and university. However, the results ob-tained indicate that similar levels of satisfaction with life, with food-related life and happiness may be asso-ciated with satisfaction in different life domains, i.e. higher levels of SWB may be associated with greater satisfaction with the Self and University, but these le-vels can also be achieved through greater satisfaction with family and friends. This suggests that satisfaction
056_8593 Relacion entre los dominios de la escala.indd 2761 04/05/15 16:32

2762 Nutr Hosp. 2015;31(6):2752-2763 Berta Schnettler Morales et al.
in some domains counterbalance the lower satisfaction in others.
Limitations of this study include the non-probabi-listic nature of the sample and its relatively small size, which does not allow generalization of the results. Also, all data were self-reported, thus responses may be affected by social desirability and recall or response bias. Another limitation of the study lies in asking only the frequency of food consumption and not the amount ingested; therefore, it is not possible to analyse the real nutritional contribution of their intake. These aspects must be dealt with in future studies.
Based on the results obtained, the following can be concluded:
– Four types of university students were distingui-shed that differ significantly in the MSLSS global and domain scores, SWFL and SHS scores, gen-der, ownership of a food allowance card funded by the Chilean government, importance attributed to food for well-being and socioeconomic status.
– Higher levels of life satisfaction and happiness are associated with greater satisfaction with food-related life. Other major life domains that affect students’ subjective well-being are Family, Friends, University and Self.
– Greater satisfaction in some domains may coun-terbalance the lower satisfaction in others. Howe-ver, students reporting satisfaction in more do-mains of the MSLSS tend to have higher levels of life satisfaction, satisfaction with food-related life and happiness.
– Higher levels of satisfaction with food-life are re-lated to the importance of food assigned by the students to their well-being.
Acknowledgements
These results belong to the Fondecyt Project 1130165.
References
1. Diener E, Biswas-Diener R. New directions in subjective we-ll-being research: The cutting edge. In E. Diener (Ed.), Positi-ve psychology. 2000. Available online at http://stat.psych.uiuc.edu/*ediener/hottopic/NEW_DIRECTIONS.htlm.
2. Proctor CL, Linley PA, Maltby J. Youth life satisfaction: A re-view of the literature. J Happiness Stud. 2009; 10: 583-630.
3. Grunert K, Dean D, Raats M, Nielsen N, Lumbers M. A mea-sure of satisfaction with food-related life. Appetite 2007; 49(2): 486-93.
4. Schnettler B, Peña JP, Mora M, Miranda H, Sepúlveda J, Dene-gri M, Lobos, G. Estilos de vida en relación a la alimentación y hábitos alimentarios dentro y fuera del hogar en la Región Metropolitana de Santiago, Chile. Nutr Hosp. 2013; 28(4): 1266-1273.
5. Schnettler B, Miranda H, Sepúlveda J, Orellana L, Denegri M, Mora M, Lobos G. Variables que influyen en la satisfacción con la vida en personas de distinto nivel socioeconómico en el sur de Chile. Suma Psicológica 2014; 21(1): 54-62.
6. Blanchflower D, Oswald A, Stewart-Brown S. Is psychological well-being linked to the consumption of fruit and vegetables? Soc Indic Res. 2013; 114: 785-801.
7. White B, Horwath C, Conner T. Many apples a day keep the blues away – Daily experiences of negative affect and food consumption in young adults. Br J Health Psychol. 2013; 18: 782-798.
8. Schnettler B, Denegri M, Miranda H, Sepúlveda J, Orellana L, Paiva G, Grunert KG. Hábitos alimentarios y bienestar subje-tivo en estudiantes universitarios del sur de Chile. Nutr Hosp 2013; 28(6): 2221-2228.
9. Schnettler B, Miranda H, Sepúlveda J, Orellana L, Etchebarne S, Lobos G, Mora M, Denegri M, Grunert KG. Dietary restra-int and subjective well-being in university students in Chile. Nutr Hosp 2014; 30(2): 453-461.
10. Schnettler B, Denegri M, Miranda H, Sepúlveda J, Orellana L, Paiva G, Grunert KG. Family support and subjective well-be-ing: an exploratory study of university students in southern Chi-le. Soc Indic Res, (in press), doi 10.1007/s11205-014-0718-3.
11. Brown L, Edwards J, Hartwell H. Eating and emotion: focusing on the lunchtime meal. Br Food J 2013; 115(2-3): 196-208.
12. Cervera F, Serrano R, Daouas T, Delicado A, García M. Há-bitos alimentarios y evaluación nutricional en una población universitaria Tunecina. Nutr Hosp, 2014; 30(6): 1350-1358.
13. Deliens T, Clarys P, De Bourdeaudhuij I, Deforche B. Determi-nants of eating behaviour in university students: a qualitative study using focus group discussions. BMC Public Health 2014; 14: 53.
14. Verger P, Combes JB, Kovess-Masfety V, Choquet M, Gua-gliardo V, Rouillon F, Peretti-Wattel P. Psychological distress in first year university students: socioeconomic and academic stressors, mastery and social support in young men and wo-men. Soci Psych Psych Epid. 2009; 44: 643-650.
15. Gaines A, Robb CA, Knol LL, Sickler S. Examining the role of financial factors, resources and skills in predicting food se-curity status among college students. Int J Consumer Studies, 2014; 38: 374-384.
16. Hartman H, Wadsworth D, Penny S, van Assema P, Page R. Psychosocial determinants of fruit and vegetable consumption among students in a New Zealand university. Results of focus group interviews. Appetite 2013; 61: 35-42.
17. Smith-Jackson R, Reel J. Freshman women and the ‘‘freshman 15’’. Perspectives on prevalence and causes of college weight gain. J Am Coll Health, 2012; 60(1): 14-20.
18. Durá T, Castroviejo A. Adherencia la dieta mediterránea en la población universitaria. Nutr Hosp 2011; 26(3): 602-608.
19. Deliens T, Clarys P, Van Hecke L, De Bourdeaudhuij I, De-forche B. Changes in weight and body composition during the first semester at university. A prospective explanatory study. Appetite, 2013; 65: 111-116.
20. Barker ET, Galambos NL. Body dissatisfaction, living away from parents, and poor social adjustment predict binge-eating symptoms in young women making the transition to university. J Youth Adolescence, 2007; 36:904-911.
21. Polivy J, Herman PC. Causes of eating disorders. Ann Rev Psy-chol, 2002; 53: 187-213.
22. Abolghasemi S, Varaniyab S. Resilience and perceived stress: predictors of life satisfaction in the students of success and fai-lure. Procedia Soc Behav Sci, 2010; 5: 748–752.
23. Huebner ES, Zullig J, Saha R. Factor structure and reliability of an abbreviated version of the Multidimensional Students’ Life Satisfaction Scale. Child Indic Res, 2012; 5: 561-657.
24. Jovanovic V, Zuljevic D. Psychometric evaluation of the Ser-bian version of the Multidimentional Student’ Satisfaction Sca-le. Soc Indic Res, 2013; 110: 55-69.
25. Galindez E, Casas F. Adaptación y validación de la MSLSS de satisfacción vital multidimensional con una muestra de adoles-centes. Revista de Psicología Social, 2011; 26: 309-323.
26. Lyubomirsky S, Lepper H. A measure of subjective happiness: Preliminary reliability and construct validation. Soc Indic Res, 1999; 46: 137-155.
27. Instituto Nacional de Estadística. Metodología VI Encuesta de presupuestos familiares 2006-2007. Resultados Encuestas de
056_8593 Relacion entre los dominios de la escala.indd 2762 04/05/15 16:32

2763Nutr Hosp. 2015;31(6):2752-2763Relationship between the domains of the Multidimensional Students’ Life Satisfaction Scale, ...
Presupuestos familiares. Nov. 2006-oct. 2007. Conectado en diciembre de 2008. Available online at http://www.ine.cl/cana-les/chile_estadistico/encuestas_presupuestos_familiares/2008/metodologia_vi_epf.pdf
28. Adimark. El nivel socioeconómico ESOMAR. Manual de apli-cación. Santiago. Available online at http://www.microweb.cl/idm/documentos/ESOMAR.pdf.
29. QuestionPro Survey Software. QuestionPro. Available online at http://www.questionpro.com/
30. Hair J, Anderson R, Tatham R, Black W. Análisis multivariante. Otero. 5ª ed. Madrid: Prentice Hall Internacional. Inc.; 1999.
31. Oberle E, Schonert-Reichl K, Zumbo B. Life satisfaction in early adolescence: Personal, neighborhood, school, family, and peer influences. J Youth Adolesc, 2011; 40: 889-901.
32. Goodwin R, Hernández S. Perceived and received social su-pport in two cultures: Collectivism and support among British and Spanish students. J Soc Pers Relat, 2000; 17(2): 282-291.
33. Brannan D, Biswas-Diener R, Mohr C, Mortazavi S, Stein N. Friends and family: A cross-cultural investigation of social support and subjective well-being among college students. J Posit Psychol, 2013; 8(1): 65-75.
34. Babinčak P, Bacova V. Life satisfaction, beliefs and relations to oneself and others in university students. Stud Psychol, 2008; 50(1), 79-94.
35. Mohammadi M, Schwitzer A, Nunnery J. Examining the Effects of Residence and Gender on College Student Adjust-ment in Iran: Implications for Psychotherapists. J College Stud Psychother, 2009; 24(1): 59-72
36. Tumkaya S. Humor styles and socio-demographic variables as predictors of subjective well-being of Turkish university stu-dents. Edu Sci, 2011; 36(160): 158-170.
37. Lyubomirsky S, King L, Diener E. (2005). The benefits of fre-quent positive affect: Does happiness lead to success? Psychol Bull, 2005; 131: 803–855.
056_8593 Relacion entre los dominios de la escala.indd 2763 04/05/15 16:32