Embed Size (px)
Citation preview

1

2
Summary
Presentation 4
1. Executive Summary. The “culture of quality”, a value to promote for sustainable
growth of the national system 6
2. Accredited certification, inspection, and verification bodies (CABs), testing
laboratories and calibration laboratories: the heart of the Quality Infrastructure 12
2.1 The Quality Infrastructure 12
2.2 Accreditation of conformity assessments 15
Metrology: an ancient science with far-reaching effects throughout the Quality Infrastructure 17
2.3 The economic value of accredited conformity assessments 19
2.3.1 Accredited certification, inspection and verification bodies (CABs) 20
Accredited certification of professionals: new competences and necessities of recognition 23
2.3.2 Accredited testing laboratories and calibration laboratories 24
3. Complete evaluation of the benefits of TIC capital on the economy 28
3.1 TIC capital: an investment for growth and competitiveness 28
3.2 Accredited certification of management systems and business performances: a successful
relationship 36
3.2.1 Introduction 36
3.2.2 Organizations with an accredited certified management system 37
3.2.3 The economic-financial performance: a comparison between certified and non-
certified companies 39
3.2.4 The effects of management systems on business performance 41
Certified export operators 46
4. Not only growth: externalities of the “culture of quality” for health, safety and
the environment 50
4.1 Introduction 50
4.2 Environmental certification 52
4.3 Energy certification 56
4.4 Occupational health and safety management systems 59
4.5 Food safety 60
4.6 Formaldehyde certification 65
4.7 Some European Directives 66
Bibliography 69
Glossary 72

3
ACCREDIA Osservatorio
Editorial director
Filippo Trifiletti
Editorial coordination
Alessandro Nisi
Francesca Nizzero
Graphics
ZERO ONE
This study is the result of a
collaboration between ACCREDIA and
Prometeia.
For ACCREDIA: Corporate and
External Relations area – Studies and
Statistics.
For Prometeia: Working Group
supervised by Alessandra Lanza and
consisting of Leonardo Catani,
Giacomo Cotignano, Angelo Mestieri,
Giampaolo Morittu, Cristina Rossi,
Elena Salmaso and Stefano Sparacca.
With thanks to the Accredia Comitato
di Coordinamento Interassociativo
(CCI), representing the associations
of accredited bodies.
ACCREDIA
The Italian Accreditation Body
Via Guglielmo Saliceto, 7/9
00161 Roma
Tel. +39 06 844099.1
Fax. +39 06 8841199
www.accredia.it
4
Presentation
Today we live in a globalized world in which economic relations have no frontiers. At the start of
the year the emergency caused by Covid-19 broke out in our economies and what began as a
health crisis has turned into a pandemic and subsequently into a world economic crisis without
precedent since the end of the Second World War. Governments have had to face the health
emergency adopting measures which have reduced the freedom of families and businesses,
stopping activities in entire areas and production sectors and the movement of citizens.
The resulting economic crisis which, in its first phase, was symmetrical is increasingly having
asymmetrical effects in different countries. Uncertainty regarding the future, underscored by the
collapse of the main macroeconomic indicators with a predicted slowdown of world economic
growth of 5.2%, is conditioning the economic policies of the countries involved, creating instability
and, in the case of Italy, differences in terms of regional management. But the uncertainty does
not only regard the possible evolution of the epidemical trends which would have a strong impact if
they were to lead to new blocks to productive activities, it also impacts the economy’s capacity for
recovery.
As well as the effects on the incomes of families and businesses, which are already visible, there
are those on the public finances which are under pressure. In the coming years governments will
have to deal with structurally higher public debt with reduced room for maneuver, and this, in the
long run, could impact especially the weaker sectors of society which have already been severely
affected by the steps to contain the pandemic.
The global Covid-19 outbreak imposes needs to accelerate the transition towards a model of
sustainable development which, on a worldwide scale, involves all citizens and businesses.
Government policies will have to take this on board, creating a favorable climate for private
investment in which the Quality Infrastructure, as we have already seen in the public sector, can
perform a central role as a useful tool for assuring expected quality characteristics and for
choosing sustainable products and services.
Italian enterprises involved in the global production chains know the importance of international
standards for enabling the interoperability of products and services, reducing transport costs and,
in doing so, making world trade easier. But the tools for the Quality Infrastructure are also in
themselves a value in the global market. Trust engendered by the Quality Infrastructure in the
markets contributes to effective functioning, essential in containing the Covid-19 virus and for
rebuilding our societies. The pandemic must constitute an opportunity to act supportively to
convert this crisis into a ramp for achieving objectives of sustainable development.
Covid-19 has had a dramatic effect upon offer and demand in world markets, reducing the supply
chain and altering consumer preferences. Governments must recognize that mutual interests
ensure that commercial channels remain open for facilitating the international exchange of goods
and services, including essential supplies.

5
In this period it’s important to avoid the temptation to erect new trade barriers, and to remove
existing restrictive trade measures placed on essential goods for containing the health emergency,
such as medical supplies and personal protective equipment.
Against a background of the encouragement of inclusive and sustainable industrial development,
the Quality Infrastructure has a particularly crucial role to play in the fight against the global
pandemic. Quality standards and international recognition of conformity assessment to these
standards ensure that the verification of technical competences through accreditation are all
factors which, taken together, contribute to a uniform and shared response by governments to the
requirements created by the pandemic. Standards help to guarantee the availability of the most
important medical devices, of diagnostic tests and personal protective equipment. It is also clear
that accredited laboratory tests which ensure testing quality and precision will provide a growing
fundamental contribution to diagnostic processes, to health care and to therapeutic monitoring of
the vast majority of human diseases, including Covid-19.
Within this context, the in-depth economic study which we present here, demonstrating the
economic value for businesses and consumers of accredited conformity assessment activities,
acquires special importance, closely related to awareness of our role in society.
The clear definition of roles and responsibilities is of primary importance in uncertain times and the
management of emergencies must be rapid and coordinated in accordance with a well-defined
order of priorities.
The choice of wanting to discuss the economic and social effects of accredited conformity
assessment activities, amongst which a central role belongs to activities related to the calibration
of measuring instruments, is an exercise in raising awareness for clarifying our role with respect to
enterprises and consumers, demonstrating how these instruments can be a tool for development
of a new industrial policy steering us in the direction of sustainable behaviors.
Giuseppe Rossi
President of ACCREDIA
6
1. Executive Summary. The “culture of quality”, a value to promote
for sustainable growth of the national system
In a scenario of profound evolution, characterized by rising complexity and new social needs, to
study the Quality Infrastructure and evaluate its benefits – both economic and other – provides a
good opportunity to reflect upon many of the challenges the country faces and which regard the
competitiveness and organization of the chains, the new technologies, safety/security and
environmental sustainability.
We speak about Quality Infrastructure because there are many actors involved who
ensure that it functions: national institutions, national standardization bodies, national
metrology institutes, national accreditation bodies and accredited conformity assessment bodies
(CABs). The last of these categories includes certification, inspection, verification and validation
bodies as well as testing laboratories and calibration laboratories, covering a central role in the
system by means of conformity assessment activities1. It is a complex but efficient structure,
operating in a successful cooperation with public and private structures (standardization bodies
and accreditation bodies operate on a not-for-profit basis).
There are innumerable areas and sectors in which accredited testing, inspection and certification
(TIC) activities are performed: management systems, environmental and energy certification,
quality and technical control of products, supply chain verifications, inspections concerning public
building programs (buildings, construction sites, technical control of projects etc.), performance of
laboratory tests on various and multiple matrices (environmental, food, industrial products,
medical devices, raw materials etc.) and calibrations of measuring instruments – these being just
some examples of possible applications.
The system helps businesses to improve their process efficiency and to enhance product quality,
favoring uniformity, and it makes technical information available to all companies, ensuring the
interoperability of products and services. They are economic benefits which are evident in
international market exchanges, in which compliance with mutually recognized standards
contributes to cost reduction in international trade. In many market sectors, thanks to the
assurances offered regarding the attested requirements expected of a certified product or service,
the Quality Infrastructure sustains demand, contributing to a climate of trust in the market, useful
for assuring its correct functioning.
A study on the evaluation of the economic effects of the Quality Infrastructure does not only have
the aim of creating appreciation of the support which these instruments have given to the Italian
economy, but it also engenders understanding as to how their diffusion can be an opportunity for
additional national growth.
1 «Conformity assessment» is the procedure for demonstrating if specific product requirements regarding a process, service, system, person or body have been respected (EC Regulation N. 765/2008).

7
The principles at the basis of the Quality Infrastructure (competence, independence, impartiality,
trust, transparency, sharing, and participation of the interested parties) are crucial for defining the
paths of innovation and environmental and social sustainability which Italy faces.
Consider, for example, the role that could be played in the diffusion of new technologies such as
the Internet of things or artificial intelligence, sectors in which the themes of interoperability and
information security are central. In the connected and automated mobility context of the future,
sub-system inter-connectivity (vehicles, road and energy systems) will be decisive in establishing
the level of development of an integrated European market. Also regarding environmental matters
the TIC market actors will be at the forefront of the path set out by the European Commission for
the achievement of a circular economy: their contribution may stretch from the definition and the
measuring of the durability and the reuse of materials to the definitions of relations between the
actors of the chain, as far as the efficient selection of eco-friendly services and products.
The response which may be provided to the growing needs for transparency and social
attention required from enterprises by consumers and by financial institutions will be
very important. The capacity of financial institutions to show their commitment in matters
regarding environmental and social sustainability, in accordance with the indications contained in
the UN Agenda 2030 will be an important tool for client communication and for attracting and
having access to sources of finance. There is a growing need to find metrics and standardized
elements, also on an international level, to measure the commitment of economic operators with
regard to social aspects: instruments of the TIC world provide a natural support for reaching these
aims.
This study sheds light on these aspects, examining the economic value of conformity assessments
from various points of view.
Firstly, the TIC world is analyzed with respect to the sector in question, defining the
characteristics of the operators involved and the size of the market.
Subsequently the benefits which these operators bring to the Italian economic system are
examined and quantified by means of an analysis of the macro and micro economic aspects.
Finally, an analysis is undertaken of the social benefits of these activities for the entire
community regarding the environment and the health and safety of citizens. Thanks to the use of
techniques borrowed from economic literature, it has been possible to quantify these benefits also
in monetary terms.
Accredited TIC activities
Results confirm and quantify the many benefits for enterprises and society deriving from the
activities of CABs (conformity assessment bodies) and laboratories in the TIC sector. There are
over 360 certification, inspection, verification and validation bodies, 1,200 testing laboratories and
some 200 calibration laboratories possessing accreditation, carrying out conformity assessments
and constituting the heart of the Italian Quality Infrastructure.
8
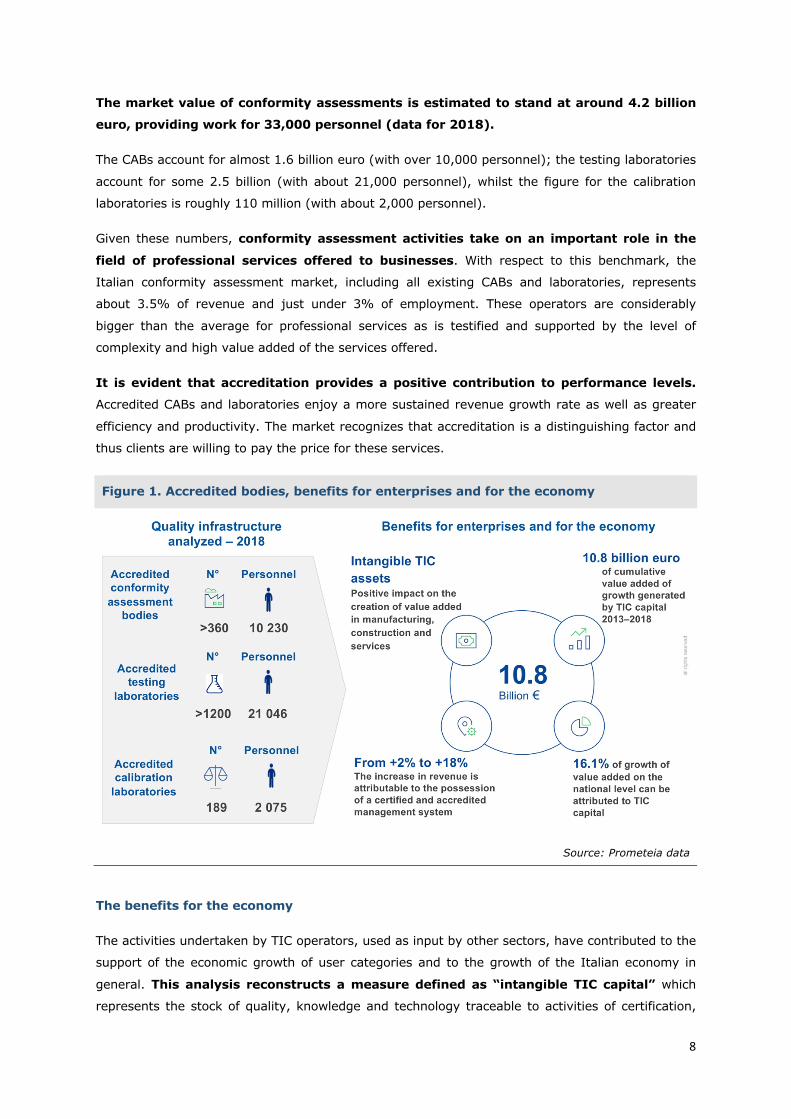
The market value of conformity assessments is estimated to stand at around 4.2 billion
euro, providing work for 33,000 personnel (data for 2018).
The CABs account for almost 1.6 billion euro (with over 10,000 personnel); the testing laboratories
account for some 2.5 billion (with about 21,000 personnel), whilst the figure for the calibration
laboratories is roughly 110 million (with about 2,000 personnel).
Given these numbers, conformity assessment activities take on an important role in the
field of professional services offered to businesses. With respect to this benchmark, the
Italian conformity assessment market, including all existing CABs and laboratories, represents
about 3.5% of revenue and just under 3% of employment. These operators are considerably
bigger than the average for professional services as is testified and supported by the level of
complexity and high value added of the services offered.
It is evident that accreditation provides a positive contribution to performance levels.
Accredited CABs and laboratories enjoy a more sustained revenue growth rate as well as greater
efficiency and productivity. The market recognizes that accreditation is a distinguishing factor and
thus clients are willing to pay the price for these services.
Figure 1. Accredited bodies, benefits for enterprises and for the economy
Source: Prometeia data
The benefits for the economy
The activities undertaken by TIC operators, used as input by other sectors, have contributed to the
support of the economic growth of user categories and to the growth of the Italian economy in
general. This analysis reconstructs a measure defined as “intangible TIC capital” which
represents the stock of quality, knowledge and technology traceable to activities of certification,

9
inspection, testing and calibration adopted in every sector2: intangible TIC capital has a positive
and statistically significant impact in the creation of value added in all the macro sectors
considered. The analysis quantifies how a 10% rise of TIC intangible stock capital results in an
increase of around 0.5% in the total value added (proxy for the GDP) in the manufacturing,
construction and services sectors. In aggregate terms, in the period 2013-2018 this
constituted a contribution to growth of 16.1%; in other words, 16.1% of the value added
growth in these three sectors can be attributed to TIC capital. In monetary terms, in the years
2013-2018, the TIC capital generated a cumulative value added of 10.8 billion euro3, which
is equivalent to an annual average of 2.2 billion.
These quantities are an incremental contribution to national economic growth. This means that if
in the last five years the TIC capital had remained constant (i.e. investments had been made
aimed solely at replacing depreciated capital) the Italian GDP in 2018 would have been lower by at
least 10 billion euro (0.6 of the total). 83% of this sum (about 9 billion) is attributable entirely to
accredited conformity assessments, reflecting the strong impulse that accreditation has received
during the period in question.
Altogether, the econometric analyses of this study reveal the significance of the contribution made
by TCI capital in providing a positive influence on the national economy, and it doesn’t end with
businesses buying TIC services directly because it reaches entire sectors. TIC investments
also help to increase the productivity of the other factors, and if they are implemented, studies
show that production increases, as does the quality of goods and services offered.
An in-depth microeconomic analysis of the relation between the adoption of an accredited certified
management system and economic performance confirmed the results described above.
Businesses which use a certified and accredited management system (over 88,000 in Italy with
revenue of some 1,400 billion euro, equal to 40% of the total economy) perform significantly
better than those without certification. Applying a counterfactual method based on a comparison
between certified and non-certified businesses but possessing similar characteristics, it transpires
that accredited certification leads to a growth rate in revenue over the next two years of
between 2% and 18% depending upon the sector in question and the standard applied, with
more evident effects in the case of construction and services. It is interesting to note that also the
implementation of an environmental management system, usually in conjunction with the adoption
of a quality management system, engenders an increase of revenue of over 1.8%.
The impact on other balance sheet variables underlines that increases in production are
accompanied by a rise in investment, a reduction of financial burdens and a greater capacity to
generate cash-flow.
2 This approach derives from awareness of the costs sustained by the economy for certifications, tests and calibrations, not as simple occasional expenses, but as investments in human effort, in patents, software and all other intangible expenses which support economic growth. For example, the managerial ability can be a crucial factor for growth in guiding and organizing production systems. However, in the same way, also the expenses for laboratory tests are an activity of maintenance and raising of product quality and safety standards, promoting the competitiveness of the economy. 3 Value at constant prices.

10
These benefits do not result in increased operational costs, confirming the fact that costs relating
to certification are in some way absorbed and rewarded by better corporate organization. A
medium-term study conducted on a sample of companies with ISO 9001 certification showed that
the performance discrepancy remained stable as much as ten years later.
The benefits for society
Along with the benefits for businesses described above there are a great many positives for society
at large deriving from the application of standards and TIC activities. Experience has provided
evidence of and quantified the contribution of certain segments of the Quality Infrastructure to
society concerning the environment, health and safety. Analysis conducted examines and
evaluates the benefits created by the reduction of negative factors4 (less pollution, fewer illnesses,
injuries and others) and of the related financial costs (external costs5) attributable to the TIC
activities taken into consideration. From an economic point of view it is important to evaluate them
in order to fully understand the effects of policy choices and to select the best options from a social
standpoint.
Thanks to environmental certification certified Italian companies reduce their GHG emissions by
an average of 6.9% with respects to those without certification – a saving of 7.7 million tonnes of
CO2 annual equivalent.
The development of energy certifications, and in particular ESCos, EGE and EnMS certifications,
has helped to reduce primary energy consumption by 1.7% per year – a contribution to the annual
reduction of CO2 emissions of over 6 million tonnes in 2018. In terms of the social cost of CO2 this
generates an overall saving in these two areas – environment and energy – of more than 500
million euro p.a.
Organizations holding occupational health and safety management system certification
endure fewer and less serious workplace injuries compared with those with the same
characteristics but without certification. Injuries are an average of 16% fewer, ranging from 7 to
46% depending on which sector they belong to, and the severity of the injuries sustained is 40%
lower than for their non-certified equivalents. These factors constitute a saving of some 300
million euro annually in social costs.
The joint action of public and private operators performing tests and certifications in the food
chain promotes and protects food safety, making an appreciable contribution to the reduction of
foodborne diseases and the relative social costs. By means of a specially created model it was
possible to quantify the reduction in the number of health years lost due to foodborne diseases at
75%.
4 In economic theory the term used is externalities, meaning an unintentional effect deriving from actions impacting production or consumption by a second party without direct transaction between them. These external effects may be positive or negative. The negative ones include activities which emit pollution into the air or which reduce business output, or those which alter productivity of persons collaborating in the productive process. 5 The external cost is the economic quantification of a physical effect and it pre-supposes the choice of a value to give to human life, to the quality of the air and to health. The economic literature has developed a series of techniques to reach these goals and the evaluations of this study are based on those techniques.

11
The high costs avoided and the resulting benefits of a food safety system are estimated to be in
the range of 1.5 billion euro annually, with a contribution of public and private TIC bodies
amounting to over 400 million euro.
Analysis of the European regulations reveals how environmental and product safety issues were
pivotal in numerous EU Directives such as those regarding industrial machinery, medical devices
and personal protection. Although they are very thorough (consider only the current situation
regarding individual protective devices in the management of the Covid-19 crisis), the studies on
the regulations have not always succeeded in quantifying the social benefits resulting from the
application of these rules. This study reports the application in Italy of three EU Directives for
which quantitative evaluations are available: machines, toys and noise and for which the
contribution of the TIC factor amounts to around 25 million euro per year.
The overall results of the cases viewed reflect a major contribution made by the Quality
Infrastructure in all its components in terms of social and environmental benefits,
totaling around 1.3 billion euro per year6. It is important to underline that the evidence
presented regards a limited though significant number of examples related to the Quality
Infrastructure, and leaves aside many others for reasons of information availability or which are
not strictly relevant to the scope of this study. It is important to report that, within the areas taken
into consideration, the social benefits are, on average, double the costs sustained by businesses to
obtain and maintain certification (without counting the private benefits). Any expansion of the
diffusion of the systems analyzed could increase the systemic effects reported contributing to
sustainable growth.
Figure 2. The effects of externalities and the annual social benefits (reduction of external costs) (millions €)
Source: Prometeia data
6 The figure ranges between 550 million and 1.2 billion depending on the criterion of economic assessment used.

12
2. Accredited certification, inspection, and verification bodies (CABs),
testing laboratories and calibration laboratories: the heart of the
Quality Infrastructure
2.1 The Quality Infrastructure
“Quality is never an accident. It is always the result of intelligent effort”
John Ruskin, English writer, painter, poet and art critic
In the Quality Infrastructure the “intelligent effort” for supporting and improving quality, safety
and the environmental sustainability of goods, services and processes is the fruit of the synergetic
work of several institutions, including national standardization bodies, national metrology institutes
and national accreditation bodies. In addition to these, there are accredited bodies performing
conformity assessments7: certification, inspection, verification and validation bodies, testing
laboratories and calibration laboratories which all carry out fundamental tasks. This centrality is
due to (as well as the physically occupied position in the “chain” reflecting the technical links
between metrology, standardization and accreditation) the importance of the actions undertaken
relating to everything which rotates around conformity assessment activities. It is a complex but
efficient system, in which private structures (on a not-for-profit basis as is the case for
standardization bodies and accreditation bodies) cooperate successfully (Figure 3).
7 «Conformity assessment» is the procedure for showing that the specific requirements relative to a product, a process, a service, a system, a person or a body have been respected (EC Regulation N. 765/2008).

13
Figure 3. The national Quality Infrastructure
Source: Kellermann, Martin. 2019. Ensuring Quality to Gain Access to Global Markets: A Reform Toolkit
(English). Washington, D.C.: World Bank Group.
Briefly put, certification bodies can, following conduct of the conformity assessment, issue
management system certification (for quality, the environment, energy, occupational health and
safety, food safety, information security and IT services) of products, services or persons
(professional competence). It is the certification body’s task to evaluate the fulfillment of
requirements contained in the certification standard or associated with the standard such as
technical, international (ISO), European (EN), national (UNI for Italy) standards, or legal
requirements including mandatory standards and EU Directives and regulations. Throughout the
period of certification it is necessary to carry out assessments for the purposes of “surveillance”
(generally once a year); these constitute a sort of “maintenance” of certification, ensuring ongoing
validity.
If the certification is an attestation of quality with a fixed timeline validity, the inspection could be
described as a kind of photograph of conformity aimed at verifying fulfillment of the requirements
(both specific and general) of a project, a product, a service, an installation or a process at a given
moment in time. The activities performed by an inspection body can regard many aspects –
verifications of the supply chain, pre-shipment verifications, construction related or public project
inspections (buildings, construction sites, technical projects controls etc.), verifications of
equipment or existing installations (lifts, electricity grounding systems etc.), product inspections
(directives for pressure equipment, for machines, ATEX etc.) and these activities may be
requested by various parties such as producers of goods, clients, users etc., including the Public

14
Authorities). An inspection assessment can be used as a surveillance activity which does not
necessarily result in a declaration of conformity and in certain cases it can be integrated with
testing or certification activities.
Figure 4. Certification, inspection and verification schemes and the relative accreditation standards
Source: ACCREDIA
Testing laboratories with accreditation to the standard UNI CEI EN ISO/IEC 17025 carry out
tests, measurements and analyses in support of production processes and also for other
conformity assessment activities such as product certification. The testing activities of laboratories
are applied in many sectors and have significant influence of life quality, especially the
environment and the safety of citizens.
The areas range from food safety (chemical and microbiological controls of food and beverages or
objects with which they come into contact) to animal welfare (hygiene testing at breeders, controls
for diseases etc.) to the health of people (medical exams) to environmental safety (samples of
water and soil, measurements of emissions etc.) and reaching as far as a huge category of tests
and analyses of materials and products of daily use (auto vehicles, clothes, electrical appliances,
construction materials, scrap materials, materials used by the iron, steel and metal industries etc.)
regarding all phases, from design to marketing to the product life-cycle (e.g. in cases of breakage
or defect during use). Other important testing areas include ICT and telecommunications
(conformity assessments of high complexity and reliability equipment), forensics (for investigative
and judicial activities) and anti-doping. As can be seen from the great variety of the fields of
application of tests, laboratories are generally characterized by precise specializations – few of

15
them operate in many sectors – and by geographical considerations. Their activities are closely
related to the developments occurring in their respective sectors.
Tests may be carried out both by public laboratories (such as, for example, zooprophylaxis
institutes for food safety controls or laboratories of the Central Anti-fraud Inspectorate for agri-
food product quality and technical means and equipment for agriculture) or by private laboratories,
which constitute the larger part of the market. The private laboratories may be independent,
offering their services to the market, or internal within organizations, dedicated exclusively to
ensuring the quality of the production process as well as the finished product.
The activities of calibration laboratories accredited to UNI CEI EN ISO/IEC 17025 are aimed at
guaranteeing measurement results which are as precise and reliable as possible through the
determination of error of instrument indication or measurement systems or the values of
measurement samples. By means of calibration it is possible to establish a connection between the
readings of a measuring instrument and the corresponding values obtained from samples of
guaranteed reliability (usually national or international measurement samples, with respect to
which Metrological traceability is defined). The calibration of instruments may regard various
physical quantities (pressure, temperature, hardness, length, volume, mass, force, velocity etc.)
which define the Metrological area in question.
The procedure of calibration must be carried out at regular intervals, having the occasional result
of a so-called “uncertainty” inherent in a measuring device, or the value and its uncertainty with
regard to a measuring sample. As the value of the measurement uncertainty influences the limits
of approval of the measuring results, the calibration can be defined as an inherent part of the
confirmation of validity of the results of the measurement. Calibration is therefore a wide-ranging
and multifaceted activity, both direct – related to the assurance of conformity of measuring
equipment with the requirements – and indirect, as is the case of the regulation of relations
between clients (e.g. the “correct” measuring of quantities in commercial transactions) and many
of the conformity assessments carried out by testing laboratories as well as those, to a lesser
extent, performed by CABs. Also calibration laboratories may be independent entities, offering
their services on the market, or they can be specialized units within an enterprise, as happens in
the case of testing laboratories.
2.2 Accreditation of conformity assessments
The function of independent, impartial and competent third party assessment carried out by
CABs, by testing laboratories and by calibration laboratories is fundamental to the Quality
Infrastructure and it influences all the actors in the socio-economic system. Accreditation, which
is voluntary except in certain specific sectors regulated by legislation, ensures and attests that
accredited bodies are in possession of all the characteristics required by the standards, voluntary
and mandatory, to perform conformity assessments. Accreditation, therefore, is a further
assurance provided for the end user, helping to increase trust, enhancing the trustworthiness of
certificates of conformity and calibration and of test reports issued on the market. Accreditation
contributes to the competitiveness of businesses which use conformity assessment services and,

16
by guaranteeing international recognition, it has a positive effect on the free movement of goods
and services which undergo verification. All these aspects contribute to making accredited
conformity assessment more substantially effective than certification obtained without
accreditation.
The development of accreditation started in the 1970s in Italy, but it was at the beginning of this
century, with the development of conformity assessment activities in Europe that the need to unify
the Italian accreditation system became more impellent. In particular, Regulation 765/2008, with
regard to accreditation, market vigilance and product control, regulates conformity assessment, CE
marking and the responsibility of persons placing products on the market, identifying appropriate
tools for strengthening the mutual recognition of national technical standards. Under the
provisions of the Regulation each member state identifies a single body to conduct accreditation
activities, recognized as operating in the public interest. In Italy, in compliance with the
Regulation, a Law Decree issued on 22.12.2009 by the Ministry of Economic Development,
designated ACCREDIA as the sole national body for the assessment of the competence, impartiality
and independence of certification bodies, inspection bodies, testing laboratories and calibration
laboratories.
Accreditation is an internationally regulated process whereby verifications – conducted both before
the issuance or extension of accreditation and after, during surveillance and renewal activities – of
the requirements which CABs must respect, meaning compliance with the principles of
accreditation set out in universally accepted international standards: impartiality, independence,
absence of conflicts of interests, competence, responsibility, confidentiality, accountability and
precision in the handling of complaints.
The application of uniform rules in all EU member states sustains a coherent economic system
which gives tangible benefits to European businesses and consumers. The legislative reference
framework in which they operate, in addition to Regulation 765, Decision 768/2008/EC and EC
Regulation 764/2008, promotes the free movement of goods within the EU by means of the
mutual recognition of national technical standards and market vigilance. The EU has officially
recognized a fundamental role of accredited certification and inspection, testing and
calibration, for the free movement of goods between member states through coordination with
the worldwide accreditation infrastructures (EA, IAF and ILAC8) and also to ensure protection of
the public interests: health and safety, protection of consumers and of the environment.
8 European co-operation for Accreditation (EA) is the European association of bodies providing accreditation of bodies and laboratories for all schemes; The International Accreditation Forum (IAF) is the world association of conformity assessment accreditation bodies and other bodies interested in conformity assessment in the fields of management systems, products, services, personnel and other similar programs of conformity assessment. The International Laboratory Accreditation Cooperation (ILAC) is a world association of bodies performing the accreditation of inspection bodies and testing and calibration laboratories.

17
Metrology: an ancient science with far-reaching effects throughout the Quality
Infrastructure
Metrology is a science concerning measurements and their applications and, together with
standardization, accreditation and conformity assessment, it is one of the cornerstones – and
indeed the oldest one – of the Quality Infrastructure. The need for measurements – attributing a
number to a physical quantity such as mass or length or immaterial such as time – was born at
the same time as civilization and there are traces of its existence in the ancient world. Lord
Kelvin, a British physicist and engineer, said in 1883 “To measure is to know. If you cannot
measure it, you cannot improve it. When you can measure what you are speaking about, and
express it in numbers, you know something about it; but when you cannot measure it, when you
cannot express it in numbers, your knowledge is of a meagre and unsatisfactory kind.”
From the earliest (prehistoric) approaches to measuring up to present times, the evolution of
systems has been remarkable. Amongst the fundamental passages of the “recent” past there is
the introduction of the Decimal Metric System, created at the end of the eighteenth century in
France, enshrining universality, reproducibility and stability in time as fundamental characteristics
for making a measuring system effective. This passage was the precursor to the birth – again in
France in 1889 – of the international system of units (SI) which initially only included basic
units of length (meter), mass (kilogram) and time (second) and progressively extended to other
quantities. Its adoption by the nucleus of European countries gradually spread worldwide but
currently it has not been applied in the United States, Germany, Liberia and Myanmar. A
landmark year in modern times is 2019, when the implementation was sanctioned of a system
whereby all the units of measurement were based on universal constants of physics and no longer
on physical units (the most famous is the cylinder of platinum-iridium, the primary reference
measurement of the kilogram, currently kept at the Bureau International des Poids et Mesures in
Paris) or on physical properties. The new SI is updated with the knowledge gained by years in the
discipline of the analysis of dimensions, relying on physical constants which represent
dimensionless numbers, universal in nature and independent of time, place and measure. This
change is not yet reflected in daily life but it will ensure ever more precise measurements in the
future.
The refinement of the precision of measurements is of massive importance in the modern world,
governed by technology, constant innovation of products, services and processes in the globalized
market where the necessity to measure quantity/quality/performance continues to increase and
to take on not only economic, but also social and political significance as well. The support and
uses of metrology are therefore, continuously increasing and expanding. In order to ensure that
measurement results are as precise and reliable as possible, the role of Metrological
traceability is decisive: i.e. the fundamental property of a measurement to be compared with
known values relating to appropriate reference samples (with national and international
recognition) by means of an uninterrupted chain of comparisons.
The task of diffusing Metrological traceability by means of the dissemination of samples of a
higher reliability level, created by the primary National Institutes of Metrology, is undertaken by

18
calibration laboratories, most of which are now accredited (for one or more calibrations)9 .
Calibration certificates for samples or instruments and certificates of reference materials (from
gas, to food safety, to soil samples for contamination research etc.) issued by Reference Materials
Producers (RMP) have transversal value with regard to the various activities and persons involved
in the Quality Infrastructure: they guarantee the “correct measurement” with respect both to
other testing and calibration laboratories and also certification, inspection and verification bodies
and, further down the line, the final user of the certified product or service (businesses,
institutions or private citizens). The benefits of calibration, as well as the direct ones relating to
guarantees of reliability of instruments or certified samples, also include indirect ones, which are
harder to identify or quantify as they are “hidden” within other activities transmitted in the quality
chain and which impact health, safety and the environment.
The benefits of the “correct measurement” are a little easier to imagine in their industrial
applications: the importance, for example, of measuring the temperature of metal works,
humidity measurements in semiconductor production etc. In these cases, better precision in
construction activities deriving from appropriate measuring translates into better performances
and greater reliability of the final product. The improvement in the precision of industrial
processes is also one of the elements which have contributed to the process of large scale
production.
Adequate Metrological capacity is crucial also in commercial transactions which are facilitated
– especially in international relations – if there is a certificate (better still, an accredited
certificate) attesting the high level of trust in the measurement. Mutual recognition of measuring
capacities and tests makes double testing unnecessary (duplicated controls in both the exporting
and importing countries), saving time and costs for the operators involved. Errors of
measurement which exceed the the allowance threshold can lead to substantial losses. A
simulation case history at a Japanese company producing automatic weighing machines revealed
that the losses related to defective products in the best conditions of production amounted to
about 80,000 dollars per year (on a revenue of 220 million dollars). These defects cannot be
detected with measurement uncertainties of the Japanese mass sample equivalent to 0.05 mg on
1 kilo. If the national mass sample has a measurement uncertainty which is ten times greater
(0.5 mg) and this is also the deviation between producer and end user, then the losses for the
weighing machine business would rise to 2 million dollars. This analysis could be extended,
evaluating the effects of an imprecise weighing machine used in commercial transactions based
on weight (see Inguscio-Fernicola, “Il ruolo della metrologia nel contesto competitivo globale”
[The role of metrology in the context of global competition]). From these considerations it
appears evident how measurement “certainty” is an enabling prerequisite and very important
for development, especially in the current highly competitive global climate.
9 The recent introduction of non-traditional instruments such as those used for measuring air pollution, or highly specialist ones for very specific types of findings requiring pinpoint reliability, as well as enlarging the sphere of competence of laboratories to include periodical verifications of measuring instruments in the fiscal field and speed cams, has given a sharp impulse to requests for accreditation over recent years on the part of calibration laboratories.

19
2.3 The economic value of accredited conformity assessments
Over 360 accredited certification, inspection, verification and validation bodies, 1,200 testing
laboratories and about 200 calibration laboratories constitute the hub of the Italian Quality
Infrastructure.
The value of the conformity assessment market created amounts to an estimated 4.2 billion
euro (Figure 5), employing 33,000 people10 (data for 2018). CABs account for just under 1.6
billion euro, with over 10,000 personnel, testing laboratories: 2.5 billion for 21,000 personnel and
calibration laboratories contribute about 110 million with 21,000 personnel11. In this context, it
should be underlined that some limited parts of laboratory activities are occasionally performed
internally by bodies which carry out such tests and/or calibrations to supplement the certification
and inspection process. Revenue from these activities – and from some additional services offered,
such as training – to be in the order of 10% of total revenue. Taking this into consideration, the
overall turnover stands at about 1.8 billion euro12.
Figure 5. The market value of conformity assessments in 2018
Source: Prometeia data
These figures attest the importance of the role of conformity assessments in the field of
professional services used by companies. Although this sector is extremely varied, covering a
broad range of activities, from management and organizational consultancy to general work
consultancy, to professional activities etc., it constitutes a well-established reference
10 The situation in 2018 – referring to accredited bodies in Italy (in the case of laboratories both public and private ones are considered and 19 foreign CABs in Italy accredited by ACCREDIA are excluded). The revenue overview includes both accredited and non-accredited activities. 11 For testing and calibration laboratories the data includes an economic appraisal of activities carried out in public laboratories. Similar analysis has been made for private labs internal to the organization (whose activity is dedicated exclusively to corporate processes/products). These figures, although they do not represent the “effective” revenue comparable with that of private labs which offer their services to the market, reflect as fully as possible the intrinsic value of the overall testing market. 12 In the calculation of the overall market value of conformity assessments, in order to avoid double calculations, the roughly 200 million euro of revenue relating to calibration activities performed have been left out as they are already accounted for in the revenue for laboratories.

20
benchmark. With regard to this benchmark, the Italian conformity assessment market, in terms
of all CABs and laboratories, accounts for about 3.5% of total income and almost 3% of
employment. The corporate size of these operators is considerably bigger than the
average for professional services, as is testified by the support of the level of complexity
and of the high value added of the services offered: in terms of revenue per enterprise the total
sum is around 5 million euro13 (29 staff) for the CABs, 2.1 million (17 staff) for testing
laboratories and 600,000 euro (11 staff) for calibration laboratories, as against respectively
200,000 euro and about 1.5 staff members for the benchmark.
The Italian conformity assessment sector has shown consistent and sustained growth,
on average double with respect to professional services in the last decade, with a peak of close to
3 to 1 in the case of accredited testing laboratories. Market recognition of a high value content in
the services offered is reflected in a profitability advantage, especially in the last few years. From
both points of view, some areas of accredited services recorded even stronger results.
In the light of the above overview, the following pages detail some further relevant issues for
CABs, testing laboratories and calibration laboratories.
2.3.1 Accredited certification, inspection and verification bodies (CABs)
Over 360 enterprises are certified by accredited CABs for a turnover of some 1.8 billion
euro14 (Figure 6). As already mentioned, this figure includes both accredited and non-accredited
activities of CABs and it includes laboratory and calibration tests and other supplementary services
which they provide.
A number of major operators are involved in the sector through wide-ranging conformity
assessment scheme typologies as well as highly specialized small-scale operators. Around three-
quarters of the smaller ones use only one certification scheme (of the 13 which cover the range of
different schemes of management, product, personnel and environment). Only 7% are active in
more than 5 schemes, reaching a maximum of 10-11 accredited schemes for some large
organizations.
13 This data refers to the total revenue of accredited and non-accredited conformity assessment. If only the accredited revenue is considered, the average data stands at around 1.5 million euro for the period 2010-2018 (data from ACCREDIA study “Economic data of CABs with ACCREDIA accreditation”). 14 2018.

21
Figure 6. Accredited certification, inspection and verification bodies (CABs): value of the market – 2018
Source: Prometeia data
Product certification and the relative management systems constitute by far the most
commonly adopted accreditation schemes (Figure 7), 17% of which are quality management
systems, similar to the rate we find for inspections, followed by environmental management
systems and then health and safety and personnel management systems.
Figure 7. CABs per typology of prevalent certification scheme
Distribution (%) Average size (millions of euro)
Source: Prometeia data
Looking at the specialization of CABs in terms of single or prevalent operative accreditation
schemes15 we find that almost 1 CAB in 2 focuses on product certification, about 1 in 5 on
management systems with a similar rate for inspections. The number of CABs specialized in
personnel is far lower; none operate exclusively or prevalently in GHG emission verifications or
carbon footprint validations.
15 The prevalence was evaluated considering the revenue generated by the various accreditation schemes (data from the ACCREDIA study “Economic data of CABs with ACCREDIA accreditation”). It excludes foreign CABs and those with non-core conformity assessment activities.

22
The analysis per specialization scheme also reveals other factors relating to accredited CABs; in
particular, it reveals a strong variation in the average size factor: for larger players, active in
all (or almost all) schemes), the average factor is over 5 times what it is for the sector in general,
whilst at the other end, there are the operators who concentrate on personnel certification, with an
average revenue size of 1.5 million euro. There are some significant differences in the
economic-financial performances: excellent results both in terms of growth and profitability
have been posted by CABs specialized in personnel certification which have benefited from the
development of standardizations (self-regulation in compliance with Law 4/2013). With regard to
efficiency, however, the best performers are the multi-scheme CABs thanks to their size and the
synergies between the various fields of activity (for details see the Methodological Appendix).
Figure 8. Certification, certification and verification bodies: economic-financial performances
Revenue growth (compound annual growth rate
2009-2018)
Gross operative profit (diff. 2008-2018)
Capital turnover rate (average 2008-2018)
Source: Prometeia data
On a general level it can be seen how accreditation makes a positive contribution to
performance (Figure 8). An analysis conducted on a highly representative sample of CABs (for
details see the Methodology Appendix) shows a growth trend in revenue which is more sustained
over the period 2008-2018 for CABs operating with a high level of accredited activities (over 50%
of the overall conformity assessment turnover). Despite the increased volatility, these CABs
showed more consistent profitability and in recent years they far surpassed the average margins of
CABs with less accredited activity. The advantages of accreditation are also related to greater
efficiency.

23
Accredited certification of professionals: new competences and necessities of
recognition
The Italian economy has for many years been low in productivity, sending alarm signals of a
seriously grave situation in a context of integrated markets competing on a global level. The
balance between demand and offer of qualified work is especially important in advanced
economies such as ours, whose growth rate is based on product and process innovation.
Accredited certification, attesting the competence of a professional person helps create the
conditions for a work market in which businesses are able to implement efficient selection
processes to meet the new needs for qualified work.
Technological changes in businesses are having a decisive impact on the work market. New
professional profiles and new competences related, in particular but not exclusively, to the
automation of production processes and logistics require assured recognition in order to make the
work market efficient.
The liberalization of the work market of professions is a necessity which, already in the 1990s was
highlighted by the Antitrust Authority to ensure performance quality and respect for ethical
principles and codes of conduct for the protection of consumers.
In response to the requests of the Antitrust, in order to adapt to the changes resulting from the
evolution of the work market Law 4/2013 was introduced “Dispositions for non-regulated
professions” together with a new normative framework promoting the voluntary self-regulation
of professionals, respecting the principle of professional freedom founded on autonomy
concerning the competences, independence of intellectual and technical judgment of
professionals.
According to the law, there are three systems for the qualification of professionals who are not on
the official register, as follows:
• self-declaration, attesting qualifications, work experience, trainings attended,
competences etc;
• attestation of quality and qualification of services issued by a reference association to its
subscribers;
• certification of conformity to the UNI (Italian standardization body) technical
standards for each individual profession, issued by a third party accredited by
ACCREDIA, in accordance with Regulation 765/2008.
Clearly, in the third case, differently from the other two, the consumer is protected by the
international system of standardization, accreditation and professional certification which has the
trust of the market with regard to real capacities possessed by the certified entity. This is ensured
by means of an infrastructure which guarantees and clearly makes reference to the possession of
specific competences.
The Italian sector of professional services has more than 1 million 400 thousand units and, in
2017, it constituted 6% of national employment and 26% of autonomous workers. Independent
professionals grew in number by 21% between 2008 and 2017 and they now constitute the only
market labor component which has not only held but actually strengthened throughout the crisis,
a counter-trend with respect to other independent labor sectors (ConfProfessioni). We turn now to
24
the “regulated” professions in which registered professionals generally have a specific study
qualification; they have done an apprenticeship and passed a State exam.
The request for new competences has led to the “invention” of new professions to keep abreast
with the times and to broaden competences requiring a system of recognition for qualifications
and the system of “regulated” professionals is not able to fulfill these requirements quickly
enough.
This situation has led to the development of the market of non-regulated professionals.
From our Osservatorio, there are about 300 professions for which it is possible to obtain
accredited certification, in line with UNI standards, for private schemes and against obligatory
standards and close to 280,000 accredited certificates have been issued to professionals.
There are many sectors involved, including the WEB and new technologies, as well as finance, the
environment and energy saving.
Currently there are almost 70 UNI standards for the qualification of professionals to which, on the
basis of data available in the ACCREDIA website database, about 40,000 professionals with
accredited certification correspond.
These numbers, which are steadily rising, bear testimony to the fact that accredited certification
against technical standards ensures market transparency and efficiency.
The typology of certification is also increasing but, to date, accredited certification is concentrated
on sectors containing established professionals who are, in some cases, bound by normative
obligations (such as persons involved in the recovery of fluorinated gases).
In this dynamic and continually evolving context, the aim of professionals is to convert their
competences into activities in line with market demand – consumers and businesses –
demonstrating their qualifications in a transparent way.
Competent professionals need to be protected from non-qualified competition, offering to the
market the possibility of verifying real competences possessed through accredited certification.
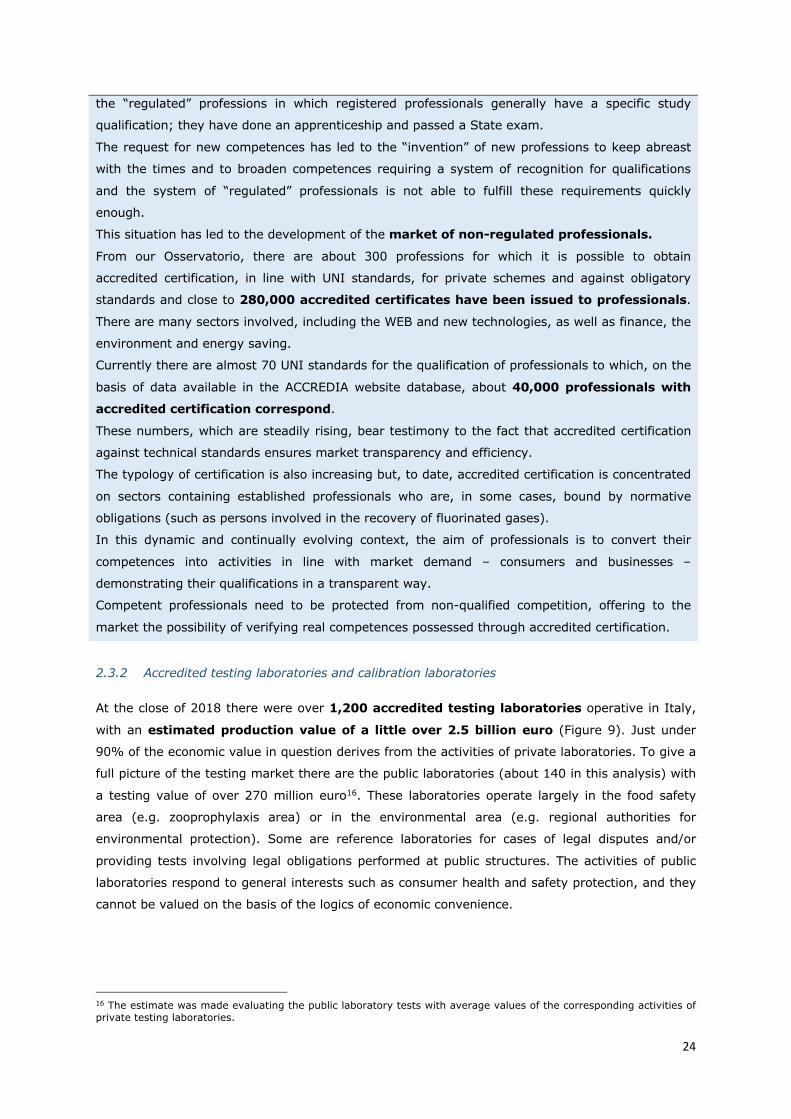
2.3.2 Accredited testing laboratories and calibration laboratories
At the close of 2018 there were over 1,200 accredited testing laboratories operative in Italy,
with an estimated production value of a little over 2.5 billion euro (Figure 9). Just under
90% of the economic value in question derives from the activities of private laboratories. To give a
full picture of the testing market there are the public laboratories (about 140 in this analysis) with
a testing value of over 270 million euro16. These laboratories operate largely in the food safety
area (e.g. zooprophylaxis area) or in the environmental area (e.g. regional authorities for
environmental protection). Some are reference laboratories for cases of legal disputes and/or
providing tests involving legal obligations performed at public structures. The activities of public
laboratories respond to general interests such as consumer health and safety protection, and they
cannot be valued on the basis of the logics of economic convenience.
16 The estimate was made evaluating the public laboratory tests with average values of the corresponding activities of private testing laboratories.

25
Figure 9. Accredited testing laboratories: market value – 2018
Source: Prometeia data
Taking a closer look at the private laboratory market we can see that Italy is different from other
EU countries. Along with the relatively few large or medium size laboratories there is a
significant number of small and highly specialized laboratories. This structure reflects the
national situation, operating through the conduct of laboratory tests aimed at checking product
requirements deriving from the market and/or legal provisions. For most of the 839 private
laboratories studied, testing activities are the core business and are offered as a service to third
parties. Along with them, there are laboratories (240 studied) operating within companies – many
of which are large organizations – performing testing activities exclusively for the production
activities of the company in question.
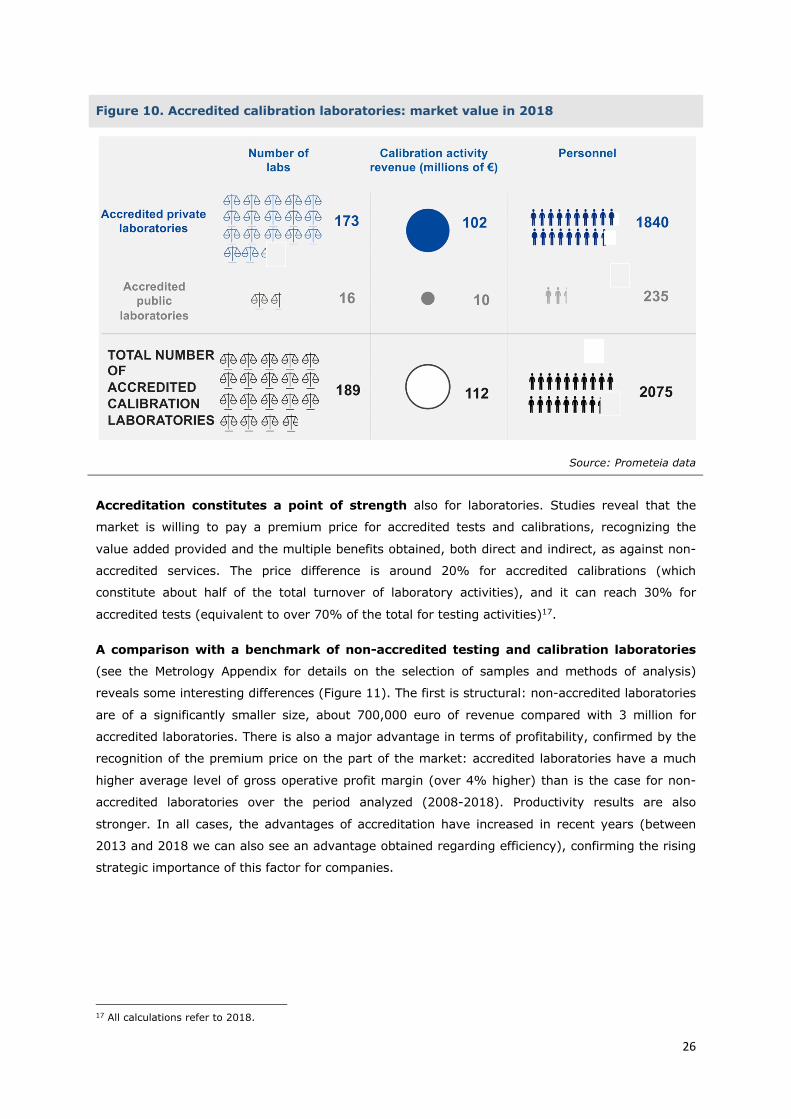
There are also 189 accredited calibration laboratories in Italy. Leaving aside large companies
with an internal calibration laboratory, the value of activities is around 1 billion euro (Figure
10) of which less than 10% is attributable to calibration services. Metrological activities are often a
complementary service offered to companies whose primary activity is the production and/or sale
of measuring instruments, therefore going beyond the value given for conformity assessment in
the scope of this study. Compared with testing laboratories, the role of the public sphere in this
case is less important: there are 16 public calibration laboratories bringing a service value in the
region of 10 million euro.
26
Figure 10. Accredited calibration laboratories: market value in 2018
Source: Prometeia data
Accreditation constitutes a point of strength also for laboratories. Studies reveal that the
market is willing to pay a premium price for accredited tests and calibrations, recognizing the
value added provided and the multiple benefits obtained, both direct and indirect, as against non-
accredited services. The price difference is around 20% for accredited calibrations (which
constitute about half of the total turnover of laboratory activities), and it can reach 30% for
accredited tests (equivalent to over 70% of the total for testing activities)17.
A comparison with a benchmark of non-accredited testing and calibration laboratories
(see the Metrology Appendix for details on the selection of samples and methods of analysis)
reveals some interesting differences (Figure 11). The first is structural: non-accredited laboratories
are of a significantly smaller size, about 700,000 euro of revenue compared with 3 million for
accredited laboratories. There is also a major advantage in terms of profitability, confirmed by the
recognition of the premium price on the part of the market: accredited laboratories have a much
higher average level of gross operative profit margin (over 4% higher) than is the case for non-
accredited laboratories over the period analyzed (2008-2018). Productivity results are also
stronger. In all cases, the advantages of accreditation have increased in recent years (between
2013 and 2018 we can also see an advantage obtained regarding efficiency), confirming the rising
strategic importance of this factor for companies.
17 All calculations refer to 2018.

27
Figure 11. Testing laboratories and calibration laboratories; economic/financial performance
Capital turnover rate (diff. 2008-2018)
Value added for personnel (thousands of €, average 2008-2018)
Source: Prometeia data

28
3. Complete evaluation of the benefits of TIC capital on the economy
3.1 TIC capital: an investment for growth and competitiveness
The Quality Infrastructure plays a vital role in productive activities and in services, supporting
efficiency and providing an important contribution to processes of innovation. Accreditation
reinforces the intrinsic characteristics of the Quality Infrastructure which, as the literature
underscores, enhances competitiveness. These characteristics are:
• conformity: products and processes in conformity with the standards;
• comparability: the possibility to compare products and processes amongst countries;
• trust: products and services which conform with the declared characteristics;
• reliability: trust in measurements, procedures, materials and applied methods;
• transparency: accessibility of documents and procedures;
• impartiality: protection from external influences;
• competence: technical capacities of actors involved.
These properties of the Quality Infrastructure are drivers of economic efficiency, supporting
market operativity in which operators need reliability from their counterparts and information on
the available products and services, added to a high grade of technical competence. Innovation
processes also play a crucial part, with standards which act as stimulators for technological
progress in support of international trade.
Standards help businesses to improve product standards, favoring process uniformity and
efficiency; they ensure the availability of technical information and they facilitate the dissemination
of technology, guaranteeing the interoperability of products and services. There are tangible
economic benefits in international markets where standards permit the reduction of barriers to
commerce and constitute a “lingua franca”, as well as being a sign of quality for potential trade
partners.
The Quality Infrastructure creates a wide range of potential benefits which can significantly impact
the direction of economic growth. It is therefore not surprising that a number of analytical studies
have been carried out, especially in the past twenty years, evaluating its contribution to the
economy.
The aim of this chapter is to provide a quantification of the role of the system of
certifications, inspections, tests and calibrations in the Italian economy through the use of
an econometric model.
To achieve this, the main indications emerging from the sector literature will be considered, and an
analysis will be made for the specific quantification per sector of the impact on the value added in
the manufacturing, construction and services sectors.

29
On one side, the main evidences in the economic literature on the relation between the existence
and application of technical standards and conformity assessments, are identified and analyzed,
and, on the other, economic growth. As previously stated, empirical studies are more recent than
theoretical literature, having been developed mostly over the last twenty years.
In this century the first estimates of the micro and macroeconomic benefits of
standardization in the study undertaken by the DIN (the German Standardization Institute)
have appeared. The DIN is considered the pioneer in the econometric analysis of standards, both
in terms of methodology and the broad specter of parameters and impacts considered. The DIN
report evaluates and measures the impact of standards on the stimulus for innovation, on business
competitiveness on a national and, in particular, international level, through the promotion of
trade. The study quantifies at 0.9% per year the contribution of standards to economic growth
between 1960 and 1996. For the purposes of this analysis it is worth emphasizing the econometric
method DIN adopts: the impact on growth is estimated introducing the number of standards as an
additional productive element, as well as capital and labor, in an additional function of production.
The basic concept, particularly relevant in this type of study, is that a form of intangible capital
represented by the number of standards in force, year by year, lends support to traditional
productive factors (labor and machinery) in the evolution of the value added. The output of the
economic system depends also on the number of standards in force, which, combined with
material labor and capital, sustain overall competitiveness.
The approach developed in Germany was picked up (although sometimes using different
modalities) in national studies on macroeconomic impact conducted in the UK, France, Canada and
New Zealand. In the table below we can see the chief characteristics and results of the various
analyses.
30
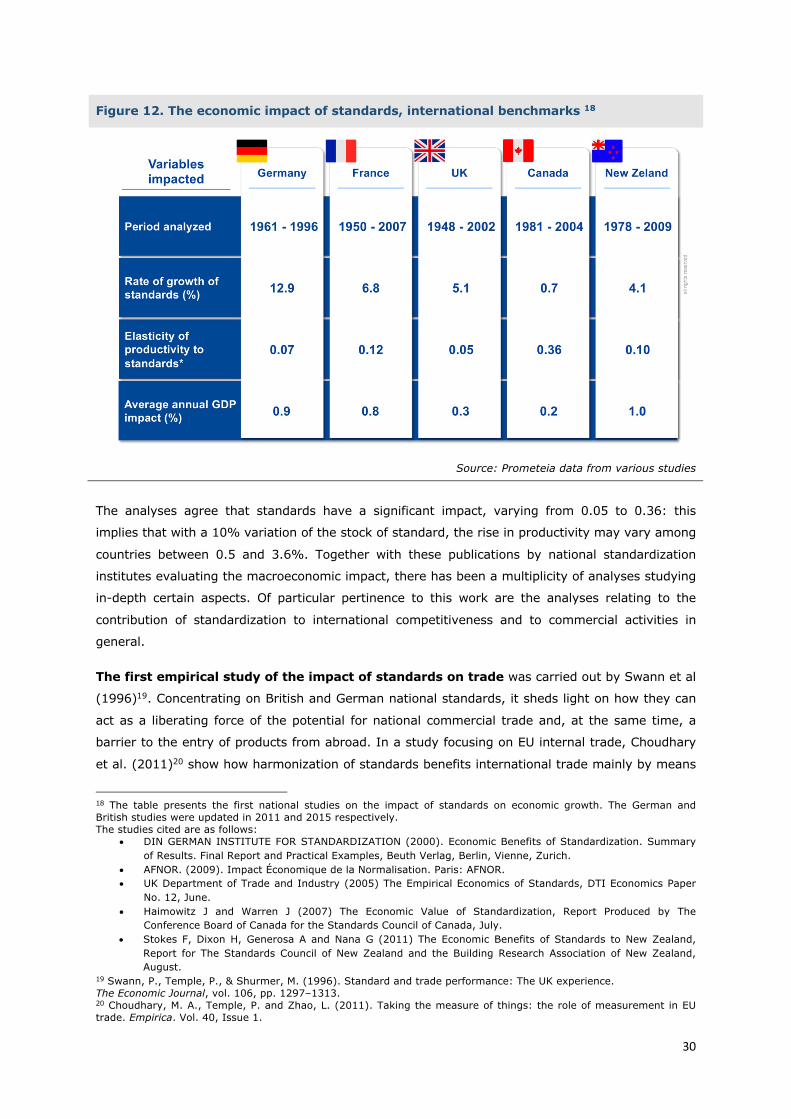
Figure 12. The economic impact of standards, international benchmarks 18
Source: Prometeia data from various studies
The analyses agree that standards have a significant impact, varying from 0.05 to 0.36: this
implies that with a 10% variation of the stock of standard, the rise in productivity may vary among
countries between 0.5 and 3.6%. Together with these publications by national standardization
institutes evaluating the macroeconomic impact, there has been a multiplicity of analyses studying
in-depth certain aspects. Of particular pertinence to this work are the analyses relating to the
contribution of standardization to international competitiveness and to commercial activities in
general.
The first empirical study of the impact of standards on trade was carried out by Swann et al
(1996)19. Concentrating on British and German national standards, it sheds light on how they can
act as a liberating force of the potential for national commercial trade and, at the same time, a
barrier to the entry of products from abroad. In a study focusing on EU internal trade, Choudhary
et al. (2011)20 show how harmonization of standards benefits international trade mainly by means
18 The table presents the first national studies on the impact of standards on economic growth. The German and British studies were updated in 2011 and 2015 respectively. The studies cited are as follows:
• DIN GERMAN INSTITUTE FOR STANDARDIZATION (2000). Economic Benefits of Standardization. Summary of Results. Final Report and Practical Examples, Beuth Verlag, Berlin, Vienne, Zurich.
• AFNOR. (2009). Impact Économique de la Normalisation. Paris: AFNOR. • UK Department of Trade and Industry (2005) The Empirical Economics of Standards, DTI Economics Paper
No. 12, June. • Haimowitz J and Warren J (2007) The Economic Value of Standardization, Report Produced by The
Conference Board of Canada for the Standards Council of Canada, July. • Stokes F, Dixon H, Generosa A and Nana G (2011) The Economic Benefits of Standards to New Zealand,
Report for The Standards Council of New Zealand and the Building Research Association of New Zealand, August.
19 Swann, P., Temple, P., & Shurmer, M. (1996). Standard and trade performance: The UK experience. The Economic Journal, vol. 106, pp. 1297–1313. 20 Choudhary, M. A., Temple, P. and Zhao, L. (2011). Taking the measure of things: the role of measurement in EU trade. Empirica. Vol. 40, Issue 1.

31
of the reduction of transaction costs. In a more recent analysis of EU countries, Blind et al (2018)21
describe how EU and international standards stimulate commerce, cutting the informative
differences and acting as global means of communication amongst trade partners.
Evidence relating to the diversity of impacts amongst economic sectors is another
pertinent factor. How do the technological characteristics of industries and market structures in
which they operate impact the influence of standards on performances? Among the more recent
works, Blind and Jungmittag (2007)22 analyze 12 manufacturing sectors and conclude that the
growth attributable to standards is greater in more established fields with less research and
development intensity compared with high-tech intensity areas in which patents have a bigger
influence on growth rates. Similar results were obtained by Hogan et al. (2015)23: the authors find
that the impact on growth is minimal in high-tech sectors such as aerospace and defense, whilst
the greatest influence of standards lies in the food sector.
This brief overview of the literature outlines a strong and statistically significant tie between
standards and economic growth. With the obvious differences among them, the various studies
suggest that there is a very common empirical strategy: the econometric calculation of an
aggregated production function. In line with this evidence, this approach has been adopted, with
the introduction of one novel factor with respect to the treatment of the aspect of the Quality
Infrastructure attributable to accredited conformity assessments and, more generally, to the
related services: the creation of a measuring of intangible capital representing the stock
value of quality, knowledge and technology existing in the economy and traceable to
activities of certification, inspection, testing and calibration, which reflects the diffusion according
to the sector. This intangible stock, accumulated over time, is named TIC capital (Testing,
Inspection, Certification) and it includes all the TIC activities examined in chapter 3, accredited
and non-accredited, including accessory services. This approach derives from the recognition of
costs sustained by the economy for certifications, tests and calibrations, not as simple
intermediary costs, but as investments equivalent to the cost in human resources, in patents,
software and all other intangible expenses supporting economic growth. For example, managerial
skills can be a crucial growth factor in guiding and organizing production systems. But, in the same
way, also the expenses of testing laboratories are an activity of maintenance and raising of quality
and safety standards of products supporting the competitiveness of the economy.
This approach is also in line with recent literature which highlighted the increasingly important role
of intangible assets in the growth process. For example, Corrado et al. (2016)24 use data on 18
European economies and the US to analyze the impact of intangible assets before and after the
2008/9 recession.
21 Blind, K., Mangelsdorf, A., Niebel, C. & Ramel, F. (2018) Standards in the global value chains of the European Single Market, Review of International Political Economy, 25:1, pp. 28-48, 22 Blind, K., & Jungmittag, A. (2008). The impact of patents and standards on macroeconomic growth: a panel approach covering four countries and 12 sectors. Journal of Productivity Analysis, 29(1), pp. 51-60. 23 Hogan, O., Sheehny, C. and Jayasuriya, R. (2015). The Economic Contribution of Standards to the UK Economy: 2015. British Standards Institution. 24 Corrado, C., J. Haskel, C. Jona-Lasinio and M. Iommi (2016), “Intangible investment in the Eu and US before and since the Great Recession and its contribution to productivity growth”, in ‘Investment and Investment Finance in Europe’, ch.2, European Investment Bank Report, November 2016.

32
The main results are: I) if material investments have collapsed during the recession and recovered
slightly afterwards, the investment in intangibles were more resilient; II) analysis of the sources of
growth suggests that during the period 2000-2013 the capital accumulation was the primary
growth driver, with tangible and intangible assets accounting for 80% and 20% respectively in
Europe, and both of them for 50% in the US.
TIC capital investments therefore contribute year by year to the accumulation of
intangible assets which, the same as other forms of tangible assets, are subject to depreciation.
By means of the permanent inventory method25 it was possible to reconstruct a tale stock
evaluation of relative costs, accredited and non-accredited, of the TIC world in chapter 3
(management systems, product certification, testing laboratories, inspections and calibration
laboratories) which was subsequently used for in the econometric model. As can be seen in Figure
13, the TIC capital and research and development capital have demonstrated greater dynamism in
the period in question, also showing a better response to the recession of 2009.
Figure 13. Dynamics of production factors in the manufacturing sector (Annual variations in %)
Source: Prometeia, EU KLEMS
As well as this analytical overview of TIC capital, the variables used constitute the value added,
the hours worked, the stock of tangible capital – distinct in the ICT and non ICT components, and
the stock of tangible research and development capital. The main source of the data of the model
is the EU KLEMS26 database, which provides statistics on economic growth, productivity,
employment, capital and technical progress by sector. The combined use of this information
permits the simultaneous consideration of the various elements which can contribute to economic
25 See the methodology appendix for details. 26 The Vienna Institute for International Economic Studies, release 2019, financed by the European Commission DG Economic and Financial Affairs.

33
growth. In addition to traditional factors of production, labor and capital, the inclusion of ICT
capital enables consideration to be made of the progress resulting from new IT and communication
technologies, whilst research and development capital enables inclusion of the effects of research
on technical progress. The addition of these factors makes it more probable that the contribution
determined by TIC capital can effectively be related to it and not to other external elements.
As also suggested by the literature, in order to benefit better from the characteristics of the sector,
estimates were made for the three macro-aggregates on information relating to a number of
sub-sectors and to the corresponding TIC capital measurement:
• manufacturing (12 sub-sectors);
• services (8 sub-sectors);
• construction.
The results of the estimates27 confirm the important role of TIC capital in all the macro-sectors
studied; this variable has a positive and statistically significant impact. Coded knowledge, diffusion
of technical knowledge, higher quality levels, alignment with international best practices – taken
together these factors contribute to the competitiveness of the economic system, favoring greater
internal and foreign market penetration. With regard to manufacturing, the elasticity of the value
added is 0.054. This parameter implies that if there is a variation of 10% of the TIC stock capital,
the added manufacturing value increases by about 0.5%. for the services sector the parameter
determined by the calculation is practically in line with the result for manufacturing. The elasticity
of the value added to the TIC capital is 0.053: the increase of 10% of the intangible TIC stock
therefore involves an increase in the value added of about 0.5% also in this case. A final
calculation of the model regarded the construction sector, another extremely important sector
for certification activities, especially concerning its qualifying role. Also in this case, the result of
estimates reveals an impact which is fully in line with the other sectors28.
Overall, it therefore emerges, from the econometric studies conducted in this analysis, that TIC
capital is important and impacts positively on the Italian national economy. This
contribution is not limited to enterprises which directly acquire TIC services, but it also extends to
entire sectors, showing that the benefits are incremental, that business earnings with TIC
investments are not substitutes for those of operators who do not use the same resources. There
are many possible channels whereby these effects can be manifested: among the many
mentioned, there is access to international markets, income opportunities which would not exist
without internationally recognized certification. TIC investments also increase the productivity of
other elements, and, if correctly used, calculations reveal that production and product quality
increase. The rise in unitary value added of a product generally reflects greater attention to quality
and safety of the offer, owing both to voluntary choices and mandatory requirements. Product
certification, for example, ensures characteristics of higher quality, engendering demand which
would remain unexploited owing to the absence of consumer assurances.
27 The Appendix on methodology gives a detailed description of the econometric analysis with the data used, specifications of models and the output of estimates for each sector analyzed. 28 See the Appendix on methodology for comments on the calculation of the model for the construction industry.

34
The parameters obtained from the estimates also make it possible to determine the contribution in
terms of TIC capital percentage to economic growth, and to obtain value added in financial terms
during the period in question. The table below shows the results for the period 2013-2018.
Table 1. The contribution of TIC capital to growth in the period 2013-2018 (in %)
contribution %
manufacturing 18.3%
services 16.4%
construction 5.7%
total for the economy 16.1%
Source: Prometeia data
In percentage terms, in the period 2013-2018, 18.3% of the growth of value added in the
manufacturing sector can be attributed to TIC capital. It contributed a little less (16.4%) to the
services sector and somewhat less, but still significant, in the case of construction. The
contribution of TIC capital to the growth of value added for the entire economy stands at
16.1%. On the basis of this information it is possible to make a financial evaluation of the
contribution of value added in the five-year period: overall, the TIC capital generated a
cumulative value of 10.8 billion euro29 (Figure 13). The monetary value varies from year to
year depending on the general economic situation, but a peak occurred in 2017 when TIC capital
generated 3.1 billion euro, whilst the average figure for the period is 2.2 billion. These
quantities are an incremental contribution to the value added of the national economy, meaning
that if, in the last five years, TIC capital had remained constant (that investments had been made
aimed only at replacing depreciated capital) the Italian GDP in 2018 would have been lower by at
least 10 billion euro (0.6 of the total). it is harder to assess what the situation would be if TIC
investments were reduced to nil. The economic impact would be significant but there would also be
phenomena of replacement among production factors whereby any estimates would be unreliable.
On the basis of the available information on the revenue from accredited activities of the TIC
capital it is possible to specify how much of the revenue deriving from the value added of 10.8
billion euro, over the five years regards exclusively accredited conformity assessment
activities, amounting to about 83%, a considerable quantity, accounting for some 9 billion
euro. This is due to the sharp growth in accredited activities in the period under consideration.
Figure 14 below shows the cumulative values for 2013-2018 of the TIC capital contribution for
each sector. In the services sector we can see a data of nearly 6 billion compared with 5 billion for
manufacturing and less in the case of construction. The figure for services is higher than for
manufacturing even though the percentage contribution is lower (Table 1) due to the greater
dynamism of the sector value added during the period in question.
29 Value at constant prices.

35
Figure 14. The contribution of TIC capital to growth in the period 2013-2018 (aggregate values)
Source: Prometeia data
The analysis is concluded with the evaluation of the relative effect of the individual typologies
of investment on the overall contribution to the economy of the TIC capital in the last five
years (Table 2). The methodology used did not permit a direct calculation of the contribution of
every operative area; the values stated are based on the dynamics and the contributions relating
to each TIC capital segment in the period under examination. The costs for testing laboratories are
those which, relatively, contribute most to economic growth. Following them, we find management
systems, product certification and inspections, with more similar effects. Calibration laboratories
have a more limited influence also because, coming at the end of the entire chain, they come
indirectly within all the other component factors.
Table 2. Impact of costs on the contribution of the single TIC components to the growth in the period 2013-2018 (in %)
management product testing inspections calibration
22.6 20.7 33.9 19.7 3.1
Source: Prometeia data
36
3.2 Accredited certification of management systems and business performances: a
successful relationship
3.2.1 Introduction
The set of procedures, of control systems and managerial processes required by all stakeholders of
an economic agent are formalized by ISO – the International Organization for Standardization – in
a series of technical management system certification standards with international
recognition belonging to the family of management systems. The main management
system certifications are among the most important in terms of diffusion and are therefore most
impactful regarding the national economy: quality management (UNI EN ISO 9001),
environmental management (UNI EN ISO 14001), occupational health and safety (UNI ISO 45001
– ex BS OHSAS 18001), information security (UNI ISO 27001), IT services management (ISO/IEC
20000), energy management (UNI CEI EN ISO 50001) and food safety management (UNI EN ISO
22000).
Organizations choosing to obtain certification of their management system by an accredited CAB
(in accordance with the accreditation standard ISO/IEC 17021-1), do so principally for three
different reasons: compliance with legal obligations, access to specific markets and organizational
fulfillment of the challenges of the global economic system. From a microeconomic point of view,
fulfilling the aspirations of individual businesses, the choice of certification creates value added and
ensures improvements in efficiency, encourages organizational and process innovation, greater
resilience and adaptability to market conditions as well as having an enhancement effect on
reputation with respect to clients, employees, shareholders and competitors.
The aim of this section is to analyze the sector and economic-financial characteristics, of
organizations with a certified management system according to an individual, rather than
systemic, approach, studying the differences in terms of economic-financial performance compared
with non-certified organizations, verifying the existence of a causal relationship between
certification and economic-financial results. Firstly, a general picture is presented of the
sampled businesses, identifying the certification standard and IAF (International Accreditation
Forum) sector, passing to a comparison of the principle corporate performance indicators with
non-certified companies. The focus moves on to the identification of the impact of certified
management system accreditation and to revenue and other items on the balance sheet, making
use of one of state-of-the-art statistical econometric methodologies.

37
3.2.2 Organizations with an accredited certified management system
There are over 88,000 Italian businesses with an accredited certified management
system (in accordance with one or more certification standards)30 with a production value of
1,405 billion euro31, equivalent to 40% of the total for the national economy (Figure 16).
In line with the structure of the Italian productive system, the majority of the businesses in
question are of small dimension: over 50% with a turnover of less than 2 million euro, a further
30% have a turnover of 10-50 million. 4% of large-scale businesses with a turnover of over 50
million euro generate almost 1.75% of the overall production value shown. (Figure 15).
Figure 15. Number of certified companies by size category
Figure 16. Value of production of certified companies by size category
Source: Prometeia data.
From a sectoral point of view – with analysis of the 39 IAF sectors of accreditation – there is a
strong concentration in the construction sector (IAF 28) as the main normative driving force
requiring accredited certification for many activities32. The importance of the construction sector is
redimensioned, although it remains in the top 5, if seen in terms of sectoral distribution in terms of
turnover. Among the most important sectors from this standpoint, are, in order of importance,
commerce (IAF 29), services (IAF 35), transport, logistics and communication (IAF 31), metals
and metal products (IAF 17). Looking at the situation when the sectoral analysis and dimensional
factors are compared, the structural differences of the various areas as far as the overall economic
system is concerned are reflected, and we find that a significant number of certified large
enterprises operate in the electricity supply field (IAF 25), other means of transport (IAF 22), food,
drink and tobacco businesses (IAF 03) and chemical products and fibers (IAF 12), as against a
prevalence of small companies in sectors characterized by fragmentation of the offer as can be
seen in construction (IAF 28) or engineering services (IAF 34).
30 The analysis was made referring to ACCREDIA data relating to the management system certification standards the size category and sector attribution were made by referencing these data with data belonging provided by Prometeia and from company balance sheets (source: database Orbis, Bureau Van Dijk). 31 Calculation for 2018, companies with recordable balance data. 32 With regard to the requirements for participation in public tender contract bids: SOA attestation for works with a starting bid of more than € 150,000.

38
Quality management systems occupy easily the leading position among certification schemes
with over 80% presence in the cases studies (Figure 17). A long way behind we find
environmental management systems (10.9%), then occupational health and safety
(5.6%). The diffusion among businesses of other reference areas of management systems stands
at less than 1%: if, for food safety (UNI EN ISO 22000) and energy management (UNI CEI EN ISO
50001), this has foundations in the strong sectoral orientation of the relative standards, the low
diffusion for information security management systems (UNI ISO 27001) and for IT services
management systems (ISO/IEC 20000) offers considerable growth potential.
Figure 17. Distribution of certification schemes
%
Figure 18. Average size of companies per certification schemes
millions €
Source: Prometeia data
It is interesting to note that organizations with the most common form of certification
(management system) in accordance with UNI EN ISO 9001 are those with a smaller average size
with respect to other schemes. However, energy management systems and IT services
management systems certifications are obtained by few large businesses. The reversed relation
between the grade of diffusion of a scheme and the average size of the certified business is
confirmed in other cases, as shown in Figure 18.
With regard to average data, the sectoral distribution of management system certification is
varied; the picture which emerges is coherent with the sectoral connotations of the standards.
The adoption of UNI EN ISO 9001 certification is much less than the average for electricity supply
(IAF 25) and for other social services (IAF 39) while there is a greater impact of environmental
management systems and those for occupational health and safety. Management systems for
information security are noteworthy only in IAF sector 33 – information technology, similarly for
management systems of the electricity supply (IAF 25), other means of transport (IAF 22) and
the food, beverages and tobacco industries (IAF 03).
To summarize, nearly half of the production value of Italian businesses is composed of
companies which possess an accredited management system. The most popular scheme is
quality management systems, especially for small and medium enterprises in construction. There
is considerable diffusion of environmental management and occupational health and safety
certifications, whilst the remaining ones are marginal. Given this general picture, the paragraph

39
that follows describes the evolution of corporate economic-financial performances of organizations
with a certified management system in comparison with non-certified ones. The data comes from
company balance sheets33.
3.2.3 The economic-financial performance: a comparison between certified and non-certified
companies
The aim of this analysis is to shed light on the difference in performance between certified
and non-certified companies in the period 2013-2018 by comparing the 88,000 certified
businesses in the ACCREDIA database with those which do not hold certification.
Certified companies, although far fewer than those of the sample to which they are compared, are
of a much larger average size, with a turnover which is comparable with that of non-certified
companies. As we have seen, certified companies have a production value of 1,405 billion euro, or
around 40% of the total for the Italian economy.
The study of economic-financial performance of the two samples reveals that the profitability of
certified companies is structurally higher than the average and that they are more efficient and
possess better debt sustainability.
Despite the impact of the 2009 crisis, businesses with a certified management system reacted
more promptly and effectively in the following years and also showed greater strength during the
second wave of recession in 2012-2013 (Figure 19).
Figure 19. Value of production index 2008=100
Figure 20. Value of production – 2018 index 2008=100
Source: Prometeia data.
The tables show that, in the year 2018, the value level of production of certified companies was
7.5% higher than in 2008, as against a 6.6% rise in the case of non-certified companies. (Figure
20).
33 The data in chronological order have been collated using the method of chain indices (see the Methodological Appendix).

40
Figure 21. Gross operating profit margin in % of production value
Figure 22. Gross operating profit margin diff. 2014-2018 (p.p.)
Source: Prometeia data
With regard to the capacity to generate profit margins, the choice to invest in accredited
management system certification is a decisive factor: profitability is structurally higher than
with non-certified companies (Figure 21), with an operative profit margin for 2008-2018
estimated at 8.9% against 6.3% of the benchmark (production value estimate). Regarding the
period 2014-2018 the advantages of certification show a 1.5% evolutionary increase, rather than
1% for non-certified companies (Figure 22).
On average, over the last ten years, companies with management system certification show a
structurally higher level of efficiency, measured in terms of turnover of capital investment, than
non-certified ones. The crisis accentuated the differences, underscoring the strategic role of
certification as a corporate asset.
Also in the case of debt sustainability the situation of certified companies is more solid: in 2018,
the number of years of profitability necessary for financial debt repayment (excluding what can be
covered with liquidity) is calculated at one year and nine months more for non-certified
organizations than for certified ones.
Apart from aggregate results there are performance differentials which vary depending upon
the operative sector of the organization. For example, regarding the most representative
sector (construction IAF 28), the gap with non-certified organizations is very clear from every
point of view: relatively steady revenue growth despite the sector crisis; structurally and
significantly higher profitability and efficiency margins (Figure 23). This data should be considered
in the light of the special characteristics of the sector which, as we have seen, makes certification
a condition for obtaining public works contracts above a certain threshold and for private works for
clients who require it. In other sectors, although the differences remain transversal between the
two samples, they do not always reach all aspects of performance, but they characterize, in
accordance with sectoral qualities, certain indicators (in the methodology Appendix there are some
summary tables for the various IAF sectors).

41
Figure 23. Certified and non-certified companies: growth, profitability and efficiency – Construction sector
Production value index 2008=100
Gross operative profit
margin in percentage of production
value
Turnover of invested
capital average 2008-2018
Source: Prometeia data
3.2.4 The effects of management systems on business performance
From an analysis of the sectoral composition of organizations with an accredited and certified
management system and from the differences of financial performance with respect to non-
certified organizations, we can see a greater capacity to generate income, alongside an
advantage in efficiency and financial sustainability for certified companies. However, this
is not sufficient to establish the direction in which the causal relationship goes between
certification and performance if accredited certification brings benefits to companies which use it or
if the choice of certification is an effect of being a best-performer company with respect to the
benchmark.
To identify the causal effects in economic and non-economic studies, the literature is generally
based on the comparison between the single items and a sample control set with similar
characteristics34. This approach permits a comparison of the condition of single entity (in our case
companies which have chosen an accredited certified management system) with the hypothetical
(counterfactual) condition that it would have been possible to understand if the differences
between the two situations are actually caused by the intervention. The approximation of the
34 Rubin, Donald B. (2006). Matched Sampling for Causal Effects. Cambridge: Cambridge University Press.

42
counterfactual situation takes place by means of the creation of a set of ad hoc controls for each of
the entities being processed; for the purposes of this study, this translates into the definition, for
each certified business, of a set of non-certified businesses with characteristics (structural
characteristics such as the sector, the size, the economic-financial characteristics) which are more
similar to the situation in the period before certification35. Once the correct control set has been
found for each company, it becomes possible to quantify the causal effect36 of certification on the
performance differential between the two groups in the periods before and after the intervention,
i.e. before and after the obtaining of certification.
Utilizing the potential of the econometric tool37 and of the available statistical information, the
analysis of the impact was developed on two different time levels: the short period, which takes
into consideration the year of treatment and the subsequent two years, and the long period which
extends to ten years from the date of initial (first) certification.
Analysis of the brief period was carried out on all businesses with continuous balance sheets in the
period 2012-2017 in order to limit possible distortions deriving from a period of calculation which
includes the years of the recession. But for the long period calculation we have focused on three
years of treatment (2005, 2006, 2007) studied within the broader timeframe of the ten years
following the start of certification.
The estimate of the effect generated by certification on the performance of companies with
accredited management system certification was undertaken on a number of the more significant
economic-financial indicators38 in short period activities, whilst for long period activities we have
concentrated on revenue.
The analysis includes businesses with a certified quality management system (UNI EN ISO 9001)
which is both exclusive (with differentiated results according to the sector – industry, construction,
services) and associated with a certified quality management system in a niche sector, specifically
aeronautics, medical devices, metal welding and environmental certification. The impact of
management system certification for occupational health and safety was analyzed separately,
owing to the specific complexities of this area and its multiple influences on corporate life (UNI ISO
45001 – ex BS OHSAS 18001).
Table 3 shows – differentiated according to typology of certification – the average effects of the
“treatment” (adoption of an accredited certified management system) on revenue in the
35 Rosenbaum, Paul R.; Rubin, Donald B. (1983). The Central Role of the Propensity Score in Observational Studies for Causal Effects. Biometrika. 70 (1): 41–55. 36 Abadie, A. (2005). "Semiparametric difference-in-differences estimators". Review of Economic Studies. 72 (1): 1–19. 37 Imai, K., Kim, I. S., & Wang, E. (2019). Matching Methods for Causal Inference with Time-Series Cross-Sectional Data. 38 The outcome variables of the study are: revenue, gross operative profit margin, gross operative income, cost of labor in % of value added, investment capital turnover, production per employee, short-term assets in percentage of short-term liabilities, financial burden in percentage of the gross operative profit margin, storage days, cash flow in percentage of production, costs in percentage of production, fixed and operative capital intensity.

43
brief period (year of certification and subsequent two years) expressed in percentages with
respect to the average revenue of certified businesses39.
To facilitate comprehension of the table we have exemplified the interpretation through the case of
industrial sectors with a certified quality management system (first line). On average, with
respect to the counterfactual, in the second year after certification, a business in this category has
accrued additional income, attributable to certification, which can be estimated at 2.6 points of the
revenue for that year. it is therefore possible to sustain that the rate of revenue would not be
attained without certification, constituting an income differential of 2.6 euro in 100 which
represents the contribution made by certification to business performance. Returning to the overall
results, we see that the impact is positive and significant in at least one of the three years in all
certification categories, with the exception of management systems for metal welders (Table 3). In
the case of construction operators, in the first and second years after certification there is an
additional growth of income of 8.2% and 17% respectively owing to UNI EN ISO 9001 certification.
This should also be seen in the context of a sector framework in which certification is obligatory for
participation in public works contract bids. The impact on industrial revenue is less evident (+1.3%
in T0, +2.5% in T+2); in services there were good results over the three years (from +3.9% to
+8%). With regard to certifications combined with quality management systems, there was a
sustained rise during the period for medical devices which is another area, like construction,
where certification enables the participation in public works contract bids of the Public
Administration Authorities. Businesses with environmental management certification achieved
positive results from certification in two of the three years, confirming the higher level of care
taken by consumers in ecological factors. These results, together with the growing attention given
by businesses and institutions to social and environmental sustainability, should lead to major
steps forward in this area of certification in the near future. Occupational health and safety
management systems, evaluated independently of concurrent UNI EN ISO 9001 certification,
showed important results only in the period covered by the certification, adding 2.6% to revenue
with respect to the counterfactual element. To summarize, there is a positive relationship
between UNI EN ISO 9001 certification (both stand-alone and in conjunction with its
sectoral applications) and the capacity of certified businesses to generate income, even if
there are differences of size which depend on the sector of application.
39 Where absent, the data is to be considered statistically not different from zero to the 10% level of significance.

44
Table 3. Increase in revenue percentage attributable to certification. Major statistical impacts only
Certification category Year of
certification (T0)
Year after
certification
(T+1)
Two years after
certification
(T+2)
UNI EN ISO 9001 -
Industry 1.3 - 2.5
UNI EN ISO 9001 -
Construction - 8.2 17.0
UNI EN ISO 9001 -
Services 3.9 6.4 8.0
UN IEN ISO 9001 +
Aeronautics
(9100+9110+9120)
- - 7.5
UNI EN ISO 9001 +
Medical devices (13485) 4.5 12.7 18.1
UNI EN ISO 9001 +
Metal welding (3834) - - -
UNI EN ISO 9001 +
Environment (14001) - 4.4 8.7
UNI ISO 45001 – ex BS
OHSAS 18001 –
Workplace health and
safety
2.6 - -
Source: Prometeia data
The other variables of the survey were chosen from the most representative ones to assess the
presence of effects on the cost structure, on the capacity to generate profit margins, on
employment and on financial leverage. The results were very heterogeneous amongst the different
typologies of certification and a few interesting cases are discussed below (the complete tables can
be consulted in the methodology Appendix).
The aeronautics sector presents a pertinent case, with an increase in activities, in profitability
(positive impact on the operative profit margin of 3.3% in the second year) and an increase in
cash flow capacity (with average effect in T+1 and T+2 of 3.8%) with an average rise in fixed
capital intensity of 6% in the three-year period, testifying to the rise in corporate investments
which are necessary for fulfillment of the normative requirements. Companies which adopt a
certified environmental management system in conjunction with UNI EN ISO 9001 have reduced

45
investment profitability two years after initial certification, possibly influenced by the need for
additional investments in order to broaden their activity range and to promote productive and
environmental efficiency. Contrarily to what one might think, companies with occupational health
and safety certification are not especially penalized in terms of cost structure (nor of labor costs
per added unit of value) and nor for total costs as a percentage of production). Finally, a positive
and significant cash flow differential (measured in production percentages) emerges which is
transversal for almost all typologies of certifications treated: a sign of greater productive
efficiency with respect to non-certified organizations.
Analyses highlight the positive impact of certification in the years immediately after it has been
obtained. The question then presents itself: do the positive effects of certification continue over
time or do they diminish in the long run? To answer this question a counterfactual analysis was
carried out for assessing this aspect of the benefits of UNI EN ISO 9001 certification at a distance
of 10 years. We focused on revenue, verifying the validity of a positive relationship between
management system certification and long-term capacity to generate income. The impact
was measured in three classes40 (from 2005 to 2007 in the respective 10 subsequent years), and
it was shown to be very positive and statistically significant, standing at a level of 10% in the final
years of the period studied. On average, for the three classes, in T+10 the impact was about 18%
higher than in non-certified cases, showing sustained efficiency and considerable cumulative
benefits over time with respect to organizations of the control sample. Figure 24 shows the
average progress rate of certified companies in 2007 against the benchmark of non-certified ones
with 100 as the value for the reference year. Given that the time period covered includes the years
of recession in which many companies closed, all the companies considered (both certified and on
the control sample) were the strongest among those in existence at the start of the period of
analysis. The situation regarding revenue in the first part of the table reflects these considerations,
with the effects of certification beginning to emerge clearly from 2012 and to continue throughout
the timeline, generating the cumulative effect, as described.
40 All the businesses with QMS certification for the first time in 2005, 2006, 2007 respectively were considered as belonging to different classes of certification.

46
Figure 24. Evolution of the average level of revenue of organizations with a certified management system compared with counterfactual control sample (year of initial certification – 2007)
Source: Prometeia data
Certified export operators
From the start of the crisis to recent times, exports have provided an extremely valuable outlet for
the Italian production system, keeping up the revenue of companies directly involved in the
process of internationalization, as well as those involved in sub-supply in the production chain. The
number of companies involved has increased over the years: there were almost 126,000 in
201741, taking export values above the threshold of 400 billion euro. This growth also involved
small and medium enterprises (the heart of the Italian production system) obtaining very positive
results in the majority of cases42. In an increasingly inter-connected world with increased trade
exchanges and progressive enlargement of supply chains (whose production center of gravity is
moving geographically in an easterly direction) many Italian companies have forged a role for
themselves as a reliable partner in global value chains or as producers of goods of excellence.
Increased trade relations, new productive realities and greater technological complexity of goods
have inevitably led to more regulations and non-tariff barriers. To think of these as mere
protectionist tools is a little simplistic, in the light of greater consumer awareness (especially in the
richer countries, but not only in them) of safety and, more generally, sustainability considerations.
From a B2B standpoint, compliance with standards along the value chains can be considered a
strategic asset for a supplier when it is not a prerequisite for obtaining a position in the chain. The
necessity to demonstrate conformity with standards by means of procedures with mutual
international recognition finds a response in conformity assessment, through which assurance
is given to consumers and enterprises concerning the safety and reliability of products and
services.
41 ISTAT-ICE 2018 Yearbook and report on competitiveness in productive sectors 2020. 42 Prometeia-ISP, Analysis of industrial sectors, various editions.

47
Reaching these objectives without creating bureaucratic obstacles is the hardest task for regulators
of world trade owing to the presence of diverse interests and the impossibility of harmonizing
standards and conformity assessment procedures worldwide.
Historically, the most effective solution is mutual recognition of national legislative equivalence. In
this sense, the European single market constitutes a successful example: over the last 20 years
the value of trade between these countries has more than doubled. The EU also leads the way in
the implementation of best practices. The agreements with Canada (CETA) and Japan (JEFTA) are
the most recent agreements of new generation deals between the EU and third countries. The first
in this type of agreement was the free trade deal between the EU and South Korea, signed on
October 6, 2010 and entering into force provisionally on July 1, 2011. As well as removing a large
part of customs duties, the deal overcame a series of non-tariff barriers blocking commerce in
such areas as automotive, pharmaceutical, medical and electronic. The results have exceeded
expectations. Regarding Italy, Italian exports to South Korea have climbed by 81.6% between
2010 and 2019, going from 2.5 to about 4.7 billion euro.
Although these agreements enhance trade, they are also a cause of worry for export businesses
due to the procedures and costs of product conformity, backed by harmonized regulations and
recognized equivalents. Added to this, is the perplexity of European public opinion which is
concerned about the possible negative effects of these agreements in terms of safety. This is
where an efficient and effective Quality Infrastructure comes into play43 as a reference framework
for defining rules for ensuring and demonstrating the quality of products and services. In a
context of clear rules and with the assurance provided by certification bodies, export
businesses can benefit significantly from increased efficiency thanks to reduced costs of
adaptation of products and productive processes which come from conformity with international
standards and/or the mutual recognition of the rules and procedures of conformity assessment.
Possession of accredited certification is a major strategic asset for many Italian companies
operating in foreign markets.
The database resulting from the agreement between ACCREDIA and ISTAT of November 2008
making available for the first time information on the diffusion of management system
certifications issued to organizations by accredited CABs provides empirical evidence to back up
this assertion. The data shows that in 2017 there were over 19,000 export operators in Italy with
accredited management system certification – little more than 15% of the total, a percentage
which, however, rises to 53% if the value of the exports is considered. With regard to the size of
businesses, in line with the propensity for export, the number of certified exporters tends to
increase along with the company size: for small businesses of fewer than 10 employees it is 3.6%,
but for large companies with over 250 employees the figure stands at 56% (Figure 25). This
phenomenon seems to be a prerogative of the of bigger organizations, despite the advantages that
accredited certification would bring especially to small and medium enterprises, avoiding long and
complicated procedures and the problem of duplicate checks at national frontiers.
43 ACCREDIA (2019), International commerce, the value of accreditation and standardization, the ACCREDIA Osservatorio 1/2019.

48
Figure 25. Diffusion of certification amongst exporters according to numbers of employees – 2017
Source: ISTAT and ACCREDIA data
The ISTAT-ACCREDIA data shows clearly that accredited certification is an advantage for
businesses. A certified small or medium export business has an average export value
which is about three times greater than its non-certified counterpart, which means, in
financial terms, an added 3.3 million euro per company.
A significant amount of these enterprises, especially those with a staff of fewer than 50, have a
more diversified geographical export framework. This is true of all small businesses: a
certified manufacturing company with fewer than 10 employees exports, on average, to 5
countries and a non-certified one of the same size only to 3 countries.
The advantage in terms of productivity is transversal amongst all sizes of company, though
the gap gets smaller as the company size increases. The largest differential occurs in small
organizations and becomes marginal in the case of companies of a greater size (thus productivity
is an essential element, irrespective of certification). In detail, the differential varies from 1.4% for
companies with over 250 staff to 18.8% for small businesses (Figure 26).
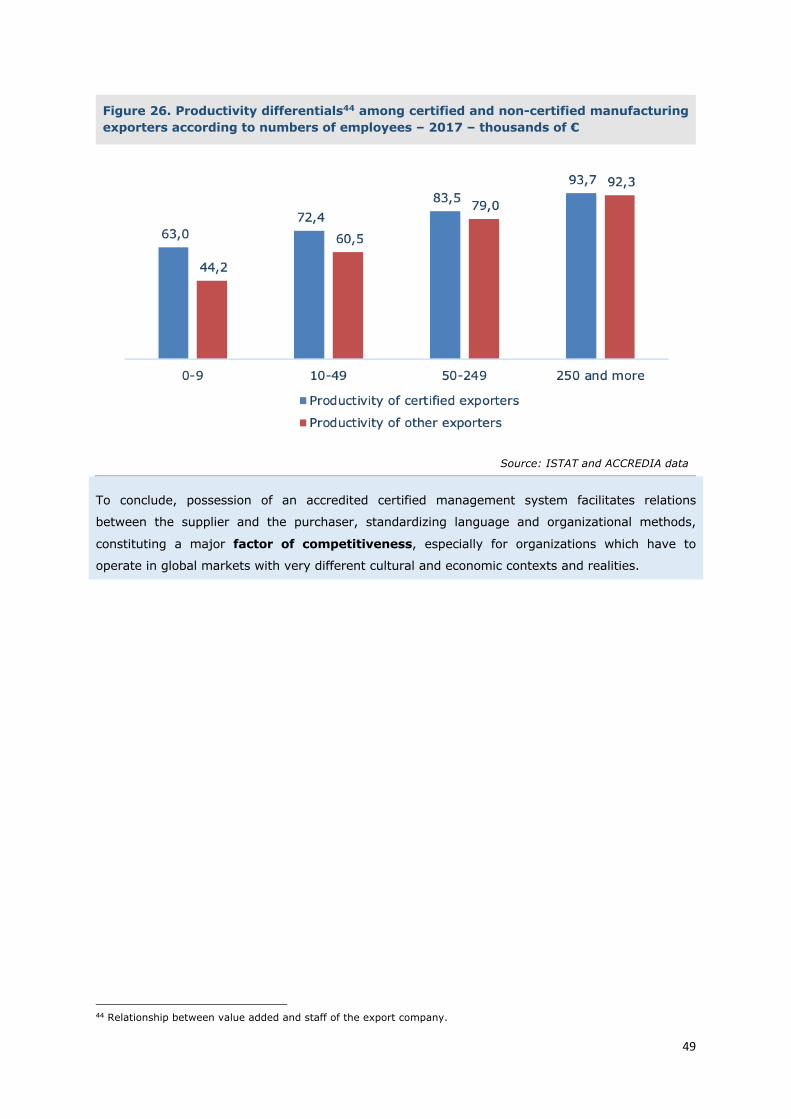
49
Figure 26. Productivity differentials44 among certified and non-certified manufacturing exporters according to numbers of employees – 2017 – thousands of €
Source: ISTAT and ACCREDIA data
To conclude, possession of an accredited certified management system facilitates relations
between the supplier and the purchaser, standardizing language and organizational methods,
constituting a major factor of competitiveness, especially for organizations which have to
operate in global markets with very different cultural and economic contexts and realities.
44 Relationship between value added and staff of the export company.

50
4. Not only growth: externalities of the “culture of quality” for health,
safety and the environment
4.1 Introduction
The Quality Infrastructure system described in the previous sections pervades many areas of a
modern economy. It is intrinsically present in many moments of daily life, in products, consumer
choices (although they may not be conscious of this or well-informed). It provides assurance in
exchanges, compliance with standards, raises quality, supports demand and, in the final analysis,
ensures economic benefits for the entire national economy. Compliance with the mandatory
standards, inspections or the adoption of voluntary standards often have effects which go beyond
the private interests of parties involved: they generate other benefits and advantages for
society and can become instruments for attaining goals in the public interest. These
objectives are enshrined in legislative regulations; for instance, the illegal use in production of
harmful substances or technical standards guaranteeing the safety of objects and devices for the
protection of public health. In voluntary management system or product certification, private
matters frequently combine with social support actions and become levers of strategic
communication. This can be seen in the attention given by businesses to aspects of social
responsibility and the environment, as well as pressure from consumers who are increasingly
aware of these problems. The importance of these issues is also reflected in a great deal of
initiatives which caused rapid changes in the national and international normative framework. In
2015, for example, there were three major events in this area: the climate change conference in
Paris set out, on a global scale, the medium/long-term aims for the reduction of emissions; in the
same year the UN launched its 2030 Agenda, defining 17 objectives for the promotion of a
sustainable economy from an economic, social and environmental point of view, and thirdly, the
EU voted an action plan for the circular economy – “closing the loop” – fixing a range of goals
which impact every level of the industrial chains. Protection of the environment, safety and health
care are becoming more central in the public debate and in individual personal choices.
In this third chapter we discuss the contribution that some elements of the quality structure
bring to society in terms of the environment, safety and health; more precisely, the
analysis considers and evaluates the reduction of externalities and of their related financial costs
attributable to the TIC activities considered.
Externalities means the unintentional effects deriving from an action which impacts production or
the consumption on the part of a second party without direct payment transaction between the
two. In economics externalities modify the function of production or the function of utility of a
second recipient in terms of effects which are external to the market because they are not part of
a financial transaction. The effects of externalities can be either positive or negative; a negative
externality may be the emission of an atmospheric pollutant which also affects the activities of
other organizations, or it may modify the productivity of people taking part in the production
process, or it may alter consumption, or adversely affect human well-being. A classic example of a
positive externality is that of a farmer who disinfests a field and thereby improves nearby land
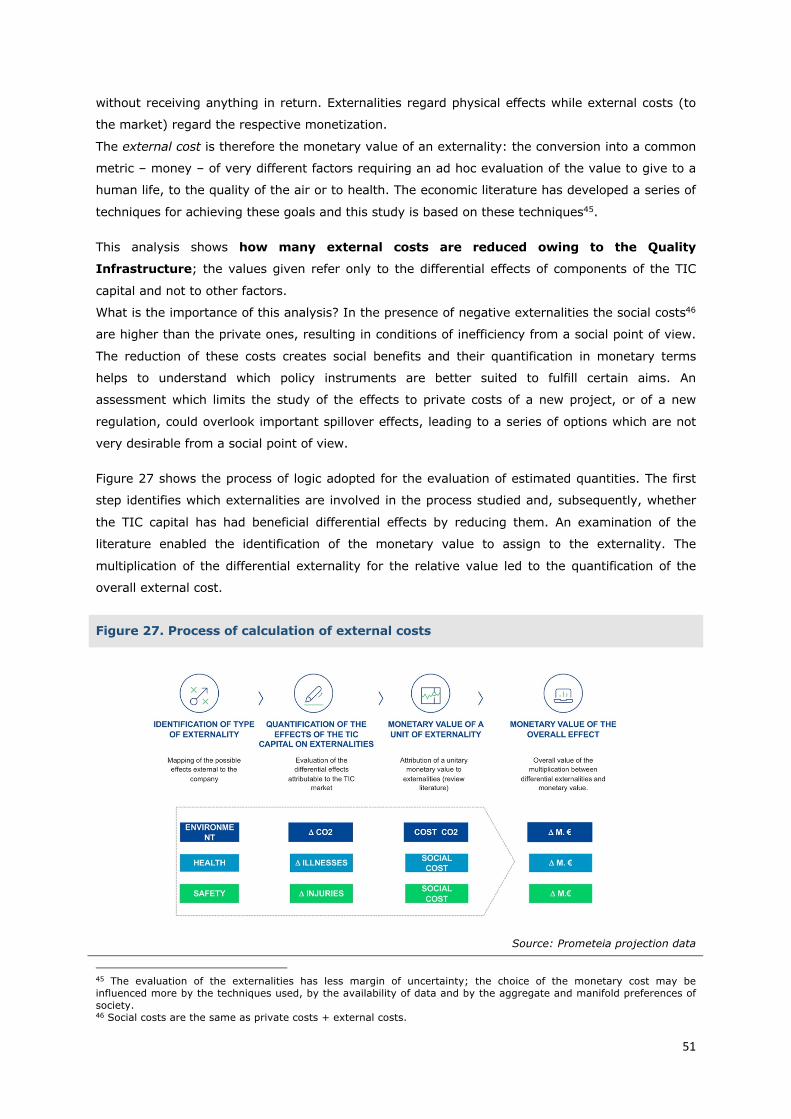
51
without receiving anything in return. Externalities regard physical effects while external costs (to
the market) regard the respective monetization.
The external cost is therefore the monetary value of an externality: the conversion into a common
metric – money – of very different factors requiring an ad hoc evaluation of the value to give to a
human life, to the quality of the air or to health. The economic literature has developed a series of
techniques for achieving these goals and this study is based on these techniques45.
This analysis shows how many external costs are reduced owing to the Quality
Infrastructure; the values given refer only to the differential effects of components of the TIC
capital and not to other factors.
What is the importance of this analysis? In the presence of negative externalities the social costs46
are higher than the private ones, resulting in conditions of inefficiency from a social point of view.
The reduction of these costs creates social benefits and their quantification in monetary terms
helps to understand which policy instruments are better suited to fulfill certain aims. An
assessment which limits the study of the effects to private costs of a new project, or of a new
regulation, could overlook important spillover effects, leading to a series of options which are not
very desirable from a social point of view.
Figure 27 shows the process of logic adopted for the evaluation of estimated quantities. The first
step identifies which externalities are involved in the process studied and, subsequently, whether
the TIC capital has had beneficial differential effects by reducing them. An examination of the
literature enabled the identification of the monetary value to assign to the externality. The
multiplication of the differential externality for the relative value led to the quantification of the
overall external cost.
Figure 27. Process of calculation of external costs
Source: Prometeia projection data
45 The evaluation of the externalities has less margin of uncertainty; the choice of the monetary cost may be influenced more by the techniques used, by the availability of data and by the aggregate and manifold preferences of society. 46 Social costs are the same as private costs + external costs.

52
The evidence reported regards only some significant examples which are part of the Quality
Infrastructure and it does not consider many others which, for reasons of information availability
or because they are not strictly relevant to this study, have been left out. The following have been
examined: environmental certification (EMS), energy efficiency certification (EnMS), occupational
health and safety (OH&S), food safety (FSM), the formaldehyde standard and a part of the EU’s
mandatory regulations covering the activities of notified bodies.
The results (Table 4) were obtained using various methods ranging from analysis of the literature
to the creation of ad hoc econometric models which are analyzed further on. They show an
important contribution in terms of environmental and social benefits; with parity of output,
CO2 emissions will be reduced and years of health are gained. In the central evaluation, also the
monetization expressed in terms of the saving of social costs amounts to some 1.3
billion euro per year in a range which varies between 550 million and 2 billion depending on the
evaluation applied. For voluntary management systems the figures reported take into account the
current diffusion and any future expansion could increase the systemic effects stated.
Table 4. The annual social benefits (reduction of external costs) (millions €) based on 3 possible estimates
Minimum Central Max
Environmental certification 180 361 551
Energy certification 85 170 254
OH&S 191 301 442
Food safety 72 426 722
Formaldehyde 0.4 0.5 0.6
Some EU Directives 18 24 30
Total 546 million € 1,283 million € 2,000 million €
Source: Prometeia data
4.2 Environmental certification
The voluntary adoption on the part of companies of practices aimed at environmental protection is
among the most important tools of corporate social responsibility and it is increasingly
incorporated in company strategies. Environmental management system certifications (EMS) in
accordance with ISO 14001 are the most common, not only for the fulfillment of targets set out in
the environmental standards, but they also constitute a possibility for integrating a corporate
policy aimed at continuous improvement of performance and of environmental management within
the organization that adopts them.

53
In addition to ISO 14001 there are other tools, such as the ecological quality mark (EU Ecolabel)
and EMAS certification (Eco-Management and Audit Scheme), which are complementary to the
environmental management system. Altogether, in Italy there are over 20,000 businesses with
accredited certification, and of the various management system certifications, accredited EMS
certification has grown the most in the last 5 years. In this study we concentrate on businesses
with accredited EMS certification, presenting the benefits and the effect this has on the business
itself and, more generally, on the economy by means of a reduction of climate changing emissions.
There are many advantages for a business with accredited EMS certification. Its
reputation among consumers and final users, stakeholders such as clients and suppliers, are all
significant advantages. With growing awareness of the environmental impact and sustainability of
products and processes, accredited certification, especially against ISO 14001:2015, constitutes an
assurance underscoring the entire life cycle of a product or service, ensuring that every phase,
from design to marketing and as far as disposal, is controlled or influenced by the certified
company. A certified EMS is a strategic tool which enhances the competitiveness of the businesses
which have chosen it, and accreditation is an important value added for external recognition and
for giving value to the ecological policy of the company. As well as the advantage it provides in
terms of reputation, there are also the benefits of improved productivity and cost reduction:
a recent study by Boiral et al. (2017)47 reports that about 17% of the studies48 on the impact of
ISO 14001 consider socio-economic factors such as improved efficiency of productive processes
and greater client satisfaction. The organizational benefits have also been highlighted in numerous
studies of Italian and foreign enterprises49, including the recent CESQA-ACCREDIA (2018)50
enquiry. These competitive advantages are recognized by businesses, which count them not only
as benefits but also as motivations for obtaining EMS certification (Morrow and Rondinelli, 200251).
Although the benefits for companies in terms of efficiency and reputation are important, it is the
improvement in environmental performance – reduction of emissions, waste disposal efficiency,
reduction of water pollution, better use of resources etc. – which is the greatest benefit and
principal driver in the choice of adopting a certified EMS.
Benefits related to the more efficient use of resources and the resulting reductions of
environmental impact translate into a positive externality for the entire economy. A significant
improvement in environmental performance in terms of the reduction of air and water
pollution related to the use of a certified EMS has been identified in many studies.
47 Boiral, O., Guillaumie, L., Heras-Saizarbitoria, I. & Tayo, C. (2017). Adoption and Outcomes of ISO 14001: A Systematic Review. International Journal of Management Reviews. In press. 14-2017. 10.1111/ijmr.12139. 48 See, for example: Hasan, M. and Chan, C. K. (2014). ISO 14000 and Its Perceived Impact on Corporate Performance. Business and Management Horizons, 2, 11-18. 49Some references: Arena, M., Azzone, G., Platti, M., (2012). ISO 14001: Motivations and benefits in the Italian metal industry. Int. J. Eng. Bus. Manag. 4 (41), 1e9. Curkovic, S. and Sroufe, R. (2011). Using ISO 14001 to promote a sustainable supply chain strategy. Business Strategy and the Environment, 20, 71-93. Djekic, I., Rajkovic, A., Tomic, N., Smigic, N. and Radovanovic, R. (2014). Environmental management effects in certified Serbian food companies. Journal of Cleaner Production, 76, 196- 199. 50 CESQA, Accredia (2018). Benefits, costs and prospective of the environmental management system: Study of Italian organizaitions certified to ISO 14001. 2018 edition. 51 Morrow, D. and Rondinelli, D. (2002). Adopting Corporate Environmental Management Systems: Motivations and Results of ISO 14001 and EMAS Certification. European Management Journal, 20, 159-171.

54
On a macroeconomic level, Potoski and Prakash (2013)52 find that an increase in ISO 14001
certifications is associated with a significant reduction of sulfur dioxide pollution (SO2), one of the
main atmospheric pollutants. Similar results emerge from studies of emissions data made on
individual businesses: Nishitani et al. (2012)53 on a sample of Japanese businesses and Testa et al.
(2014)54 on a sample of Italian ones find a greater probability that organizations with
environmental certification have reduced emissions and improved environmental performance
levels with respect to non-certified ones.
On the basis of the results of the methodologies proposed by Testa et al. (2014)55, the impact of
accredited EMS certification on the reduction of GHG emissions was submitted to more in-depth
analysis. Starting from the coefficients of the probability of improved environmental performance
measured by Testa et al. (2014), a sectoral “reward” was attributed in terms of the reduction of
the CO2 equivalent emissions56: for every sector a reduction percentage was estimated attributable
to a certified EMS depending on the internal distribution in each sector of the number of
organizations with a certified EMS and according to the revenue factor of certified businesses set
against the total for the sector and on the total timeline of the certification in question. The study
included all the businesses with a certified EMS in ACCREDIA’s database, apart from a few
organizations for which there was no available updated balance sheet data and some others which
were excluded from ISTAT statistics, but this did not affect the study qualitatively. The 4,912
companies considered cover 28 sectors of activity and represent about 16% of the total (in terms
of revenue).
The overall “reward” for reduction of GHG emissions is estimated to be 6.9%, but with
considerable sectoral differences: energy management certification is associated with a reduction
of 14% of emissions and in the textile industry the reduction is around 10.5%, whilst in the case of
pharmaceutical sectors and those regarding rail, air and maritime transport the estimated figure is
2.7% and 0.5% respectively.
The sectoral reward coefficients were related to the data for emissions per sector. The ISTAT
statistics are calculated using the national inventory of atmospheric emissions, drawn up annually
by ISPRA (the institute for environmental research and protection) which reported total CO2
equivalent emissions in Italy of 297 million tonnes for 201857. The cumulative saving attributable
to accredited environmental certification is estimated at about 7.76 million tonnes of CO2
equivalent emissions per year. This “saving” can be expressed in economic terms, attributing a
value to the cost of CO2.
52 Potoski, M. and Prakash, A. (2013). Do voluntary programs reduce pollution? Examining ISO 14001's effectiveness across countries. Policy Studies Journal, 41, 273-294. 53 Nishitani, K., Kaneko, S., Fujii, H. and Komatsu, S. (2012). Are firms' voluntary environmental management activities beneficial for the environment and business? An empirical study focusing on Japanese manufacturing firms. Journal of environmental management, 105, 121-130. 54 Testa, F., Rizzi, F., Daddi, T., Gusmerotti, N. M., Frey, M. and Iraldo, F. (2014). EMAS and ISO 14001: the differences in effectively improving environmental performance. Journal of Cleaner Production, 68, 165-173. 55 Greater detail on the methodology can be found in the methodology Appendix. 56 CO2 equivalent emissions is a measurement unit enabling measurement together of the GHG emissions with different effects on the atmosphere. E.g., one tonne of methane with a climate altering potential 21 greater than CO2, is calculated as 21 tonnes of CO2 equivalent. The potential climate changing gases have been set out by the Intergovernmental Panel on Climate Change (IPCC) - Source: Ministry of the Environment. 57 In the 28 IAF sectors used in this study.

55
Depending upon the CO2 price per tonne ratio, concerning which, at present, there is no
international consensus, the saving range goes from 176 to 539 million euro58 (Figure 28).
Figure 28. Emissions savings attributable to use of accredited EMS certification and economic value
Source: Prometeia projection data
This estimate of the reduction of emissions only considers the adoption of an EMS certification but
it should be remembered that there are other important accreditation standards such as
certification of persons recovering fluorinated gases (F-Gas) and certification of organic operators.
The first of the two standards verifies and certifies the competences of professionals and imposes
strict controls on F-Gas emissions which alone account for 2% of the total GHG emissions in the
EU. The reduction of CO2 emissions is also a significant factor in the certification of organic
production. The recent work by Smith et al. (2019)59 estimates that a total reduction of 180,000
tonnes of CO2 is gained by using organic methods of breeding and farming, creating savings of
between 4 and 12 million euro60.
Analyses show that accredited certification leads to a real reduction of emissions, benefiting all of
society and providing support for new approaches of enterprises to environmental issues,
promoted by institutional entities and required by consumers.
58 For the economic evaluation, the prices of 25$, 50%, and 75$ per tonne were considered, referring to the 3 scenarios proposed by the IMF. According to IMF estimates, in order to keep global warming under 2°C by 2030, the price of emissions should reach 75$ per tonne (see IMF (2019), Fiscal Policy for Paris climate strategies – from principle to practice, IMF Policy Paper; IMF Fiscal Monitor October 2019). 59 Smith, L. G., Kirk, G. J. D., Jones, P. J., Williams, A. G. (2019). The greenhouse gas impacts of converting food production in England and Wales to organic methods. Nature communications, 10, 4641. 60 The calculation refers to three scenarios of CO2 pricing defined by the IMF.

56
4.3 Energy certification
In a world where environmental considerations are gaining importance and where there is growing
awareness regarding the adoption of ecological strategies and policies in many sectors, energy
efficiency occupies a role of primary significance, going beyond corporate and general economic
savings and having substantial positive effects also in terms of containing the emission of
atmospheric pollutants.
The diffusion of “good practices” in energy efficiency – during production and in the final use,
including renewable energy sources – has gathered pace over the last decade, with accreditation
making a central contribution. There are many typologies of measurement, tools and people
involved in this process. In this paper we concentrate on three of them: energy service companies
(ESCo), Energy management experts (EGE) and energy management certification (EnMS).
An ESCo or company providing energy services is defined in article 2 of Law Decree
115/2008, as the “natural or legal person who provides energy services and other measures for
the improvement of energy efficiency in installations or rooms of the user and, in doing so, accepts
a certain margin of financial risk. Payment of services is based, partially or totally, on the
improvement of energy efficiency obtained, and on the fulfillment of other established performance
criteria.” This law defines the energy management expert as a “person possessing the
knowledge, experience and capacity to efficiently manage the use of energy”, and energy
management systems as “the part of the corporate management system which regards the
organizational structure, planning, responsibility, procedures, processes and resources for
developing, implementing, improving, obtaining, measuring and maintaining a corporate energy
policy.” Certification procedures have been established for each of these requirements (mostly
voluntary) aimed at increasing the level of quality and technical competence concerning the
services and procedures provided. The minimum requirements for ESCos are set out in the
standard UNI CEI 11352, conformity with which – together with Law Decree 102/2014 – was made
mandatory for the entities delivering energy diagnosis services (imposed on large or high energy
consumption companies) and, since July 2016, in order to obtain the “Energy Efficiency Title” (TEE,
or “Certificati Bianchi”)61. The requirements of competence and knowledge in energy management
for energy experts are defined in the standard UNI CEI 11339 and the standard for energy
management systems is UNI CEI EN ISO 5000162 (see the methodology Appendix and note for
more details regarding the normative aspects). In these areas accredited certification provides an
important contribution, guaranteeing the consistency of requirements and of the application of the
verification methods described in the standards. Setting aside the legal obligations, the extreme
delicacy of the evaluation of interventions in energy efficiency (given the risks involved for persons
involved such as, for example, failure to achieve the desired savings) provides an incentive to opt
for accredited certification. There are a little more than 1,000 accredited ESCos and some 3,000
accredited EGE in Italy, added to which there is a total of over 2,600 businesses and Public
Administration entities with accredited EnMS certification.
61 Mechanism developed in Italy for achieving aims of energy reduction for supporting, in particular, medium and high capital intensity initiatives. 62 Replacing, since 2011, UNI CEI EN ISO 16001:2009.

57
The main advantages cited by users are increased client trust, higher market profile, access to
public works contracts and, in the case of energy efficiency certification, opportunities to innovate
a process or product deriving from corporate energy performance.
In what ways is it possible to quantify the economic benefits of certified energy efficiency
measures? Is it possible to quantify the contribution provided by accreditation? The direct
performance and competitiveness benefits have been thoroughly discussed in the pages above63.
This analysis deals with the externalities in terms of environmental performance, measured in
reduced CO2 emissions – and the related reduced system costs – deriving from the resulting
energy savings.
In order to quantify these benefits an econometric model has been calculated in line with the
principal indications of the literature. The methodological approach which has been followed is
presented in Fang et al. 201264, in which a panel of 94 countries is examined (both advanced and
less advanced economies) over the period 1981 to 2007 by means of an equation explaining the
dynamics of primary energy consumption according to a series of external variables, with the aim
of understanding and explaining the various structural realities and phases of development of the
countries examined, and which also sets out a dummy variable indicating the period in which
ESCos began their operations65. This model has been adapted to assess specifically the situation in
Italy, with the creation of an equation of the primary energy consumptions (petrol, coal, gas and
renewable energy sources) which is set in relation to population growth, the rate of urbanization,
pro capita GDP development (proxy indicator of the dynamic of economic activity)66. In addition to
these explanatory variables, for the Italian situation, two dummy variables were included for the
purpose of understanding: 1) the presence of ESCos operative in the Italian economic system
since 1983 (the year in which the earliest – albeit sporadic – initiatives in this area were
undertaken, according to the literature67) as well as the more general effects of energy efficiency
introduced over time; 2) the incremental effect on primary energy consumption attributable since
2009 to the development of standards which provided a strong impulse to ESCos, EGE and EnMS
and the influence of Law Decree 102/2014 which introduced a number of obligations of accredited
certification for important energy efficiency activities68.
The estimates in the econometric model for the period 1962-2018, indicate how ESCos, starting
from 1983, helped reduce, on average, primary energy consumption each year by about
1%. The reduction of 1.7%, however, in the decade 2009 to 2018 can be traced to the role played
by the development of normative requirements.
63 Not entering into detail regarding energy certification, the analyses reported in sections 4.1 & 4.2 of this chapter highlight the contribution of TIC capital investments to the performance of businesses which make them. 64 Fang W. S., S. M. Miller and C.C. Yeh (2012), “The effect of ESCOs on energy use”, Energy Policy, 51, pp.558-568, December 2012. 65 For more information on the methodology see the methodology Appendix 66 The historical data on primary energy consumption measured in equivalent petrol tonnes comes from the BP Statistical Review of World Energy. Information on population, urbanization and pro capita GDP is provided by the World Bank. 67 Vine, E. (2005), “An international Survey of the energy service company (ESCO) industry”, Energy Policy,33, which describes the International start of ESCo in a number of countries. 68 For a fuller description of the standards see the methodology Appendix.

58
The overall impact on the situation in Italy is substantially in line with the evidence found in the
literature69. The saving of primary energy consumption, on the basis of these estimates concerning
2018, is about 2.8 million tonnes in terms of petrol equivalent, with an associated equivalent
saving of about 6 million tonnes of CO2 70.
This saving can be translated into monetary value on the basis of the various scenarios of price per
tonne of CO2. Following the same hypotheses of the IMF on the CO2 price already referred to
regarding externalities of environmental certification, this annual value (for 2018) varies between
134 million (at a price of $25 per tonne) and 403 million euro (at a price of 75$ per tonne). 63%
of these figures can be attributed to the evolution of standards and the boost they have given in
the last decade to certification and accreditation schemes (Figure 29).
Figure 29. The externalities of energy certification (ESCos, EGE and EnMS) in Italy: savings related to the reduction of CO2 emissions (millions of €)
Source: Prometeia data
In the light of this information it is evident how choices and indications in the energy field made in
the ambit of the EU Directives, the energy plans and the applicable national legislation, give
strategic importance to combating climate change, with material contributions to attaining goals of
decarburization, alongside the fundamental supplementary input provided by accreditation.
Investing in these initiatives offers a significant opportunity for improving systemic environmental
performance.
69 In Fang et al. (2012) the impact on the panel of 94 countries (advanced and not advanced) is, taking an average of the various specifications adopted, in the region of 3%. 70 The conversion was made using World Bank data for Italy on CO2 intensity per equivalent tonne of petrol of energy consumption.

59
4.4 Occupational health and safety management systems
The importance of safety and health in the workplace has long been at the center of legislative
measures and is sanctioned in the Italian Civil Code and in the Constitution. During the 1990s the
EU issued a series of Directives for harmonizing national legislation, implemented in Italy by
means of Law Decree 626/1994 which introduced many regulatory novelties concerning the
workplace. Subsequently, in 2008, with Law Decree 81, a more systemic approach was unveiled,
setting out objectives, the fulfillment of which involved the participation of all company employees.
The value of the corporate organization was emphasized along with the processes and the roles for
achieving these aims.
Alongside the legal evolution there has been a development of the standards, giving life to the
voluntary management system in accordance with BS OHSAS 18001 for the safety of workers,
replaced in March 2018 by ISO 45001. As well as the legal requirements, firms have felt the need
to possess coded procedures, internationally recognized and externally communicable. Certification
is a tool for enhancing corporate efficiency; it reduces workplace injuries and absences and
responds to growing consumer and investor demands for ever greater social awareness on the part
of businesses.
The evolution of the standards, together with increased private investments and improved
technology which makes many processes, industrial plants and products safer, have all
enormously reduced the number of occupational injuries in Italy over the last ten years. The
frequency of injuries requiring over three days of absence from work has been cut by 40%
(source: EUROSTAT and INAIL). Nevertheless, injuries and mortalities are still a high cost in loss of
work time, medical expenses, potential functional losses and reduction of the quality of life.
A study71 by the European Agency for Safety and Health at Work estimated the cost in Italy of
workplace injuries and diseases to be over 104 billion euro in 2015, equivalent to 6.3% of GDP.
This study examines thoroughly the techniques for quantifying the costs for society, identifying
direct, indirect and intangible costs. These analyses are interesting because they quantify the
impacts and implications on both public and private life. Direct costs include all health costs – state
and private – as well as informal assistance costs. Indirect costs involve loss of income due to
work-days lost, the possible permanent reduction of work capacity, the costs which have to be met
by the employer, costs of administration and insurance, loss of the possibility of contributing to
family life. Intangible costs, meanwhile, regard current and future loss of life quality. The authors
estimate the average cost of an injury in Italy (average for severity of the injury) is about 55,000
euro, with indirect costs amounting to almost 60% of this figure.
This data underscores the benefits that accredited OH&S certification can offer, also in economic
terms. The reduction in terms of costs is an advantage for business (they are internal costs) and
the advantages are also felt by society.
71 European Agency for Safety and Health at Work “The value of occupational safety and health and the societal costs of work-related injuries and diseases” (2015).

60
In line with these considerations, the legislator has provided for a premium for certified businesses
in the form of a reduction of INAIL (the National Institute for Insurance against Accidents at Work)
contributions, partially compensating the organization because its activities reduce social costs.
Reduction of the premium implies that certified businesses have lower rates of injury than
non-certified ones. The 2018 ACCREDIA-INAIL study confirms that, from a counterfactual angle,
with equality of characteristics of sector and size, there is a functioning mechanism which drives
down the frequency and severity of accidents: injuries are down on average by 16% (from 7 to
46% depending on the sector) and in terms of severity the reduction is even more evident,
reaching 40%. This differential of avoided injuries has been used to quantify the sum of savings
which certified organizations make for the nation. The difference in the rate of injuries was applied
to a set of certified businesses in June 2019 (about 6,000 sampled units with 1.5 million
employees). Altogether, application of the OH&S management system resulted in 6,000 fewer
injuries in one year, meaning that, using the techniques described in the previous study, there was
a saving of some 350 million euro. The part of this saving which is retained within the company is
around 16 million, in addition to the reduction of the INAIL premium estimated to be a further 34
million. Of the 350 million euro of reduced costs to society, 50 million remain within the
certified company and 300 are for the general benefit of society.
The results are of appreciable monetary value when compared with the cost burden of 21 million
euro for businesses for obtaining accredited certification. A complete appraisal of the costs
involved should also include those regarding consultancy for obtaining and maintaining
certification, as well as administrative and personnel costs72 for security management and
depreciation of differential investments for fulfillment of the standard. The counterfactual analysis
in chapter 4.2 does not reveal great differences in costs. However, adopting a prudent logic and
estimating that total costs (certification and management of certification) stand at between 40 and
100 million euro, the benefits to society alone are worth between 3 and 7 times the
amount of the private costs. An increased use of health and safety certification could
considerably further reduce the quantity of injuries in Italy, at the same time increasing savings
deriving from lower external costs.
4.5 Food safety
The importance of quality and safety in the food chain has progressively risen in the choices of
consumers and businesses. Growing awareness of the beneficial relationship between food and
health has led to cultural changes in people’s choices, now much more careful not only about
ingredients but also their health benefits and their environmental and social sustainability. In
many areas the variety on offer has increased owing to the product differentiation for meeting the
new demand and new lifestyles (“free from” food, super food, novel food etc.). In this context
quality and recognizability have become distinctive factors of competitive positioning.
72 As the results are different compared with a hypothetical business with the same characteristics, also the costs should be considered in the same way. Therefore it is necessary to consider not the number of people involved in safety but rather the differential attributable to certification.

61
Food safety has also been the object of many legislative measures, especially in Europe. In 1997
the European Commission published a green book on the principles of food safety legislation, and
in the same year Italy implemented the EU regulation on the HACCP system (Hazard Analysis and
Critical Control Point). Subsequently, with EC Regulation 178/2002, which contains the principles
set out in the white paper of 2000, the concept of an integrated supply chain management
approach is introduced; and in 2016, with the “Hygiene package” a harmonized European standard
was issued which encompassed the food production standards and imposed health controls.
The current orientation of the Italian and European food safety policy is oriented to guarantee,
from production to consumption, the safety of food, the well-being of animals, the quality of plant
and vegetable products and respect for the limits set on the use of pollutants and pesticides. The
principles embedded in the regulation include product traceability within the chain, the need for
integrated formal controls and the primary responsibility of sector operators for every product they
make, process, import, place on the market or administer – this last principle means that it is the
operator’s primary duty to guarantee the safety which s/he manages by means of processes of
self-control. The public operator has an equally important role in coordinating all the initiatives,
organizing and supervising official controls, managing alert systems and promoting knowledge
about food among citizens. These activities are carried out in the light of the consideration that
food safety and health properties are a worthwhile public asset which deserve protection.
Theoretically, the set of rules and controls which give substance to it, was created by the necessity
to fill the information gap between the producer and the consumer regarding perceptions of
product healthiness which can be observed only after consumption. Legal requirements, thanks to
the uniformity of rules and controls and to the diffusion of information, reassure consumers with
regard to intrinsic qualities of products, thereby sustaining demand. Regulations have a double
effect: they support market transactions as well as fulfilling objectives of public health protection.
Private investments in quality and safety, although they are a legal obligation, are also a
competitive lever for companies and a useful expense for reducing the potential risks deriving from
product recall and damage to reputation.
There are many activities of the Quality Infrastructure which support these processes: accredited
tests in the agri-food sector, inspections of products and at all operators of the chain as far as
distribution, product certification, voluntary management systems (ISO 22000 – food safety
management system) and voluntary international standards (GAP, BRC, IFS). As we saw in
chapter 4.1, investments in this field ensure a series of benefits for businesses which are far in
excess of the costs involved. These actions also benefit society as a whole, reducing foodborne
diseases and consequently cutting social costs. The public operator makes a vital contribution in
terms of defined and structured actions concerning both objectives and persons involved regarding
the controls and laboratory analyses of raw materials and food, inspections during the production
phase, marketing and administration (as defined above), import controls, quality assurances and
combating fraud.

62
In this context the Quality Infrastructure is involved thanks to the input of public laboratories, for
which accreditation is a legal requirement. They carry out tests both centrally at zooprophylaxis
institutes and at local health and environmental agencies. Accreditation is an important element in
providing impartiality, reliability, comparability of results, enabling more transparent dialogue and
with fewer disputes with private operators as well as greater trustworthiness of decisions regarding
health protection.
For the quantification of the social benefits deriving from this system we started from the cost
estimates attributable to foodborne diseases. Many studies73 have tried to quantify the effects of
these types of illnesses on human health: starting from the data of the cases (real or estimated) of
adverse events due to a single pathogenic agent (Salmonella, Campylobacter, etc.) and according
to their severity of their impact on health, homogeneous indicators were created based on DALYs
(disability adjusted life years): years of life lost owing to contraction of these diseases. Figure 30
shows the years of life lost for every 100,000 people due to foodborne diseases74 in Europe and
elsewhere. Data provided by the Global Health Data exchange.
73 E.g. The Burden of Foodborne Disease in the UK 2018, Food agency standard, March 2020 and the report of the World Health Organization “Estimates of the global burden of foodborne disease” (2015), The Institute for Health Metrics and Evaluation (IHME), Global Health Data Exchange (2017). 74 Enteric infections were used in the database.

63
Figure 30. DALYs per 100,000 people due to foodborne diseases -2017
Source: Global Health Data Exchange (2017)
Owing to more advanced social, environmental and economic levels of development, the incidence
in the West is much lower than in Asia and especially Africa. A comparison of the European
countries characterized by similar life standards is quite mixed, with Italy among the least affected
countries.
In order to examine these differences and to overcome the possible distortions caused by under-
declaration, an econometric model panel was created for 15 EU states covering the years 2001 to
2017, comparing the DALYs from foodborne diseases with some economic and normative factors.

64
Despite the fact that it’s a complex phenomenon the results offer some interesting statistical
relations which explain many of the performance differences among the various countries. The
consequences of outbreaks of foodborne diseases are influenced positively by the level of pro
capita food consumption (greater consumption corresponds to more transmission) and negatively
by consumption habits oriented more toward fruit and vegetables. Public spending in the
agricultural sector and, to a greater extent, the number of workers involved in the food safety
control system, reduce the risk of adverse events.
The above relationship made it possible to simulate what would happen if the available resources
were to fall drastically (by over 90%). In the case of Italy, which has the highest percentage of
dedicated personnel per population, the absence of an enforcement system, all other conditions
being equal, could result in a fourfold rise in DALYs – from 37 to 150. This difference is used as a
yardstick for measuring the contribution which regulations bring to society in terms of greater food
safety. Following the principles set out in the literature it is possible to give an economic value to a
DALY as a synthesis of the social cost created by one year of life lost. This enabled the
quantification of the costs of foodborne diseases in Italy to be around 1.1 billion euro, whilst the
costs which are avoided and therefore the benefits to society of a food safety system are
estimated to be in the region of 3.25 billion euro per year – between 2 and 4 billion depending on
how the costs to society of DALYs are calculated. (Figure 31).
As it is not always possible to identify precisely the effect of each component of the system on this
result, the contribution in terms of social benefits attributable to the Quality Infrastructure has
been estimated proportionally with the respective costs75, considering both the private and the
public components. The total social benefits (reduction of social costs) attributable to TIC
activities (including accredited state laboratories) amount to over 400 million euro per
year, to which private benefits obtained by the performance of the agri-food chain are added. The
analysis highlights how both private and public TIC activities work for the management and
protection of food safety with positive benefits for society.
75 Both private and public costs have been estimated with division between TIC components and non-TIC components. See the Methodological Appendix.
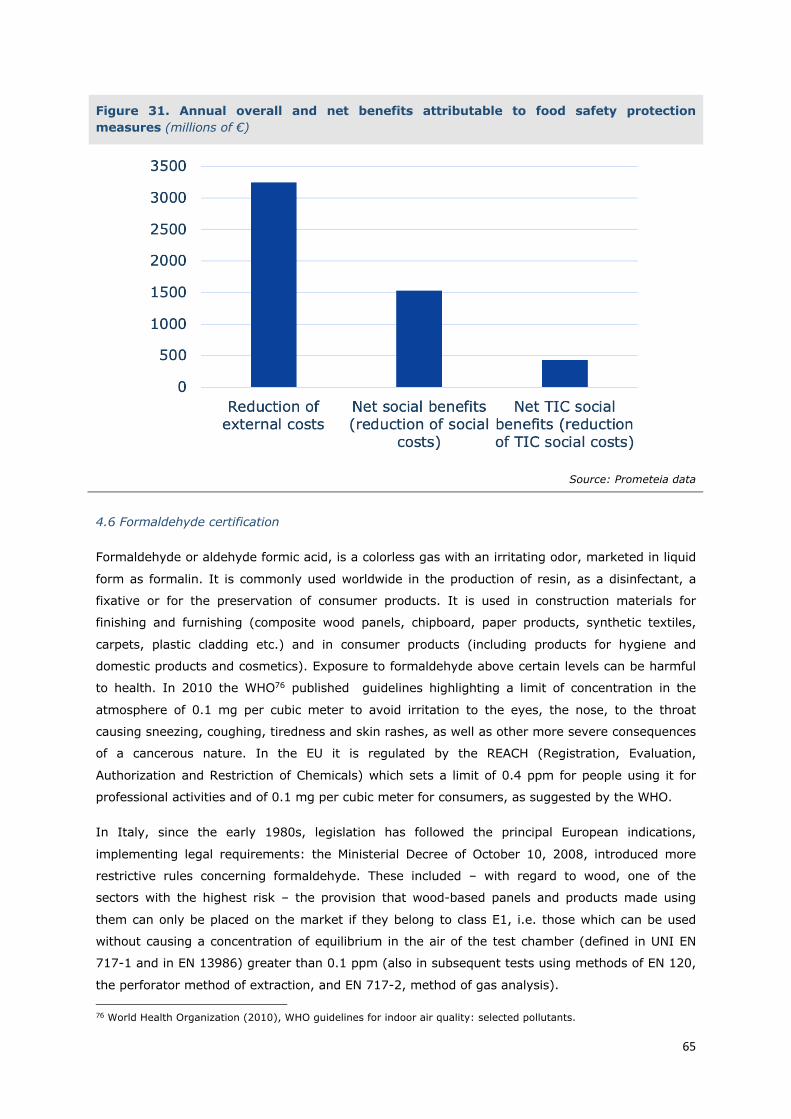
65
Figure 31. Annual overall and net benefits attributable to food safety protection measures (millions of €)
Source: Prometeia data
4.6 Formaldehyde certification
Formaldehyde or aldehyde formic acid, is a colorless gas with an irritating odor, marketed in liquid
form as formalin. It is commonly used worldwide in the production of resin, as a disinfectant, a
fixative or for the preservation of consumer products. It is used in construction materials for
finishing and furnishing (composite wood panels, chipboard, paper products, synthetic textiles,
carpets, plastic cladding etc.) and in consumer products (including products for hygiene and
domestic products and cosmetics). Exposure to formaldehyde above certain levels can be harmful
to health. In 2010 the WHO76 published guidelines highlighting a limit of concentration in the
atmosphere of 0.1 mg per cubic meter to avoid irritation to the eyes, the nose, to the throat
causing sneezing, coughing, tiredness and skin rashes, as well as other more severe consequences
of a cancerous nature. In the EU it is regulated by the REACH (Registration, Evaluation,
Authorization and Restriction of Chemicals) which sets a limit of 0.4 ppm for people using it for
professional activities and of 0.1 mg per cubic meter for consumers, as suggested by the WHO.
In Italy, since the early 1980s, legislation has followed the principal European indications,
implementing legal requirements: the Ministerial Decree of October 10, 2008, introduced more
restrictive rules concerning formaldehyde. These included – with regard to wood, one of the
sectors with the highest risk – the provision that wood-based panels and products made using
them can only be placed on the market if they belong to class E1, i.e. those which can be used
without causing a concentration of equilibrium in the air of the test chamber (defined in UNI EN
717-1 and in EN 13986) greater than 0.1 ppm (also in subsequent tests using methods of EN 120,
the perforator method of extraction, and EN 717-2, method of gas analysis).
76 World Health Organization (2010), WHO guidelines for indoor air quality: selected pollutants.

66
The issuance of certifications by accredited laboratories is an attestation of fulfillment of the
applicable quality standards. In addition, from January 1, 2016, EU Regulation 491/2015 came into
force, reclassifying formaldehyde no longer as a dangerous chemical agent (category 2) but as a
cancerous chemical agent (category B).
In the last 20 years there have been many attempts to quantify in economic terms the effects of
the regulation on formaldehyde through cost-benefit analyses, however, as reported by the OECD
(2018)77, also due to limited data, there are still not enough complete studies assessing its impact
on health, with regard both to workers exposed to it and to consumers or products containing it78.
Moreover there are still no studies which include the entire spectrum of pathologies traceable to
excessive exposition and which permit a comparison among the various countries, also on the
basis of different sector specializations. These problems of analysis also regard Italy where there is
only partial information available.
Looking at data from the Global Health Data Exchange (GHDx), it is possible to obtain figures for
DALYs (Disability-Adjusted Life Years)79 relating to occupational exposure to formaldehyde. The
data shows that after the Ministerial Decree of October 10, 2008, there was a substantial decline
in annual DALYs, with about 100 DALYs in 2006 and 90 in 2010 (the subsequent data is for
2016 and the number of DALYs is just a little below 90). This drop can be attributed to
certifications of compliance with legal requirements. Using the principal indications of the literature
to proxy the DALY value, this reduction corresponds to a lower healthcare cost of about 480
thousand euro per year. This figure, as stated previously, only partially covers the
consequences of the effects of regulation for limiting the consequences of exposure to
formaldehyde.
4.7 Some European Directives
Over the last 20 years many Directives have been issued regulating the standards and
characteristics of products in the EU, making them uniform among member states and helping in
the creation of the European single market for many goods and services. In 2008, with the entry
into force of the “new legislative framework” this process received a further impulse, strengthening
the control systems and the role of notified bodies and so giving importance to accreditation.
The compliance of products with EU dispositions can be certified in different ways, both directly by
the producer and through third parties operating certification. These bodies, designated on a
national basis and notified to the other EU states, shall meet the requirements of the standards
UNI EN ISO 17020 or 17065 for accreditation.
The introduction of conformity assessments together with the creation of a European surveillance
system (RAPEX) have the purpose of promoting the free movement of goods and of integrating
markets, as well as the assurance for all EU citizens of the high quality level, safety and
healthiness of products.
77 For an overview of the literature see OECD (2018), Economic evaluation in formaldehyde regulation. 78 Of the studies available we cite US EPA (2016), Formaldehyde emission standards for composite wood products and TNO/RPA (2013), Analysis of the most appropriate risk management option for formaldehyde. 79 For a discussion of DALYs see the paragraph on safety externalities.

67
The topics of environmental and health protection and the safety of products have been at the
center of legislation issued in many EU Directives. Amongst these there are those on lifts,
industrial machinery, pressure appliances, personal protective equipment and medical devices. In
all the areas the regulations and standards have also had objectives concerning public order.
In this context of mandatory regulations and standards, the role of the Quality Infrastructure is
mainly one of enforcement, of greater respect for common rules. Therefore, the contribution to
general well-being is delimited on the basis of the differential that the role ensures in terms of
compliance with the standard for the improvement of human safety and health.
In many of the cases mentioned previously, however, the numerous studies and supporting
analyses of the Directives have succeeded in measuring their social benefits only in terms of
quality, without managing to measure them with precision. In the field of product safety and
conditions of work it is not easy to separate the impact of different factors because it requires a
very broad spread of information. In the case of legislation of personal protective equipment, in
force since the first version in 1989, all the stakeholders agree that the impact was considerable
both in terms of the creation of a unified market and for the role played in the reduction of injuries
in Europe80; however a precise quantification has never been undertaken. In the study evaluating
the lifts Directive81, over 90% of the operators believe that the level of safety is high and that the
normative requirement has raised it, and they also agree that the process of conformity
assessment was a major contributory factor to these results.
Studies performed reveal three legislative ambits in which it is possible to specify some
quantitative elements and the evidence produced has been analyzed and applied to the situation in
Italy.
A report on the application of the Machinery Directive82 of 2018 shows how both private and
social benefits are three times greater than the costs for businesses which adopt the requirements
of the regulations. On a Europe-wide level, the social benefits of better health and fewer
injuries are estimated to be around 400 million euro per year – about 68 million for Italy
annually, whilst the amount attributable to the activities of notified bodies is estimated to
be around 17 million euro83.
The evaluation84 of the approved proposal to lower the limits of lead in toys shows how a reduction
in the presence of this agent can cause benefits – in both health and in terms of IQ of children –
which last throughout their life. The benefits amount to about 1,000 euro per child in the 0 to 3
age group, and the annual saving in costs is 22 million, with a contribution of the TIC
component of about 4.5 million euro85.
80 Impact assessment accompanying the document proposal for a regulation of the European parliament and of the council on personal protective equipment {com(2014) 186 final} {swd(2014) 119 final}. 81 Evaluation of Directive 95/16/EC on the approximation of the laws relating to lifts, Final Report November 2017 Ref. Ares(2017)6015269 - 08/12/2017. 82 COMMISSION STAFF WORKING DOCUMENT Evaluation of the Machinery Directive {SWD(2018) 161 final} Evaluation of Directive 2006/42/EC on Machinery. 83 The quota attributed to TIC (25%) is proportional to their impact on the total costs for fulfillment of the Directive. 84 Impact assessment study on the health costs due to children’s exposure to lead via toys and on the benefits resulting from reducing such exposure 2012. 85 An incidence of 20% is estimated.

68
The analysis86 of the Directive on limits to noise emissions by outdoor equipment shows how the
benefits of the Directive for the environment and for health are worth about 83 million euro
per year in Europe – 4 times more than the private costs sustained by firms. For Italy, this figure
is estimated at 10 million p.a., with a TIC component of 2.5 million87.
It’s interesting to note that in the three cases examined, the estimated benefits are, on
average, 3 times higher than the costs sustained by firms, providing further supporting
evidence for the policy adopted at EU level (Table 5).
Table 5. Social benefits (reduction of external costs) p.a. in millions of euro and relationship with costs for businesses
Social benefits
Totals
Social benefits
TIC
Relationship
between social
benefits and
costs for
businesses
Machines Directive 68 17 3.2
Toy safety Directive (reduction of
lead content) 23 5 3.9
Noise Directive 10 3 3.8
Source: Data from documents of the European Commission
86 Supporting study for an evaluation and impact assessment of Directive 2000/14/EC on noise emission by outdoor equipment Impact Assessment Final Report. 87 The quota attributed to TIC (25%) is proportional to their impact on the total costs for fulfillment of the Directive.

69
Bibliography
Abadie, A. (2005). Semiparametric difference-in-differences estimators. Review of Economic
Studies. 72 (1), 1–19.
AFNOR. (2009). Impact Économique de la Normalisation. Paris: AFNOR.
Arena, M., Azzone, G. & Platti, M., (2012). ISO 14001: motivations and benefits in the Italian
metal industry. International Journal of Engineering and Management Research. 4 (41), 1-9.
Blind, K., & Jungmittag, A. (2008). The impact of patents and standards on macroeconomic
growth: a panel approach covering four countries and 12 sectors. Journal of Productivity Analysis,
29, 51-60.
Blind, K., Mangelsdorf, A., Niebel, C. & Ramel, F. (2018). Standards in the global value chains of
the European Single Market, Review of International Political Economy, 25(1), 28-48.
Boiral, O., Guillaumie, L., Heras-Saizarbitoria, I. & Tayo Tene, C.V. (2017). Adoption and
Outcomes of ISO 14001: A Systematic Review. International Journal of Management Reviews, 20,
411-432.
CESQA, Accredia (2018). Benefici, costi e prospettive del sistema di gestione ambientale: Indagine
presso le organizzazioni italiane certificate ISO 14001. Edizione 2018. (Benefits, costs and
prospective of the environmental management system: study of Italian organizations certified to
ISO 14001. 2018 edition.)
Choudhary, M. A., Temple, P. & Zhao, L. (2011). Taking the measure of things: the role of
measurement in EU trade. Empirica. 40(1).
Corrado, C., Haskel, J., Jona-Lasinio, C. & Iommi, M. (2016). Intangible investment in the Eu and
US before and since the Great Recession and its contribution to productivity growth, in Investment
and Investment Finance in Europe, ch.2, European Investment Bank Report, November 2016.
Curkovic, S. & Sroufe, R. (2011). Using ISO 14001 to promote a sustainable supply chain strategy.
Business Strategy and the Environment, 20, 71-93.
DIN GERMAN INSTITUTE FOR STANDARDIZATION (2000). Economic Benefits of Standardization.
Summary of Results. Final Report and Practical Examples, Beuth Verlag, Berlin, Vienne, Zurich.
Djekic, I., Rajkovic, A., Tomic, N., Smigic, N. & Radovanovic, R. (2014). Environmental
management effects in certified Serbian food companies. Journal of Cleaner Production, 76, 196-
199.
European Agency for Safety and Health at Work, (2015). The value of occupational safety and
health and the societal costs of work-related injuries and diseases. European Risk Observatory.
European Commission (2012). Impact assessment study on the health costs due to children’s
exposure to lead via toys and on the benefits resulting from reducing such exposure. European
Commission, DG Enterprise and Industry.

70
European Commission (2014). Impact assessment accompanying the document proposal for a
regulation of the European parliament and of the council on personal protective equipment.
Commission Staff Working Document.
European Commission (2017). Evaluation of Directive 95/16/EC on the approximation of the laws
relating to lifts. Final Report November 2017.
European Commission (2018). Evaluation of the Machinery Directive. Commission Staff Working
Document.
European Commission (2018). Supporting study for an evaluation and impact assessment of
Directive 2000/14/EC on noise emission by outdoor equipment: Impact Assessment Final Report.
European Commission, Directorate-General for Internal Market, Industry, Entrepreneurship and
SMEs.
Fang, W. S., Miller, S. M. & Yeh, C.C. (2012). The effect of ESCos on energy use. Energy Policy,
51, 558-568.
Food Agency Standard (2020). The Burden of Foodborne Disease in the UK 2018. Research Report,
Marzo 2020.
Haimowitz, J. & Warren, J. (2007). The Economic Value of Standardization. Report Produced by
The Conference Board of Canada for the Standards Council of Canada, July.
Hasan, M. & Chan, C. K. (2014). ISO 14000 and Its Perceived Impact on Corporate Performance.
Business and Management Horizons, 2, 11-18.
Hogan, O., Sheehny, C. & Jayasuriya, R. (2015). The Economic Contribution of Standards to the
UK Economy: 2015. British Standards Institution.
Imai, K., Kim, I. S., & Wang, E. (2019). Matching Methods for Causal Inference with Time-Series
Cross-Sectional Data. Working Paper, Princeton University.
IMF (2019). Fiscal Policy for Paris climate strategies – from principle to practice, IMF Policy Paper.
Kellermann, M. (2019). Ensuring Quality to Gain Access to Global Markets: A Reform Toolkit
(English). Washington, D.C.: World Bank Group.
Morrow, D. & Rondinelli, D. (2002). Adopting Corporate Environmental Management Systems:
Motivations and Results of ISO 14001 and EMAS Certification. European Management Journal, 20,
159-171.
Nishitani, K., Kaneko, S., Fujii, H. & Komatsu, S. (2012). Are firms' voluntary environmental
management activities beneficial for the environment and business? An empirical study focusing
on Japanese manufacturing firms. Journal of Environmental Management, 105, 121-130.
OECD (2018). Economic evaluation in formaldehyde regulation. OECD Environment Working
Papers.
Osservatorio Accredia-ISNOVA (2017). Le certificazioni per l’efficienza energetica (Energy
efficiency certifications).

71
panel approach covering four countries and 12 sectors. Journal of Productivity Analysis, 29(1), 51-
60.
Potoski, M. & Prakash, A. (2013). Do voluntary programs reduce pollution? Examining ISO 14001's
effectiveness across countries. Policy Studies Journal, 41, 273-294.
Rosenbaum, P. R., Rubin, D. B. (1983). The Central Role of the Propensity Score in Observational
Studies for Causal Effects. Biometrika. 70 (1), 41–55.
Rubin, D. B. (2006). Matched Sampling for Causal Effects. Cambridge: Cambridge University
Press.
Smith, L. G., Kirk, G. J. D., Jones, P. J. & Williams, A. G. (2019). The greenhouse gas impacts of
converting food production in England and Wales to organic methods. Nature communications, 10,
4641.
Stokes, F., Dixon, H., Generosa, A. & Nana, G. (2011). The Economic Benefits of Standards to New
Zealand. Report for The Standards Council of New Zealand and the Building Research Association
of New Zealand, August.
Swann, P., Temple, P., & Shurmer, M. (1996). Standard and trade performance: The UK
experience. Economic Journal, 106(438), 1297-1313.
Testa, F., Rizzi, F., Daddi, T., Gusmerotti, N. M., Frey, M. and Iraldo, F. (2014). EMAS and ISO
14001: the differences in effectively improving environmental performance. Journal of Cleaner
Production, 68, 165-173.
TNO/RPA (2013), Analysis of the most appropriate risk management option for formaldehyde,
Formacare, Brussels.
UK Department of Trade and Industry (2005). The Empirical Economics of Standards. DTI
Economics Paper. No. 12, June. London: DTI.
US EPA (2016). Formaldheyde emission standards for composite wood products.
Vine, E. (2005). An international Survey of the energy service company (ESCo) industry. Energy
Policy, 33(5), 691-704.
World Health Organization (2010). WHO guidelines for indoor air quality: selected pollutants.
World Health Organization (2015). Estimates of the global burden of foodborne disease.

72
Glossary
Informative asymmetries: in microeconomics an informative asymmetry can be defined as a
condition in which an information is not uniformly shared between individuals belonging to the
same economic process. A situation is created in which determined persons enjoy a position of
advantage over others because they have more information, putting them in a privileged position.
Short-term activities in % of short-term liabilities: value of short-term activities for units of
short-term liabilities (also known as Current Ratio), measuring the capacity to cover the liability
with short-term availability of the company. It signals the conditions of equilibrium only if it
exceeds 100.
Cash flow in % of production: business generated cash flow expressed in percentage of
production; the higher they are, the healthier the company. Formula: (net profit + depreciation
and provisioning) in percentage of production.
External costs: the external cost is a monetary evaluation of a physical effect (externality),
presupposing the selection of a value to assign to human life, quality of the air, health. The
economic literature has developed a series of techniques for reaching the goals and the
evaluations of this study are based on them.
Costs in percentage of production: measures the percentage influence of total operative costs
on production.
Cost of labor in percentage of value added: overall cost of labor necessary for production as a
percentage of value added; the lower it is the greater the labor efficiency factor.
DALYs (Disability-adjusted life year): combines the number of years lived with a disability and
those lost due to early death, indicating the impact of diseases and injuries on the loss of health
years.
Elasticity: in economics measures the reactivity of a variable to changes in another variable. The
grade of elasticity is given by the value of the relationship between the relative variation (or
percentage) of the variable of which it is intended to measure the elasticity and the relative
variation (or percentage) of the variable which caused the initial variation.
Externality: a non-intentional effect deriving from actions which impact production or
consumption by a second party without any direct transaction or payment between the two. The
effects of externalities can be either positive or negative; a negative externality may be the
emission of an atmospheric pollutant which also negatively impacts the activities of other
organizations, or it may modify the productivity of people taking part in the production process.
Function of production: in economics it expresses the tie between the quantities of the single
factors of production used and the quantity of product obtained. It is therefore the relationship
between the maximum output quantity obtainable and the input quantity necessary for achieving
it.

73
Storage days: the days of storage of materials and products. The more they are the grater the
needs for working capital.
Fixed capital intensity: this measures the use of fixed capital per product unit (in material and
immaterial goods). Formula: net plants and equipment as a percentage of production.
Operative capital intensity: this measures the need of total capital per product unit with
reference only to goods destined for production activities. Formula: net plants and equipment +
storage + credit / production.
Gross operative profit (% prod.): this measures the capacity to cover by means of revenue the
variable costs of production: Formula: net revenue + capitalized internal production + changes in
stocks of finished products – acquisition of raw materials and goods + changes in stocks of raw
materials – costs per service and enjoyment of third party goods – cost of labor + other net
revenue / production value *100.
Perpetual Inventory Method (PIM): for obtaining an estimate of the existing stock capital
(difficult to get directly) on the basis of data relating to investment fluxes.
Financial burdens in % of the operative profit margin: this measures the capacity of the
operative result to cover interest and other financial burdens. It’s a solvency indicator which
improves correspondingly as the operative profit margin absorbed by financial burdens becomes
lower.
Production per employee: production value per employee measuring the labor performance
factor.
Propensity Score Matching (PSM): empirical method used for estimating the causal impact on
people of a non-random assignment of a treatment. It consists of the construction of an artificial
control set through the assignment to each individual treated of one or more non-treated
individuals with similar characteristics.
Ordinal logistic regression: in statistics it’s a type of analysis of regression used to predict a
categorical or ordinal variable given one or more independent variables.
ROI (Return on Investment): this measures the operative profitability of capital invested in
characteristic company activities. Formula: net operative result / (net plants and equipment +
storage area + credits).
Net working investment capital turnover: this measures average production against 1 euro
invested in productive capital using the average quantity in the course of a year). Formula:
production value / (net plants and equipment + storage area + commercial credits). It measures
capital investment efficiency on the part of the company which increases proportionally with the
turnover rate.
Tonnes of CO2 equivalent: the CO2 tonnage is a measurement for weighing GHG emissions with
different climate changing effects. For example, one tonne of methane with a climate changing
potential 21 times greater with respect to the CO2 is calculated as 21 tonnes of CO2 equivalent. The

74
climate changing properties of the various gases were defined by the Intergovernmental Panel on
Climate Change (IPCC). (Source: Ministry of the Environment).
Equivalent tonnes of petrol: the quantity of energy issued by the combustion of one tonne of
crude oil.
Value added: this measures the capacity to generate value from activity carried out (related
positively to the quantity of produced work and the level of margins which the company manages
to obtain recognition for). Formula: (net revenue + capitalized internal production + changes in
stocks of finished products + net revenue – purchases + changes in stocks of raw materials –
costs per service and enjoyment of third party goods) / production value *100.
Categorical variable: in an econometric estimate it is a variable whose set of possible values
consists of a finite category number (2 or more). It is possible to use it for describing both
qualitativo and quantitative phenomena. The characteristics are usually ordered and tied to
counting the number of events which occurred in a given interval: for example, v. c. ‘number of
children’ can be sub-divided into the categories {0,1,2,3,4,5 or more}.
Variable Dummy or binary variable: in an econometric estimate it is a binary variable with a
value of 0 or 1, depending on the fulfillment or not of a given condition. It is included in a
regression model for taking account of the presence (1) or absence (0) of a determined attribute
to the scope of measuring the effect of the variable on the average value of the dependent
variable.

75