Embed Size (px)
Citation preview

Taarifa
TaarifaImproving Public Service Provision in the Devel-oping World Through a Crowd-sourced LocationBased Reporting Application
by Mark Iliffe1, Giuseppe Sollazzo2, Jeremy Morley1, andRobert Houghton1
1: University of Nottingham (UK); 2: St. George’s Uni-versity of London (UK)[email protected]
Abstract
Public service provision in the developing world ischallenged by a lack of coherence and consistencyin the amount of resources local authorities have intheir endowment. Especially where non-planned ur-ban settlements (e.g. slums) are present, the frequentand constant change of the urban environment posesbig challenges to the effective delivery of services. Inthis paper we report on our experiences with Taarifa:a location-based application built through commu-nity development that allows community reportingand managing of local issues.
Keywords: Location-based application, commu-nity development, crowd-sourcing.
Introduction
The availability of geographic data in the developingworld is improving with the advent of communitymapping projects like Map Kibera [1, 2] and throughorganisations like Humanitarian Open Street MapTeam (H.O.T). Previously a large barrier for NGOs,governments and business in providing services indeveloping world, the lack of governmental andnon-governmental data is becoming an issue of thepast and with this barrier rapidly dissolving furtherquestions are arising, such as: now we have the data,what do we do next?
The Taarifa project aims to address this question,with respect to the monitoring of public service pro-vision. Taarifa as a software platform allows for thecommunity reporting of problems, from health towaste issues, through a mobile phone interface usingSMS or a HTML5 client. Once reports are collectedthey are entered into a workflow allowing those incharge of providing services to monitor, triage andact upon reports.
Taarifa is currently unique in this field fromits initial design, inception and deployment. It
was originally conceived at the Random Hacks ofKindness (RHOK) London Water Hackathon. AHackathon is an organised meeting of developerswho team up to code on a specific topic or to addressa specific problem. Hackathon are very popular inthe developers community. Both private and pub-lic organisations often set up hackathons to get somefresh hands working on certain issues they are fac-ing. During the RHOK hackathon a group of coredevelopers ’hacked’ a solution in 48 hours. Aftercontinued development and design Taarifa was firstdeployed in cooperation with the Ugandan Ministryof Local Government in March 2012, followed by adeployment with the Zimbabwean Government inApril 2012 facilitated by the World Bank.
In this paper we present a narrative and casestudy of the Taarifa project from its inception, design,refinement and deployment. We also discuss the fu-ture directions Taarifa might take both as a commu-nity software project and as an organisation. Theglobal aim is to facilitate a discussion on how crowd-sourced geospatial data and open source platformscan combine to improve public and private servicedelivery in developing nations.
Related Work
Most related work considering the emergent phe-nomena of crisis mapping are case studies of specificcrises, the Haiti Earthquake [3], terrorist attacks [4],methodologies for crisis situation triage [5]. Though,in context not all methodologies of crisis relief arewholly focused on external response as [6] demon-strates. These instances of citizens generating reportsfall under the banner of crowdsourcing. Here [7]specifically looks at providing situational awareness;how a visual ’group map’ of all the reports is use-ful as errors can be made. The crowd sourcing ofinformation has inherent dangers of trusting the in-formation supplied, as [8] demonstrates with respectto potential crisis situations.
Currently there are two themes missing from theliterature; A study of how the reports are being usedto aid decisions and an understanding of areas in aconstant state of crisis. These areas, like slums andinformal developments do not have an event like anearthquake or a tsunami to illustrate the plight. Thisis combined by [9] review of the Map Kibera project.
Almost anecdotal evidence [10, 11] exists to howthe crowd sourced data is used, but nothing to the
OSGEO Journal Volume 13 Page 34 of 114

Taarifa
experiences of using it, within the field of crisis map-ping. However, numerous papers cover the experi-ences of the crowd and their validation in citizen sci-ence, like ecology [12]. A possible output and def-inite gap in the research would be an ethnographicstudy of when a crisis occurs, observing and report-ing the ’value chain’ and how the data is used. Anoteworthy omission from this section of the reviewis ICT4D field of study. While this is a rapidly devel-oping field the research seems to be based more onthe social science fringe compared to the more soft-ware/algorithm development side, though the gapis being bridged.
The effect of social media, indicates that on a so-cial level it aids the transition to recovery throughblogs [13, 14] and as a general community platformto generate maps [10]
Taarifa’s inception at the RHOKHackathon
The London Random Hacks of Kindness Hackathon(RHoK) occurred on Friday 21st of October, 2011,lasting for 48 hours in the facilities of University Col-lege London. Randomly assembled groups of coderswith interests on humanitarian subjects and matterexperts joined forces to work together with the aimof producing technology demonstrators and designsto solve problems related to water.
Why A Hackathon?
The underlying idea of any hackathon, and in partic-ular of the RHOK Hackathon, is that by co-locatingintelligent, innovative and driven computer softwaredevelopers and field experts, facilitating a fast-pacedproduction session lasting no more than a couple ofdays, can lead to worthwhile innovation. One con-dition is that all software produced has to be opensource, and this naturally offers opportunity of fur-ther development by different teams in the future.There are many kinds of hackathons: from those des-tined to the very young, to corporate-run hackathonsin which participants are selected and paid a dailyfee. Many question have arisen about the effective-ness of hackathons in producing something reallyuseful, especially generalist hacking events. How-ever, we argue that dedicated hackathons like theRHOK are a practical and effective way of develop-ing products, mostly due to their very narrow target.They can be seen as "sprints" sessions as formalisedby the Agile project management theory [15].
A story telling of the event
The event started with an introduction by the organ-isers framing the exercise with problem statementsand presentations by experts wanting to solve differ-ent problems. Some of these people spoke in per-son at the event, while others via teleconference. Theproblems presented all came form the RHoK websiteand ranged from water trading platforms to publicservice infrastructures and community mapping.
Figure 1: London WaterHackathon 2011
Taarifa started to take shape of a platform to sup-port citizen interaction around public services forlesser developed countries.
A team was assembled and collectively startedto set up whiteboards and tools to construct theintended processes and a design specification forworkflows through the potential system. The dis-cussion focussed on how triaging of reports wouldwork. At the time Taarifa’s intended customer wasmeant to come from a ministry level, potentiallyworking around sanitation or waste issues.
Aiming for rapid development of the platformwe decided to fork the Ushahidi platform (Okolloh2009). Ushahidi is a platform/CMS designed forthe crowdsourced reporting of issues, its inceptionwas due to the Kenyan election crisis of 2008, sincehas been used to report conflicts like civil wars butalso the recent ‘occupy’ movements. Technologicallyit’s foundations are built in PHP using the Kohanaframework. Here we hit our first issue; none of ourdevelopers had worked with Kohana before. Wesplit into two groups, one figuring out Kohana, theother designing workflow.
It became apparent that experience in the righttools was needed with some developers wishing tocontribute. However, some were not able to oper-ate at the level as some developers, which is typ-
OSGEO Journal Volume 13 Page 35 of 114
Taarifa
ical of hackathons where a large team works to-gether. As this progressed, these developers filledother roles, testing and aiding the main thrust in-stead of contributing code. However, their contribu-tion was as valuable in real terms as the code gen-erated. Installing Ushahidi also proved problem-atic. Issues with mod_rewrite and other PHP ex-tensions were experienced, but were eventually re-solved. These potentially could have been avoidedthrough enhanced documentation. Equipment at thehackathon was problematic: the team didn’t have ac-cess to hosted server, hence one of the developers’personal servers was used.
Once the workflow was sketched out we pre-sented back to the other team of developers. Theyhad conducted a study into the Ushahidi pluginecosystem. Collectively we integrated the ‘action-able’ and ‘simple groups’ plugins. Actionable wasadapted to ‘action’ reports, and place them in thetriage system. Simple groups was used to curate ateam of ‘fixers’. Fixers was used generically as thepeople fixing the reported problems, however thedynamic of how this would be fully implementedwasn’t considered at this stage.
Figure 2: Workflow Of Reports Through The TaarifaSystem
Inheriting the interface from Ushahidi meant theload on the developers was focused towards theback-end with tasks and problems being receivedand triaged. The workflow started to come together,based on the idea of community reports being veri-fied, then put on triage, assigned to a team of fixersand finally reaching conclusion or, if not appropriate,directed to dispute resolution. The visual user inter-face, organised in tabs to accommodate these func-tions, was integrated into the system. As reportswere able to be triaged we focused on expanding
the reporting mechanism. Ushahidi supports report-ing through a web-based form, twitter and throughits mobile applications (iOS, Android, Java and Win-dows Mobile 6). It can interface with SMS gatewayslike FrontlineSMS. The team intended to use SMSdue to the ubiquitous nature of feature phones inAfrica that realistically can only use SMS as a formof reporting. Using SMS presented problems of geo-locating the messages.
The OGC [16] standard on GeoSMS was unfortu-nately unavailable at the time, it is possible for themobile phone networks to triangulate the positionof the sender and supply a latitude and longitudehowever this isn’t practical over a 48 hour hackathonnotwithstanding the ethical and privacy concerns.
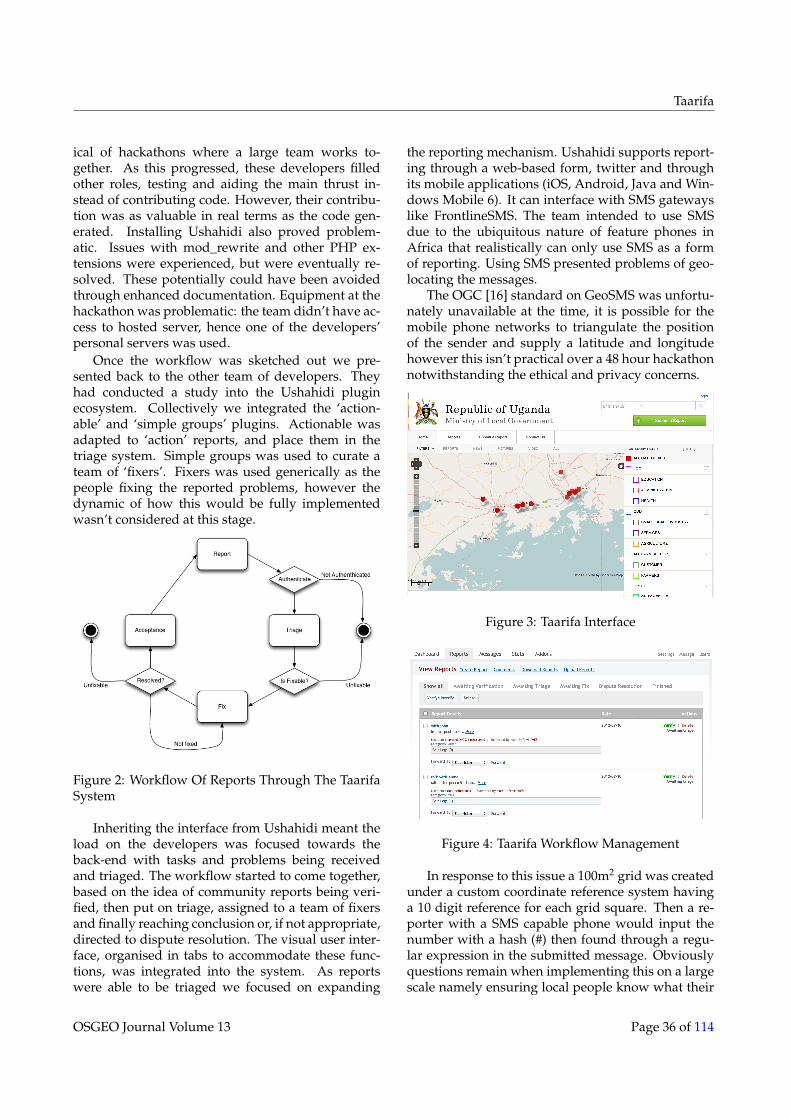
Figure 3: Taarifa Interface
Figure 4: Taarifa Workflow Management
In response to this issue a 100m2 grid was createdunder a custom coordinate reference system havinga 10 digit reference for each grid square. Then a re-porter with a SMS capable phone would input thenumber with a hash (#) then found through a regu-lar expression in the submitted message. Obviouslyquestions remain when implementing this on a largescale namely ensuring local people know what their
OSGEO Journal Volume 13 Page 36 of 114

Taarifa
code is and creating a reference system that con-forms to the human geography not just the physi-cal. This was accomplished on the first day of thehackathon, however we worked through the night,resting for four hours. A global team of friends car-ried on completing an SMS gateway. What remainedat the hackathon around bug-fixing, tidying up codestarting documentation and choosing a name. Oneteam member searched the word “Reporting” into atranslation software for the Swahili language. ’Taar-ifa’ was the result.
Discussion about the results of thehackathon
The Taarifa group at the hackathon was fortunate tobe successful and be voted winners of the Londonhackathon. It was decided that the project was an in-teresting effort to address real problem, and shouldbe kept alive. The team had worked and synchro-nised well. Administratively an online mailing listwas created, communication through instant mes-saging and logos and branding. The team assessedthat the integration of the mobile applications waskey, though development was dispersed over theAndroid, iOS and Windows Mobile platforms. A de-cision was made to focus on a web-based HTML5 ap-plication. Using the offline functionality of HTML5and CSS3 a mobile application was quickly proto-typed.
Deployment: Uganda
The Africa Urban and Water (AFTUW) sector of theWorld Bank approached the Taarifa project about apilot with the Ugandan Ministry of Local Govern-ment (MoLG). The ministry wished to monitor localgovernment projects based around improving com-munity cohesion, public services and enterprise. Apilot in four districts was decided upon as part of the"Improving Systems for the Urban Poor" of AFTUWsupporting two ministry led programs CommunityDriven Development (CDD) and Local GovernmentManagement and Service Delivery (LGMSD).
CDD is a match funding program where com-munity members form groups around themes of en-trepreneurship, farming and education. Funding isgiven in ratios of 2-5:1 and are aimed at directly im-proving the development of communities. LGMSDis a government program aimed at building capac-ity within government. For instance the building ofcouncil facilities and schools.
Figure 5: Reporting.
Figure 5 shows the reporting of a local govern-ment building in construction by civil servants. Tra-ditionally the system of CDD and LGMSD was paperbased. These forms were then posted from the areasto central government in Kampala. This drawbacks,first was the postal service of Uganda with idiosyn-cratic delivery. Second was the load placed uponthe reporters. The complex nature of the questionsposed by CDD and LGMSD posed difficulty to civilservants, who may not have the appropriate equip-ment to submit forms.
Civil servants reporting to these programs wereselected for training, with AFTUW supplying An-droid based Hauwei ‘Gaga’ mobile phones - under$100 - as the hardware platform. Initially the customforms of Taarifa worked well, with the participantsable to submit information. However, when ven-turing into more remote districts the functionality ofTaarifa inhibited reporting, specifically offline forms.While reporting offline is possible, it isn’t possibleto change forms without connectivity. This require-ment since entered the Github repository; the plat-form used for the project management of the Taarifaplatform.
Improvements were identified by the pilot andwere fed back into the Taarifa community. Howeverthe pilot in the four districts was deemed successfulby MoLG and AFTUW, consequently the platformwas rolled out to the 111 districts of Uganda. Cur-rently the system is directly administered by MoLG,however they are activity seeking a devolution ofcontrol to the local districts. This in itself will bea large undertaking and one which potentially re-quires more structure than the Taarifa project in itscurrent form can provide.
OSGEO Journal Volume 13 Page 37 of 114

Taarifa
Evaluation and comparison of com-munity software contribution
Given the way Taarifa has been developed, a ques-tion emerges as to how to best evaluate the commu-nity effort behind this development. To address thisquestion, we need to inspect the contributions madeto the open source project and try and make sense ofthese. It is important to remember that Taarifa wasborn as a fork of the Ushahidi project, and originallycalled Taarifa Web. This is the version in use in mostdeployments. A newer version, called Djangorifa, isa complete rewrite from scratch of Taarifa, using theDjango framework in order to achieve a lightweightdistribution. The rewrite also aims at freeing Taarifafrom functionalities and features which were of useonly to the goals for which Ushahidi was developed.In this section we will present a comparison of thesethree projects based on code contribution statistics.
Data collection methodology
All of the three projects, Ushahidi, Taarifa Web,and Djangorifa, are community open source project.They all use the same set of online tools and ser-vices in order to allow collaborationg: GitHub, anonline code repository based on the git protocol.The protocol allows us to collect data which can beused to extract statistics. Using the git log andgit shortlog commands, we were able to identifythe number of commits, files changed, lines insertand lines deleted for each contributor. From this datawe extracted information like the number of contrib-utors, the lines committed, the number of commits,and calculated average contribution, standard devi-ation, and the relative quintiles. This methodologyhas its limitations, intrinsic to the type of projectswe are discussing. For example, it must be remem-bered that the Taarifa Web project comes from a forkof Ushahidi, hereby sharing much of the codebase; inthis analysis, we focus on the code contributed afterthe fork because we can then see how much code hasbeen genuinely added. Also, we use quintiles anal-ysis because we are talking about different amountsof code contributed: given that Taarifa embeds muchof the Ushahidi codebase, having a quintiles analysison the differential contribution allows us to comparethe community involvement and interactions. TheDjangorifa project was born as a single-person effortand is a relatively smaller project. Still, we add it forcompletenes and comparison. Although we cannotclaim this is a complete analysis, it is helpful to iden-
tify trends and customs in community contributions.Data are summarised in Table 1.
Table 1: Summary of project statistics.Param Ushahidi Taarifa
WebDjangorifa
contributors 71 12 (83) 5commits 4017 667
(4684)55
branches 8 6 4lines of code >220,000 >40,000
(260,000)>35,000
average com-mits
56.58 7.53 11
std. dev. com-mits
154.66 5.06 15.35
average LOCinserted
13401.64 2935.92 5927.4
std. dev. LOCinserted
37496.32 9966.27 10553.19
issues (open) 240 21 11issues (closed) 779 29 4
Ushahidi
A total of 71 developers have contributed to thisproject, which is a medium-large software project,also highlighted by the high number of lines of code(in excess of 240,000) and commits (over 4,000). Withsuch a great number of contributors, we can see verylarge variations in their contributions. Despite thelargest single contributor having committed almost800 times with over 40,000 lines of code (LOC), theaverage is about 57 commits per contributor, witha very high standard deviation of 154.66; the sameapplies to the LOC, where we see an average of13401.64 and a standard deviation of 37496.32. Thisshows that the contributions have been varied acrossthe community, although we have a strong core ofdevelopers who have contributed a huge amount ofLOC. An interesting analysis can be that consider-ing the quintiles. For example, where commits areconcerned, figure 6 shows how many contributorsfall in each quintile. The quintile range is definedin the caption of the figure. It is evident that thereis a relatively high amount of people only contribut-ing a small number of times to the projects (20th per-centile). The number then drops for the 40th per-centile and slowly increases up to the 100th per-centile. This is consistent with a community wherethere is a core of steady contributors collaboratingwith a galaxy of less involved contributors. How-ever, if we apply the same analysis to the number
OSGEO Journal Volume 13 Page 38 of 114

Taarifa
of LOC contributed (see 7), we find that there is acertain balance in the number of contributors withineach quintile. This suggests that the amount of efforteach contributor is able to provide the communityis similar, although sometimes spread over multiplecommits. There is, however, a medium correlation(correlation coefficient of 0.49), between the commitsand the LOC samples, which is consistent with anongoing effort.
Figure 6: Quintile cardinality for commits; Ushahidi[1,2,5,34,777], Taarifa Web [3,5.8,8.2,12,18], Djan-gorifa [1.8,5,7,13.2,38]
Figure 7: Quintile cardinality for number of lines ofcode inserted; Ushahidi [6,26.4,226.6,9706.4,229389],Taarifa Web [4,28,190.6,481.2,36098], Djangorifa[50.2,132.8,2087.6,8839.8,24427]
Taarifa Web
The Taarifa community is much smaller than theUshahidi community, and the total amount of LOC
is bigger only because Taarifa Web was originallyforked out from Ushahidi. In fact, Taarifa adds about40,000 LOC on top of the Ushahidi code base, com-ing to a total of 260,000. The number of contributorswho worked exclusively to Taarifa is 12, coming toa total of 667 commits. Clearly, this implies that inits shorter life each contributor had fewer opportu-nities to commit code: the average per-contributeis 7.53 with a standard deviation of 5.06. This sug-gests more uniformity in the way Taarifa Web wasdeveloped and is in fact consistent with its incep-tion at a hackathon: there is a relatively high numberof people doing commits, rather than the massivedifferences we saw for Ushahidi. The story is a bitdifferent when we analyse the LOC contribution.With an average of 2935.92 and a standard deviationof 9966, we can still see wild differences in the levelsof contribution. This finding can be explained in avery simple way: Taarifa is a community effort werethere is a core groups of developers, and most impor-tantly a lead developer. The lead developer is mostdefinitely an outlier, having contributed a whopping36098 LOC. In this case, there is a clear concentra-tion of many LOC in just a few commits, typical ofhackathon developments. This is confirmed by thelow correlation (0.28) existing between the commitsand LOC samples. Visual confirmations of this canbe found in figure 6 and 7.
Djangorifa
As stated before, we only add this for complete-ness. Djangorifa is a novel implementation of Taarifabased on a new framework and it is pretty muchan ongoing effort. The data we see here are consis-tent with an ongoing personal developmental effort,especially an extremely low correlation coefficient(0.05) between the commits sample and the LOC.
Discussion
The most important lesson we gather by analysingthese data is that we can distinguish an ongo-ing effort, spread over a large community, that ofUshahidi, from an development like that of Taar-ifa, which had an initial large contribution at ahackathon, upon which a small community then de-veloped. Also, we are able to identify where thereis a core of developers, a lead developer, or a singledeveloper, as in the case of Djangorifa. Further anal-
OSGEO Journal Volume 13 Page 39 of 114

ysis might lead us to identify trends in Taarifa, see-ing when and where contributions are more likely togive a lasting effect on the community.
Summary and Future
This paper has discussed how the Taarifa project wasstarted and how it was used in Uganda. Issues iden-tified with the deployments include problems withcivil infrastructure and communications in the coun-try. While it is realistic to adapt the Taarifa platformto be resilient with regard to poor connectivity it willpresumably be an issue which will need to be ad-dressed in future iterations.
How can the Taarifa platform deal with an envi-ronment with no connectivity? We are currently as-sessing and piloting the use of Taarifa in Tanzaniaand in the United Kingdom, the adaption in theseenvironments, with differing infrastructure and po-litical will, remain outstanding. Taarifa as a group iscurrently looking towards formalising as an organ-isation. As an open source movement it can go sofar, however as a loose collection of interested hu-manitarians the project can only go so far. For exam-ple documentation is an area which is in need of im-provement, not just in requirements but user guidesand manuals of use. Unfortunately “the code is thedocumentation” isn’t an approach that the Taarifaproject wishes to take.
As an organisation, formal structures and rolescan aid in shaping the project. Requirements gath-ered in collaboration with users of the platform at theministerial and local level could be investigated withthe funding to explore those opportunities. Taarifais an open source platform and project and is free todownload and use. However the time and equip-ment spent on the project is costly. The community,however, has proved successful in providing enoughmotivation to the members to keep working on theproject.
References[1] E Hagen. Putting Nairobi’s Slums on the Map. Development
Outreach, 12(1):41–43, 2009.
[2] M Iliffe. When Government 2.0 Doesn’t Exist : Mapping Ser-vices In The Developing World. In Proceedings of the 2011AGI GeoCommunications Conference, 2011.
[3] Matthew Zook, Mark Graham, Taylor Shelton, and SeanGorman. Volunteered geographic information and crowd-sourcing disaster relief: a case study of the Haitian earth-quake. World Medical & Health Policy, 2(2):7–33, 2012.
[4] Nathan Schurr, J Marecki, and M Tambe. The future of dis-aster response: Humans working with multiagent teamsusing DEFACTO. In Proceedings of the AIII Spring Sym-posium, 2005.
[5] K Lorincz, D J Malan, T R F Fulford-Jones, A Nawoj, A Clavel,V Shnayder, G Mainland, M Welsh, and S Moulton. Sensornetworks for emergency response: Challenges and oppor-tunities. Pervasive Computing, IEEE, 3(4):16–23, 2005.
[6] A Heijmans and L Victoria. Citizenry-Based & Development-Oriented Disaster Response. Centre for Disaster Prepared-ness and Citizens’ Disaster Response Centre, 2001.
[7] L Gunawan, A. H. J. Oomes, M Neerincx, WP Brinkman, andH Alers. Collaborative situational mapping during emer-gency response. Interacting with Computers, 2009.
[8] P Meier. Do “Liberation Technologies” Change The BalanceOf Power Between Repressive States And Civil Society?PhD thesis, Tufts University, 2011.
[9] Erica Hagen. Mapping Change: Community InformationEmpowerment in Kibera ( Innovations Case Narrative:Map Kibera). Innovations: Technology, Governance, Glob-alization, 6(1):69–94, January 2011.
[10] Rebecca Goolsby. Social media as crisis platform: The fu-ture of community mapscrisis maps. ACM Transactions onIntelligent Systems and Technology (TIST), 1(1):7, October2010.
[11] E Christophe, J Inglada, and J Maudlin. Crowd-sourcingsatellite image analysis. In Geoscience and Remote Sens-ing Symposium (IGARSS), 2010 IEEE International, pages1430–1433. IEEE, 2010.
[12] Leska S Fore, Kit Paulsen, and Kate O’Laughlin. Assess-ing the performance of volunteers in monitoring streams.Freshwater Biology, 46(1):109–123, 2001.
[13] B Al-Ani, G Mark, and B Semaan. Blogging in a region ofconSSict: Supporting transition to recovery. In Proceedingsof the 28th international conference on Human factors incomputing systems, pages 1069–1078. ACM, 2010.
[14] T. N. Smyth, J Etherton, and M. L. Best. Moses: Exploringnew ground in media and post-conflict reconciliation. In:Proceedings CHI 2010, 2010.
[15] Robert Cecil Martin. Agile software development: princi-ples, patterns, and practices. Prentice Hall PTR, 2003.
[16] K. Mei Chen and C. Reed. OGC: Open GeoSMS Standard-Core. Technical report, Open Geospatial Consortium, 2012.
OSGEO Journal Volume 13 Page 40 of 114