Embed Size (px)
Citation preview
JOURNAL OF NEUROPHYSIOLCMJY Vol. 68, No, 5, November 1992. Prinled in U.S.A.
Oscillatory Discharge in the Visual System: Does it Have a Functional Role?
GEOFFREY M. GHOSE AND RALPH D. FREEMAN Groups in Biophysics and Neurobiology, School of Optometry, University of California, Berkeley, California 94720
SUMMARY AND CONCLUSIONS
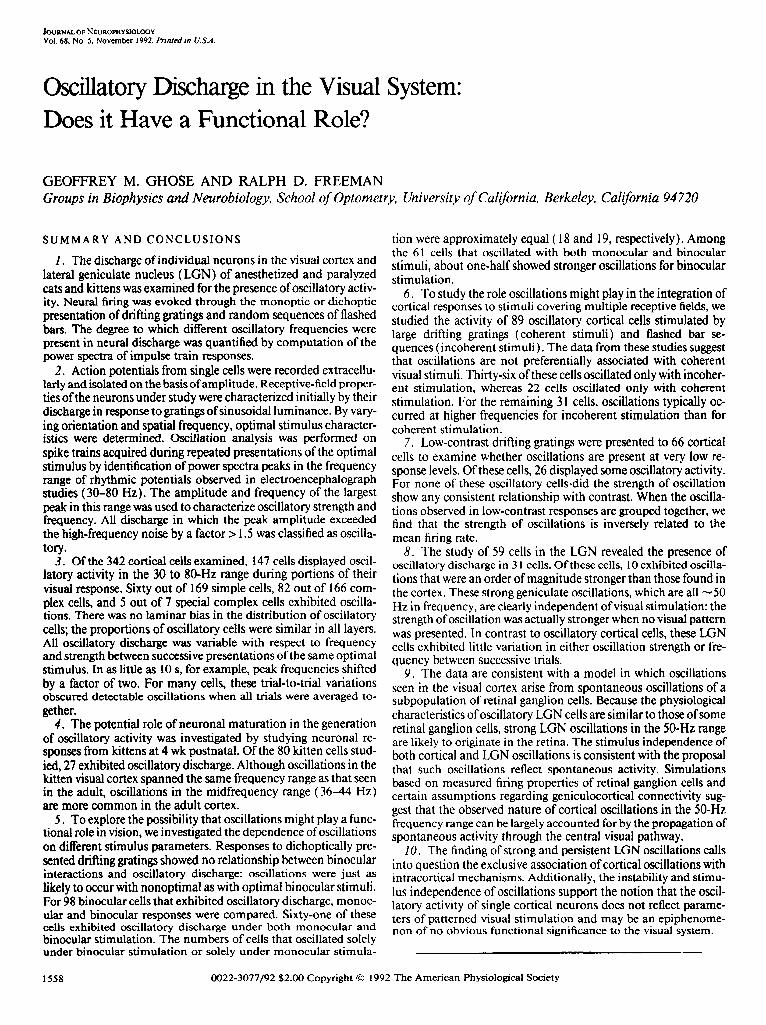
1. The discharge of individual neurons in the visual cortex and lateral geniculate nucleus (LGN) of anesthetized and paralyzed cats and kittens was examined for the presence of oscillatory activ- ity. Neural firing was evoked through the monoptic or dichoptic presentation of drifting gratings and random sequences of flashed bars. The degree to which different oscillatory frequencies were present in neural discharge was quantified by computation of the power spectra of impulse train responses.
2. Action potentials from single cells were recorded extracellu- larly and isolated on the basis of amplitude. Receptive-field proper- ties of the neurons under study were characterized initially by their discharge in response to gratings of sinusoidal luminance. By vary- ing orientation and spatial frequency, optimal stimulus character- istics were determined. Oscillation analysis was performed on spike trains acquired during repeated presentations of the optimal stimulus by identification of power spectra peaks in the frequency range of rhythmic potentials observed in electroencephalograph studies (30-80 Hz). The amplitude and frequency of the largest peak in this range was used to characterize oscillatory strength and frequency. All discharge in which the peak amplitude exceeded the high-frequency noise by a factor > 1.5 was classified as oscilla- tory.
3. Of the 342 cortical cells examined, 147 cells displayed oseil- latory activity in the 30 to 80.Hz range during portions of their visual response. Sixty out of 169 simple cells, 82 out of 166 com- plex cells, and 5 out of 7 special complex cells exhibited oscilla- tions. There was no laminar bias in the distribution of oscillatory cells; the proportions of oscillatory cells were similar in all layers. AI1 oscillatory discharge was variable with respect to frequency and strength between successive presentations of the same optimal stimulus. In as little as 10 s, for example, peak frequencies shifted by a factor of two. For many cells, these trial-to-trial variations obscured detectable oscillations when all trials were averaged to- gether.
4. The potential role of neuronal maturation in the generation of oscillatory activity was investigated by studying neuronal re- sponses from kittens at 4 wk postnatal. Of the 80 kitten cells stud- ied, 27 exhibited oscillatory discharge. Although oscillations in the kitten visual cortex spanned the same frequency range as that seen in the adult, oscillations in the midfrequency range (36-44 Hz) are more common in the adult cortex.
5. To explore the possibility that oscillations might play a func- tional role in vision, we investigated the dependence of oscillations on different stimulus parameters. Responses to dichoptically pre- sented drifting gratings showed no relationship between binocular interactions and oscillatory discharge: oscillations were just as likely to occur with nonoptimal as with optimal binocular stimuli. For 98 binocular cells that exhibited oscillatory discharge, monoc- ular and binocular responses were compared. Sixty-one of these cells exhibited oscillatory discharge under both monocular and binocular stimulation. The numbers of cells that oscillated solely under binocular stimulation or solely under monocular stimula-
tion were approximately equal ( 18 and 19, respectively). Among the 6 I cells that oscillated with both monocular and binocular stimuli, about one-half showed stronger oscillations for binocular stimulation.
6. To study the role oscillations might play in the integration of cortical responses to stimuli covering multiple receptive fields, we studied the activity of 89 oscillatory cortical cells stimulated by large drifting gratings (coherent stimuli) and flashed bar se- quences (incoherent stimuli). The data from these studies suggest that oscillations are not preferentially associated with coherent visual stimuli. Thirty-six of these cells oscillated only with incoher- ent stimulation, whereas 22 cells oscillated only with coherent stimulation. For the remaining 3 1 cells, oscillations typically oc- curred at higher frequencies for incoherent stimulation than for coherent stimulation.
7. Low-contrast drifting gratings were presented to 66 cortical cells to examine whether oscillations are present at very low re- sponse levels. Of these cells, 26 displayed some oscillatory activity. For none of these oscillatory cells-did the strength of oscillation show any consistent relationship with contrast. When the oscilla- tions observed in low-contrast responses are grouped together, we find that the strength of oscillations is inversely related to the mean firing rate.
8. The study of 59 cells in the LGN revealed the presence of oscillatory discharge in 3 1 cells. Of these cells, 10 exhibited oscilla- tions that were an order of magnitude stronger than those found in the cortex. These strong geniculate oscillations, which are all m 50 Hz in frequency, are clearly independent of visual stimulation: the strength of oscillation was actually stronger when no visual pattern was presented. In contrast to oscillatory cortical cells, these LGN cells exhibited little variation in either oscillation strength or fre- quency between successive trials.
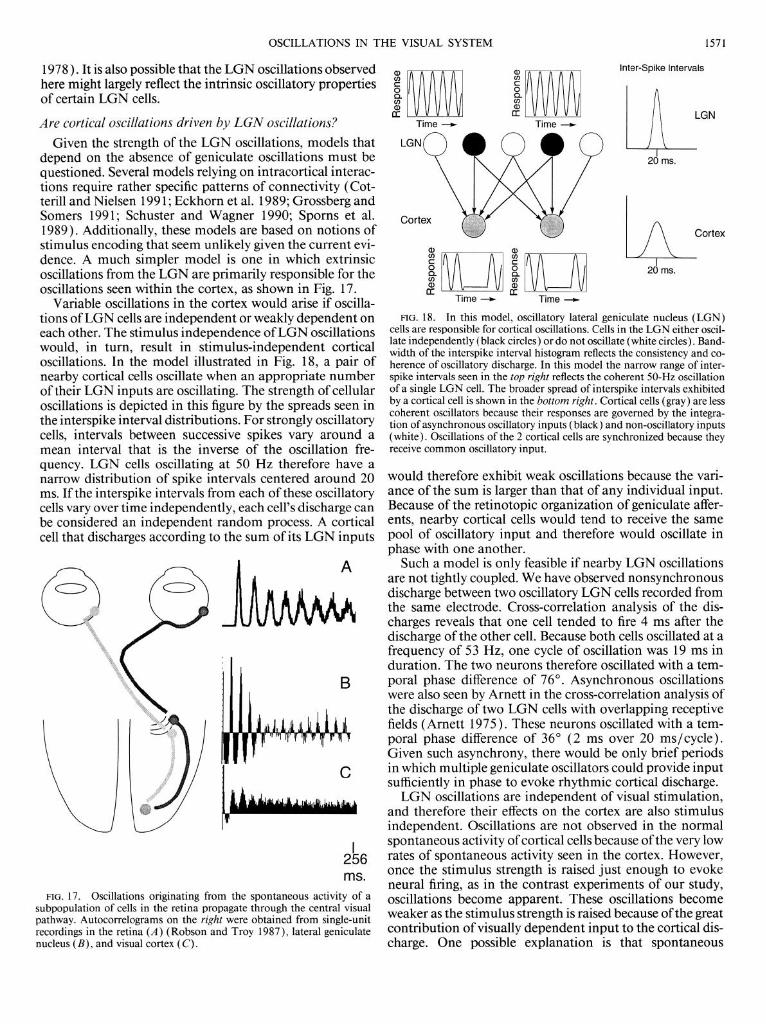
9. The data are consistent with a model in which oscillations seen in the visual cortex arise from spontaneous oscillations of a subpopulation of retinal ganglion cells. Because the physiological characteristics of oscillatory LGN cells are similar to those of some retinal ganglion cells, strong LGN oscillations in the 50.Hz range are likely to originate in the retina. The stimulus independence of both cortical and LGN oscillations is consistent with the proposal that such oscillations reflect spontaneous activity. Simulations based on measured firing properties of retinal ganglion cells and certain assumptions regarding geniculocortical connectivity sug- gest that the observed nature of cortical oscillations in the 50.Hz frequency range can be largely accounted for by the propagation of spontaneous activity through the central visual pathway.
IO. The finding of strong and persistent LGN oscillations calls into question the exclusive association of cortical oscillations with intracortical mechanisms. Additionally, the instability and stimu- lus independence of oscillations support the notion that the oscil- latory activity of single cortical neurons does not reflect parame- ters of patterned visual stimulation and may be an epiphenome- non of no obvious functional significance to the visual system.
1558 0022-3077/92 $2.00 Copyright 0 1992 The American Physiological Society
OSCILLATIONS IN THE VISUAL SYSTEM 1559
INTRODUCTION
Rhythmic patterns of activity among neural populations are thought to play a fundamental role in the behaviors of various invertebrate organisms (see Jacklet 1989 for a re- view). Rhythms in the electroencephalogram (EEG) of the vertebrate cortex reflect the activity of a large population of neurons and are associated with states of alertness (Dela- grange et al. 1989) and pathological conditions such as epi- lepsy (Dichter and Ayala 1987). However, the functional significance of many EEG patterns is still unclear (Freeman and Skarda 1985 ) . Recent studies involving both local field potential and single-unit recordings within the visual cortex have revealed that oscillatory discharge in the 30. to 60.Hz frequency range occurs among populations of cortical neu- rons (Gray and Singer 1989; Gray et al. 1990). Because single-unit discharge in the central visual pathway underlies visual perception (Barlow 1972), these findings bring up the possibility that oscillations in the visual cortex may be of functional significance in the perceptual process.
Previous studies have suggested that the synchronized oscillations over populations of cortical neurons might re- sult from intracortical networks that link common visual features between receptive fields (E&horn et al. 1988; En- gel et al. In press; Grossberg and Somers 199 1). On a more speculative note, these studies have hypothesized that oscil- lations emerge from interneural connections within the cortex and serve to encode visual stimuli. This proposition is basedeprimarily on three findings: I) cortical oscillations are stimulus dependent; 2) oscillations are synchronized over large distances and between cortical hemispheres (En- gel et al. 1991a,b); and 3) oscillations are not present in the lateral geniculate nucleus (LGN).
However, a mechanism for the generation of oscillations has not been identified (Gray et al. 1992b). Furthermore, methodological limits have prevented the establishment of an explicit relationship between stimulus attributes and oscillation strength and frequency (Gray and Singer 1989; Gray et al. 1990). The strength of a specific frequency of oscillation, relative to the noise present within a spike train, could not be measured by the previous analyses. This made it impossible to study stimulus dependencies in a quantita- tive manner. Furthermore, previous stimulus dependence resuhs were based on limited sample sizes. Although oscil- lations were reported to be present in the kitten (Gray and Singer 1989), no comparisons were made between oscilla- tions in adult and kitten cortex. Finally, there is a contro- versy concerning the presence of oscillatory discharge in the LGN. Several previous studies indicate their presence (Ar- nett 1975; Bishop et al. 1964; Munemori et al. 1984), but, in more recent work, it is reported that oscillations are spe- cifically absent in the LGN (Gray and Singer 1989).
To more clearly elucidate the functional role of cortical oscillations, we systematically analyzed the nature of oscil- latory discharge in a large number of physiologically classi- fied cells within the LGN and the visual cortex of the cat and the kitten. Oscillations were quantified with respect to strength and frequency for responses to a variety of com- puter-controlled visual stimuli. For all cells, this analysis was done over a variety of temporal periods to study the stability and coherence of oscillations. Finally, the recep-
tive-field properties and laminar locations of cells that ex- hibited oscillations were tabulated to determine the distri- bution of cells that exhibit oscillatory discharge.
Our results show that cortical oscillations are highly un- stable and do not exhibit consistent dependencies on the properties of visual stimulation. Oscillations are present among both simple and complex cells within all layers of the cortex in both kittens and adult cats. Our findings also suggest that oscillatory discharge does not arise exclusively from intracortical interactions. The strength of oscillations in LGN spontaneous discharge and the presence of oscilla- tions within the input layers of the visual cortex implicate a precortical origin. This origin is also suggested by numer- ous reports of spontaneous rhythmic activity in the retina ( Ariel et al. 1983; Barlow et al. 1964; Kuffler 1953; Robson and Troy 1987), optic nerve (Laufer and Verzeano 1967), and LGN (Amett 1975). In contrast to recent suggestions that these oscillations encode visual information (Engel et al. In press, Singer 1990b), the data here*suggest that oscil- latory single-unit discharge in the visual cortex may play no clear functional role and originates primarily from precorti- cal spontaneous activity.
METHODS
Physiological preparation Twenty-eight adult cats ( 1.9-4.6 kg) and 12 kittens at postnatal
day 28 (350-580 g) were studied by standard extracellular record- ing techniques. Acepromazine (0.5 mg/ kg) and atropine (0.3 mg for adults, 0.05 mg for kittens) were injected subcutaneously 30 min before surgery for tranquilization and reduction of secretion. During halothane-induced anesthesia, catheters were placed in the femoral veins of each forepaw, and an endotracheal tube was se- cured. Needle electrodes were positioned in fore- and hindlimb muscle to monitor the electrocardiogram. A thermistor was in- serted rectally to monitor core body temperature. After the ani- mal’s head was secured in a stereotaxic holder via ear bars, a crani- otomy was performed over the area 17 representation of area cen- tralis close to the sagittal midline, and the dura was reflected. For adults, this region is located at P4,L3, and for kittens, it is located just anterior to the lambda suture. Four of the adult cats were used for LGN recordings. In these animals the craniotomy was per- formed at stereotaxic coordinates A6,L9.
Animals were paralyzed with a loading dose of gallamine trieth- iodide (Flaxedil) and artificially respirated with a mixture of 75% N,O-25% OZ. Two Levick-type tungsten&glass electrodes, en- cased in a common tube driven by a micropositioner, were posi- tioned over the exposed cortex, and the area was sealed by agar covered with wax. The interelectrode distance within the common tube was ~500 pm. Throughout the experiment N20 was supple- mented by a continuous infusion of thiamylal sodium (Surital) at 1 mgakg-‘oh-‘. Paralysis was maintained by continuous infu- sion of Flaxedil ( 10 mg l kg-’ l h -’ ) mixed with dextrose-supple- mented Ringer. Electrocardiogram and EEG data were monitored to help assess the level of anesthesia. Expired CO2 was maintained at -4.25% by occasional adjustments of the stroke volume of the respiration pump. Body temperature was automatically main- tained near 38°C by a feedback controlled heating pad and lamp.
Before electrophysiological recordings, the pupils were dilated with atropine sulfate (0.5%)) and the nictitating membranes were retracted by topical phenylephrine hydrochloride ( 10% ) . Corneas were protected with contact lenses with artificial pupils of 4 mm diam. Optic disk position was rear projected onto a tangent screen ophthalmoscopically for each eye. Eyes and contact lenses were cleaned every 8 h during the experiment.
1560 G. M. GHOSE AND R. D. FREEMAN
Histology
For each electrode penetration, two or three electrolytic lesions were made at regular intervals (between 500 and 1 ,OUO pm) along each electrode track as the electrodes were withdrawn from the cortex. This was done by passing DC current through the electrode (5 mA for 5 s). At the end of each experiment, the animal was given an overdose of pentobarbital sodium (Nembutal) and per- fused through the heart with buffered saline (0.9%) followed by Formalin ( 10%). Blocks of visual cortex were cut in the plane of the electrode tracks, and 40.pm frozen sections were cut and stained with thionin. Lesions were located, and electrode tracks were reconstructed to determine positions of recorded cells. The cortical neurons studied were all located in area 17, and all cortical lamina were represented in the sample, although the majority of cells was in layers 4 and 6. The majority of LGN cells was recorded in layers A and A 1.
Recording procedures
Action potentials from individual cells were isolated by ampli- tude&based discrimination after appropriate amplification and fil- tering. The occurrence of each action potential was recorded by a computer with a temporal resolution of 1 ms and, in some cases, 0.1 ms.
Bar stimuli back projected on a tangent screen 57 cm from the cat’s eyes were manually drifted during electrode advancement to isolate and initially characterize single-unit activity. A half-sil- vered beam splitter placed in front of the cat allowed for visual stimulation either by targets projected onto the tangent screen or by stimuli produced on two cathode ray tube (CRT) displays (48 cd/m2). The displays were positioned so that they could be used to independently stimulate each eye from a distance of 57 cm. After isolation of a neuron on the basis of action-potential ampli- tude, a manually controlled search program was used in conjunc- tion ivith these displays to estimate ocular dominance, orientation and spatial frequency selectivity, and receptive-field type.
For 342 cortical cells the orientation, direction, and spatial fre- quency of sinusoidal gratings at 50% contrast and drifting at a temporal frequency of 2 Hz were then varied in randomly inter- leaved sequences to determine exactly the receptive-field type and optimal sensitivities. During these runs, peristimulus time histo- grams (PSTHs) and interspike interval histograms were accumu- lated. For each CRT, mean luminance was maintained in the intervals when no grating was present (2-3 s). Except for cells that exhibited length tuning, large gratings ranging from 8 to 20” diam and centered on the receptive field were used. Receptive fields were classified as simple or complex by computing the degree of ~-HZ modulation in the PSTHs. A cell whose ~-HZ response har- monic was greater than its mean firing rate was classified as sim- ple; otherwise, the cell was classified as complex. Complex cells with very little length summation and large receptive fields were classified as special-complex. The sync pulses corresponding to the temporal frequency of the gratings were recorded by computer with the same temporal resolution as the action potentials.
The 59 geniculate cells were classified into X and Y groups according to the linearity of their spatial summation. Spatial fre- quency selectivity was initially measured with the use of 50% con- trast sinusoidal gratings that were temporally modulated by coun- terphase at a frequency of 2 Hz. The linearity was tested by varying the spatial phase of such gratings (null test). Cells showing a null response rate at a particular spatial phase were classified as X-cells ( Enroth-Cugell and Robson 1966).
Visual stimulation
Analysis was carried out for 342 cells with discharge rates to optimal stimulation >5 spikes/s. After receptive-field-classifica-
tion, two types of stimuli were used to study the potential stimulus dependence of oscillatory discharge. For the 188 binocular cells studied, drifting gratings of optimal spatial frequency and orienta- tion were presented dichoptically. For 268 cells, small bars of ap- propriate orientation and size were flashed to invoke neural dis- charge.
For the binocular studies the spatial phase between the gratings presented to the two eyes was varied in a randomly interleaved manner. This allowed a determination of the degree of linear sum- mation between the receptive fields of the two eyes. A null condi- tion, consisting of mean luminance unpatterned stimulation to both eyes, and monoptic stimulation conditions were interleaved among the dichoptic stimuli. Each stimulus condition consisted of a 4-s presentation, which was typically repeated four times in a semirandom sequence. For oscillation analysis, responses from interleaved monocular and binocular conditions were usually compared. When dichoptic and monoptic presentations are inter- leaved, monocular response rates are generally reduced (Ohzawa and Freeman 1986). Presumably, this is due to adaptation. For cases in which the response rate of the interleaved monocular conditions was <5 spikes/s, we compared the binocular dis- charges with monocular responses obtained from monoptic orien- tation and spatial frequency runs.
In the reverse correlation technique (Jones and Palmer 1987), a random sequence of flashed bright and dark bars of appropriate orientation and size, presented at an array of positions centered on the receptive field, is used to activate neural discharge. The dura- tion of each bar presentation was either 52 or 39 ms, and only one bar was present at any point in time. Bar size was set to the small- est dimensions that elicited neural discharge. Bar widths were <0.5”, and bar lengths were between 1 and IO”. Each trial con- sisted of a different random sequence in which bars brighter or darker than the mean luminance background were presented once at every possible position within the array, which usually spanned a visual area of 6 by 6”. Trials were presented successively up to 60 times. Because of the randomness of each of these trials, the stimu- lus is both spatially and temporally incoherent. The lack of any consistent pattern or motion within the trials makes this stimulus perceptually noiselike. By contrast, the drifting sinusoidal grating extending throughout and beyond the receptive field presents in- put that is spatially and temporally coherent within the limit of receptive-field spatiotemporal filtering. Because the reverse corre- lation method can accurately map receptive-field structure by in- ferring the particular causal stimulus associated with each spike, receptive-field classifications provided by the initial grating stimu- lation were confirmed. All cortical cells with large first harmonic components in their PSTHs to drifting gratings had nonoverlap- ping ON and OFF regions revealed by this technique and were thus confirmed to be simple cells.
Data analysis Detailed autocorrelation analysis was performed after data ac-
quisition to examine common firing intervals. The distribution of these intervals into bins representing different interspike intervals is called the autocorrelogram, as illustrated in Fig. 1. The height of each bin represents the number of spike pairs observed that are separated by the interval represented by the bin. Rhythmic dis- charge will produce a regular pattern of peaks in the autocorrelo- gram whose spacing corresponds to frequency. To ensure that peaks in the correlogram are not simply due to periodicities in the stimulus, autocorrelograms are computed for shuffled spike trains ( Perkel et al. 1967 ). Periodicities in the shuffled correlograms are based solely on the stimulus. To examine rhythmic discharge of a neural origin, the shuffled correlogram is subtracted from the raw correlogram.
The importance of ascertaining whether periodicities in the spike train are of neural or stimulus origin can be seen by examin-
OSCILLATIONS IN THE VISUAL SYSTEM 1561
Raw Autocorrelogram
w Time
Shuffled Autocorrelogram
I I R
Trial #1 Trial #2 Trial #3
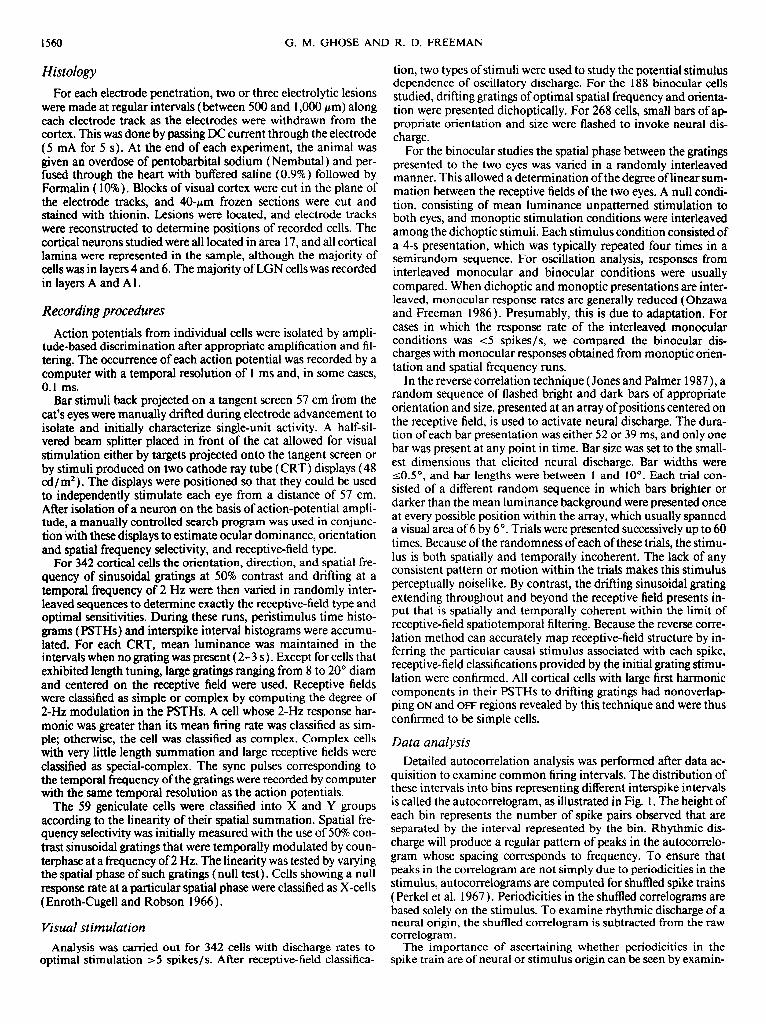
FIG. 1. Raw autocorrelogram shows distribution of intervals between action potentials in the spike train. The autocorrelation distribution is computed by taking a reference spike, here labeled R, and searching for- ward in the spike train for subsequent spikes. Spike intervals up to the limit of +t are tallied in the correlogram. Unfilled bins are incremented (m) according to this portion of the spike sequence. The process is then re- peated by moving the reference R to successive spikes. Periodicity in the autocorrelogram is indicative of rhythmic discharge in the spike train. For the autocorrelograms shown in subsequent figures, t = 256 ms. The shuf- fled autocorrelogram is used to compute periodicities in the spike train that are associated with periodicities in the visual stimulus itself. This correlo- gram is computed by applying the autocorrelation method to 2 spike trains resulting from different repetitions of the same stimulus. In this example, reference spikes are taken from trial #2, and the incrementing spikes are taken from trial #I of the same stimulus. This shuffling between different trials is repeated with the use of different trial pairs to construct a shuffled correlogram.
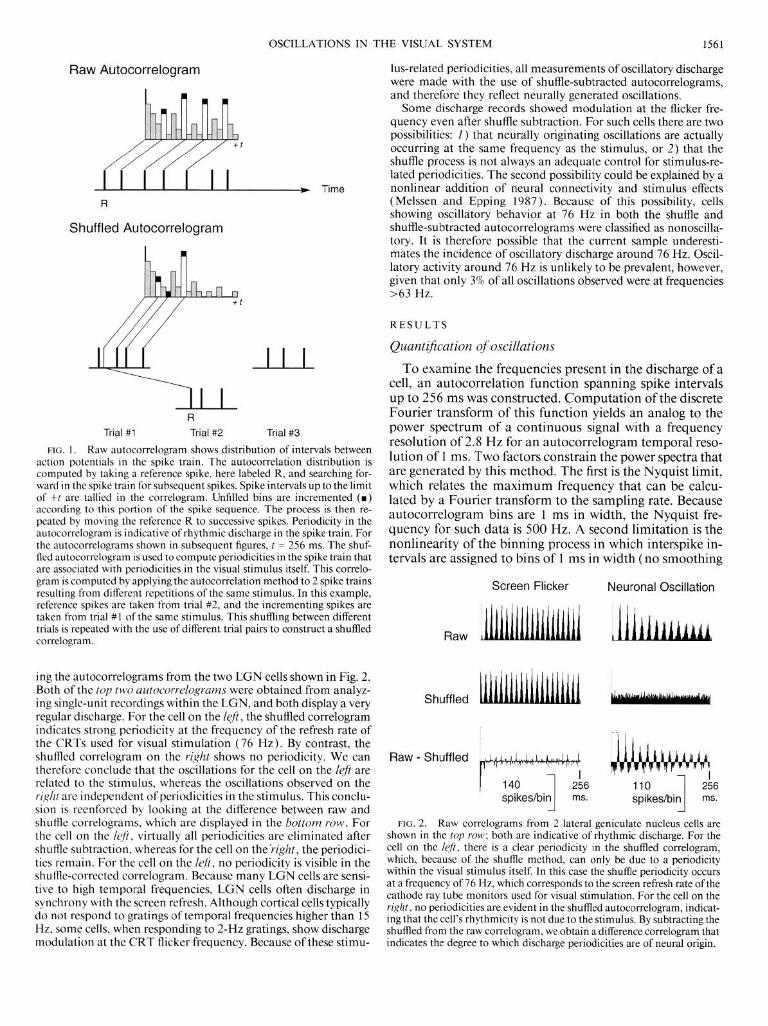
ing the autocorrelograms from the two LGN cells shown in Fig. 2. Both of the top two autocorrelograms were obtained from analyz- ing single-unit recordings within the LGN, and both display a very regular discharge. For the cell on the left, the shuffled correlogram indicates strong periodicity at the frequency of the refresh rate of the CRTs used for visual stimulation (76 Hz). By contrast, the shuffled correlogram on the right shows no periodicity. We can therefore conclude that the oscillations for the cell on the left are related to the stimulus, whereas the oscillations observed on the right are independent of periodicities in the stimulus. This conclu- sion is reenforced by looking at the difference between raw and shuffle correlograms, which are displayed in the bottom row. For the cell on the I@, virtually all periodicities are eliminated after shuffle subtraction, whereas for the cell on the’right, the periodici- ties remain. For the cell on the left, no periodicity is visible in the shuffle-corrected correlogram. Because many LGN cells are sensi- tive to high temporal frequencies, LGN cells often discharge in synchrony with the screen refresh. Although cortical cells typically do not respond to gratings of temporal frequencies higher than 15 Hz, some cells, when responding to ~-HZ gratings, show discharge modulation at the CRT flicker frequency. Because of these stimu-
lus-related periodicities, all measurements of oscillatory discharge were made with the use of shuffle-subtracted autocorrelograms, and therefore they reflect neurally generated oscillations.
Some discharge records showed modulation at the flicker fre- quency even after shuffle subtraction. For such cells there are two possibilities: 1) that neurally originating oscillations are actually occurring at the same frequency as the stimulus, or 2) that the shuffle process is not always an adequate control for stimulus-re- lated periodicities. The second possibility could be explained by a nonlinear addition of neural connectivity and stimulus effects (Melssen and Epping 1987). Because of this possibility, cells showing oscillatory behavior at 76 Hz in both the shuffle and shuffle-subtracted autocorrelograms were classified as nonoscilla- tory. It is therefore possible that the current sample underesti- mates the incidence of oscillatory discharge around 76 Hz. Oscil- latory activity around 76 Hz is unlikely to be prevalent, however, given that only 3% of all oscillations observed were at frequencies >63 Hz.
RESULTS
Quantification of oscillations
To examine the frequencies present in the discharge of a cell, an autocorrelation function spanning spike intervals up to 256 ms was constructed. Computation of the discrete Fourier transform of this function yields an analog to the power spectrum of a continuous signal with a frequency resolution of 2.8 Hz for an autocorrelogram temporal reso- lution of 1 ms. Two factors constrain the power spectra that are generated by this method. The first is the Nyquist limit, which relates the maximum frequency that can be calcu- lated by a Fourier transform to the sampling rate. Because autocorrelogram bins are 1 ms in width, the Nyquist fre- quency for such data is 500 Hz. A second limitation is the nonlinearity of the binning process in which interspike in- tervals are assigned to bins of 1 ms in width (no smoothing
Screen Flicker Neuronal Oscillation
Raw
Shuffled
Raw - Shuffled
) 140
1
256 spikes/bin ms.
110
1
256 spikes/bin ms.
FIG. 2. Raw correlograms from 2 lateral geniculate nucleus cells are shown in the top row; both are indicative of rhythmic discharge. For the cell on the left, there is a clear periodicity in the shuffled correlogram, which, because of the shuffle method, can only be due to a periodicity within the visual stimulus itself. In this case the shuffle periodicity occurs at a frequency of 76 Hz, which corresponds to the screen refresh rate ofthe cathode ray tube monitors used for visual stimulation. For the cell on the right, no periodicities are evident in the shuffled autocorrelogram, indicat- ing that the cell’s rhythmicity is not due to the stimulus. By subtracting the shuffled from the raw correlogram, we obtain a difference correlogram that indicates the degree to which discharge periodicities are of neural origin.
1562 G. M. GHOSE AND R. D. FREEMAN
was performed on autocorrelograms). This introduces the upper 250 Hz of the power spectra. Additionally, for the possibility that the peaks seen below 500 Hz actually reflect cells that could be analyzed up to 5,000 Hz, power spectra the aliasing of signals between 500 and 1,000 Hz in the were always flat beyond 250 Hz. On the assumption that spike tmin (Schild and Schultens 1986). This possibility the noise is flat across all frequencies, a signal-to-noise (S/ was examined by computing the power spectra for strongly N) ratio was computed with the use of the averaged peak oscillatory cells that were recorded with a temporal resolu- height and the high-frequency noise estimate (Press et al. tion of 0.1 ms. For five cells examined in this way, the 1988 ) . A neural discharge record was classed as oscillatory Nyquist frequency was 5,000 Hz, and the 500. to l,OOO-Hz if three criteria were met: I) the power at frequencies near frequency range could be explicitly examined. None of the optimal was larger than the noise estimate; 2) the S/N these cells showed any distinguishable peaks in the 500- to ratio exceeded 1 S; and 3) the peak was not at the screen 1 ,OOO-Hz frequency range. refresh frequency of 76 Hz.
Oscillation frequency and strength were quantified by searching for discernable peaks in the 29, to 78-Hz fre- quency range of the power spectrum. This frequency range was examined because, in previous studies, oscillations were found in this range by a different method of analysis (Gray and Singer 1989) and because it is the frequency range of EEG rhythms of potential sensory significance in the olfactory bulb (Freeman and Skarda 1985) and visual cortex (Freeman and van Dijk 1987). In our analyses, oscillation frequency was identified as the frequency having the highest amplitude within this range of the power spec- trum. Peak height was averaged over a frequency window 9.5 Hz in width that was centered on the optimal frequency. Noise was estimated by averaging the power between 250 and 500 Hz, with the use of the assumption that no signal was present in this frequency range. This assumption is cor- roborated by the absence of any discernable peaks in the
A B 48007, 520~ ,
1 Bin = 1 ms.
Time (ms.)
1051 5 ” 1 53Hz S/N=17.6
1 Bin = 2.8 Hz II t ’ 0 250 500 0
I 1 250 500
Frequency (Hz) Frequency (Hz)
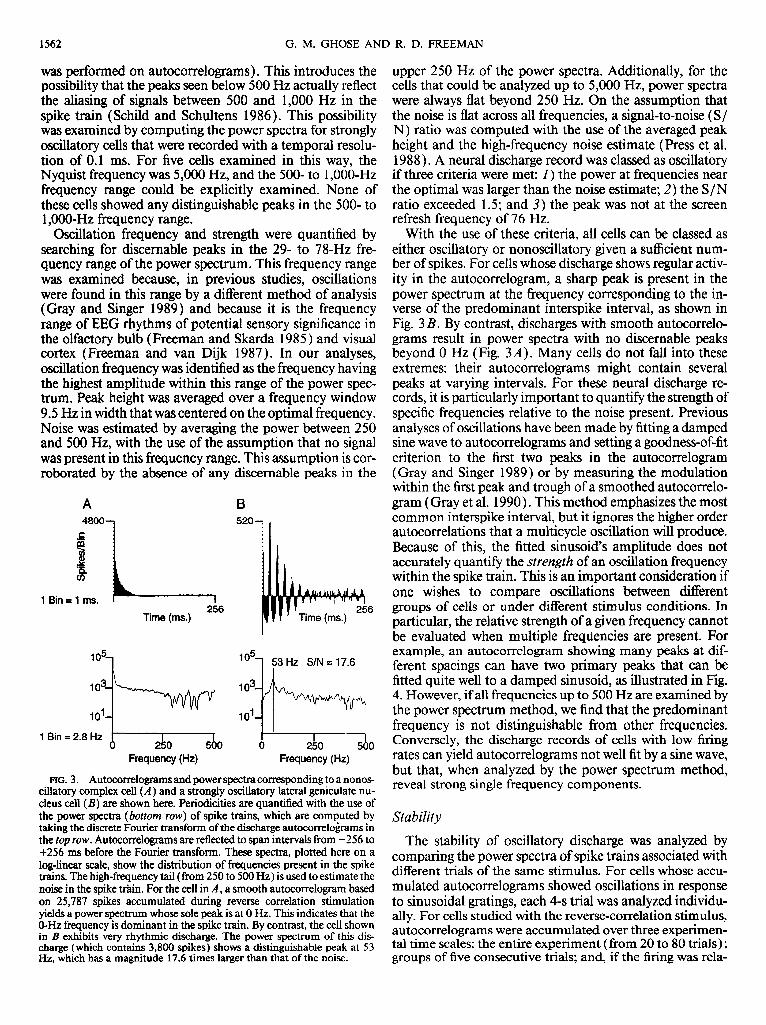
FIG. 3. Autocorrelograms and power spectra corresponding to a nonos- cillatory complex cell (A ) and a strongly oscillatory lateral geniculate nu- cleus cell (B) are shown here. Periodicities are quantified with the use of the power spectra (bottom row) of spike trains, which are computed by taking the discrete Fourier transform of the discharge autocorrelograms in the top row. Autocorrelograms are reflected to span intervals from -256 to +256 ms before the Fourier transform. These spectra, plotted here on a log-linear scale, show the distribution of frequencies present in the spike trains. The high-frequency tail (from 250 to 500 Hz) is used to estimate the noise in the spike train. For the cell in A, a smooth autocorrelogram based on 25,787 spikes accumulated during reverse correlation stimulation yields a power spectrum whose sole peak is at 0 Hz. This indicates that the O-Hz frequency is dominant in the spike train. By contrast, the cell shown in B exhibits very rhythmic discharge. The power spectrum of this dis- charge (which contains 3,800 spikes) shows a distinguishable peak at 53 Hz, which has a magnitude 17.6 times larger than that of the noise.
With the use of these criteria, all cells can be classed as either oscillatory or nonoscillatory given a sufficient num- ber of spikes. For cells whose discharge shows regular activ- ity in the autocorrelogram, a sharp peak is present in the power spectrum at the frequency corresponding to the in- verse of the predominant interspike interval, as shown in Fig. 3 B. By contrast, discharges with smooth autocorrelo- grams result in power spectra with no discernable peaks beyond 0 Hz (Fig. 3A). Many cells do not fall into these extremes: their autocorrelograms might contain several peaks at varying intervals. For these neural discharge re- cords, it is particularly important to quantify the strength of specific frequencies relative to the noise present. Previous analyses of oscillations have been made by fitting a damped sine wave to autocorrelograms and setting a goodness-of-fit criterion to the first two peaks in the autocorrelogram (Gray and Singer 1989) or by measuring the modulation within the first peak and trough of a smoothed autocorrelo- gram (Gray et al. 1990). This method emphasizes the most common interspike interval, but it ignores the higher order autocorrelations that a multicycle oscillation will produce. Because of this, the fitted sinusoid’s amplitude does not accurately quantify the strength of an oscillation frequency within the spike train. This is an important consideration if one wishes to compare oscillations between different groups of cells or under different stimulus conditions. In particular, the relative strength of a given frequency cannot be evaluated when multiple frequencies are present. For example, an autocorrelogram showing many peaks at dif- ferent spacings can have two primary peaks that can be fitted quite well to a damped sinusoid, as illustrated in Fig. 4. However, if all frequencies up to 500 Hz are examined by the power spectrum method, we find that the predominant frequency is not distinguishable from other frequencies. Conversely, the discharge records of cells with low firing rates can yield autocorrelograms not well fit by a sine wave, but that, when analyzed by the power spectrum method, reveal strong single frequency components.
Stability
The stability of oscillatory discharge was analyzed by comparing the power spectra of spike trains associated with different trials of the same stimulus. For cells whose accu- mulated autocorrelograms showed oscillations in response to sinusoidal gratings, each 4-s trial was analyzed individu- ally. For cells studied with the reverse-correlation stimulus, autocorrelograms were accumulated over three experimen- tal time scales: the entire experiment (from 20 to 80 trials); groups of five consecutive trials; and, if the firing was rela-
OSCILLATIONS IN THE VISUAL SYSTEM 1563
Autocorrelogram
256 ms.
103
100
Power Spectrum
500 Hz 41 Hz SIN = 0.91
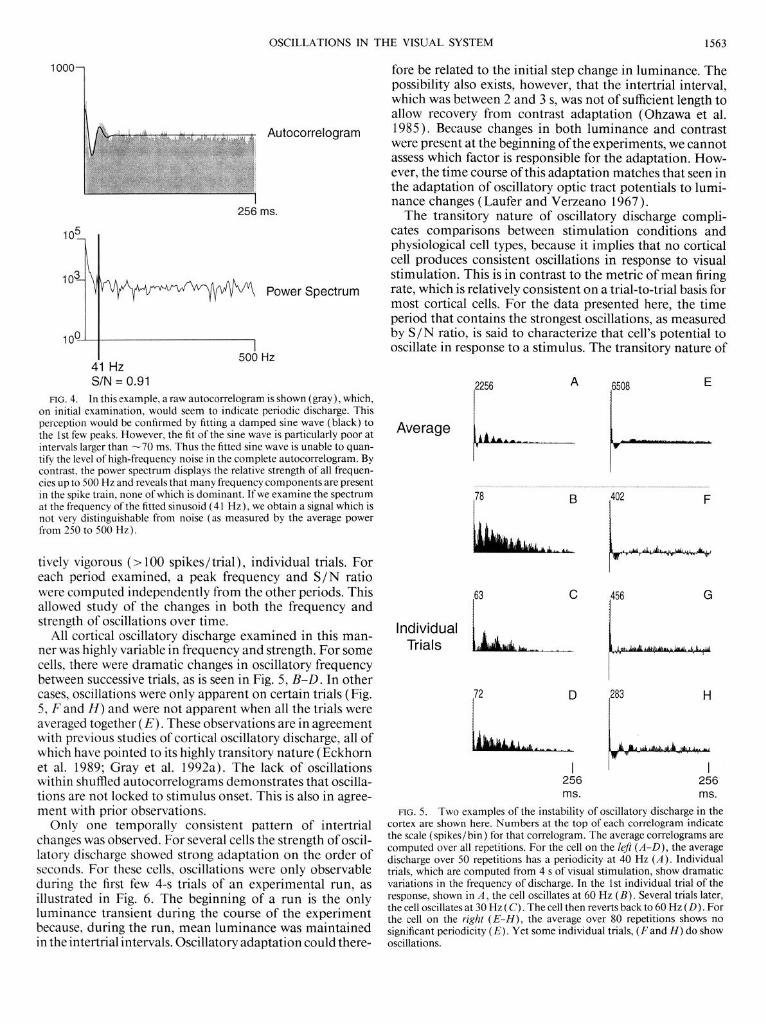
FIG. 4. In this example, a raw autocorrelogram is shown (gray), which, on initial examination, would seem to indicate periodic discharge. This perception would be confirmed by fitting a damped sine wave (black) to the 1 st few peaks. However, the fit of the sine wave is particularly poor at intervals larger than -70 ms. Thus the fitted sine wave is unable to quan- tify the level of high-frequency noise in the complete autocorrelogram. By contrast, the power spectrum displays the relative strength of all frequen- cies up to 500 Hz and reveals that many frequency components are present in the spike train, none of which is dominant. I f we examine the spectrum at the frequency of the fitted sinusoid (4 1 Hz), we obtain a signal which is not very distinguishable from noise (as measured by the average power from 250 to 500 Hz).
tively vigorous (> 100 spikes/ trial ) , individual trials. For each period examined, a peak frequency and S/N ratio were computed independently from the other periods. This allowed study of the changes in both the frequency and strength of oscillations over time.
All cortical oscillatory discharge examined in this man- ner was highly variable in frequency and strength. For some cells, there were dramatic changes in oscillatory frequency between successive trials, as is seen in Fig. 5, B-D. In other cases, oscillations were only apparent on certain trials (Fig. 5, F and H) and were not apparent when all the trials were averaged together(E). These observations are in agreement with previous studies of cortical oscillatory discharge, all of which have pointed to its highly transitory nature (Eckhorn et al. 1989; Gray et al. 1992a). The lack of oscillations within shuffled autocorrelograms demonstrates that oscilla- tions are not locked to stimulus onset. This is also in agree- ment with prior observations.
Only one temporally consistent pattern of intertrial changes was observed. For several cells the strength of oscil- latory discharge showed strong adaptation on the order of seconds. For these cells, oscillations were only observable during the first few 4-s trials of an experimental run, as illustrated in Fig. 6. The beginning of a run is the only luminance transient during the course of the experiment because, during the run, mean luminance was maintained in the intertrial intervals. Oscillatory adaptation could there-
fore be related to the initial step change in luminance. The possibility also exists, however, that the intertrial interval, which was between 2 and 3 s, was not of sufficient length to allow recovery from contrast adaptation (Ohzawa et al. 1985). Because changes in both luminance and contrast were present at the beginning of the experiments, we cannot assess which factor is responsible for the adaptation. How- ever, the time course of this adaptation matches that seen in the adaptation of oscillatory optic tract potentials to lumi- nance changes (Laufer and Verzeano 1967).
The transitory nature of oscillatory discharge compli- cates comparisons between stimulation conditions and physiological cell types, because it implies that no cortical cell produces consistent oscillations in response to visual stimulation. This is in contrast to the metric of mean firing rate, which is relatively consistent on a trial-to-trial basis for most cortical cells. For the data presented here, the time period that contains the strongest oscillations, as measured by S/N ratio, is said to characterize that cell’s potential to oscillate in response to a stimulus. The transitory nature of
2256 A
Average
78 B
63 c
individual Trials
72 D
L 283 H
256 256 ms. ms.
FIG. 5. Two examples of the instability of oscillatory discharge in the cortex are shown here. Numbers at the top of each correlogram indicate the scale (spikes/bin) for that correlogram. The average correlograms are computed over all repetitions. For the cell on the left (A-D), the average discharge over 50 repetitions has a periodicity at 40 Hz (A). Individual trials, which are computed from 4 s of visual stimulation, show dramatic variations in the frequency of discharge. In the 1st individual trial of the response, shown in A, the cell oscillates at 60 Hz (B). Several trials later, the cell oscillates at 30 Hz ( C) . The cell then reverts back to 60 Hz (D) . For the cell on the right (E-H), the average over 80 repetitions shows no significant periodicity ( E) Yet some individual trials, (F and H) do show oscillations.
1564 G. M. GHOSE AND R. D. FREEMAN
Condition #4
Condition #6
Condition #I4
300 1 spikes/bin
Repetition #I Repetition #2
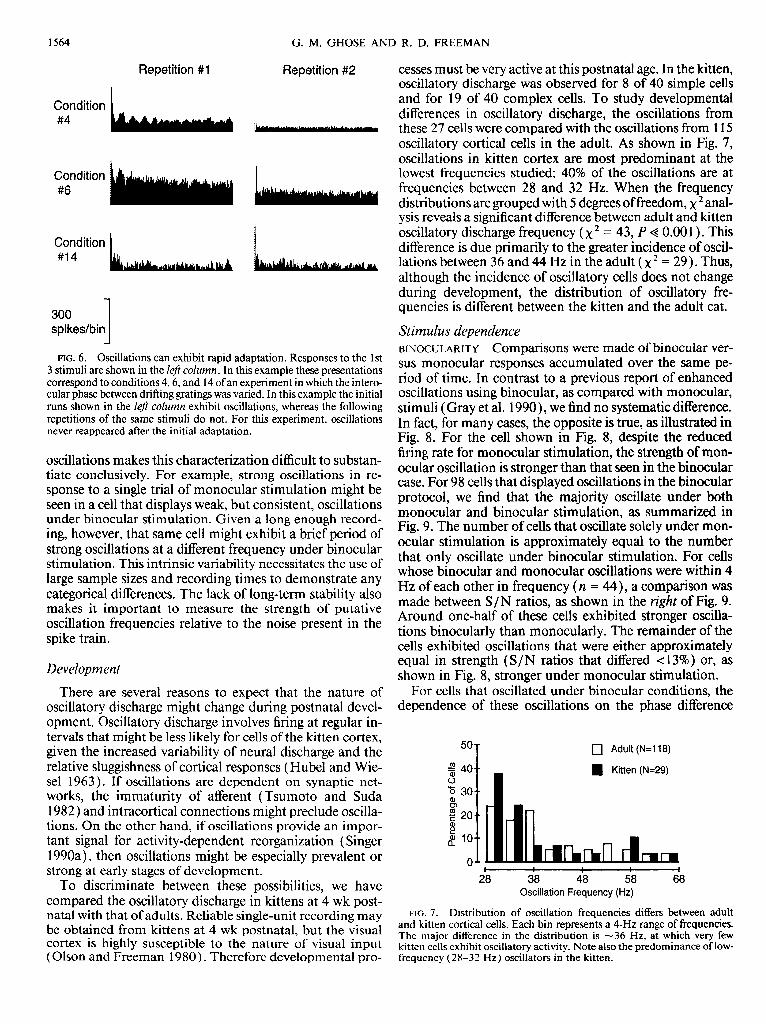
FIG. 6. Oscillations can exhibit rapid adaptation. Responses to the 1st 3 stimuli are shown in the Zefi column. In this example these presentations correspond to conditions 4,6, and 14 of an experiment in which the intero- cular phase between drifting gratings was varied. In this example the initial runs shown in the left column exhibit oscillations, whereas the following repetitions of the same stimuli do not. For this experiment, oscillations never reappeared after the initial adaptation.
oscillations makes this characterization difficult to substan- tiate conclusively. For example, strong oscillations in re- sponse to a single trial of monocular stimulation might be seen in a cell that displays weak, but consistent, oscillations under binocular stimulation. Given a long enough record- ing, however, that same cell might exhibit a brief period of strong oscillations at a different frequency under binocular stimulation. This intrinsic variability necessitates the use of large sample sizes and recording times to demonstrate any categorical differences. The lack of long-term stability also makes it important to measure the strength of putative oscillation frequencies relative to the noise present in the spike train.
Development
There are several reasons to expect that the nature of oscillatory discharge might change during postnatal devel- opment. Oscillatory discharge involves firing at regular in- tervals that might be less likely for cells of the kitten cortex, given the increased variability of neural discharge and the relative sluggishness of cortical responses (Hubel and Wie- se1 1963). If oscillations are dependent on synaptic net- works, the immaturity of afferent (Tsumoto and Suda 1982 ) and intracortical connections might preclude oscilla- tions. On the other hand, if oscillations provide an impor- tant signal for activity-dependent reorganization (Singer 1990a), then oscillations might be especially prevalent or strong at early stages of development.
To discriminate between these possibilities, we have compared the oscillatory discharge in kittens at 4 wk post- natal with that of adults. Reliable single-unit recording may be obtained from kittens at 4 wk postnatal, but the visual cortex is highly susceptible to the nature of visual input (Olson and Freeman 1980). Therefore developmental pro-
cesses must be very active at this postnatal age. In the kitten, oscillatory discharge was observed for 8 of 40 simple cells and for 19 of 40 complex cells. To study developmental differences in oscillatory discharge, the oscillations from these 27 cells were compared with the oscillations from 115 oscillatory cortical cells in the adult. As shown in Fig. 7, oscillations in kitten cortex are most predominant at the lowest frequencies studied: 40% of the oscillations are at frequencies between 28 and 32 Hz. When the frequency distributions are grouped with 5 degrees of freedom, x 2 anal- ysis reveals a significant difference between adult and kitten oscillatory discharge frequency (x2 = 43, P < 0.00 1). This difference is due primarily to the greater incidence of oscil- lations between 36 and 44 Hz in the adult ( x2 = 29). Thus, although the incidence of oscillatory cells does not change during development, the distribution of oscillatory fre- quencies is different between the kitten and the adult cat.
Stimulus dependence BINOCULARITY Comparisons were made of binocular ver- sus monocular responses accumulated over the same pe- riod of time. In contrast to a previous report of enhanced oscillations using binocular, as compared with monocular, stimuli (Gray et al. 1990), we find no systematic difference. In fact, for many cases, the opposite is true, as illustrated in Fig. 8. For the cell shown in Fig. 8, despite the reduced firing rate for monocular stimulation, the strength of mon- ocular oscillation is stronger than that seen in the binocular case. For 98 cells that displayed oscillations in the binocular protocol, we find that the majority oscillate under both monocular and binocular stimulation, as summarized in Fig. 9. The number of cells that oscillate solely under mon- ocular stimulation is approximately equal to the number that only oscillate under binocular stimulation. For cells whose binocular and monocular oscillations were within 4 Hz of each other in frequency (n = 44), a comparison was made between S/N ratios, as shown in the right of Fig. 9. Around one-half of these cells exhibited stronger oscilla- tions binocularly than monocularly. The remainder of the cells exhibited oscillations that were either approximately equal in strength (S/N ratios that differed < 13%) or, as shown in Fig. 8, stronger under monocular stimulation.
For cells that oscillated under binocular conditions, the dependence of these oscillations on the phase difference
0 Adult (N=ll8)
-
I I I I I I . I
28 38 48 58 68 Oscillation Frequency (Hz)
FIG. 7. Distribution of oscillation frequencies differs between adult and kitten cortical cells. Each bin represents a ~-HZ range of frequencies. The major difference in the distribution is ~36 Hz, at which very few kitten cells exhibit oscillatory activity. Note also the predominance of low- frequency (28-32 Hz) oscillators in the kitten.
OSCILLATIONS IN THE VISUAL SYSTEM 1565
Binocular
ms.
103-
102-C
IO’--
100 I 29 Hz
500
S/N = 3.3 HZ
Monocular (Left Eye)
S/N = 8.8
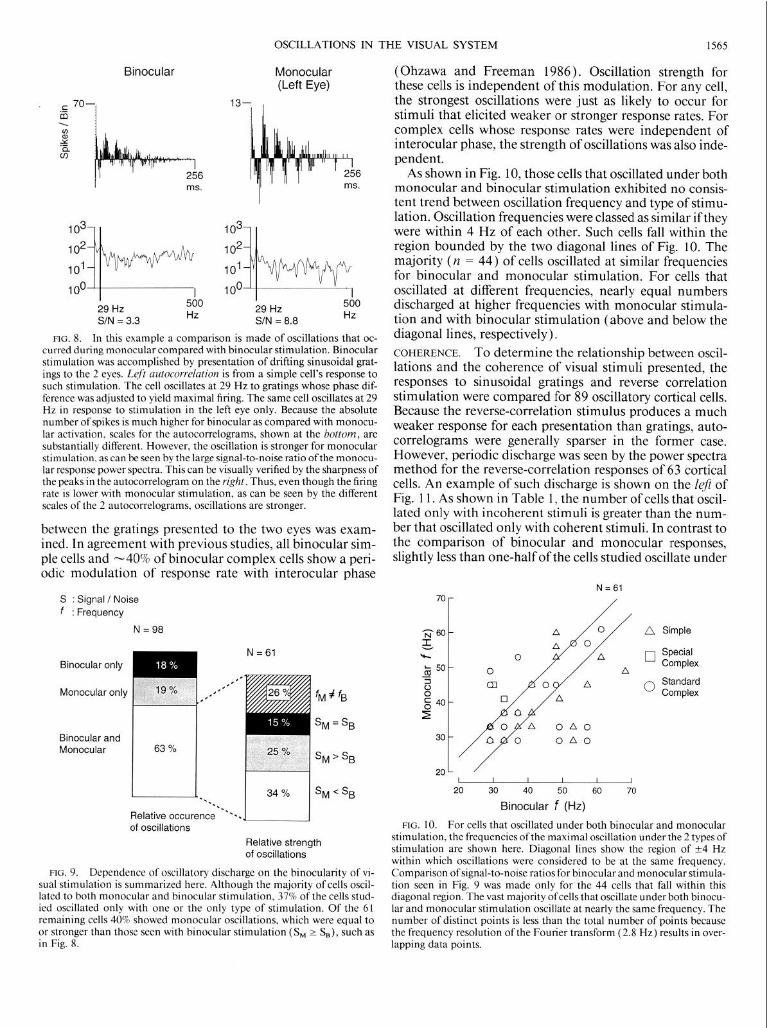
FIG. 8. In this example a comparison is made of oscillations that oc- curred during monocular compared with binocular stimulation. Binocular stimulation was accomplished by presentation of drifting sinusoidal grat- ings to the 2 eyes. Left autocorrelation is from a simple cell’s response to such stimulation. The cell oscillates at 29 Hz to gratings whose phase dif- ference was adjusted to yield maximal firing. The same cell oscillates at 29 Hz in response to stimulation in the left eye only. Because the absolute number of spikes is much higher for binocular as compared with monocu- lar activation, scales for the autocorrelograms, shown at the bottom, are substantially different. However, the oscillation is stronger for monocular stimulation, as can be seen by the large signal-to-noise ratio ofthe monocu- lar response power spectra. This can be visually verified by the sharpness of the peaks in the autocorrelogram on the right. Thus, even though the firing rate is lower with monocular stimulation, as can be seen by the different scales of the 2 autocorrelograms, oscillations are stronger.
between the gratings presented to the two eyes was exam- ined. In agreement with previous studies, all binocular sim- ple cells and -40% of binocular complex cells show a peri- odic modulation of response rate with interocular phase
S : Signal / Noise f : Frequency
N = 98
Binocular only N=61
Monocular only
Binocular and Monocular
.’ I’ I’
I’ I’ fM $ ‘B
sM=sB
‘M>‘B
I t..... 1 34% Is~<s~
Relative occurence “‘-.J ( of oscillations
Relative strength of oscillations
FIG. 9. Dependence of oscillatory discharge on the binocularity of vi- sual stimulation is summarized here. Although the majority of cells oscil- lated to both monocular and binocular stimulation, 37% of the cells stud- ied oscillated only with one or the only type of stimulation. Of the 61 remaining cells 40% showed monocular oscillations, which were equal to or stronger than those seen with binocular stimulation ( SH z S,), such as in Fig. 8.
(Ohzawa and Freeman 1986). Oscillation strength for these cells is independent of this modulation. For any cell, the strongest oscillations were just as likely to occur for stimuli that elicited weaker or stronger response rates. For complex cells whose response rates were independent of interocular phase, the strength of oscillations was also inde- pendent.
As shown in Fig. 10, those cells that oscillated under both monocular and binocular stimulation exhibited no consis- tent trend between oscillation frequency and type of stimu- lation. Oscillation frequencies were classed as similar if they were within 4 Hz of each other. Such cells fall within the region bounded by the two diagonal lines of Fig. 10. The majority (n = 44) of cells oscillated at similar frequencies for binocular and monocular stimulation. For cells that oscillated at different frequencies, nearly equal numbers discharged at higher frequencies with monocular stimula- tion and with binocular stimulation (above and below the diagonal lines, respectively). COHERENCE. To determine the relationship between oscil- lations and the coherence of visual stimuli presented, the responses to sinusoidal gratings and reverse correlation stimulation were compared for 89 oscillatory cortical cells. Because the reverse-correlation stimulus produces a much weaker response for each presentation than gratings, auto- correlograms were generally sparser in the former case. However, periodic discharge was seen by the power spectra method for the reverse-correlation responses of 63 cortical cells. An example of such discharge is shown on the left of Fig. 11. As shown in Table 1, the number of cells that oscil- lated only with incoherent stimuli is greater than the num- ber that oscillated only with coherent stimuli. In contrast to the comparison of binocular and monocular responses, slightly less than one-half of the cells studied oscillate under
N = 61
‘Or /
A Simple
0 Special Complex
0 Standard Complex
*oL / I I I I
20 30 40 50 60 70
Binocular f (Hz)
FIG. 10. For cells that oscillated under both binocular and monocular stimulation, the frequencies of the maximal oscillation under the 2 types of stimulation are shown here. Diagonal lines show the region of +4 Hz within which oscillations were considered to be at the same frequency. Comparison of signal-to-noise ratios for binocular and monocular stimula- tion seen in Fig. 9 was made only for the 44 cells that fall within this diagonal region. The vast majority ofcells that oscillate under both binocu- lar and monocular stimulation oscillate at nearly the same frequency. The number of distinct points is less than the total number of points because the frequency resolution of the Fourier transform (2.8 Hz) results in over- lapping data points.
1566 G. M. GHOSE AND R. D. FREEMAN
Incoherent Coherent
256 256
lo41 I ms.
lo*- 10*-
IO0 1 100 I 45 Hz 560 33 Hz 560 SIN = 2.2 HZ SIN = 3.3 HZ
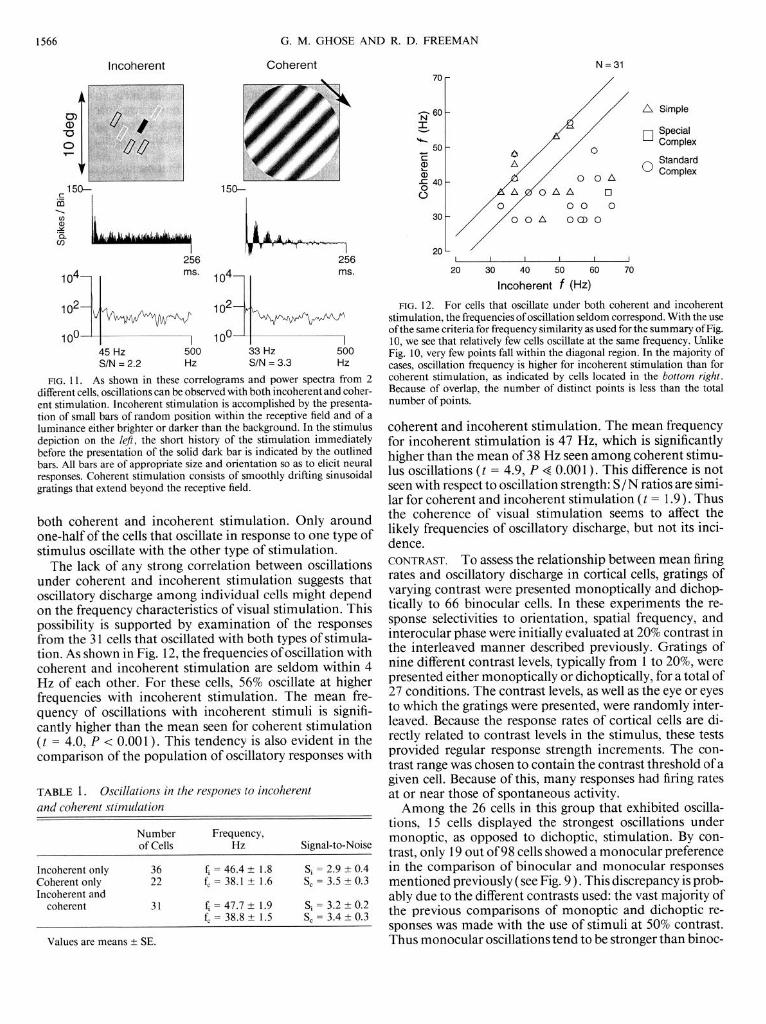
FTci. 11. As shown in these correlograms and power spectra from 2 different cells, oscillations can be observed with both incoherent and coher- ent stimulation. Incoherent stimulation is accomplished by the presenta- tion of small bars of random position within the receptive field and of a luminance either brighter or darker than the background. In the stimulus depiction on the left, the short history of the stimulation immediately before the presentation of the solid dark bar is indicated by the outlined bars. All bars are of appropriate size and orientation so as to elicit neural responses. Coherent stimulation consists of smoothly drifting sinusoidal gratings that extend beyond the receptive field.
both coherent and incoherent stimulation. Only around one-half of the cells that oscillate in response to one type of stimulus oscillate with the other type of stimulation.
The lack of any strong correlation between oscillations under coherent and incoherent stimulation suggests that oscillatory discharge among individual cells might depend on the frequency characteristics of visual stimulation. This possibility is supported by examination of the responses from the 3 1 cells that oscillated with both types of stimula- tion. As shown in Fig. 12, the frequencies of oscillation with coherent and incoherent stimulation are seldom within 4 Hz of each other. For these cells, 56% oscillate at higher frequencies with incoherent stimulation. The mean fre- quency of oscillations with incoherent stimuli is signifi- cantly higher than the mean seen for coherent stimulation (t = 4.0, P < 0.00 1) . This tendency is also evident in the comparison of the population of oscillatory responses with
TABLE I. Oscillations in the respones to incoherent and coherent stimulation
Number of Cells
Frequency, HZ Signal-to-Noise
Incoherent only Coherent only Incoherent and
coherent
36 f, = 46.4 z.k 1.8 Si = 2.9 + 0.4 22 f, = 38.1 + 1.6 SC = 3.5 f 0.3
31 f, = 47.7 * 1.9 Si = 3.2 +- 0.2 f, = 38.8 + 1.5 s, = 3.4 2 0.3
Values are means + SE.
‘Or
~60
N = 31
/
// n Simple
q Special
50 0 Complex
z b 2 A 0
Standard
is 40 OOA -iA, Complex
s A oAA 0 0 00 0
30 OoA OCD 0
20
20 30 40 50 60 70
Incoherent f 0-W
FIG. 12. For cells that oscillate under both coherent and incoherent stimulation, the frequencies of oscillation seldom correspond. With the use of the same criteria for frequency similarity as used for the summary of Fig. 10, we see that relatively few cells oscillate at the same frequency. Unlike Fig. 10, very few points fall within the diagonal region. In the majority of cases, oscillation frequency is higher for incoherent stimulation than for coherent stimulation, as indicated by cells located in the bottom right. Because of overlap, the number of distinct points is less than the total number of points.
coherent and incoherent stimulation. The mean frequency for incoherent stimulation is 47 Hz, which is significantly higher than the mean of 38 Hz seen among coherent stimu- lus oscillations (t = 4.9, P < 0.00 1) . This difference is not seen with respect to oscillation strength: S/N ratios are simi- lar for coherent and incoherent stimulation ( t = 1.9). Thus the coherence of visual stimulation seems to affect the likely frequencies of oscillatory discharge, but not its inci- dence. CONTRAST. To assess the relationship between mean firing rates and oscillatory discharge in cortical cells, gratings of varying contrast were presented monoptically and dichop- tically to 66 binocular cells. In these experiments the re- sponse selectivities to orientation, spatial frequency, and interocular phase were initially evaluated at 20% contrast in the interleaved manner described previously. Gratings of nine different contrast levels, typically from 1 to 20%, were presented either monoptically or dichoptically, for a total of 27 conditions. The contrast levels, as well as the eye or eyes to which the gratings were presented, were randomly inter- leaved. Because the response rates of cortical cells are di- rectly related to contrast levels in the stimulus, these tests provided regular response strength increments. The con- trast range was chosen to contain the contrast threshold of a given cell. Because of this, many responses had firing rates at or near those of spontaneous activity.
Among the 26 cells in this group that exhibited oscilla- tions, 15 cells displayed the strongest oscillations under monoptic, as opposed to dichoptic, stimulation. By con- trast, only 19 out of 98 cells showed a monocular preference in the comparison of binocular and monocular responses mentioned previously ( see Fig. 9 ) . This discrepancy is prob- ably due to the different contrasts used: the vast majority of the previous comparisons of monoptic and dichoptic re- sponses was made with the use of stimuli at 50% contrast. Thus monocular oscillations tend to be stronger than binoc-
OSCILLATIONS IN THE VISUAL SYSTEM 1561
ular oscillations at low, but not at high contrasts. In one case a cell’s strongest oscillations were observed under the null stimulus condition, when completely demodulated gratings (0% contrast) were presented to both eyes. Re- sponses did not show a consistent relationship between monocular or binocular contrast levels and oscillatory S/N ratios. In fact, only 4 of 26 cells exhibited oscillations at >3 of the 27 conditions studied.
To determine whether oscillations are only detectable for suprathreshold activity, monocular and binocular contrast thresholds were computed on the basis of the distinguisha- bility of contrast responses from spontaneous activity. Re- ceiver operating characteristic (ROC) analysis was used to compute the incidence of a response exceeding the null re- sponse (Green and Swets 1966; Tolhurst et al. 1983). A sigmoidal function was fit to these incidences, and the con- trast at which the fitted curve intersected with 75% inci- dence was defined as the contrast threshold. This procedure was carried out separately for the left eye, right eye, and binocular responses. For the 26 oscillatory cells, the con- trast threshold for the ocular condition (left, right, or both) at which the strongest oscillation was observed was used as the basis for comparison. The strongest oscillations were at contrasts above threshold for 16 cells, below threshold for 8 cells, and within 1% of threshold for 2 cells. Mean frequen- cies (45.7 and 38.7 Hz) and S/N ratios (3.7 and 3.5) were not significantly different for the below and above thresh- old oscillations.
Given the lack of any clear relationship between contrast levels and oscillations, all examples of oscillatory discharge were grouped together to study the possible relationship between mean firing rates and oscillatory S/N ratios for low-contrast stimuli. These data, summarized in the scatter plot of Fig. 13, suggest an inverse relationship between mean firing rate and oscillatory strength: only at lower fir- ing rates were very strong oscillations observed. For exam- ple, 17 of the 19 responses in which the S/N ratio was ~5 .O had mean firing rates of t20 spikes/s. This relationship
N=104 12- iA
A’ lo-, 1
8-A A&
6-
. I I I I I I I I I I I I
0 10 20 30 40 50 60 70 80 90 100110
- Discharge Rate (spikedsec.)
FIG. 13. Oscillatory strength is plotted vs. mean firing rates for 104 low-contrast (~20%) conditions. Included among these points are both monocular and binocular responses for 26 cells. The clustering of points in the bottom left demonstrates an inverse relationship between the incidence of strong oscillations and firing rate.
Simple Cells 80
70 ; 60
o 50 5 t
40
a 30 E 3 20
z 10
0
11,111 IV VI
Complex Cells m Oscillators Non-Oscillators
70
2 60
6 50
5 40
iii 30
f 20
z’ 10 0
Layer I Layer Layer Layer V Layer Totals 11,111 IV VI
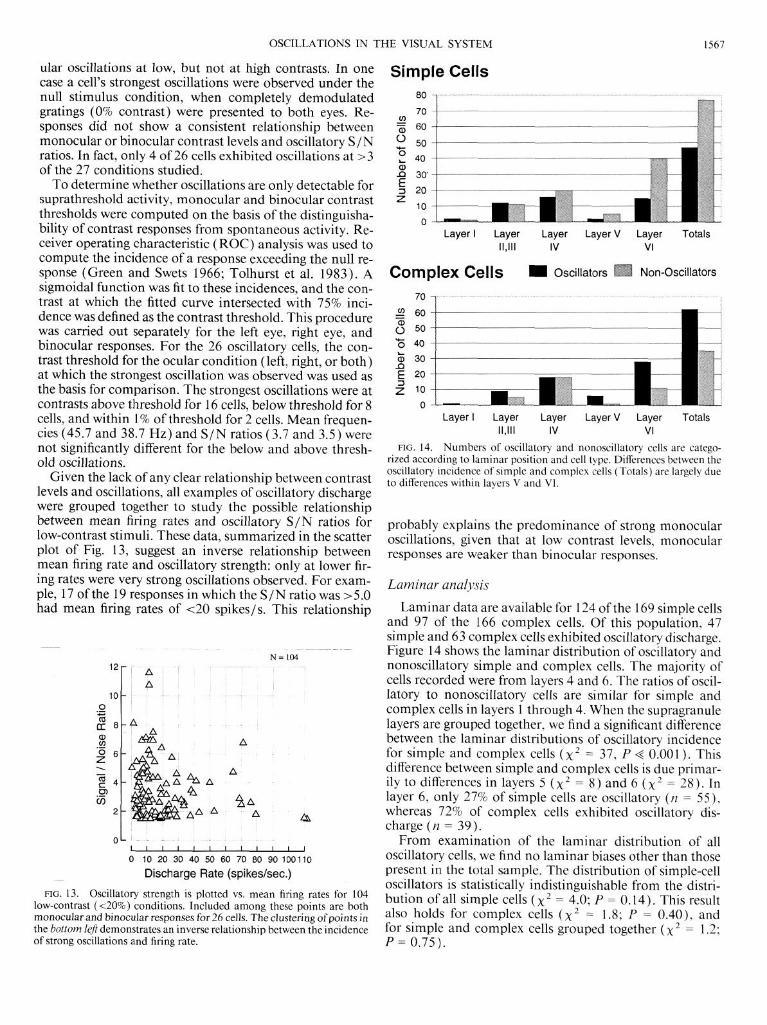
FIG. 14. Numbers of oscillatory and nonoscillatory cells are catego- rized according to laminar position and cell type. Differences between the oscillatory incidence of simple and complex cells (Totals) are largely due to differences within layers V and VI.
probably explains the predominance of strong monocular oscillations, given that at low contrast levels, monocular responses are weaker than binocular responses.
Laminar analysis
Laminar data are available for 124 of the 169 simple cells and 97 of the 166 complex cells. Of this population, 47 simple and 63 complex cells exhibited oscillatory discharge. Figure 14 shows the laminar distribution of oscillatory and nonoscillatory simple and complex cells. The majority of cells recorded were from layers 4 and 6. The ratios of oscil- latory to nonoscillatory cells are similar for simple and complex cells in layers 1 through 4. When the supragranule layers are grouped together, we find a significant difference between the laminar distributions of oscillatory incidence for simple and complex cells (x2 = 37, P < 0.001). This difference between simple and complex cells is due primar- ily to differences in layers 5 (x2 = 8) and 6 (x2 = 28). In layer 6, only 27% of simple cells are oscillatory (n = 55), whereas 72% of complex cells exhibited oscillatory dis- charge (n = 39).
From examination of the laminar distribution of all oscillatory cells, we find no laminar biases other than those present in the total sample. The distribution of simple-cell oscillators is statistically indistinguishable from the distti- bution of all simple cells (x2 = 4.0; P = 0.14). This result also holds for complex cells (x2 = 1.8; P = 0.40), and for simple and complex cells grouped together (x2 = 1.2; P = 0.75).

1568 G. M. GHOSE AND R. D. FREEMAN
Physiological cell type and the incidence of oscillations Figure 15 shows the distribution of oscillatory strengths
and frequencies exhibited by the 178 cells whose discharge was oscillatory, as judged by a S/N ratio greater than 1.5. Because only the strongest oscillation of each cell is plotted here, the data shown represent oscillations under a variety of stimulus conditions and durations for both kittens and cats. No oscillations were observed above 67 Hz with the exception of those due to screen flicker. Examination of the seven strongest cortical oscillators (S/N, >8.0) reveals only one neuron (a simple cell) whose oscillations are at a fre- quency greater than 37 Hz. No strong oscillations (S/N, >8.0) were found in either the LGN or the visual cortex between 40 and 50 Hz.
The incidence of oscillations among standard complex cells is higher (49%) than the incidence among simple cells (35%). On the basis of the laminar data presented in Fig. 14, this difference is due largely to differences in incidence within layers 5 and 6. This difference between simple and complex cells does not depend on the S/N criterion used for oscillation classification. If, for example, the S/N crite- rion is doubled to 3.0,45 complex cells ( 27%) and 30 sim- ple cells ( 18%) would be classed as oscillators.
Oscillatory frequencies and strengths for simple and complex cells show considerable overlap. In Fig. 16, distri- butions of oscillation frequencies are compared for 53 sim- ple and 62 complex cells in the adult cat. These frequency distributions are statistically different (x * = 22.4 with 5 degrees of freedom, P < 0.001). The largest component of this difference comes from the 28. to 32.Hz range ( x2 = 16.9) in which oscillations are much more likely to occur among complex cells than simple cells.
The strongest oscillations for the entire population that we studied are seen among 10 LGN cells (8 Y-cells and 2 X-cells). The oscillations for this group are an order of
40
.o l LGN 31/59
0 0 c,
a O 0 /\ Simple 601169
Special Complex
Standard Complex
821166
178/40?
Frequency (Hz)
FIG. 15. Signal-to-noise ratios and frequencies of oscillatory discharge are summarized according to cell type. Of the lateral geniculate nucleus cells studied, 10 out of 59 showed stable oscillatory .discharge that was stimulus independent. This group of cells, seen in the rap Gg/zt corner, has signal-to-noise ratios that are an order of magnitude larger than those typi- cally seen over brief periods of time with cortical cells. The frequency range and single-to-noise ratios among simple and complex cell oscillators are similar.
40 T 0 Simple (N=53)
4 30-9 - n Complex (N=62) 0 z $20-9 E g lo-
-
iI!
I
28 I 1 I 1 I 1
38 48 58 Oscillation Frequency (Hz)
I
68
FIG. 16. Distribution of oscillation frequencies is different for simple and complex cells in the adult cat. Each bin represents a ~-HZ bandwidth of frequency. Note the large difference in the lowest frequency range (28-32 Hz), in which complex cells are most likely to be found.
magnitude stronger than those of cortical cells. Moreover, in contrast to the cortical oscillations, these oscillations are very stable. All of these cells have large spontaneous rates of activity, between 20 and 40 spikes/s. Oscillations are pres- ent in both spontaneous activity and stimulus independent. Because of this, the S/N ratio of LGN oscillations de- creased with increased levels of stimulus-evoked discharge. Finally, although LGN cells show a range of oscillatory fre- quencies similar to that seen among cortical cells, all LGN oscillations with S/N ratios greater than 10 are found to have frequencies between 53 and 61 Hz.
DISCUSSION
We have studied the nature of oscillatory discharge from single cells in the LGN and striate cortex. Within the cor- tex, such discharge is variable with respect to frequency, strength, and timing relative to stimulus onset. In contrast, certain LGN cells display remarkably strong oscillations in the 50 to 60.Hz range. The presence of cortical oscillatory discharge is independent of the coherence and contrast of visual stimulation. The nature of oscillations is not depen- dent on whether the stimulation is monoptic or dichoptic. Oscillation strength in the cortex is constrained by dis- charge rate such that strongest oscillations are present in the weakest responses. Complex cells are more likely to be oscillatory than simple cells, especially in the midfrequency range around 40 Hz. Furthermore, there are developmental differences in this frequency range in that midrange oscilla- tors are rarer in the kitten than in the adult. When all fre- quencies between 30 and 80 Hz are examined, oscillatory discharge does not have a laminar bias nor is it restricted to physiological cell types within the visual cortex.
Stimulus dependence
Models of oscillatory activity in the visual cortex have been developed with variability as a key component (Eck- horn et al. 1988; Gray et al. 1992a). For example, Gray et al. ( 1992a), observing the variable phase and short dura- tion of local field-potential oscillations, have proposed that such variability is an important substrate through which rapid pattern recognition takes place. This proposal as- sumes that oscillations are stimulus dependent, which our single-cell data do not support. However, even if a stimulus
OSCILLATIONS IN THE VISUAL SYSTEM 1569
dependency exists among single cells or populations of neu- rons, variability places a limit on the reliable discrimination of oscillatory responses. For an ideal observer looking at a pattern of activity, variability limits the amount of stimulus information that can be conveyed by oscillations, because there is little consistency between the pattern and stimulus features. It is difficult to suggest that oscillations could be strictly encoding visual parameters, given that the oscilla- tions are neither reliable in relation to the stimulus nor consistent with respect to duration, frequency, and strength.
Although our data contain no evidence for stimulus de- pendencies, it is possible that single-cell oscillations are de- pendent on attributes not tested here. Cortical cell sensitiv- ity to parameters such as stimulus orientation, spatial fre- quency, binocularity, and contrast is welI established with the use of the metric of mean firing rate. It is possible, how- ever, that oscillations are dependent on visual parameters that do not affect firing rate. Such an open-ended scenario is very difficult to study unless a model provides guidance as to what stimulus dependencies to examine or unless some extant data suggest stimulus dependencies. After the trigger feature hypothesis (Barlow 1972)) that the presence of strong firing enables the conveyance of information, a logical way to look for such dependencies is to examine attributes that have been implicated as functionally signifi- cant on the basis of firing rate selectivity. As shown here, no such data exist; nor is there any convincing model pointing to a testable stimulus dependency. Moreover, the inverse relationship between firing rate and oscillation strength shows that oscillations are most detectable when there is less, rather than more, neural discharge. This relationship is similar to that seen in single cells within the somatosensory cortex of an alert monkey (Ahissar and Vaadia 1990). For these oscillatory cells, oscillations were only present in the spontaneous activity; they were completely suppressed with effective tactile stimuli.
In the only previous systematic study of binocularity and oscillations, Gray et al. concluded, on the basis of 9 out of 16 recordings, that binocular stimulation enhances oscilla- tory responses (Gray et al. 1990). Because this study used drifting bars for visual stimulation, a temporal overlap of PSTH records was used to align receptive fields for the two eyes. This method was only partially successful; 10 out of 26 cells showed no temporal overlap. The Gray et al. exper- iments, in contrast to the interocular phase experiments conducted here, were also unable to systematically vary bin- ocular stimulation. Another complication is the small sam- ple size, which, because of oscillatory variability, constrains any generalization of their findings. The importance of sam- ple size is borne out by the fact that the Gray et al. study finds no cells for which monocular oscillations are stronger than those occurring under binocular stimulation. For our sample of 98 cells, 38 cells showed stronger oscillations under binocular stimulation, whereas 34 cells showed just the opposite. The finding here concerning the lack of any relationship between interocular phase and oscillations makes it additionally unlikely that oscillations could serve to encode binocular information.
The dependence of oscillations on the coherence of vi- sual stimuli is relevant to models in which these oscillations
serve to link visual features. The data of our study have been obtained from a large sample size by the use of sinusoi- dal gratings, which are truly coherent stimuli of single spa- tial and temporal frequencies. It is also possible that the 20.Hz signal, which is present in the incoherent stimuli because of the regularity of bar presentation, can influence oscillatory discharge. It is unlikely, however, that the oscil- lations observed are a direct result of the 20.Hz signal be- cause shuffle subtraction was performed, and (as shown in Fig. 12) that there is no particularly tendency for oscillatory frequencies to be clustered around the harmonic frequen- cies of 20 Hz (i.e., 40 and 60 Hz). Our results suggest that neither the incidence of oscillatory discharge nor the strength of oscillations depends on the coherence of visual stimuli.
When attempting to reconcile the current data with those published previously, it is important to keep in mind the fundamental differences in the methods of analysis. As shown in Fig. 4, the method of fitting damped sinusoids (Gabor function) has its limitations. According to the crite- ria of previous studies, an autocorrelogram is indicative of oscillations if the amplitude of this fitting function exceeds the standard error of the fit by a factor of two or more (Gray and Singer 1989; Engel et al. 1990a). Another method used was to measure the modulation of the initial peak and trough within the autocorrelogram (Gray et al. 1990). Both of these techniques fail to quantitatively measure oscilla- tion strength relative to noise. This introduces possible am- biguity into comparisons between different cells and differ- ent stimulus conditions. A spike train classed as oscillatory on the basis of the fit of a l-cycle sinusoid can be classed as nonoscillatory with the use of the power spectra method. A spike train containing pairs of spikes of a specific interspike interval might not contain a consistent series of these pairs. By emphasizing the first peak of the autocorrelation func- tion, previous fitting methods would lead to the classifica- tion of this spike train as oscillatory even though its auto- correlogram is bimodal and not multimodal.
Another analytic difference is the subtraction of shuffled autocorrelograms. Because no periodicities were found in shuffled autocorrelograms, previous investigators judged these correlograms to be inconsequential (Gray and Singer, 1989) and performed curve fitting without shuffle subtrac- tion. However, even if shuffled autocorrelograms contain no periodicities, they can still reveal stimulus-locked effects that would alter the nature of periodicities in raw correlo- grams if subtracted. For example, a noisy shuffled auto- correlogram could increase the amount of noise when sub- tracted from the raw autocorrelogram. Thus oscillation analysis based on autocorrelograms without shuffle sub- traction is potentially inaccurate.
An experimental difference between the current study and previous investigations of cortical oscillations is the use of CRT monitors to provide visual stimulation. Previous studies have generally used bar stimuli illuminated by a DC light source (Gray and Singer 1989; Gray et al. 1990; Engel et al. 199 la,b). This raises the possibility that the flicker rate of our CRT displays somehow modifies the oscillatory behavior of the neurons we studied. For several reasons, we believe it is unlikely that the high-frequency signal asso- ciated with CRT flicker affects oscillatory discharge. First,
1570 G. M:GHOSE AND R. D. FREEMAN
although cells within the LGN are able to respond to the refresh rate of our CRTs (76 Hz), cortical cells seldom re- spond to temporal frequencies above 10 Hz. Furthermore, any direct effect of CRT flicker on neuronal discharge is eliminated by shuffle subtraction (see Fig. 2). As shown in Fig. 15, very few cells, after shuffle subtraction, exhibit any oscillations at frequencies above 60 Hz, and many strong oscillations are seen at - 30 Hz. Although low-frequency signals can create high-frequency harmonics, the 76.Hz fre- quency of CRT refreshing could affect the lower frequency oscillations studied here only in the presence of gross tem- poral nonlinearities. If such nonlinear mechanisms are commonplace, then CRT flicker should cause an increase of low-frequency discharge in a large proportion of cells for all conditions because CRTs were used in all the tests de- scribed here. However, no such consistency was observed. Because each trial was locked to CRT refresh, even if non- linear mechanisms behaved in a variable fashion, their ef- fects should be locked to stimulus presentation and there- fore be eliminated by shuffle subtraction. Finally, because oscillatory activity was observed among certain cells, CRT flicker clearly does not eliminate oscillatory discharge. Al- though CRT flicker could still affect the stimulus depen- dence of oscillations without altering the frequency or vari- ability of the oscillations themselves, there is no evidence that stimulus dependencies, as measured by the metric of firing rate (e.g., in the case of contrast sensitivity), are af- fected by the use of CRT monitors.
Despite the differences between the methods of our study and those of previous investigations, the nature of oscilla- tory discharge reported here is, in some respects, consistent with previous studies. For example, the frequency range of oscillations and the incidence of oscillations among com- plex cells is in general agreement with a previous study ex- amining the relationship between receptive-field type and the incidence of oscillation (Gray et al. 1990). This suggests that, despite the arbitrary nature of the criteria used in both the power spectra and Gabor function methods, there is general agreement concerning the physiological and lami- nar occurrence of oscillatory cells. It also suggests that oscil- latory discharge is not likely to be generated by or severely disrupted by the high-frequency flicker of CRT monitors.
Physiological cell type and location
There is a dramatic difference, however, between our re- sults and those previously reported concerning the inci- dence of oscillations among simple cells. In the study of Gray et al., only 12% of simple cells are oscillatory (Gray et al. 1990); our data indicate that 36% of simple cells can show oscillatory discharge. In the previous work the spatial overlap of ON and OFF regions as revealed by manually con- trolled bars was used, as opposed to the degree of modula- tion to sinusoidal gratings, as the basis for distinguishing between simple and complex cells. However, differences in the method of receptive-field classification cannot totally account for this discrepancy because the total incidence of oscillations among all cortical cells is also different. In the Gray et al. study, 39 out of 143 cells were found to be oscil- latory (27%), whereas in the current study 147 out of 342 cortical cells were classed as showing some oscillation
(43%). Although this difference is not enormous, it is diffi- cult to explain given the fact that the lack of shuffling and the emphasis on the primary peaks of autocorrelograms are likely to lead to oscillatory classifications in cases where the power spectra method does not, and would therefore result in higher incidences of oscillatory activity being reported. One possibility is that methods that emphasize a single in- terspike interval are insensitive to oscillations when the fir- ing rate is low and therefore lead to underestimates of oscil- latory incidence.
The difference in the incidence of oscillatory discharge among simple cells probably accounts for the discrepancy between the laminar distribution shown here and that of a previous study (Gray et al. 1990). In the previous study, only 2 out of 15 cells in layer 4, and 7 out of 27 layer 6 cells were oscillators, whereas in this study 34 out of 72 layer 4, and 43 out of 94 layer 6 cells exhibited oscillations. Finally, no data are presented in the previous study to distinguish the laminar distribution of simple and complex oscillatory cells.
Although the sample size is limited in our study, the prev- alence of oscillations within layer 5 is consistent with the previous laminar report. In our study, six out of seven com- plex cells show oscillatory discharge, and five of these oscil- late at 29 Hz. These low-frequency oscillations can be very strong, ranging up to 12.2 in signal to noise. These findings are particularly interesting given the finding of lower fre- quency spontaneous oscillations within layer 5 (Silva et al. 1991).
Differences in analysis or classification also fail to ac- count for the discrepancy in the LGN data. Several investi- gators have reported oscillatory cells in the LGN (Amett 1975; Bishop et al. 1964; Munemori et al. 1984). Both the percentage of oscillatory cells and the nature of the dis- charge seen in our study are consistent with these previous reports. For example, previous studies found these oscilla- tions to be a characteristic of spontaneous activity, which is stimulus independent. Given that all studies report a rela- tively small incidence of these oscillatory cells among the LGN population (around 20%)) Gray and Singer’s failure to find such cells might be due to minimal sampling. Gray and Singer do not mention how systematically, or for how many cells, LGN firing was examined (Gray and Singer 1989).
Bishop et al. ( 1964) first suggested that the oscillations seen in the LGN reflect spontaneous oscillations within the retina. Spontaneous oscillatory discharge among rabbit and cat retinal ganglion cells has been observed in several stud- ies (Ariel et al. 1983; Barlow et al. 1964; Kuffler 1953). A subclass of retinal ganglion cells in the cat, called Q-cells, which are similar in physiological properties to Y-cells, dis- play strong coherent oscillations in the same frequency range as those observed in the LGN (Robson and Troy 1987). These oscillations are quantitatively identical in terms of S/N to those observed in the LGN (unpublished observations). Oscillations in the LGN could potentially be traced back to amacrine cells, given that certain amacrine cells of the catfish retina produce spontaneous oscillations at - 35 Hz in frequency (Sakai and Naka 1990) and that amacrine cells are thought to contribute oscillatory poten- tials in the mudpuppy retina (Wachtmeister and Dowling
OSCILLATIONS IN THE VISUAL SYSTEM
1978 ) . It is also possible that the LGN oscillations observed here might largely reflect the intrinsic oscillatory properties of certain LGN cells.
Are cortical oscillations driven by LGN oscillations? Given the strength of the LGN oscillations, models that
depend on the absence of geniculate oscillations must be questioned. Several models relying on intracortical interac- tions require rather specific patterns of connectivity (Cot- terill and Nielsen 199 1; Eckhorn et al. 1989; Grossberg and Somers 199 1; Schuster and Wagner 1990; Sporns et al. 1989). Additionally, these models are based on notions of stimulus encoding that seem unlikely given the current evi- dence. A much simpler model is one in which extrinsic oscillations from the LGN are primarily responsible for the oscillations seen within the cortex, as shown in Fig. 17.
Variable oscillations in the cortex would arise if oscilla- tions of LGN cells are independent or weakly dependent on each other. The stimulus independence of LGN oscillations would, in turn, result in stimulus-independent cortical oscillations. In the model illustrated in Fig. 18, a pair of nearby cortical cells oscillate when an appropriate number of their LGN inputs are oscillating. The strength of cellular oscillations is depicted in this figure by the spreads seen in the interspike interval distributions. For strongly oscillatory cells, intervals between successive spikes vary around a mean interval that is the inverse of the oscillation fre- quency. LGN cells oscillating at 50 Hz therefore have a narrow distribution of spike intervals centered around 20 ms. If the interspike intervals from each of these oscillatory cells vary over time independently, each cell’s discharge can be considered an independent random process. A cortical cell that discharges according to the sum of its LGN inputs
256 ms.
FIG. 17. Oscillations originating from the spontaneous activity of a subpopulation of cells in the retina propagate through the central visual pathway. Autocorrelograms on the right were obtained from single-unit recordings in the retina (A ) (Robson and Troy 1987), lateral geniculate nucleus (B), and visual cortex ( C) .
I): 8 s g 2 iit d 2
Time - Time -
Time -+
1571
Inter-Spike Intervals
LGN
~ 20 ms.
ILL Cortex
2d ms.
FIG. 18. In this model, oscillatory lateral geniculate nucleus (LGN) cells are responsible for cortical oscillations. Cells in the LGN either oscil- late independently (black circles) or do not oscillate (white circles). Band- width of the interspike interval histogram reflects the consistency and co- herence of oscillatory discharge. In this model the narrow range of inter- spike intervals seen in the top right reflects the coherent 50-Hz oscillation of a single LGN cell. The broader spread of interspike intervals exhibited by a cortical cell is shown in the bottom right. Cortical cells (gray) are less coherent oscillators because their responses are governed by the integra- tion of asynchronous oscillatory inputs (black) and non-oscillatory inputs (white). Oscillations of the 2 cortical cells are synchronized because they receive common oscillatory input.
would therefore exhibit weak oscillations because the vari- ance of the sum is larger than that of any individual input. Because of the retinotopic organization of geniculate affer- ents, nearby cortical cells would tend to receive the same pool of oscillatory input and therefore would oscillate in phase with one another.
Such a model is only feasible if nearby LGN oscillations are not tightly coupled. We have observed nonsynchronous discharge between two oscillatory LGN cells recorded from the same electrode. Cross-correlation analysis of the dis- charges reveals that one cell tended to fire 4 ms after the discharge of the other cell. Because both cells oscillated at a frequency of 53 Hz, one cycle of oscillation was 19 ms in duration. The two neurons therefore oscillated with a tem- poral phase difference of 76”. Asynchronous oscillations were also seen by Arnett in the cross-correlation analysis of the discharge of two LGN cells with overlapping receptive fields (Arnett 1975). These neurons oscillated with a tem- poral phase difference of 36” (2 ms over 20 ms/cycle). Given such asynchrony, there would be only brief periods in which multiple geniculate oscillators could provide input sufficiently in phase to evoke rhythmic cortical discharge.
LGN oscillations are independent of visual stimulation, and therefore their effects on the cortex are also stimulus independent. Oscillations are not observed in the normal spontaneous activity of cortical cells because of the very low rates of spontaneous activity seen in the cortex. However, once the stimulus strength is raised just enough to evoke neural firing, as in the contrast experiments of our study, oscillations become apparent. These oscillations become weaker as the stimulus strength is raised because of the great contribution of visually dependent input to the cortical dis- charge. One possible explanation is that spontaneous
1572 G. M. GHOSE AND R. D. FREEMAN
subthreshold oscillations exist within neurons whose influ- ence on discharge is only visible when the threshold is reached by visual stimulation.
It is also possible that neurons with intrinsically oscilla- tory properties contribute to the oscillations observed here. Cortical neurons with intrinsic oscillatory properties have been observed in several intracellular studies. Intracellular recording of neurons within layer 4 of guinea pig frontal cortex slices has revealed the presence of subthreshold oscil- lations in the 10 to 45.Hz range (Llinas et al. 199 1). Tha- lamocortical cells can also exhibit subthreshold oscillations between 20 and 40 Hz when appropriately depolarized (Steriade et al. 199 1). In both cases these oscillations can give rise to action potentials. Thus it is possible that intrin- sic oscillators exist at all levels of the visual system, from retina to cortex. One dramatic example of intrinsic oscilla- tory activity is found in layer 5 pyramidal neurons of mouse cortex, in which 5- to 12.Hz rhythmic firing for periods up to 20 s can be triggered by spontaneous or evoked postsyn- aptic potentials (Silva et al. 199 1). The intrinsically oscilla- tory nature of certain cortical cells might be responsible for many instances of oscillatory discharge. This is especially true for those cells that oscillate at ~30 Hz in frequency (unpublished observations).
Oscillatory synchrony If LGN cells are the primary source of cortical oscilla-
tions, the greatest oscillatory synchrony should be observed within small cortical areas. This is because cells in retinoto- pit proximity are the most likely to share geniculate inputs (Tusa et al. 1975). A recent study of the synchrony of oscil- lations over different cortical distances showed that dis- tance, rather than similarity of orientation sensitivity, is the strongest determinant of rhythmic synchrony (Engel et al. 1990a). The largest proportion of synchronous oscillations occurred for cells within 2 mm of each other, and, for cells within this distance, the similarity of orientation selectivity had no effect on the chances of synchronous discharge. This is the same distance as the cortical divergence of a single point from the LGN, as determined histologically by antero- grade staining (Win et al. 1989). Given the relatively local nature of oscillations, the divergence of LGN input to the cortex likely provides the most parsimonious mechanism for synchronous oscillations over small distances.
There are cases for which oscillatory synchrony, or any synchrony for that matter, is clearly dependent on intracor- tical connections. For example, synchronized interhemi- spheric oscillations have been observed (Engel et al. 199 1 a) despite a conduction delay of -4 ms across the corpus cal- losum (Harvey 1980). One possibility is that inhibitory in- temeurons contribute to synchronization (Crick and Koch 1990). Appropriate combinations of excitatory short-range and long-range interactions will also synchronize oscilla- tory cells (Sompolinsky et al. 1990). However, the fact that cortical circuitry exists that influences synchronous firing within the cortex does not necessarily imply that oscilla- tions themselves are generated within the cortex. For exam- ple, oscillations could be generated precortically and propa- gated to the cortex, where intracortical connections (Schwarz and Bolz 199 1; T’so et al. 1986) could synchro- nize oscillations across large distances. Horizontal section- ing of mouse cortex slices reveals that layer 5, where such
long-range connections can be found, is both necessary and sufficient to produce synchronized oscillations in other layers (Silva et al. 199 1).
Oscillation frequencies
Engel et al. reported a unimodal distribution of frequen- cies seen in multiunit discharge around 50 Hz, with very few oscillations below 40 Hz or above 60 Hz (Engel et al. 1990a). This is in contrast to the single-unit data presented here, which show a broad distribution of oscillatory fre- quencies. One possibility is that nearby cells, such as would be recorded from a multiunit electrode, are less likely to oscillate in phase at these lower frequencies. Multiunit activ- ity does not necessarily reflect single-unit discharge; peaks can arise both from the discharge of individual neurons and the summation of potentials produced by several neurons simultaneously. For example, rhythmic activity can be seen at a frequency of 300 Hz in multiunit recording but not in single-unit recording in the extrastriate cortex (Reinis et al. 1988). Another possibility is that, because bars are more incoherent than gratings, the data of Engel et al. more closely correspond to that of reverse correlation data than to data obtained with the use of gratings. The mean oscilla- tory frequency of 49 Hz reported in the Engel et al. study more closely matches the mean seen with incoherent stim- uli (47 Hz) than it does the mean seen with coherent stimu- lation (38 Hz). The relative inability of bars to evoke low- frequency oscillations might explain these differences in frequency distribution.
The difference in oscillatory frequencies that we have found between kittens and cats could be explained in two ways by the LGN model described above. The immaturity of neurotransmitter distribution (Shaw et al. 1986) and ef- ficacy (Tsumoto et al. 1987) in kittens could affect cortical cell firing thresholds or the integration of geniculate inputs. Additionally, the relative immaturity of geniculate affer- ents could change the distribution of input that cortical cells receive (Kato et al. 1983; Tsumoto and Suda 1982). One important point is that, although the nature of oscilla- tions changes with development, the existence of oscilla- tions is not dependent on postnatal maturation. This has been confirmed by local field-potential recordings from the kitten’s visual cortex (Gray and Singer 1989). This suggests the possibility that strong oscillations might be present in the retina and LGN of 4-wk postnatal kittens just as they are in the adult. Although spontaneous activity has been observed prenatally in the rat (Galli and -Maffei 1988), the developmental time course of the intrinsic oscillations de- scribed by Robson and Troy ( 1987) for the cat retina is unknown.
Potential functional roles of oscillatory activity
The incidence of oscillations among different cell groups as well as the strength and frequency of these oscillations can be accounted for by a model that relies on the nature of LGN input to the cortex (unpublished observations). By incorporating the oscillatory discharge of the LGN, LGN divergence, and the existence of intrinsic oscillators within the cortex, oscillations in cortical discharge that are consis- tent with the data can be generated without any reliance on intracortical connections. It should be noted that. even if
OSCILLATIONS IN THE VISUAL SYSTEM 1573
cortical networks are not responsible for the generation of oscillations, oscillations might still play an important func- tional role. For example, Crick has suggested that rapid bursting in the geniculate might serve as an internal atten- tional spotlight that scans over the representations of ob- jects in the cortex (Crick 1984). It is possible that the oscil- lations observed in the LGN play a role in visual attention or awareness that cannot be revealed in an anesthetized preparation (Crick and Koch 1990). For example, 36.Hz waves seen in the electrocorticograms of behaving cats are dependent on levels of attention and noradrenergic activity (Delagrange et al. 1989). If oscillations are highly depen- dent on alertness, then differences in anesthesia protocols might help explain the differences in oscillatory incidence mentioned previously, because Gray et al. used halothane as their anesthesia, as opposed to Surital and N,O (Gray et al. 1990).
Oscillations within an appropriately connected network in primary visual cortex could provide a means for higher order neurons to segregate features (von der Malsburg and Schneider 1986). In this manner extrastriate cortical net- works might modify or modulate these oscillations to en- code information. There is, however, uncertainty over whether synchronized oscillatory discharge would be partic- ularly effective in coding features. Although von der Mals- burg and Schneider proposed a scheme in which burst syn- chronization provides a means of segregating auditory pat- terns (the “cocktail-party effect”), their scheme does not explicitly depend on the presence of rhythmic discharge (von der Malsburg and Schneider 1986 ) . In fact, a simula- tion of oscillatory patterns in the visual cortex indicates that coding or segregating visual features on the basis of oscilla- tion phase would lead to many ambiguous classifications (Noest and Koenderink 199 1). One potential problem in trying to encode features with oscillations that are distrib uted over large cortical regions is that oscillations of the same frequency but different phases are likely to either can- cel one another or to completely synchronize (Crick and Koch 1990).
Oscillatory spontaneous activity in the retina could also provide cues for activity-dependent refinements within the developing visual system. It has been shown that the sup- pression of retinal activity through tetrodotoxin injection can prevent eye-specific segregation within the LGN (Sre- tavan et al. 1988) and ocular dominance column segrega- tion within the cortex (Stryker and Harris 1986). Spontane- ous activity has been shown to be correlated between nearby cells in the immature rat (Mtiei and Galli-Resta 1990) and ferret retina (Meister et al. 199 1). Furthermore, low-frequency bursting activity has been observed in the LGN of immature rabbits ( Rapisardi et al. 1975 ) . If oscilla- tions in retinal spontaneous activity are present prenatally, they could therefore serve as a very stable signal for refining the connections in LGN and cortex. In this case, oscilla- tions observed in the mature animal may simply be the remnant of a developmental process.
The attentional and developmental significance of oscil- lations in the central visual pathway can be explored with further experiments. The set of experiments described here has focused specifically on the potential of cortical oscilla- tions to convey visual information and on the mechanism by which oscillations are generated. The stimulus inder>en-
dence and inverse firing rate dependence of oscillations in the LGN and visual cortex suggest that oscillations in sin- gle-unit discharge may be an epiphenomenon of retinal spontaneous activity and may not depend on properties of visual stimulation.
We thank I. Ohzawa and G. DeAngelis for assistance in the collection of the data used here and for helpful comments on the manuscript. A. Anzai and D. Cai also helped with the data collection. We thank W. Singer and C. Gray for detailed comments on the manuscript.
This work was supported by National Eye Institute Grant EY-O 1175 and CORE Grant EY-03176 and by a collaborative project of the Human Frontiers Science Program.
Address for reprint requests: R. D. Freeman, 360 Minor Hall, School of Optometry, University of California, Berkeley, CA 94720.
Received 2 1 January 1992; accepted in final form 1 July 1992.
REFERENCES
AHISSAR, E. AND VAADIA, E. Oscillatory activity of single units in a somato- - sensory cortex of an awake monkey and their possible role in texture
analysis. Proc. Natl. Acad. Ski. USA 87: 8935-8939, 1990. ARIEL, M., DAW, N. W., AND RADER, R. K. Rhythmicity in rabbit retinal
ganglion cell responses. Vision Res. 23: 1485-1493, 1983. ARNETT, D. W. Correlation analysis in the cat dLGN (Abstract). Exp.
Brain Res. 24: 130, 1975. BARLOW, H. B. Single units and sensation: a neuron doctrine for percep
tual psychology? Perception 1: 37 l-394, 1972. BARLOW, H. B., HILL, R. M., AND LEVICK, W. R. Retinal ganglion cells
responding selectively to direction and speed of image motion in the rabbit. J. Physiol. Land. 173: 377-407, 1964.
BISHOP, P. O., LEVICK, W. R., AND WILLIAMS, W. 0. Statistical analysis of the dark discharge of lateral geniculate neurons. J. Physiol. Land. 170: 598-612, 1964.
COTTERILL, R. M. J. AND NIELSEN, C. A model for cortical 40 Hz oscilla- tions involves interarea interactions. Neuroreport 2: 289-292, 199 1.
CRICK, F. Function of the thalamic reticular complex: the searchlight hy- pothesis. Proc. Natl. Acad. Sci. USA 8 1: 4586-4590, 1984.
CRICK, F. AND KOCH, C. Some reflections on visual awareness. Cold Spring Harbor Symp. Quant. Biol. 55: 953-962, 1990.
DELAGRANGE, P., TADJER, D., B~UYER, J. J., ROUGEUL, A., AND CONRATH, M. Effect of DSP4, a neurotoxic agent, on attentive be- haviour and related electrocortical activity in cat. Behav. Brain Res. 33: 33-43, 1989.
DICHTER, M. A. AND AYAU, G. F. Cellular mechanisms of epilepsy: a status report. Science Wash. DC 237: 157-164, 1987.
ECKHORN, R., BAUER, R., JORDAN, W., BROSCH, M., KRUSE, W., MUNK, M., AND REITBOECK, H. J. Coherent oscillations: a mechanism of fea- ture linking in the visual cortex? Biol. Cybern. 60: 12 l- 130, 1988.
E~KHORN, R., REITBOECK, H. J., ARNDT, M., AND DICKE, P. A neural network for feature linking via synchronous activity: results from cat visual cortex and from simulations. In: Models of Brain Function, edited by R. M. J. Cotter-ill. Cambridge Univ. Press, 1989.
ENGEL, A. K., K~NIG, P., GRAY, C. M., AND SINGER, W. Stimulusde- pendent neuronal oscillations in cat visual cortex: inter-columnar in- teraction as determined by cross-correlation analysis. Eur. J. Neurosci. 2: 588-606, 1990a.
ENGEL, A. K., K~NIG, P., KREITER, A. K., GRAY, C. M., AND SINGER, W. Temporal coding by coherent oscillations as a potential solution to the binding problem: physiological evidence. In: Nonlinear Dynamics and Neural Networks, edited by H. G. SCHUSTER AND W. SINGER. New York: VCH Weinheim, In press.
ENGEL, A. K., K~NIG, P., KREITER, A. K., AND SINGER, W. Interhemi- spheric synchronization oscillatory neuronal responses in cat visual cortex. Science Wash. DC 252: 1177- 1179, 199 la.
ENGEL, A. K., KREITER, A. K., K~NIG, P., AND SINGER, W. Synchroniza- tion of oscillatory neuronal responses between striate and extrastriate visual cortical areas of the cat. Proc. Nat/. Acad. Sci. USA 88: 6048- 6052, 1991b.
ENROTH-CUGELL, C. AND ROBSON, J. G. The contrast sensitivity of retinal ganglion cells of the cat. J. Physiol. Land. 187: 5 17-552, 1966.
FREEMAN, W. J. AND SKARDA, C. A. Spatial EEG patterns, non-linear dynamics and perception: the neo-Sherringtonian view. Brain Res. Rev. 10: 147-175. 1985.
1574 G. M. GHOSE AND R. D. FREEMAN
FREEMAN, W. J. AND VAN DIJK, B. W. Spatial patterns of visual cortical fast EEG during conditioned reflex in a rhesus monkey. Brain Res. 422: 267-276, 1987.
GALLI, L. AND MAFFEI, L. Spontaneous impulse activity of rat retinal ganglion cells in prenatal life. Science Wash. DC 242: 90-9 1, 1988.
GRAY, C. M., ENGEL, A. K., K~NIG, P., AND SINGER, W. Synchronization of oscillatory neuronal responses in cat striate cortex: temporal proper ties. Vis. Neurosci. 8: 337-347, 1992a.
GRAY, C. M., ENGEL, A. K., K~NIG, P., AND SINGER, W. Mechanisms underlying the generation of neuronal oscillations in cat visual cortex. In: Induced Rhythms in the Brain, edited by T. Bulloch and E. Basar. Boston: Berkhauser, 1992b, p. 29-45.
GRAY, C. M., ENGEL, A. K., K~NIG, P., AND SINGER, W. Stimulus-depen- dent neuronal oscillations in cat visual cortex: receptive field properties and feature dependence. Eur. J. Neurosci. 2: 607-6 19, 1990.
GRAY, C. M., K~NIG, P., ENGEL, A. K., AND SINGER W. Oscillatory responses in cat visual cortex exhibit inter-columnar synchronization which reflects global stimulus properties. Nature Lond. 338: 334-337, 1989.
GRAY, C. M. AND SINGER, W. Stimulus-specific neuronal oscillations in orientation columns of cat visual cortex. Proc. Natl. Acad. Sci. USA 86: 1698-1702, 1989.
GREEN, D. M. AND SWETS, J. A. Signal Detection Theory and Psychophys- ics. New York: Wiley, 1966.
GROSSBERG, S. AND SOMERS, D. Synchronized oscillations during coopera- tive feature linking in a cortical model of visual perception. Neural Net- works 4: 453-466, 199 1.
HARVEY, A. R. A physiological analysis of subcortical and commisural projections of areas 17 and 18 of the cat. J. Physiol. Lond. 302: 507-534, 1980.
HUBEL, D. H. AND WIESEL, T. N. Receptive fields of cells in striate cortex of very young, visually inexperienced kittens. J. Neurophysiol. 26: 994- 1002, 1963.
JACKLET, J. W. (Editor). Neuronal and Cellular Oscillators. New York: Dekker, 1989.
JONES, J. P. AND PALMER, L. A. An evaluation of the two dimensional Gabor filter model of simple receptive fields in cat striate cortex. J. Neurophysiol. 58: 1233- 1258, 1987.
KATO, N., KAWAGUCHI, S., YAMAMOTO, T., SAMEJIMA, A., AND MIYATA, H. Postnatal development of the geniculocortical projection in the cat: electrophysiological and morphological studies. Exp. Brain Res. 5 1: 65- 72, 1983.
KUFFLER, S. W. Discharge patterns and functional organization of mam- malian retina. J, Neurophysiol. 188: 285-307, 1953.
LAUFER, M. AND VEFUEANO, M. Periodic activity in the visual system of the cat. Vision Res. 7: 2 15-229, 1967.
LLIN~S, R. R., GRACE A. A., AND YAROM, Y. In vitro neurons in mam- malian cortical layer 4 exhibit intrinsic oscillatory activity in the lo- to 50-Hz frequency range. Proc. Natl. Acad. Sci. USA 88: 897-901, 199 1.
MAFFEI, L. AND GALLI-RESTA, L. Correlation in the discharges of neigh boring rat retinal ganglion cells during prenatal life. Proc. Natl. Acad. Set’. USA 87: 286 l-2864, 1990.
MEISTER M., WONG, R. 0. L. BAYLOR, D. A., AND SHATZ, C. J. Synchro- nous bursts of action potentials in ganglion cells of the developing mam- malian retina. Science Wash. DC 252: 939-943, 199 1.
MELSSEN, W. J. AND EPPING, *W. J. M. Detection and estimation of neural connectivity based on crosscorrelation analysis. Biol. Cybern. 57: 403- 414, 1987.
MUNEMORI, J., HARA, K., KIMURA, M. AND SATO, R. Statistical features of impulse trains in cat’s lateral geniculate neurons. Biol. Cybern. 50: 167-172, 1984.
NOEST, A. J. AND KOENDERINK J. J. Do coherent oscillations help or hinder feature linking (Abstract)? Invest. OphthaZmoZ. Visual Sci. Suppl. 32: 907, 199 1.
OHZAWA, I. AND FREEMAN, R. D. The binocular organization of complex cells in the cat’s visual cortex. J. Neurophysiol. 56: 243-259, 1986.
OHZAWA, I., SCLAR, G., AND FREEMAN, R. D. Contrast gain control in the cat’s visual system. J. Neurophysiol. 54: 65 l-667, 1985.
OLSON, C. R. AND FREEMAN, R. D. Profile of the sensitive period for monocular deprivation in kittens. Exp. Brain Res. 38: 17-2 1, 1980.
PERKEL, D. H., GERSTEIN, G. L., AND MOORE, G. P. Neuronal spike trains and stochastic point processes. II. Simultaneous spike trains. Biophys. J. 7: 419-440, 1967.
PRESS W. H., FLANNERY B. P., TEUKOLSKY, S. A., AND VETTERLING, W. T. Numerical Recipes in C: the Art of Scientific Computing. New York: Cambridge Univ. Press, 1988.
RAPISARDI, S. C., CHOW, K. L., AND MATHERS, L. H. Ontogenesis of receptive field characteristics in the dorsal lateral geniculate nucleus of the rabbit. Exp. Brain Res. 22: 295-305, 1975.
REINIS, S. WEISS, D. S., AND LANDOLT, J. P. Mass correlograms of multi- ple neuronal activity in the cat’s extrastriate cortex. Biol. Cybern. 59: 163-107, 1988.
ROBSON, J. G. AND TROY, J. B. Nature of the maintained discharge of Q, X, and Y retina ganglion cells of the cat. J. Opt. Sot. Am. A 4: 2301- 2307, 1987.
SAKAI, H. M. AND NAKA, K. Dissection of the neuron network in the catfish inner retina. V. Interactions between NA and NB amacrine cells. J. Neurophysiol. 63: 120-l 30 1990.
SALIN, P. A., BULLIER, J., AND KENNEDY, H. Convergence and divergence in the afferent projections to cat area 17. J. Comp. Neural. 283: 486- 512, 1989.
SCHILD, D. AND SCHULTENS, H. A. The Fourier transform of a peristimu- lus time histogram can lead to erroreous results. Brain Res. 369: 353- 355, 1986.
SCHUSTER, H. G. AND WAGNER, P. A model for neuronal oscillation in the visual cortex. 1. Mean-field theory and derivation of the phase equation. Biol. Cybern. 64: 77-82, 1990.
SCHWARZ, C. AND BOLZ, J. Functional specificity of a long-range horizon- tal connection in cat visual cortex: a cross-correlation study. J. Neurosci. 11: 2995-3007, 199 1.
SHAW, C., WILKINSON, M., CYNADER, M., NEEDLER, M. C., AOKI, C., AND HALL, S. E. The laminar distributions and postnatal development of neurotransmitter and neuromodulator receptors in cat visual cortex. Brain Res. Bull. 16: 66 l-67 1, 1986.
SILVA, L. R., AMITAI, Y ., AND CONNORS, B. W. Intrinsic oscillations of neocortex generated by layer 5 pyramidal neurons. Science Wash. DC 251: 432-435, 1991.
SINGER, W. The formation of cooperative cell assemblies in the visual cortex. J. Exp. Biol. 153: 177- 197, 1990a.
SINGER, W. Search for coherence: a basic principle of cortical self-organi- zation. Concepts Neurosci. 1: l-26, 1990b.
SOMPOLINSKY H., GOLOMB, D., AND KLEINFELD, D. Global processing of visual stimuli in a neural network of coupled oscillators. Proc. Natl. Acad. Sci. USA 87: 7200-7204, 1990.
SPORNS, O., GALLY, J. A., REEKE, G. N., JR., AND EDELMAN, G. M. Reen- trant signaling among simulated neuronal groups leads to coherency in their oscillatory activity. Proc. Natl. Acad. Sci. USA 86: 7265-7269, 1989.
STRETAVAN, D. W., SHATZ, C. J., AND STRYKER, M. P. Modification of retinal ganglion cell axon morphology by prenatal infusion of tetrodo- toxin. Nature Lond. 336: 468-47 1, 1988.
STERIADE, M., CURRY Dow, R., PAR&, D., AND OAKSON, G. Fast oscilla- tions (20-40 Hz) in thalamocortical systems and their potentiation by mesopontine cholinergic nuclei in the cat. Proc. Natl. Acad. Sci. USA 88: 4396-4400, 199 1.
STRYKER, M. P. AND HARRIS, W. A. Binocular impulse blockade prevents the formation of ocular dominance columns in cat visual cortex. J. Neurosci. 6: 2117-2133, 1986.
TOLHURST, D. J., MOVSHON, J. A., AND DEAN, A. F. The statistical reliabil- ity of signals in single neurons in cat and monkey visual cortex. Vision Res. 23: 775-785, 1983.
T’so, D. Y., GILBERT, C. D., AND WIESEL, T. N. Relationships between horizontal interactions and functional architecture in cat striate cortex as reveal by cross-correlation analysis. J. Neurosci. 6: 1160- 1170, 1986.
TSUMOTO, T., HAGIHARA, K., SATO, H., AND HATA, Y. NMDA receptors in the visual cortex of young kittens are more effective than those of adult cats. Nature Lond. 327: 5 13-5 14, 1987.
TSUMOTO T. AND SUDA, K. Laminar differences in development of tier- ent innervation to striate cortex neurones in kittens. Exp. Brain Res. 45: 433-446, 1982.
TUSA, R. J., PALMER, L. A., AND ROSENQUIST, A. C. The retinotopic organization of area 17 (striate cortex) in the cat. J. Comp. Neural. 177: 213-236, 1975.
VON DER MALSBURG, C. AND SCHNEIDER, W. A neural cocktail-party pro- cessor. Biol. Cybern. 54: 29-40, 1986.
WACHTMEISTER, L. AND D~WLING, J. E. Oscillatory potentials of the mud puppy retina. Invest. Ophthal. Vis. Sci. 17: 1176-l 188, 1978.


![DECAY PROPERTIES OF MULITILINEAR OSCILLATORY ......1.1 Oscillatory integrals of the rst kind We now introduce oscillatory integrals of the rst kind, in the terminology of Stein[20],](https://img.pdfslide.us/doc/110x75/60aa5dc8aaf04e43a832d30f/decay-properties-of-mulitilinear-oscillatory-11-oscillatory-integrals-of.jpg)