Embed Size (px)
Citation preview
General rights Copyright and moral rights for the publications made accessible in the public portal are retained by the authors and/or other copyright owners and it is a condition of accessing publications that users recognise and abide by the legal requirements associated with these rights.
Users may download and print one copy of any publication from the public portal for the purpose of private study or research.
You may not further distribute the material or use it for any profit-making activity or commercial gain
You may freely distribute the URL identifying the publication in the public portal If you believe that this document breaches copyright please contact us providing details, and we will remove access to the work immediately and investigate your claim.
Downloaded from orbit.dtu.dk on: Dec 31, 2020
Oscillatory Behavior during the Catalytic Partial Oxidation of Methane: FollowingDynamic Structural Changes of Palladium Using the QEXAFS Technique
Stoetzel, Jan; Frahm, Ronald; Kimmerle, Bertram; Nachtegaal, Maarten; Grunwaldt, Jan-Dierk
Published in:Journal of Physical Chemistry Part C: Nanomaterials and Interfaces
Link to article, DOI:10.1021/jp2052294
Publication date:2012
Document VersionPublisher's PDF, also known as Version of record
Link back to DTU Orbit
Citation (APA):Stoetzel, J., Frahm, R., Kimmerle, B., Nachtegaal, M., & Grunwaldt, J-D. (2012). Oscillatory Behavior during theCatalytic Partial Oxidation of Methane: Following Dynamic Structural Changes of Palladium Using the QEXAFSTechnique. Journal of Physical Chemistry Part C: Nanomaterials and Interfaces, 116(1), 599-609.https://doi.org/10.1021/jp2052294
Published: November 07, 2011
r 2011 American Chemical Society 599 dx.doi.org/10.1021/jp2052294 | J. Phys. Chem. C 2012, 116, 599–609
ARTICLE
pubs.acs.org/JPCC
Oscillatory Behavior during the Catalytic Partial Oxidation ofMethane:Following Dynamic Structural Changes of Palladium Using theQEXAFS TechniqueJan St€otzel,*,† Ronald Frahm,† Bertram Kimmerle,‡ Maarten Nachtegaal,§ and Jan-Dierk Grunwaldt*,||,^
†Fachbereich C�Physik, Bergische Universit€at Wuppertal, Gaussstr. 20, D-42097 Wuppertal, Germany‡Gutenbergstr. 35, CH-3011 Bern, Switzerland§Paul-Scherrer-Institut (PSI), CH-5232 Villigen, Switzerland
)Institute for Chemical Technology and Polymer Chemistry, Karlsruhe Institute of Technology (KIT), Kaiserstr. 12, D-76128 Karlsruhe,Germany^Department of Chemical and Biochemical Engineering, Technical University of Denmark, Building 229, DK-2800 Kgs. Lyngby,Denmark
bS Supporting Information
1. INTRODUCTION
Kinetic oscillations during heterogeneous catalytic processesare a well-known and well-studied effect, which is observable onsingle-crystal surfaces as well as on industrially relevant sup-ported particles with diameters of a few nanometers.1�7 Manytheoretical models to describe such oscillations were developedin the past and refined several times during the last three decades.In theoretical approaches, oscillations are suggested to appear innarrow ranges of reactant gas pressure, which correspond tobistable regions close to the transition lines in surface phasediagrams, as can, for example, be calculated with density func-tional theory.8 This was confirmed experimentally and width ofsuch bistable regions was observed as hysteresis in the rate ofconversion depending on the direction of changes in reactantpressure.9,10 Within the bistable regions, an additional, relatively
slow process is determining the temporal character of theoscillations, which is suggested to be adsorbate-induced surfacerestructuring,11 oxide formation,12 or carbon deposition,13 asalso summarized by Zhdanov.9 Recently, it was shown that theregions of bistability become smaller with an increasing numberof defects, such as steps and edges, so that oscillations and chaoticphenomena are pronounced in the case of very small particles.10
Moreover, it was shown that smoothing and roughening of thecatalytically active surface have to be considered as decisiveparameters for kinetic oscillations.14
Received: June 3, 2011Revised: October 19, 2011
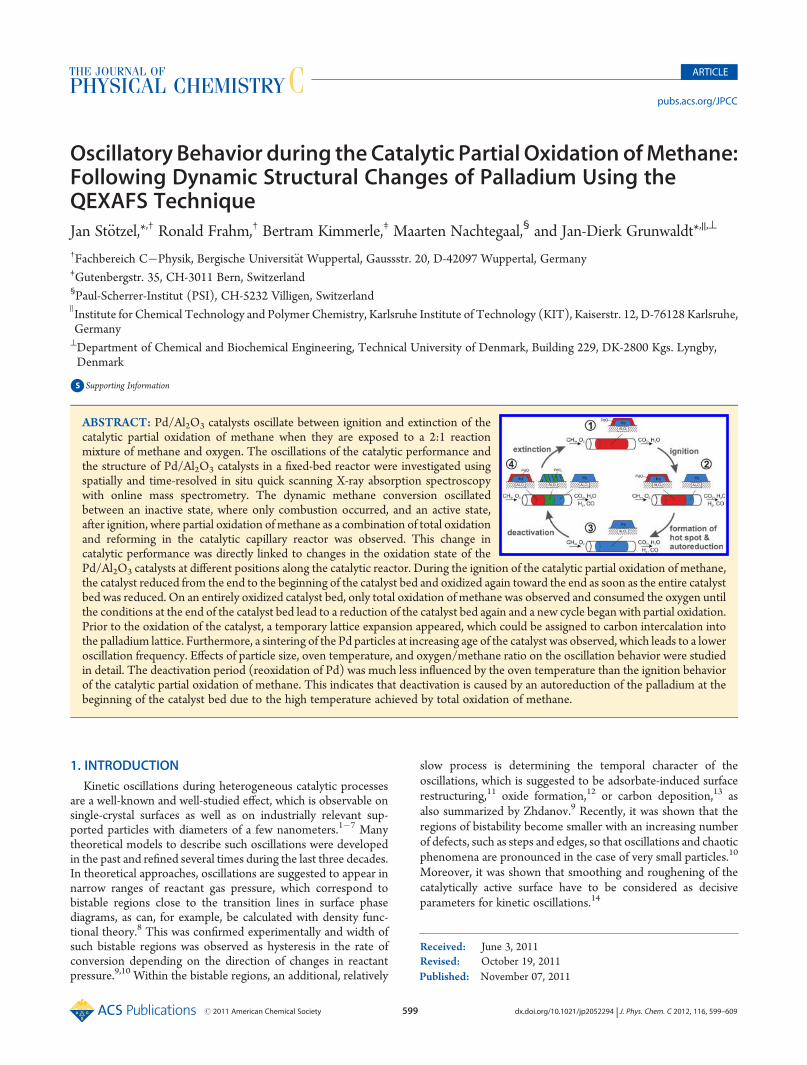
ABSTRACT: Pd/Al2O3 catalysts oscillate between ignition and extinction of thecatalytic partial oxidation of methane when they are exposed to a 2:1 reactionmixture of methane and oxygen. The oscillations of the catalytic performance andthe structure of Pd/Al2O3 catalysts in a fixed-bed reactor were investigated usingspatially and time-resolved in situ quick scanning X-ray absorption spectroscopywith online mass spectrometry. The dynamic methane conversion oscillatedbetween an inactive state, where only combustion occurred, and an active state,after ignition, where partial oxidation of methane as a combination of total oxidationand reforming in the catalytic capillary reactor was observed. This change incatalytic performance was directly linked to changes in the oxidation state of thePd/Al2O3 catalysts at different positions along the catalytic reactor. During the ignition of the catalytic partial oxidation of methane,the catalyst reduced from the end to the beginning of the catalyst bed and oxidized again toward the end as soon as the entire catalystbed was reduced. On an entirely oxidized catalyst bed, only total oxidation of methane was observed and consumed the oxygen untilthe conditions at the end of the catalyst bed lead to a reduction of the catalyst bed again and a new cycle began with partial oxidation.Prior to the oxidation of the catalyst, a temporary lattice expansion appeared, which could be assigned to carbon intercalation intothe palladium lattice. Furthermore, a sintering of the Pd particles at increasing age of the catalyst was observed, which leads to a loweroscillation frequency. Effects of particle size, oven temperature, and oxygen/methane ratio on the oscillation behavior were studiedin detail. The deactivation period (reoxidation of Pd) was much less influenced by the oven temperature than the ignition behaviorof the catalytic partial oxidation of methane. This indicates that deactivation is caused by an autoreduction of the palladium at thebeginning of the catalyst bed due to the high temperature achieved by total oxidation of methane.
600 dx.doi.org/10.1021/jp2052294 |J. Phys. Chem. C 2012, 116, 599–609
The Journal of Physical Chemistry C ARTICLE
Although there are many studies about kinetic oscillations incatalysis, most theoretical and experimental approaches, as, forexample, all the ones that are referred to above, were performedfor the important catalytic reactions that deal with the oxidationof CO and NO.Many ideas can be adapted to the catalytic partialoxidation of methane, but most of them depend on the specificproperties of the appearing absorbents, whichmakes it difficult togeneralize them for other catalytic experiments. Moreover, manyexperimental studies were carried out under idealized conditions,while nonlinear terms can play a role in macroscopic systems,such as catalytic reactors, where, for example, temperature orconcentration gradients appear. Real working catalysts andconditions imply supported particles with a diameter of a fewnanometers in gas streams at normal or elevated pressure andelevated temperatures.15�21 This drastically reduces the numberof feasible characterization tools, since most of them requireeither vacuum conditions, for example, for electron detection, orlong-range lattice orders, for example, for diffraction techniques.Here, X-ray absorption spectroscopy (XAS) has proven to be aninvaluable approach for such systems.16,20�28 The extendedX-ray absorption fine structure (EXAFS) region yields informa-tion on the local order (up to ∼6 Å) of the catalytically activespecies. Because the oscillations are a dynamic process, typicallyon the second scale, only time-resolved EXAFS techniques areusable here. These have been previously used to study oscilla-tions, for example, during the oxidation of CO on Pd,29 during thepartial oxidation of methane over supported Pd-particles,30 and,more recently, during the extinction of CO conversion on a Ptcatalyst used for CO oxidation.31 We will apply the quick-scanning EXAFS (QEXAFS) technique32,33 to study stableoscillations on a Pd/Al2O3 catalyst during catalytic partial oxi-dation (CPO) of methane. The QEXAFS technique in com-bination with spectra averaging has recently proven to yield gooddata quality for EXAFS analysis in experiments with the same5 wt % Pd/Al2O3 catalyst as used in the present work.34
As an alternative to steam reforming, the CPO ofmethane is ofinterest to the gasoline-producing industry to make use ofresidual methane appearing, for example, during oil production,and also for mobile applications, such as the on-board generationof synthesis gas for fuel-cell-driven cars.36,37 The overall reactionscheme for the CPO of methane is
CH4 þ 0:5O2 T CO þ 2H2; ΔH0 ¼ �35:9 kJ mol�1
Oscillatory behavior during methane combustion was ob-served on a variety of transition-metal catalysts38,39 besides Pd,which is the one investigated here. One of the first reports onoscillations during the oxidation of methane on Pd was publishedby K€onig et al.40 Since then, several studies of kinetic oscillationsduring the oxidation of methane were carried out.41�46 However,few of these were based on supported catalysts and none of themused QEXAFS as an in situ technique to resolve the structure ofthe catalyst at different stages during the oscillations.
An important conclusion of our recent study, where we com-bined XAS, IR thermography, and mass spectroscopy (MS), wasthat the structure of the catalyst depends on both the time duringone oscillation period and the position in the reactor.30 In thisprevious study, only integral structural information was obtained.Hence, here, the QEXAFS technique with a ca. 100�200 μmhorizontal spatial resolution was used to provide structuralinformation as a function of time and as a function of positionin the reactor. A large parameter space was taken into account to
investigate the effect of temperature, aging, gas flow, and gascomposition on the oscillations.
2. EXPERIMENTAL METHODS
2.1. Catalyst Samples and Catalytic Experiments. Twodifferent Pd catalysts were used. A commercial 5 wt % Pd/Al2O3
(Johnson Matthey 324; mean particle size of 3.4 nm; as deter-mined by TEM) and a 5 wt % Pd/Al2O3 catalyst that was pre-pared by flame spray pyrolysis (denoted FSP catalyst). The particlesize of the FSP catalyst on similar samples was determined to be2�4 nmwith TEM. To prepare the FSP catalyst, first, a solution ofPd(II) acetylacetonate (purum, Fluka) and Al(III) acetylaceto-nate (99%, ABCR) in a freshly mixed solution of 50/50 (v/v)methanol and, second, acetic acid was sprayed into a methaneoxygen flame via a nozzle.47,48 In each case, 40 mL of thecorresponding solution was fed by a syringe pump (Inotech,50 mL syringe, 3 mL min�1) into the center of a methane/oxygen flame ring. Approximately 50 cm above the flame, a steelvessel containing a cylindrical filter was mounted. Productparticles were collected on a glass fiber filter (Whatman GF/A,26 cm in diameter) with the help of a vacuum pump. The inner22 cm of the filter was scraped off using a spatula. The powderwas pressed, crushed, and sieved to fractions between 100 and200 μm for the spectroscopic/catalytic experiments. The cata-lysts were then loaded as a fixed bed (about 5 mg) in a quartzcapillary (Markr€ohrchen, Hilgenberg GmbH, 1 mm diameter,wall thickness of 20 μm) with a gas inlet and outlet. The reactorwas mounted on a gas blower, which provided heating of thesample. The setup has been described in more detail in ref 26.The reaction mixture for most of the reported experiments was3% O2/6% CH4/He, excluding the series of measurements withvarying gasmixtures, as referred to further below. Flow rates wereadjusted by mass flow controllers (Brooks) and checked at theoutlet of the reactor before the experiment by a gas flow meter(7-gas flow meter, Raczek). The sample temperature was mea-sured just below the capillary via a thermocouple. The capillaryreactor was connected to a mass spectrometer for online gasanalysis (Balzers Thermostar).2.2. QEXAFS Measurements. All QEXAFS measurements
were performed at the SuperXAS beamline49 of the Swiss LightSource (SLS, Villigen, Switzerland). The polychromatic radia-tion of the 2.9 T supercooled bending magnet was collimatedwith a Pt-coated mirror before it was monochromatized by doublereflection from a Si(311) channel-cut crystal. The crystal wasmounted on the oscillating tilt table inside the QEXAFS mono-chromator working with excenter mechanics.50 A crystal oscilla-tion frequency of 1 Hz yielded continuously two spectra eachsecond collected at the Pd K edge, one with increasing energy,followed by the decreasing scan to the start energy. The fixedexcenter disk installed in the QEXAFS mechanics yielded anenergy range from 24.19 to 26.02 keV for each spectrum. Asecond Pt-coated toroidal mirror was used to focus the beamonto the capillary with the catalyst located between two ioniza-tion chambers each 15 cm in length. The first chamber was filledwith Ar, the second with Kr, both at ambient pressure and with1.5 kV connected to the chamber plates mounted with a gap of10 mm. An additional long ionization chamber (30 cm) filledwith argon was used tomeasure a Pdmetal foil behind the secondchamber simultaneously with the sample to get an absolutecalibration point for the energy scale of the sample spectra. Toget accurate energy values relative to this point, the angle of the
601 dx.doi.org/10.1021/jp2052294 |J. Phys. Chem. C 2012, 116, 599–609
The Journal of Physical Chemistry C ARTICLE
crystal inside theQEXAFSmonochromator wasmeasured simul-taneously with each absorption value using a fast angular en-coder.51,52
2.3. Data Analysis. The rather extended range of about 2 keVof the QEXAFS spectra yielded moderate photon statistics andhad to be compensated for by averaging/smoothing proceduresover several spectra, which leads to a reduced effective time reso-lution. Averaging over five spectra proved to be sufficient to studymost effects of interest. More advanced techniques had to beapplied to achieve a better signal-to-noise ratio while maintaininga reasonable time resolution, which is explained below. Dataanalysis was carried out with homemade software mainly basedon scripting and the IFEFFIT code.53 With E0 fixed at 24.355keV, the pre- and postedge were fitted before the χ(k) wasextracted via the AUTOBK algorithm and k3-weighted. There-after, FEFF6 was used to calculate phase and amplitude functionsof the different scattering paths54 as required for the EXAFSanalysis, which was typically carried out within a Kaiser-Besselwindow in k-space from 1.6 to 11.9 Å�1 and within a Kaiser-Bessel window in R-space from 1.2 to 3.2 Å. The S0
2 reductionfactor required to calculate the exact coordination numbers wasdetermined to be 0.81(5) by fitting the first shell of the Pd metalfoil spectra measured as a reference, where the nearest-neighborcoordination number is set to 12 for the fcc structure. For thelinear combination analysis (LCA), which was also carried outwith the IFEFFIT code, the spectra were normalized and fittedwithin the near-edge range of 24.325�24.405 keV with referencespectra that were normalized in the same way. The E0 was keptfixed for the LCA, and the resulting weights were forced to sumup to 100%. To find the number of statistically significantindependent components, a principal component analysis (PCA)was performed. As a pure mathematical approach to reveal cor-relations in the data, the PCA, in contrast to the LCA, does notrely on references. Two factor retention decision criteria wereapplied to the PCA results. The first was to compare the results tothe ones of a second PCA, performed on a data matrix of thesame dimension as the one including the measured data, butinstead filled with random noise (parallel analysis).55 The secondone is achieved by fitting the tail of the sorted eigenvalues andconsidering only the first values that lie above this fit as significant(scree plot).56
3. RESULTS AND DISCUSSION
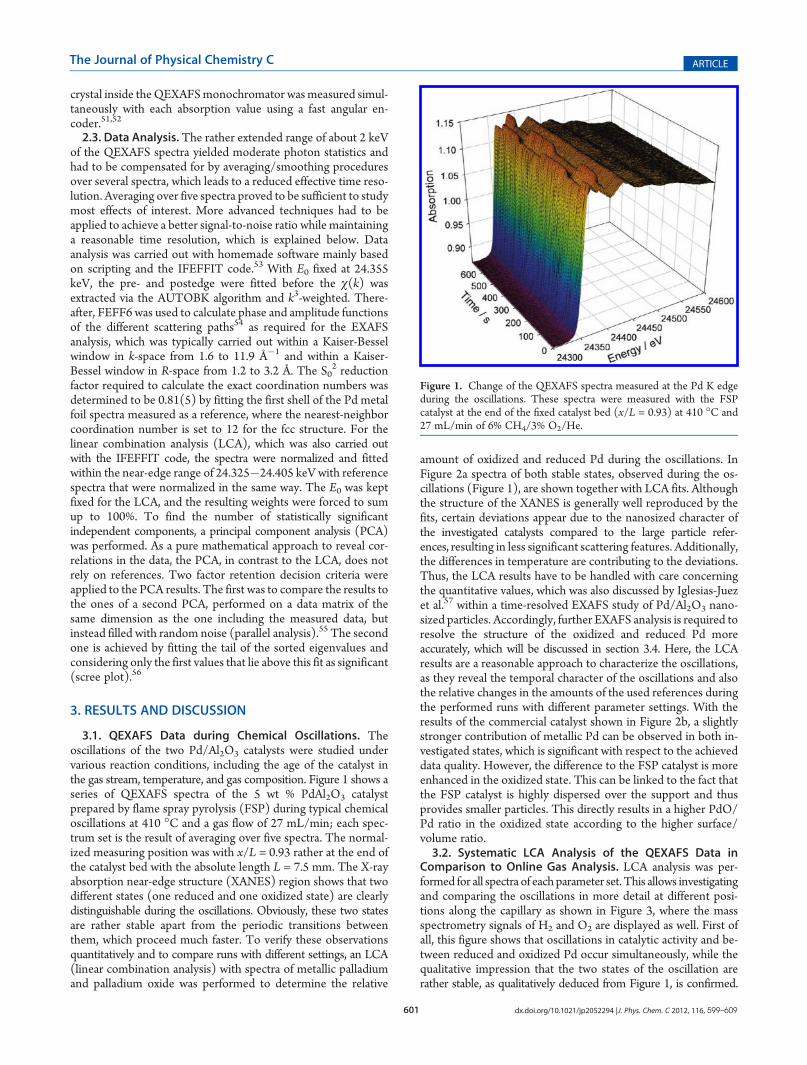
3.1. QEXAFS Data during Chemical Oscillations. Theoscillations of the two Pd/Al2O3 catalysts were studied undervarious reaction conditions, including the age of the catalyst inthe gas stream, temperature, and gas composition. Figure 1 shows aseries of QEXAFS spectra of the 5 wt % PdAl2O3 catalystprepared by flame spray pyrolysis (FSP) during typical chemicaloscillations at 410 �C and a gas flow of 27 mL/min; each spec-trum set is the result of averaging over five spectra. The normal-ized measuring position was with x/L = 0.93 rather at the end ofthe catalyst bed with the absolute length L = 7.5 mm. The X-rayabsorption near-edge structure (XANES) region shows that twodifferent states (one reduced and one oxidized state) are clearlydistinguishable during the oscillations. Obviously, these two statesare rather stable apart from the periodic transitions betweenthem, which proceed much faster. To verify these observationsquantitatively and to compare runs with different settings, an LCA(linear combination analysis) with spectra of metallic palladiumand palladium oxide was performed to determine the relative
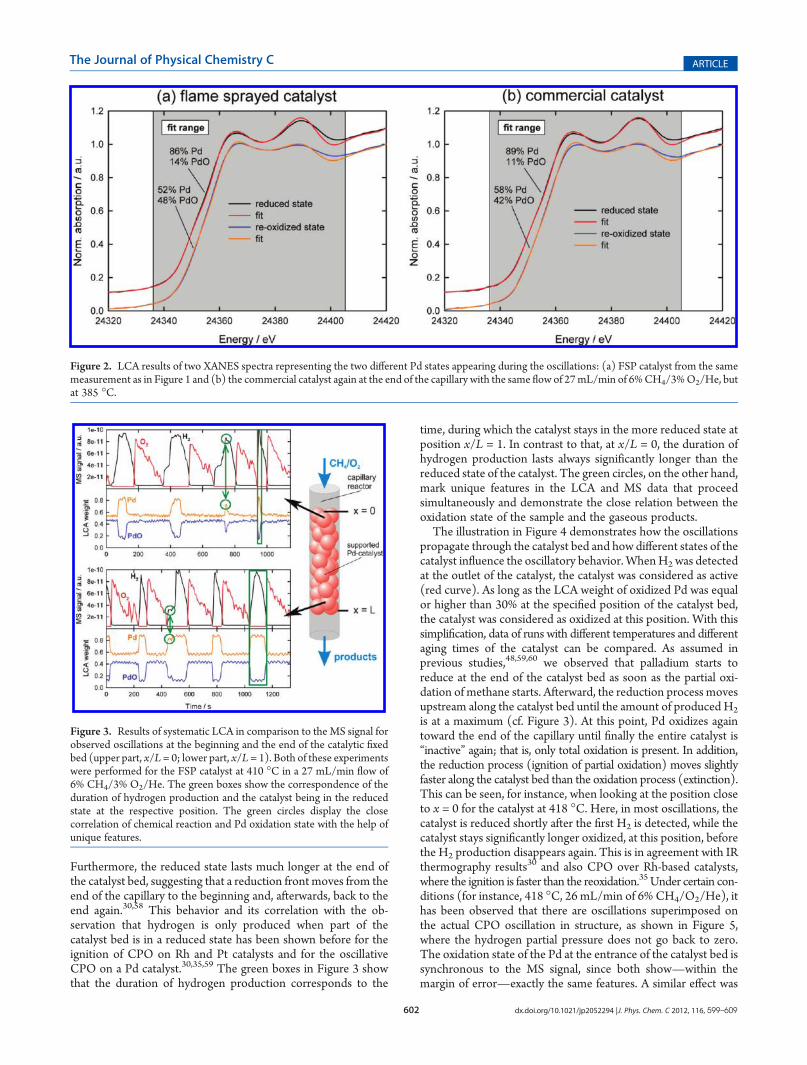
amount of oxidized and reduced Pd during the oscillations. InFigure 2a spectra of both stable states, observed during the os-cillations (Figure 1), are shown together with LCA fits. Althoughthe structure of the XANES is generally well reproduced by thefits, certain deviations appear due to the nanosized character ofthe investigated catalysts compared to the large particle refer-ences, resulting in less significant scattering features. Additionally,the differences in temperature are contributing to the deviations.Thus, the LCA results have to be handled with care concerningthe quantitative values, which was also discussed by Iglesias-Juezet al.57 within a time-resolved EXAFS study of Pd/Al2O3 nano-sized particles. Accordingly, further EXAFS analysis is required toresolve the structure of the oxidized and reduced Pd moreaccurately, which will be discussed in section 3.4. Here, the LCAresults are a reasonable approach to characterize the oscillations,as they reveal the temporal character of the oscillations and alsothe relative changes in the amounts of the used references duringthe performed runs with different parameter settings. With theresults of the commercial catalyst shown in Figure 2b, a slightlystronger contribution of metallic Pd can be observed in both in-vestigated states, which is significant with respect to the achieveddata quality. However, the difference to the FSP catalyst is moreenhanced in the oxidized state. This can be linked to the fact thatthe FSP catalyst is highly dispersed over the support and thusprovides smaller particles. This directly results in a higher PdO/Pd ratio in the oxidized state according to the higher surface/volume ratio.3.2. Systematic LCA Analysis of the QEXAFS Data in
Comparison to Online Gas Analysis. LCA analysis was per-formed for all spectra of each parameter set. This allows investigatingand comparing the oscillations in more detail at different posi-tions along the capillary as shown in Figure 3, where the massspectrometry signals of H2 and O2 are displayed as well. First ofall, this figure shows that oscillations in catalytic activity and be-tween reduced and oxidized Pd occur simultaneously, while thequalitative impression that the two states of the oscillation arerather stable, as qualitatively deduced from Figure 1, is confirmed.
Figure 1. Change of the QEXAFS spectra measured at the Pd K edgeduring the oscillations. These spectra were measured with the FSPcatalyst at the end of the fixed catalyst bed (x/L = 0.93) at 410 �C and27 mL/min of 6% CH4/3% O2/He.
602 dx.doi.org/10.1021/jp2052294 |J. Phys. Chem. C 2012, 116, 599–609
The Journal of Physical Chemistry C ARTICLE
Furthermore, the reduced state lasts much longer at the end ofthe catalyst bed, suggesting that a reduction front moves from theend of the capillary to the beginning and, afterwards, back to theend again.30,58 This behavior and its correlation with the ob-servation that hydrogen is only produced when part of thecatalyst bed is in a reduced state has been shown before for theignition of CPO on Rh and Pt catalysts and for the oscillativeCPO on a Pd catalyst.30,35,59 The green boxes in Figure 3 showthat the duration of hydrogen production corresponds to the
time, during which the catalyst stays in the more reduced state atposition x/L = 1. In contrast to that, at x/L = 0, the duration ofhydrogen production lasts always significantly longer than thereduced state of the catalyst. The green circles, on the other hand,mark unique features in the LCA and MS data that proceedsimultaneously and demonstrate the close relation between theoxidation state of the sample and the gaseous products.The illustration in Figure 4 demonstrates how the oscillations
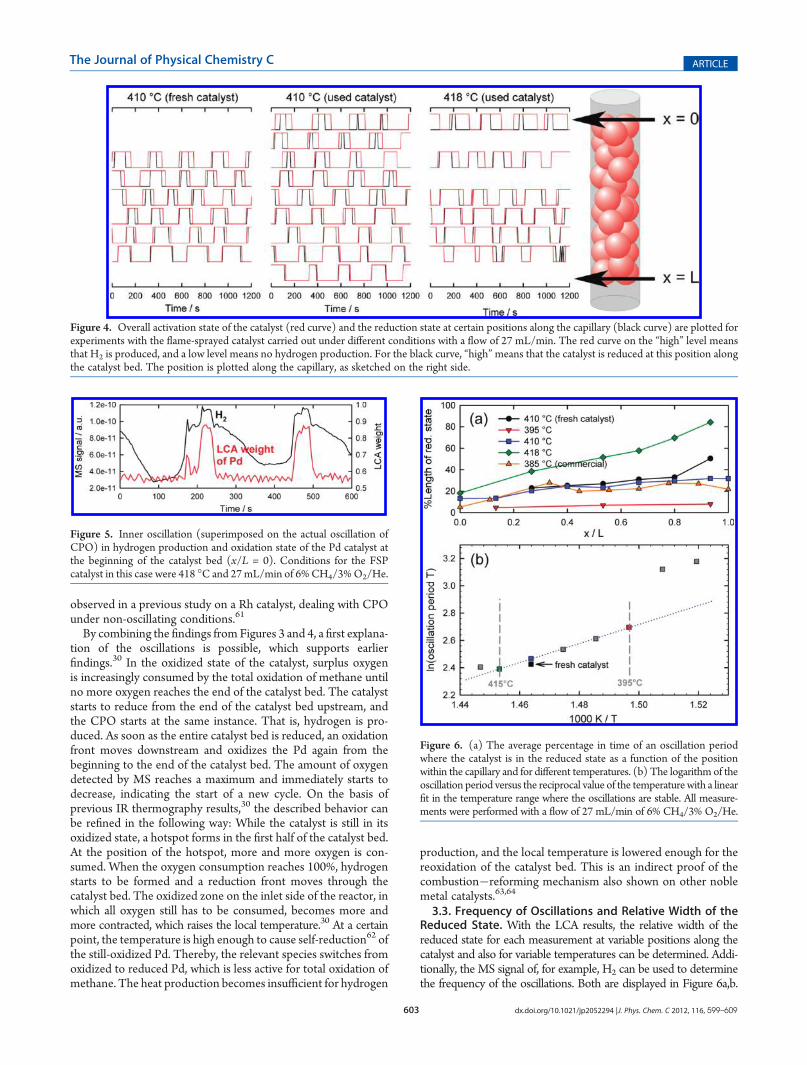
propagate through the catalyst bed and how different states of thecatalyst influence the oscillatory behavior. WhenH2was detectedat the outlet of the catalyst, the catalyst was considered as active(red curve). As long as the LCA weight of oxidized Pd was equalor higher than 30% at the specified position of the catalyst bed,the catalyst was considered as oxidized at this position. With thissimplification, data of runs with different temperatures and differentaging times of the catalyst can be compared. As assumed inprevious studies,48,59,60 we observed that palladium starts toreduce at the end of the catalyst bed as soon as the partial oxi-dation of methane starts. Afterward, the reduction process movesupstream along the catalyst bed until the amount of produced H2
is at a maximum (cf. Figure 3). At this point, Pd oxidizes againtoward the end of the capillary until finally the entire catalyst is“inactive” again; that is, only total oxidation is present. In addition,the reduction process (ignition of partial oxidation) moves slightlyfaster along the catalyst bed than the oxidation process (extinction).This can be seen, for instance, when looking at the position closeto x = 0 for the catalyst at 418 �C. Here, in most oscillations, thecatalyst is reduced shortly after the first H2 is detected, while thecatalyst stays significantly longer oxidized, at this position, beforethe H2 production disappears again. This is in agreement with IRthermography results30 and also CPO over Rh-based catalysts,where the ignition is faster than the reoxidation.35Under certain con-ditions (for instance, 418 �C, 26 mL/min of 6% CH4/O2/He), ithas been observed that there are oscillations superimposed onthe actual CPO oscillation in structure, as shown in Figure 5,where the hydrogen partial pressure does not go back to zero.The oxidation state of the Pd at the entrance of the catalyst bed issynchronous to the MS signal, since both show—within themargin of error—exactly the same features. A similar effect was
Figure 2. LCA results of two XANES spectra representing the two different Pd states appearing during the oscillations: (a) FSP catalyst from the samemeasurement as in Figure 1 and (b) the commercial catalyst again at the end of the capillary with the same flow of 27mL/min of 6%CH4/3%O2/He, butat 385 �C.
Figure 3. Results of systematic LCA in comparison to the MS signal forobserved oscillations at the beginning and the end of the catalytic fixedbed (upper part, x/L = 0; lower part, x/L = 1). Both of these experimentswere performed for the FSP catalyst at 410 �C in a 27 mL/min flow of6% CH4/3% O2/He. The green boxes show the correspondence of theduration of hydrogen production and the catalyst being in the reducedstate at the respective position. The green circles display the closecorrelation of chemical reaction and Pd oxidation state with the help ofunique features.
603 dx.doi.org/10.1021/jp2052294 |J. Phys. Chem. C 2012, 116, 599–609
The Journal of Physical Chemistry C ARTICLE
observed in a previous study on a Rh catalyst, dealing with CPOunder non-oscillating conditions.61
By combining the findings fromFigures 3 and 4, a first explana-tion of the oscillations is possible, which supports earlierfindings.30 In the oxidized state of the catalyst, surplus oxygenis increasingly consumed by the total oxidation of methane untilno more oxygen reaches the end of the catalyst bed. The catalyststarts to reduce from the end of the catalyst bed upstream, andthe CPO starts at the same instance. That is, hydrogen is pro-duced. As soon as the entire catalyst bed is reduced, an oxidationfront moves downstream and oxidizes the Pd again from thebeginning to the end of the catalyst bed. The amount of oxygendetected by MS reaches a maximum and immediately starts todecrease, indicating the start of a new cycle. On the basis ofprevious IR thermography results,30 the described behavior canbe refined in the following way: While the catalyst is still in itsoxidized state, a hotspot forms in the first half of the catalyst bed.At the position of the hotspot, more and more oxygen is con-sumed. When the oxygen consumption reaches 100%, hydrogenstarts to be formed and a reduction front moves through thecatalyst bed. The oxidized zone on the inlet side of the reactor, inwhich all oxygen still has to be consumed, becomes more andmore contracted, which raises the local temperature.30 At a certainpoint, the temperature is high enough to cause self-reduction62 ofthe still-oxidized Pd. Thereby, the relevant species switches fromoxidized to reduced Pd, which is less active for total oxidation ofmethane. The heat production becomes insufficient for hydrogen
production, and the local temperature is lowered enough for thereoxidation of the catalyst bed. This is an indirect proof of thecombustion�reforming mechanism also shown on other noblemetal catalysts.63,64
3.3. Frequency of Oscillations and Relative Width of theReduced State. With the LCA results, the relative width of thereduced state for each measurement at variable positions along thecatalyst and also for variable temperatures can be determined. Addi-tionally, the MS signal of, for example, H2 can be used to determinethe frequency of the oscillations. Both are displayed in Figure 6a,b.
Figure 4. Overall activation state of the catalyst (red curve) and the reduction state at certain positions along the capillary (black curve) are plotted forexperiments with the flame-sprayed catalyst carried out under different conditions with a flow of 27 mL/min. The red curve on the “high” level meansthat H2 is produced, and a low level means no hydrogen production. For the black curve, “high”means that the catalyst is reduced at this position alongthe catalyst bed. The position is plotted along the capillary, as sketched on the right side.
Figure 5. Inner oscillation (superimposed on the actual oscillation ofCPO) in hydrogen production and oxidation state of the Pd catalyst atthe beginning of the catalyst bed (x/L = 0). Conditions for the FSPcatalyst in this case were 418 �C and 27mL/min of 6%CH4/3%O2/He.
Figure 6. (a) The average percentage in time of an oscillation periodwhere the catalyst is in the reduced state as a function of the positionwithin the capillary and for different temperatures. (b) The logarithm of theoscillation period versus the reciprocal value of the temperaturewith a linearfit in the temperature range where the oscillations are stable. All measure-ments were performed with a flow of 27 mL/min of 6% CH4/3% O2/He.
604 dx.doi.org/10.1021/jp2052294 |J. Phys. Chem. C 2012, 116, 599–609
The Journal of Physical Chemistry C ARTICLE
The black, red, blue, and green graphs in Figure 6a aremeasuredwiththe same FSP catalyst, whereas the yellow one represents the resultsfor the commercial catalyst. All measurements were performed withthe same flow of 26 mL/min of 6% CH4/3% O2/He. For reactionkinetic reasons, the relative length of the reduced state of the os-cillation is longer at higher temperatures. The width of the reducedstate varies stronger along the catalyst bed at higher temperatures. At385 �C, the commercial catalyst shows a similar relative length of thereduced form as the FSP catalyst at 410 �C. Figure 6b shows that thefrequency of the oscillations increases with temperature to a max-imum of about 0.004 s�1 at about 415 �C/418 �C. At more thanabout 420 �C, the catalyst stops to oscillate, and below about 385 �C,no ignition occurs. Between 395 and 415 �C, the oscillations arestable and reproducible. In this region, Zhang et al. have interpretedthe temperature dependence of the oscillations in terms of activationenergy.44 Similarly, it can be observed in Figure 6b that the durationof the oscillation period follows anArrhenius-type function, as shownby the linear fit, which yields a corresponding activation energy forthe oscillation ofEa = 58 kJmol
�1. Slightly higher activation energiesof at least 68 kJ mol�1 were found for oscillations on Pd metal foilsand wires.44 Here, the temperature is measured below the catalystbed, and the temperature in the fixed bed can locally be significantlyhigher.30 The fresh catalyst at 410 �Coscillates somewhat faster thanthe aged catalyst at the same temperature (see Figure 6b). This canbe assigned to the smaller particle size (see section 3.4) and leads to ahigher reaction rate at lower temperature, and thus probably fasterautoreduction. The commercial catalyst oscillates at a higher fre-quency between 0.005 and 0.006 s�1, but the values scatter strongly,indicating less-stable oscillations for this catalyst. The higher oscilla-tion frequency may be linked to the fact that the density of the FSP-made catalyst is lower and thus less Pd is present in the capillary.The relative width of the reduced state and the frequency of
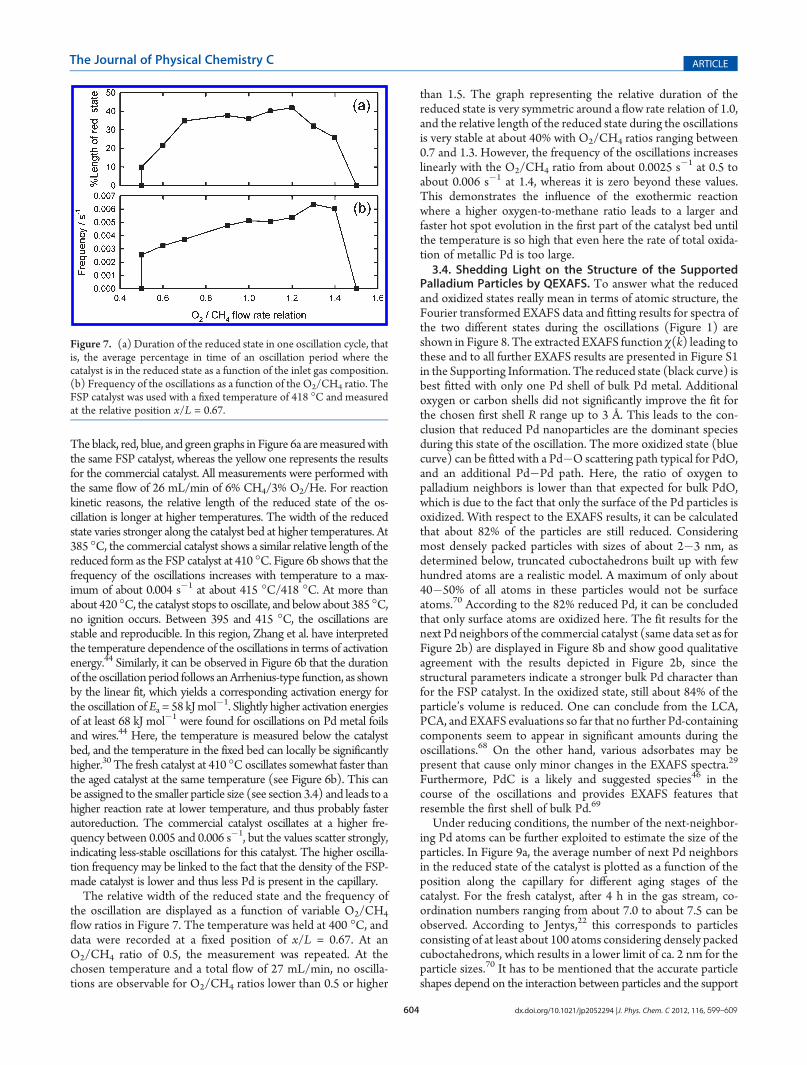
the oscillation are displayed as a function of variable O2/CH4
flow ratios in Figure 7. The temperature was held at 400 �C, anddata were recorded at a fixed position of x/L = 0.67. At anO2/CH4 ratio of 0.5, the measurement was repeated. At thechosen temperature and a total flow of 27 mL/min, no oscilla-tions are observable for O2/CH4 ratios lower than 0.5 or higher
than 1.5. The graph representing the relative duration of thereduced state is very symmetric around a flow rate relation of 1.0,and the relative length of the reduced state during the oscillationsis very stable at about 40% with O2/CH4 ratios ranging between0.7 and 1.3. However, the frequency of the oscillations increaseslinearly with the O2/CH4 ratio from about 0.0025 s�1 at 0.5 toabout 0.006 s�1 at 1.4, whereas it is zero beyond these values.This demonstrates the influence of the exothermic reactionwhere a higher oxygen-to-methane ratio leads to a larger andfaster hot spot evolution in the first part of the catalyst bed untilthe temperature is so high that even here the rate of total oxida-tion of metallic Pd is too large.3.4. Shedding Light on the Structure of the Supported
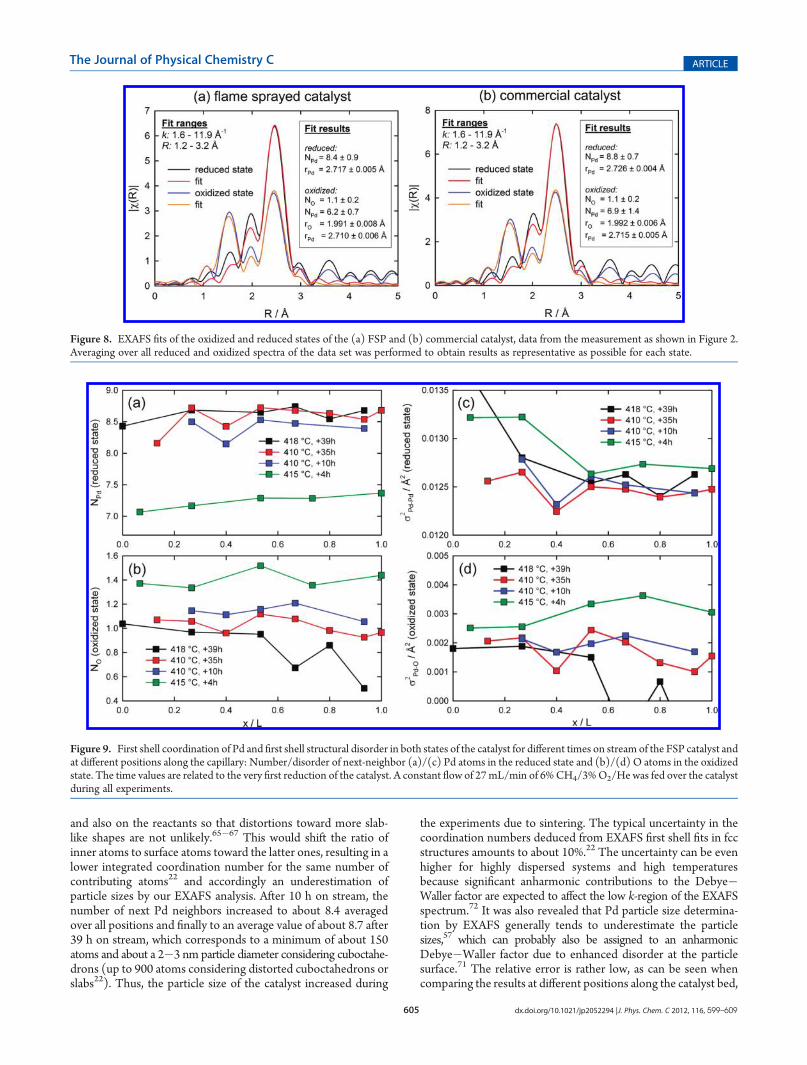
Palladium Particles by QEXAFS. To answer what the reducedand oxidized states really mean in terms of atomic structure, theFourier transformed EXAFS data and fitting results for spectra ofthe two different states during the oscillations (Figure 1) areshown in Figure 8. The extracted EXAFS function χ(k) leading tothese and to all further EXAFS results are presented in Figure S1in the Supporting Information. The reduced state (black curve) isbest fitted with only one Pd shell of bulk Pd metal. Additionaloxygen or carbon shells did not significantly improve the fit forthe chosen first shell R range up to 3 Å. This leads to the con-clusion that reduced Pd nanoparticles are the dominant speciesduring this state of the oscillation. The more oxidized state (bluecurve) can be fitted with a Pd�O scattering path typical for PdO,and an additional Pd�Pd path. Here, the ratio of oxygen topalladium neighbors is lower than that expected for bulk PdO,which is due to the fact that only the surface of the Pd particles isoxidized. With respect to the EXAFS results, it can be calculatedthat about 82% of the particles are still reduced. Consideringmost densely packed particles with sizes of about 2�3 nm, asdetermined below, truncated cuboctahedrons built up with fewhundred atoms are a realistic model. A maximum of only about40�50% of all atoms in these particles would not be surfaceatoms.70 According to the 82% reduced Pd, it can be concludedthat only surface atoms are oxidized here. The fit results for thenext Pd neighbors of the commercial catalyst (same data set as forFigure 2b) are displayed in Figure 8b and show good qualitativeagreement with the results depicted in Figure 2b, since thestructural parameters indicate a stronger bulk Pd character thanfor the FSP catalyst. In the oxidized state, still about 84% of theparticle’s volume is reduced. One can conclude from the LCA,PCA, and EXAFS evaluations so far that no further Pd-containingcomponents seem to appear in significant amounts during theoscillations.68 On the other hand, various adsorbates may bepresent that cause only minor changes in the EXAFS spectra.29
Furthermore, PdC is a likely and suggested species46 in thecourse of the oscillations and provides EXAFS features thatresemble the first shell of bulk Pd.69
Under reducing conditions, the number of the next-neighbor-ing Pd atoms can be further exploited to estimate the size of theparticles. In Figure 9a, the average number of next Pd neighborsin the reduced state of the catalyst is plotted as a function of theposition along the capillary for different aging stages of thecatalyst. For the fresh catalyst, after 4 h in the gas stream, co-ordination numbers ranging from about 7.0 to about 7.5 can beobserved. According to Jentys,22 this corresponds to particlesconsisting of at least about 100 atoms considering densely packedcuboctahedrons, which results in a lower limit of ca. 2 nm for theparticle sizes.70 It has to be mentioned that the accurate particleshapes depend on the interaction between particles and the support
Figure 7. (a) Duration of the reduced state in one oscillation cycle, thatis, the average percentage in time of an oscillation period where thecatalyst is in the reduced state as a function of the inlet gas composition.(b) Frequency of the oscillations as a function of the O2/CH4 ratio. TheFSP catalyst was used with a fixed temperature of 418 �C and measuredat the relative position x/L = 0.67.
605 dx.doi.org/10.1021/jp2052294 |J. Phys. Chem. C 2012, 116, 599–609
The Journal of Physical Chemistry C ARTICLE
and also on the reactants so that distortions toward more slab-like shapes are not unlikely.65�67 This would shift the ratio ofinner atoms to surface atoms toward the latter ones, resulting in alower integrated coordination number for the same number ofcontributing atoms22 and accordingly an underestimation ofparticle sizes by our EXAFS analysis. After 10 h on stream, thenumber of next Pd neighbors increased to about 8.4 averagedover all positions and finally to an average value of about 8.7 after39 h on stream, which corresponds to a minimum of about 150atoms and about a 2�3 nm particle diameter considering cuboctahe-drons (up to 900 atoms considering distorted cuboctahedrons orslabs22). Thus, the particle size of the catalyst increased during
the experiments due to sintering. The typical uncertainty in thecoordination numbers deduced from EXAFS first shell fits in fccstructures amounts to about 10%.22 The uncertainty can be evenhigher for highly dispersed systems and high temperaturesbecause significant anharmonic contributions to the Debye�Waller factor are expected to affect the low k-region of the EXAFSspectrum.72 It was also revealed that Pd particle size determina-tion by EXAFS generally tends to underestimate the particlesizes,57 which can probably also be assigned to an anharmonicDebye�Waller factor due to enhanced disorder at the particlesurface.71 The relative error is rather low, as can be seen whencomparing the results at different positions along the catalyst bed,
Figure 8. EXAFS fits of the oxidized and reduced states of the (a) FSP and (b) commercial catalyst, data from the measurement as shown in Figure 2.Averaging over all reduced and oxidized spectra of the data set was performed to obtain results as representative as possible for each state.
Figure 9. First shell coordination of Pd and first shell structural disorder in both states of the catalyst for different times on stream of the FSP catalyst andat different positions along the capillary: Number/disorder of next-neighbor (a)/(c) Pd atoms in the reduced state and (b)/(d) O atoms in the oxidizedstate. The time values are related to the very first reduction of the catalyst. A constant flow of 27mL/min of 6%CH4/3%O2/He was fed over the catalystduring all experiments.
606 dx.doi.org/10.1021/jp2052294 |J. Phys. Chem. C 2012, 116, 599–609
The Journal of Physical Chemistry C ARTICLE
which do not scatter that much. Thus, there is a systematic errorof 10% or higher so that all the results in Figure 9 may actuallyhave to be shifted up- or downward, but the qualitative observa-tion of particle growth with the age of the catalyst is still valid.Comparison of the measurements after 10 h with the measure-ments after 35 h shows that the two curves have the same shape,except for the shift to a higher Pd coordination number. Sinteringof Pd/Al2O3 catalysts in methane was suggested by Demoulinet al. (see ref 73), who heated the catalysts from room tempera-ture to 550 �C and cooled them down to room temperatureagain. Afterward, they measured the CO chemisorption after aheat treatment of the samples at 400 �C inH2 and measured XPSof the pressed catalyst. Probably, it is, in particular, the reductionto metallic palladium and the high exothermicity that leads tosintering,62 although the reoxidation, in principle, could lead to aredispersion in each oscillation.The increased particle size of the aged catalyst also affects the
oscillation behavior, as can be observed in Figure 6 when com-paring the black and the blue curves, which were measured underthe same conditions. The relative duration of the active state isvery similar. However, the fresher catalyst oscillates with aslightly higher frequency, which can be associated with the highereffective surface area of the smaller particles, which results in ahigher catalytic activity and, therefore, a more rapidly evolvinghot spot. From Figure 9b, it is clear that the average number ofoxygen neighbors in the oxidized state of the oscillation decreaseswith larger particles. Only the outer surface of the Pd particles isoxidized so that the composition shifts to higher amounts of bulkPd with larger particles.The structural/thermal disorder can be taken into account by
fitting the Debye�Waller factor during the EXAFS analysis. Thisis shown in Figure 9c,d for the first Pd shell of the reduced andthe first oxygen shell of the oxidized catalyst. Disorder is highestat the beginning of the catalyst bed in the reduced state anddecreases toward the end. This agrees well with the increasedthermal disorder due to the evolving hot spot close to the beginningof the bed. The results look quite different for the oxidized statewhere the disorder does not vary that much. However, especiallyfor the fresher catalysts, a maximum of the Debye�Waller factoris observable toward the end, in the region of x/L = 0.6 to x/L =0.8. This is probably due to the fact that the catalyst heats upalong the axial direction of the reactor due to the exothermicmethane combustion that occurs over the whole catalyst bed.30
At 418 �C, the oxidized phase at the end of the catalyst bed wastoo short-lived to achieve reasonable data quality for the EXAFS fits.3.5. Analysis of Reduction and Reoxidation Behavior. The
achieved time resolution and data quality are sufficient to analyzethe structure not only averaged over the chemically stable con-ditions (partially oxidized and fully reduced) but also during theignition and the extinction period.A closer look at the LCA results for the oxidized state of the
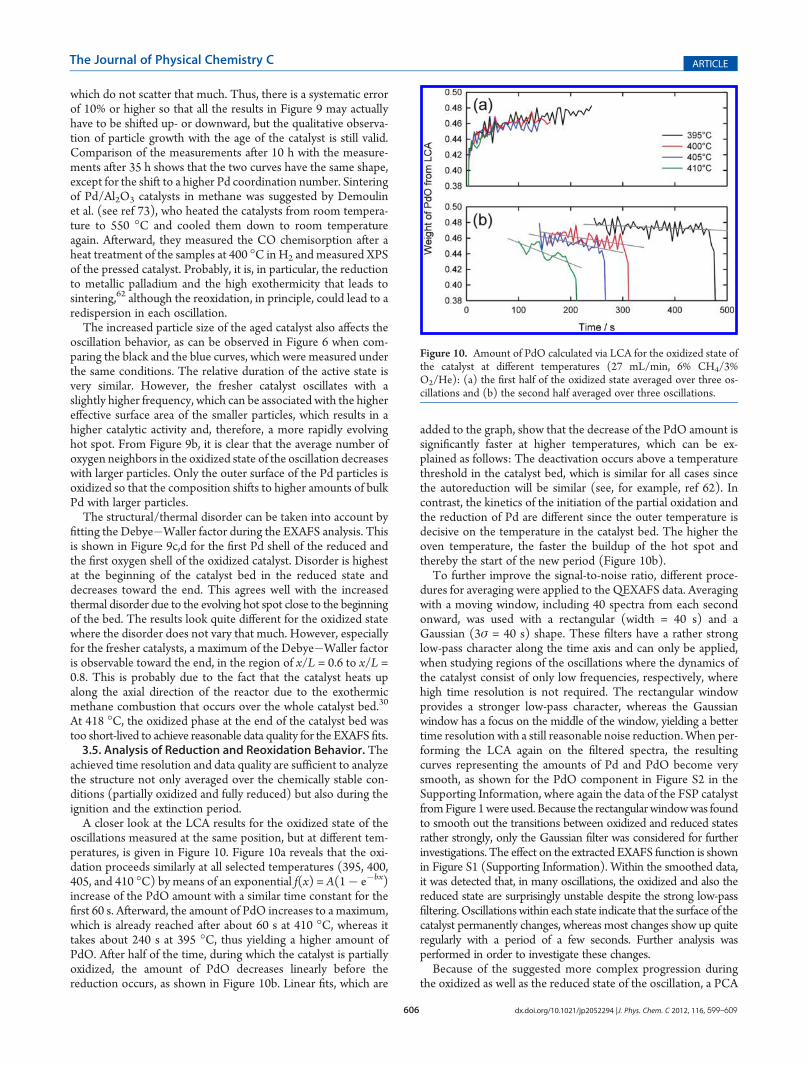
oscillations measured at the same position, but at different tem-peratures, is given in Figure 10. Figure 10a reveals that the oxi-dation proceeds similarly at all selected temperatures (395, 400,405, and 410 �C) by means of an exponential f(x) = A(1� e�bx)increase of the PdO amount with a similar time constant for thefirst 60 s. Afterward, the amount of PdO increases to a maximum,which is already reached after about 60 s at 410 �C, whereas ittakes about 240 s at 395 �C, thus yielding a higher amount ofPdO. After half of the time, during which the catalyst is partiallyoxidized, the amount of PdO decreases linearly before thereduction occurs, as shown in Figure 10b. Linear fits, which are
added to the graph, show that the decrease of the PdO amount issignificantly faster at higher temperatures, which can be ex-plained as follows: The deactivation occurs above a temperaturethreshold in the catalyst bed, which is similar for all cases sincethe autoreduction will be similar (see, for example, ref 62). Incontrast, the kinetics of the initiation of the partial oxidation andthe reduction of Pd are different since the outer temperature isdecisive on the temperature in the catalyst bed. The higher theoven temperature, the faster the buildup of the hot spot andthereby the start of the new period (Figure 10b).To further improve the signal-to-noise ratio, different proce-
dures for averaging were applied to the QEXAFS data. Averagingwith a moving window, including 40 spectra from each secondonward, was used with a rectangular (width = 40 s) and aGaussian (3σ = 40 s) shape. These filters have a rather stronglow-pass character along the time axis and can only be applied,when studying regions of the oscillations where the dynamics ofthe catalyst consist of only low frequencies, respectively, wherehigh time resolution is not required. The rectangular windowprovides a stronger low-pass character, whereas the Gaussianwindow has a focus on the middle of the window, yielding a bettertime resolution with a still reasonable noise reduction.When per-forming the LCA again on the filtered spectra, the resultingcurves representing the amounts of Pd and PdO become verysmooth, as shown for the PdO component in Figure S2 in theSupporting Information, where again the data of the FSP catalystfromFigure 1were used. Because the rectangularwindowwas foundto smooth out the transitions between oxidized and reduced statesrather strongly, only the Gaussian filter was considered for furtherinvestigations. The effect on the extracted EXAFS function is shownin Figure S1 (Supporting Information). Within the smoothed data,it was detected that, in many oscillations, the oxidized and also thereduced state are surprisingly unstable despite the strong low-passfiltering.Oscillationswithin each state indicate that the surface of thecatalyst permanently changes, whereas most changes show up quiteregularly with a period of a few seconds. Further analysis wasperformed in order to investigate these changes.Because of the suggested more complex progression during
the oxidized as well as the reduced state of the oscillation, a PCA
Figure 10. Amount of PdO calculated via LCA for the oxidized state ofthe catalyst at different temperatures (27 mL/min, 6% CH4/3%O2/He): (a) the first half of the oxidized state averaged over three os-cillations and (b) the second half averaged over three oscillations.
607 dx.doi.org/10.1021/jp2052294 |J. Phys. Chem. C 2012, 116, 599–609
The Journal of Physical Chemistry C ARTICLE
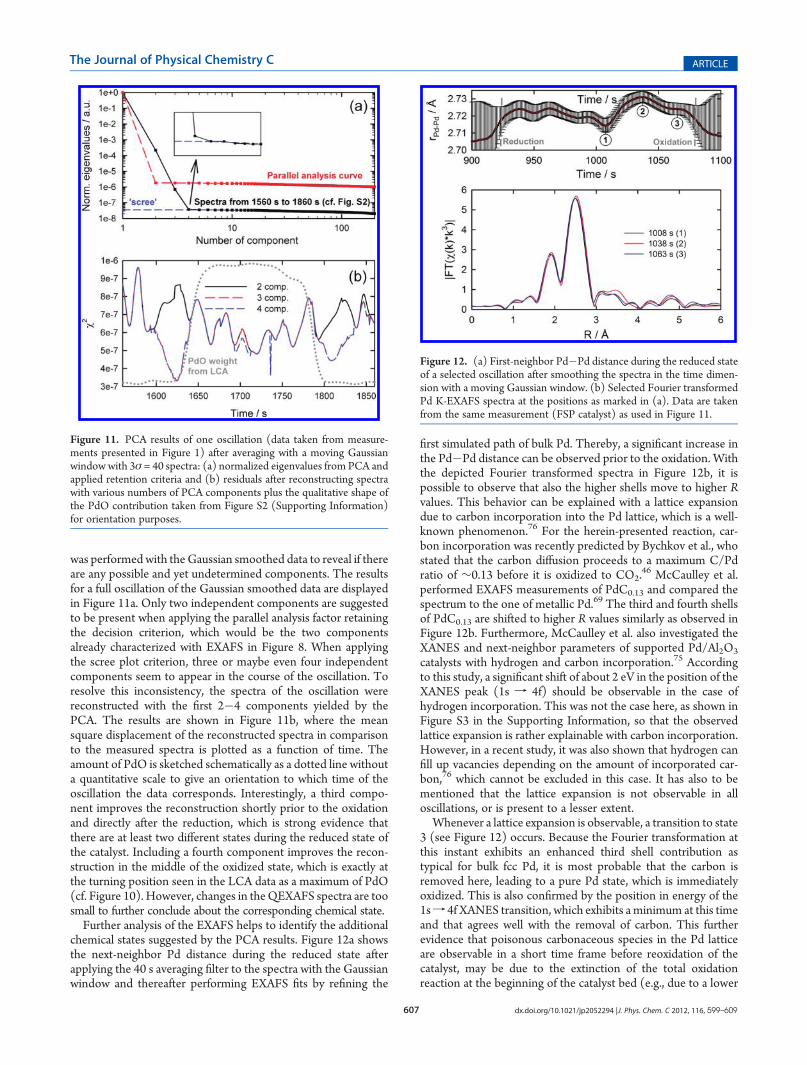
was performed with the Gaussian smoothed data to reveal if thereare any possible and yet undetermined components. The resultsfor a full oscillation of the Gaussian smoothed data are displayedin Figure 11a. Only two independent components are suggestedto be present when applying the parallel analysis factor retainingthe decision criterion, which would be the two componentsalready characterized with EXAFS in Figure 8. When applyingthe scree plot criterion, three or maybe even four independentcomponents seem to appear in the course of the oscillation. Toresolve this inconsistency, the spectra of the oscillation werereconstructed with the first 2�4 components yielded by thePCA. The results are shown in Figure 11b, where the meansquare displacement of the reconstructed spectra in comparisonto the measured spectra is plotted as a function of time. Theamount of PdO is sketched schematically as a dotted line withouta quantitative scale to give an orientation to which time of theoscillation the data corresponds. Interestingly, a third compo-nent improves the reconstruction shortly prior to the oxidationand directly after the reduction, which is strong evidence thatthere are at least two different states during the reduced state ofthe catalyst. Including a fourth component improves the recon-struction in the middle of the oxidized state, which is exactly atthe turning position seen in the LCA data as a maximum of PdO(cf. Figure 10). However, changes in theQEXAFS spectra are toosmall to further conclude about the corresponding chemical state.Further analysis of the EXAFS helps to identify the additional
chemical states suggested by the PCA results. Figure 12a showsthe next-neighbor Pd distance during the reduced state afterapplying the 40 s averaging filter to the spectra with the Gaussianwindow and thereafter performing EXAFS fits by refining the
first simulated path of bulk Pd. Thereby, a significant increase inthe Pd�Pd distance can be observed prior to the oxidation. Withthe depicted Fourier transformed spectra in Figure 12b, it ispossible to observe that also the higher shells move to higher Rvalues. This behavior can be explained with a lattice expansiondue to carbon incorporation into the Pd lattice, which is a well-known phenomenon.76 For the herein-presented reaction, car-bon incorporation was recently predicted by Bychkov et al., whostated that the carbon diffusion proceeds to a maximum C/Pdratio of ∼0.13 before it is oxidized to CO2.
46 McCaulley et al.performed EXAFS measurements of PdC0.13 and compared thespectrum to the one of metallic Pd.69 The third and fourth shellsof PdC0.13 are shifted to higher R values similarly as observed inFigure 12b. Furthermore, McCaulley et al. also investigated theXANES and next-neighbor parameters of supported Pd/Al2O3
catalysts with hydrogen and carbon incorporation.75 Accordingto this study, a significant shift of about 2 eV in the position of theXANES peak (1s f 4f) should be observable in the case ofhydrogen incorporation. This was not the case here, as shown inFigure S3 in the Supporting Information, so that the observedlattice expansion is rather explainable with carbon incorporation.However, in a recent study, it was also shown that hydrogen canfill up vacancies depending on the amount of incorporated car-bon,76 which cannot be excluded in this case. It has also to bementioned that the lattice expansion is not observable in alloscillations, or is present to a lesser extent.Whenever a lattice expansion is observable, a transition to state
3 (see Figure 12) occurs. Because the Fourier transformation atthis instant exhibits an enhanced third shell contribution astypical for bulk fcc Pd, it is most probable that the carbon isremoved here, leading to a pure Pd state, which is immediatelyoxidized. This is also confirmed by the position in energy of the1sf 4f XANES transition, which exhibits a minimum at this timeand that agrees well with the removal of carbon. This furtherevidence that poisonous carbonaceous species in the Pd latticeare observable in a short time frame before reoxidation of thecatalyst, may be due to the extinction of the total oxidationreaction at the beginning of the catalyst bed (e.g., due to a lower
Figure 11. PCA results of one oscillation (data taken from measure-ments presented in Figure 1) after averaging with a moving Gaussianwindowwith 3σ = 40 spectra: (a) normalized eigenvalues from PCA andapplied retention criteria and (b) residuals after reconstructing spectrawith various numbers of PCA components plus the qualitative shape ofthe PdO contribution taken from Figure S2 (Supporting Information)for orientation purposes.
Figure 12. (a) First-neighbor Pd�Pd distance during the reduced stateof a selected oscillation after smoothing the spectra in the time dimen-sion with a moving Gaussian window. (b) Selected Fourier transformedPd K-EXAFS spectra at the positions as marked in (a). Data are takenfrom the same measurement (FSP catalyst) as used in Figure 11.
608 dx.doi.org/10.1021/jp2052294 |J. Phys. Chem. C 2012, 116, 599–609
The Journal of Physical Chemistry C ARTICLE
water content, generated by total oxidation, in the gas stream).The appearance of carbon in the Pd particles also agrees well withthe presence of a third component in the PCA reconstruction, asshown in Figure 11b. However, it is important to note that thedynamic behavior of the catalyst can also depend on (i) vary-ing surface coverage, (ii) varying particle shapes, (iii) varyingcarbon/hydrogen incorporation, or (iv) a superposition ofseveral of these processes. Thus, further investigations arerequired, whereby studies with a combination of complementarytechniques, such as presented by Iglesias-Juez et al.57 and New-ton et al.,74 could help to find out more about such subprocessesof the herein-reported kind during the kinetic oscillations.
4. CONCLUSIONS
The CPO of methane was studied over two different Pd/Al2O3
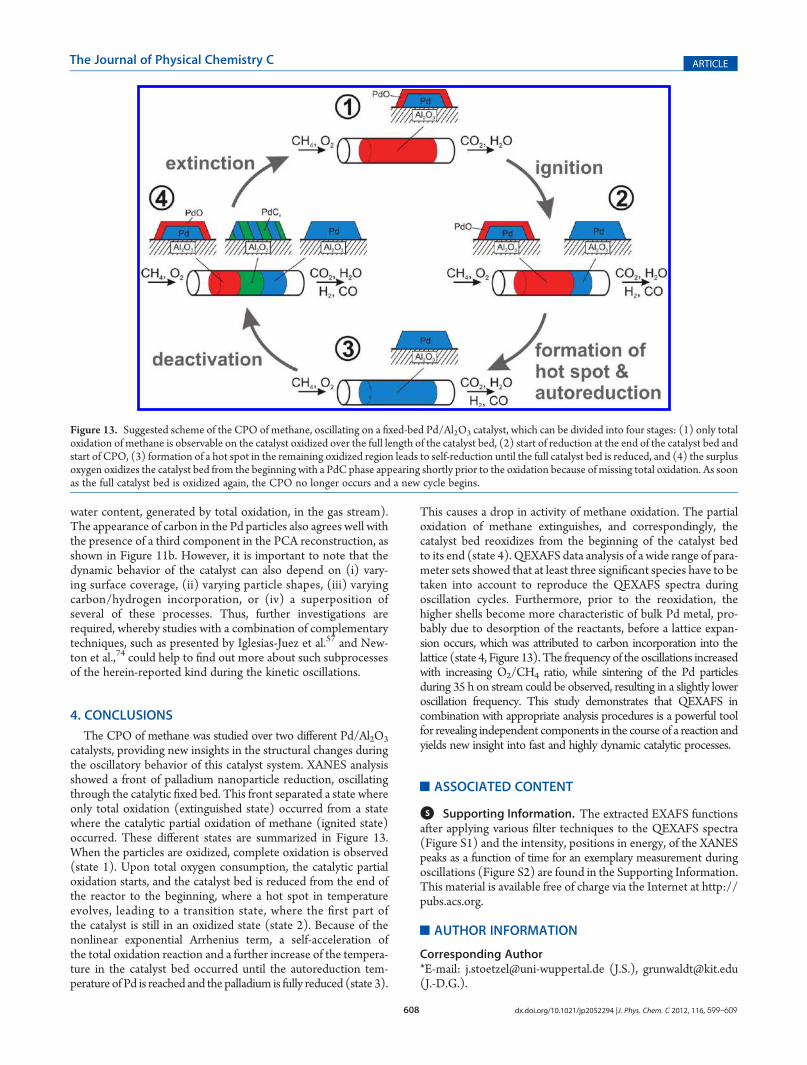
catalysts, providing new insights in the structural changes duringthe oscillatory behavior of this catalyst system. XANES analysisshowed a front of palladium nanoparticle reduction, oscillatingthrough the catalytic fixed bed. This front separated a state whereonly total oxidation (extinguished state) occurred from a statewhere the catalytic partial oxidation of methane (ignited state)occurred. These different states are summarized in Figure 13.When the particles are oxidized, complete oxidation is observed(state 1). Upon total oxygen consumption, the catalytic partialoxidation starts, and the catalyst bed is reduced from the end ofthe reactor to the beginning, where a hot spot in temperatureevolves, leading to a transition state, where the first part ofthe catalyst is still in an oxidized state (state 2). Because of thenonlinear exponential Arrhenius term, a self-acceleration ofthe total oxidation reaction and a further increase of the tempera-ture in the catalyst bed occurred until the autoreduction tem-perature of Pd is reached and the palladium is fully reduced (state 3).
This causes a drop in activity of methane oxidation. The partialoxidation of methane extinguishes, and correspondingly, thecatalyst bed reoxidizes from the beginning of the catalyst bedto its end (state 4). QEXAFS data analysis of a wide range of para-meter sets showed that at least three significant species have to betaken into account to reproduce the QEXAFS spectra duringoscillation cycles. Furthermore, prior to the reoxidation, thehigher shells become more characteristic of bulk Pd metal, pro-bably due to desorption of the reactants, before a lattice expan-sion occurs, which was attributed to carbon incorporation into thelattice (state 4, Figure 13). The frequency of the oscillations increasedwith increasing O2/CH4 ratio, while sintering of the Pd particlesduring 35 h on stream could be observed, resulting in a slightly loweroscillation frequency. This study demonstrates that QEXAFS incombination with appropriate analysis procedures is a powerful toolfor revealing independent components in the course of a reaction andyields new insight into fast and highly dynamic catalytic processes.
’ASSOCIATED CONTENT
bS Supporting Information. The extracted EXAFS functionsafter applying various filter techniques to the QEXAFS spectra(Figure S1) and the intensity, positions in energy, of the XANESpeaks as a function of time for an exemplary measurement duringoscillations (Figure S2) are found in the Supporting Information.This material is available free of charge via the Internet at http://pubs.acs.org.
’AUTHOR INFORMATION
Corresponding Author*E-mail: [email protected] (J.S.), [email protected](J.-D.G.).
Figure 13. Suggested scheme of the CPO of methane, oscillating on a fixed-bed Pd/Al2O3 catalyst, which can be divided into four stages: (1) only totaloxidation of methane is observable on the catalyst oxidized over the full length of the catalyst bed, (2) start of reduction at the end of the catalyst bed andstart of CPO, (3) formation of a hot spot in the remaining oxidized region leads to self-reduction until the full catalyst bed is reduced, and (4) the surplusoxygen oxidizes the catalyst bed from the beginning with a PdC phase appearing shortly prior to the oxidation because of missing total oxidation. As soonas the full catalyst bed is oxidized again, the CPO no longer occurs and a new cycle begins.
609 dx.doi.org/10.1021/jp2052294 |J. Phys. Chem. C 2012, 116, 599–609
The Journal of Physical Chemistry C ARTICLE
’ACKNOWLEDGMENT
We thank Matthias Beier (Technical University of Denmark)for his help during the beamtime. The Swiss Light Source (SLS),the Danish council for strategic research (DSF), and Danscatt areacknowledged for providing beamtime and financial support.
’REFERENCES
(1) Ertl, G.; Norton, P. R.; R€ustig, J. Phys. Rev. Lett. 1982, 49, 177.(2) Eiswirth, M.; Ertl, G. Surf. Sci. 1986, 177, 90.(3) Sch€uth, F.; Henry, B. E.; Schmidt, L. D. Adv. Catal. 1993, 39, 51.(4) Slinko, M. M.; Jaeger, N. I. Oscillatory Heterogeneous Catalytic
Systems; Elsevier: Amsterdam, 1994.(5) Imbihl, R.; Ertl, G. Chem. Rev. 1995, 95, 597.(6) Gruyters, M.; King, D. A. J. Chem. Soc., Faraday Trans. 1997,
93, 2947.(7) Imbihl, R. Handbook of Surface Science; Elsevier: Amsterdam,
2008; Chapter 9.(8) Reuter, K.; Scheffler, M. Phys. Rev. B 2003, 68, 045407.(9) Zhdanov, V. P. Surf. Sci. 2002, 500, 966.(10) Joh�anek, V.; Laurin,M.; Grant, A.W.; Kasemo, B.; Henry, C. R.;
Libuda, J. Science 2004, 304, 1639.(11) Zhdanov, V. P. Phys. Rev. E 1999, 60, 7554.(12) Sales, B. C.; Turner, J. E.;Marple,M. B. Surf. Sci. 1982, 114, 381.(13) Collins, N. A.; Sundaresan, S.; Chabal, Y. J. Surf. Sci. 1987,
180, 136.(14) Hendriksen, B. L. M.; Ackermann, M. D.; van Rijn, R.; Stoltz, D.;
Popa, I.; Balmes, O.; Resta, A.; Wermeille, D.; Felici, R.; Ferrer, S.; Frenken,J. W. M. Nat. Chem. 2010, 2, 730.(15) Thomas, J. M. Angew. Chem., Int. Ed. 1999, 38, 3588.(16) Grunwaldt, J.-D.; Clausen, B. S. Top. Catal. 2002, 18, 37.(17) Topsøe, H. J. Catal. 2003, 216, 155.(18) Baranes, M. A. Catal. Today 2005, 100, 71.(19) Hansen, P. L.; Wagner, J. B.; Helveg, S.; Rostrup-Nielsen, J. R.;
Clausen, B. S.; Topsøe, H. Science 2002, 295, 2053.(20) Clausen, B. S.; Topsøe, H.; Frahm, R. Adv. Catal. 1998, 42, 315.(21) Grunwaldt, J.-D.; Molenbroek, A. M.; Topsøe, N.-Y.; Topsøe, H.;
Clausen, B. S. J. Catal. 2000, 194, 452.(22) Jentys, A. Phys. Chem. Chem. Phys. 1999, 1, 4059.(23) Fernandez-Garcia, M. Catal. Rev. Sci. Eng. 2002, 44, 59.(24) Newton, M. A.; Dent, A. J.; Evans, J. Chem. Soc. Rev. 2002,
31, 83.(25) Ressler, T.; Jentoft, R. E.; Wienold, J.; Girgsdies, F.; Neisius, T.;
Timpe, O. Nucl. Instrum. Methods Phys. Res., Sect. B 2003, 200, 165.(26) Grunwaldt, J.-D.; Caravati, M.; Hannemann, S.; Baiker, A. Phys.
Chem. Chem. Phys. 2004, 6, 3037.(27) Bare, S. R.; Ressler, T. Adv. Catal. 2009, 52, 339.(28) Grunwaldt, J.-D. J. Phys. Conf. Ser. 2009, 190, 012151.(29) Ressler, T.; Hagelstein, M.; Hatje, U.; Metz, W. J. Phys. Chem. B
1997, 101, 6680–6687.(30) Kimmerle, B.; Baiker, A.; Grunwaldt, J.-D. Phys. Chem. Chem.
Phys. 2010, 12, 2288–2291.(31) Singh, J.; Nachtegaal, M.; Alayon, E. M. C.; St€otzel, J.;
van Bokhoven, J. A. ChemCatChem 2010, 2, 653.(32) Frahm, R.Nucl. Instrum. Methods Phys. Res., Sect. A 1988, 270, 578.(33) Frahm, R. Rev. Sci. Instrum. 1989, 60, 2515.(34) Reimann, S.; St€otzel, J.; Frahm, R.; Kleist, W.; Grunwaldt, J.-D.;
Baiker, A. J. Am. Chem. Soc. 2011, 133, 3921–3930.(35) Grunwaldt, J.-D.;Beier,M.;Kimmerle, B.; Baiker,A.;Nachtegaal,M.;
Griesebock, B.; L€utzenkirchen-Hecht, D.; St€otzel, J.; Frahm, R. Phys.Chem. Chem. Phys. 2009, 11, 8779–8789.(36) Basini, L.; Aasberg-Petersen, K.; Guarinoni, A.; Ostberg, M.
Catal. Today 2001, 64, 9–20.(37) Recupero, V.; Pino, L.; Di Leonardo, R.; Lagana,M.;Maggio, G.
J. Power Sources 1998, 71, 208–214.(38) Bychkov, V. Y.; Tyulenin, Y. P.; Korchak, V. N.; Aptekar, E. L.
Appl. Catal., A 2006, 304, 21–29.
(39) Bychkov, V. Y.; Tyulenin, Y. P.; Slinko, M. M.; Korchal, V. N.Appl. Catal., A 2007, 321, 180–189.
(40) K€onig, D.; Weber, W. H.; Poindexter, B. D.; Mcbride, J. R.;Graham, G. W.; Otto, K. Catal. Lett. 1994, 29, 329.
(41) Ozkan, U. S.; Kumthekar, M. W.; Karakas, G. J. Catal. 1997,171, 67–76.
(42) Graham, G. W.; K€onig, D.; Poindexter, B. D.; Remillard, J. T.;Weber, W. H. Top. Catal. 1999, 8, 35–43.
(43) Deng, Y.; Nevell, T. G. J. Mol. Catal. A 1999, 142, 51–60.(44) Zhang, X.; Lee, C. S.-M.; Mingos, D. M. P.; Hayward, D. O.
Appl. Catal. 2003, 240, 183–197.(45) Zhang, X.; Lee, C. D.-M.; Hayward, D. O.; Mingos, D. M. P.
Catal. Today 2005, 105, 283–294.(46) Bychkov, V. Yu.; Tyulenin, Yu. P.; Slinko, M. M.; Shashkin,
D. P.; Korchak, V. N. J. Catal. 2009, 267, 181.(47) Strobel, R.; Grunwaldt, J.-D.; Camenzind, A.; Pratsinis, S. E.;
Baiker, A. Catal. Lett. 2005, 104, 9.(48) Hannemann, S.; Grunwaldt, J.-D.; Lienemann, P.; Gunther, D.;
Krumeich, F.; Pratsinis, S. E.; Baiker, A. Appl. Catal., A 2007, 316, 226.(49) Frahm, R.; Nachtegaal, M.; St€otzel, J.; Harfouche, M.;
van Bokhoven, J. A.; Grunwaldt, J.-D. AIP Conf. Proc. 2010, 1234,251–255.
(50) Frahm, R.; Richwin, M.; L€utzenkirchen-Hecht, D. Phys. Scr.2005, T115, 974–976.
(51) St€otzel, J.; L€utzenkirchen-Hecht, D.; Fonda, E.; de Oliveira, N.;Briois, V.; Frahm, R. Rev. Sci. Instrum. 2008, 79, 083107.
(52) St€otzel, J.; L€utzenkirchen-Hecht, D.; Frahm, R. J. SynchrotronRadiat. 2011, 18, 165–175.
(53) Newville, M. J. Synchrotron Radiat. 2001, 8, 322–324.(54) Zabinsky, S. I.; Rehr, J. J.; Ankudinov, A.; Albers, R. C.; Eller,
M. J. Phys. Rev. B 1995, 52, 2995.(55) Horn, J. L. Psychometrika 1965, 32, 179–185.(56) Cattell, R. B. Multivar. Behav. Res. 1966, 1, 245–276.(57) Iglesias-Juez, A.;Kubacka,A.; Fern�andez-García,M.;DiMichiel,M.;
Newton, M. A. J. Am. Chem. Soc. 2011, 133, 4484.(58) Grunwaldt, J.-D.; Schroer, C. G.Chem. Soc. Rev. 2010, 39, 4741.(59) Kimmerle, B.; Grunwaldt, J.-D.; Baiker, A.; Glatzel, P.; Boye, P.;
Stephan, S.; Schroer, C. G. J. Phys. Chem. C 2009, 113, 3037.(60) Grunwaldt, J.-D.; Kimmerle, B.; Baiker, A.; Boye, P.; Schroer,
C. G.; Glatzel, P.; Borca, C. N.; Beckmann, F. Catal. Today 2009,145, 267.
(61) Kimmerle, B.; Haider, P.; Grunwaldt, J.-D.; Baiker, A.; Boye, P.;Schroer, C. G. Appl. Catal., A 2009, 353, 36.
(62) Grunwaldt, J.-D.; van Vegten, N.; Baiker, A. Chem. Commun.2007, 4635.
(63) Hartmann, M.; Maier, L.; Deutschmann, O. Appl. Catal., A2011, 391, 144–152.
(64) Dalle Nogare, D.; Degenstein, N. J.; Horn, R.; Canu, P.;Schmidt, L. D. J. Catal. 2011, 277, 134–148.
(65) Grunwaldt, J.-D.; Molenbroek, A. M.; Topsøe, N.-Y.; Topsøe, H.;Clausen, B. S. J. Catal. 2000, 194, 452.
(66) Lopez, N.; Nørskov, J. K.; Janssens, T. V. W.; Calsson, A.; Puig-Molina, A.; Clausen, B. S.; Grunwaldt, J.-D. J. Catal. 2004, 225, 86.
(67) Hansen, P. L.; Wagner, J. B.; Helveg, S.; Rostrup-Nielsen, J. R.;Clausen, B. S.; Topsøe, H. Science 2002, 295, 2053.
(68) Grunwaldt, J.-D.; Caravati, M.; Baiker, A. J. Phys. Chem. B 2006,110, 25586.
(69) McCaulley, J. A. Phys. Rev. B 1993, 47, 4873.(70) Mackay, A. L. Acta Crystallogr. 1962, 15, 916.(71) Yevick, A.; Frenkel, A. Phys. Rev. B 2010, 81, 115451.(72) Clausen, B. S.; Nørskov, J. K. Top. Catal. 2000, 10, 221–230.(73) Demoulin, O.; Le Clef, B.; Navez, M.; Ruiz, P. Appl. Catal., A
2008, 344, 1–9.(74) Newton,M. A.; DiMichiel, M.; Kubacka, A.; Fern�andez-García,
M. J. Am. Chem. Soc. 2010, 132, 4540.(75) McCaulley, J. A. J. Phys. Chem. 1993, 97, 10372.(76) Vogel, W. J. Phys. Chem. C 2011, 115, 1506.