Embed Size (px)
Citation preview
Chemical Engineering Science 61 (2006) 4634–4649www.elsevier.com/locate/ces
Experimental and numerical investigation of the catalytic partial oxidation ofCH4/O2 mixtures diluted with H2O and CO2 in a short contact time reactor
Adrian Schneider, John Mantzaras∗, Peter JansohnPaul Scherrer Institute, Combustion Research, CH-5232 Villigen PSI, Switzerland
Received 24 August 2005; received in revised form 28 February 2006; accepted 28 February 2006Available online 9 March 2006
Abstract
The catalytic partial oxidation (CPO) of fuel-rich CH4/O2 mixtures, heavily diluted with H2O and CO2 (46.3% and 23.1% volumetric feedcomposition, respectively), was investigated experimentally and numerically at 5 bar. Experiments were carried out in an ∼ 8 ms residence timeprototype gas-turbine honeycomb reactor coated with a Rh/ZrO2 catalyst and included temperature measurements along the reactor and exhaustgas analysis. Simulations with detailed hetero-/homogeneous chemical reaction schemes were performed using a steady, full elliptic 2D codefor both the gas and solid phases. The employed catalytic reaction scheme overpredicted mildly the impact of the total over the partial oxidationroute and this effect was more pronounced at lower reactor inlet temperatures (< 523 K). The contribution of the various chemical pathwaysto the synthesis gas yields and selectivities has been elucidated. It was shown that the addition of water provided a source of surface oxygenand hydroxyl radicals, which in turn enhanced the CH4 conversion and H2 selectivity and reduced the CO selectivity. On the other hand, theaddition of CO2 had a minor impact on the aforementioned parameters. The increase in the H2/CO product ratio with water dilution is highlydesirable in new power generation processes with large exhaust gas recycle, which utilize the “catalytic rich combustion” methodology (thepartial oxidation products stabilize a post-catalyst flame). At steady operation the catalyst surface temperatures exceeded by 200 K the adiabaticequilibrium temperature and standard (passive) heat transfer mechanisms in the solid were shown to be ineffective in providing proper reactorthermal management. Catalytic ignition was achieved at 670 K, however, the strong ignition/extinction hysterisis allowed for sustained steadyCPO at inlet temperatures as low as 473 K.� 2006 Elsevier Ltd. All rights reserved.
Keywords: Multiphase reactions; Kinetics; Simulation; Reaction engineering; Partial oxidation of methane; Exhaust gas dilution
1. Introduction
The catalytic partial oxidation (CPO) of methane to synthe-sis gas over noble metals has received increased attention inthe last years (Hickman and Schmidt, 1993; Bodke et al., 1998;Deutschmann and Schmidt, 1998; Aghalayam et al., 2003;Schwiedernoch et al., 2003; Bruno et al., 2005) due to its keyrole in the efficient conversion of natural gas to synthetic liquidfuels and hydrogen. CPO can be accomplished autothermallyand selectively in very short contact times over Pt- or Rh-based catalysts (Hickman and Schmidt, 1993; Deutschmannand Schmidt, 1998; Goralski and Schmidt, 1999). This al-lows for small reactor sizes that, in turn, render the process
∗ Corresponding author. Tel.: +41 56 3104046; fax: +41 56 3102199.E-mail address: [email protected] (J. Mantzaras).
0009-2509/$ - see front matter � 2006 Elsevier Ltd. All rights reserved.doi:10.1016/j.ces.2006.02.038
particularly attractive for on-board fuel reforming in many prac-tical systems such as microreactors (Norton and Vlachos, 2005),fuel-cells (Chaniotis and Poulikakos, 2004), internal combus-tion engines (Allgeier et al., 2004) and large natural-gas-fuelledturbines of power generation systems (Castaldi et al., 2005).
The adopted approach in gas-turbines, denoted as “catalyticrich combustion”, involves mixing of the entire fuel stream withpart of the air stream and subsequent partial oxidation of the re-sulting fuel-rich mixture in a catalytic reactor. The hot combus-tion products (synthesis gas, complete oxidation products andunconverted reactants) are rapidly mixed with the remaining airand stabilize a post-catalyst fuel-lean gaseous flame. “Catalyticrich combustion” has two main advantages in comparison tothe conventional catalytically stabilized thermal combustion(CST) that utilizes fuel-lean mixtures for both the catalytic andgas-phase reaction zones (Beebe et al., 2000; Carroni et al.,2002). The first is the lower catalyst light-off temperature due
A. Schneider et al. / Chemical Engineering Science 61 (2006) 4634–4649 4635
to the fact that noble metals are more active in the oxidationof fuel-rich rather than of fuel-lean hydrocarbon/air mixtures(Veser et al., 1999). The second is the enhanced stability ofthe follow-up flame due to the highly reactive hydrogen con-tained in the synthesis gas. To advance the understanding of“catalytic rich combustion”, Appel et al. (2005a) have recentlyinvestigated the partial oxidation of methane (main constituentof natural gas) in air over Rh/ZrO2 at 6 bar. Therein, in situlaser-based measurements of major and minor species concen-trations over the boundary layer of a channel-flow catalyticreactor were used, in conjunction with detailed numerical pre-dictions, to elucidate the underlying heterogeneous (catalytic)and homogeneous (gas-phase) reaction pathways. A first ap-plication of the validated numerical model to a prototype gasturbine reactor was also reported in the last reference.
The standard “catalytic rich combustion” involves fuel-richcatalytic and fuel-lean gaseous combustion of natural gas inpure air. In the last years, however, technologies for the effi-cient combustion of natural gas and air (or pure oxygen) di-luted with large amounts of recycled exhaust gas (H2O andCO2) are under intense investigation. One such example is theadvanced zero emissions approach (Griffin et al., 2004), whichaims at mitigating both NOx and CO2 in power plants. Thereinnitrogen is separated from air, such that the natural gas is com-busted at modest temperatures (up to 1500 K) in a stream ofoxygen and recycled exhaust gas with the latter comprising upto 80% vol. of the feed. Combustion in pure oxygen rather thanair circumvents the formation of NOx . In addition, the absenceof N2 in the exhaust products allows for an easy separation ofthe non-recycled CO2 from H2O (e.g. via condensation), thusfacilitating the sequestration or further disposal of CO2. Puregas-phase combustion of such heavily diluted mixtures at thosetemperatures is particularly challenging, rendering “catalyticrich combustion” a viable alternative. Understanding the impactof large H2O and CO2 dilution on the catalytic reaction path-ways controlling the synthesis gas production is of paramountimportance for the new power generation processes. Validatedcatalytic and gas-phase kinetics are indispensable input in mul-tidimensional numerical codes needed for reactor design.
Steam addition is widely used in the autothermal catalyticreforming of methane for the chemical production of hydrogen(e.g. Klein et al., 2001; Bharadwaj and Schmidt, 1994). More-over, steam facilitates the autothermal reforming of ethanol(Deluga et al., 2004) and suppresses the formation of olefinsin the reforming of higher hydrocarbons (Dreyer et al., 2005).The previous works refer to short-contact-time (∼ms) reactors,except in Bharadwaj and Schmidt (1994) with correspondingtimes of 0.1–0.5 s. On the other hand, dry (CO2) reformingof methane is a long-contact-time (1–2 s) industrial process,which is used for the adjustment of the CO/H2 ratio at theexit of a steam reformer and for the synthesis of alcohols,dimethylether and acetic acid. Dry reforming of methane overRh-supported catalysts has been investigated by Bitter et al.(1998), Ferreira-Aparicio et al. (1998) and Wang and Rucken-stein (2000), while mechanistic aspects of this reaction havebeen reported in Efstathiou et al. (1996), Mark and Maier (1996)and Richardson et al. (2003). The role of CO2 reforming at
the short contact times of interest to CPO is still under de-bate. Very few studies addressed dry reforming of methane atmillisecond-long contact times (Basile et al., 1998).
The CPO of methane in gas turbines is differentiated in manyways from that employed in chemical processes. Nearly com-plete conversion of methane is sought in the latter, whereas inthe former a ∼ 50% conversion suffices given the post-catalystgaseous combustion zone. Moreover, the presence of large CO2(in addition to H2O) dilution in gas-turbines raises the issue ofCO2 reforming impacting the synthesis gas production. The op-timization of the H2 and CO selectivities is also not a control-ling issue; CO is converted to CO2 and the amount of hydrogenproduced should only suffice for the stabilization of follow-upgaseous combustion zone. On the other hand, in gas-turbinesthere are stringent catalyst light-off requirements (∼ 670 K orless) at gas hourly spatial velocities (GHSV) of at least 106 h−1.
The influence of large H2O and CO2 dilution on the CPOprocesses pertinent to gas-turbines has not been hitherto elab-orated. The present study undertakes an experimental and nu-merical investigation of methane CPO with large H2O and CO2dilution (CH4/O2 and H2O/CO2 volumetric ratios of two with69.4% vol. exhaust gas). Steady and transient experiments havebeen carried out at 5 bar in a short contact time (residencetimes ∼ 8 ms) prototype gas-turbine honeycomb catalytic re-actor coated with ZrO2-supported rhodium (1% weight). Gasanalyzers (GA) and gas chromatography provided the exhaustcomposition whereas thermocouples monitored the inlet, out-let, and reactor temperature. The steady experiments were sim-ulated with a single-channel model based on a full elliptic 2Dnumerical code that included elementary hetero-/homogeneouschemical reaction schemes, detailed transport, and heat conduc-tion in the solid. The main objectives were to elucidate the im-pact of H2O and CO2 addition on the steady CPO processes, toassess the applicability of existing catalytic reaction schemes,and to identify the chemical pathways responsible for methaneconsumption and synthesis gas production. Particular objec-tives were to address key thermal management requirementsat steady reactor performance and to investigate the catalyticignition characteristics in light of the corresponding stringentrequirements of gas turbines.
2. Experimental
2.1. High-pressure reactor
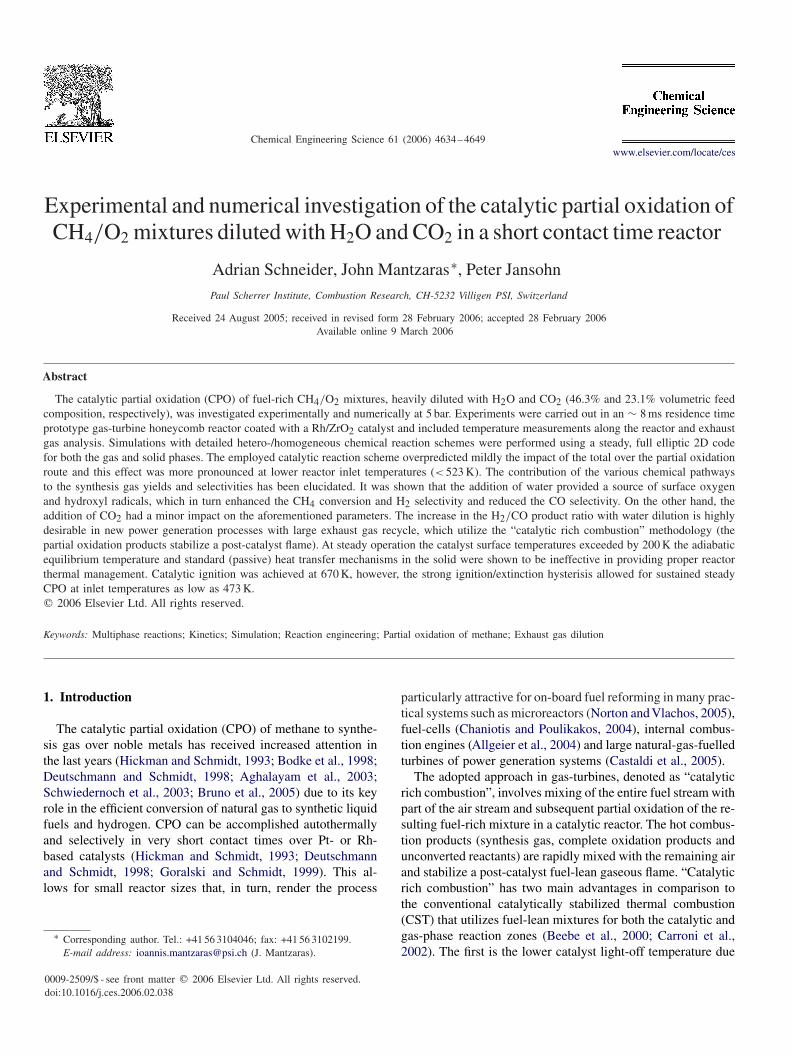
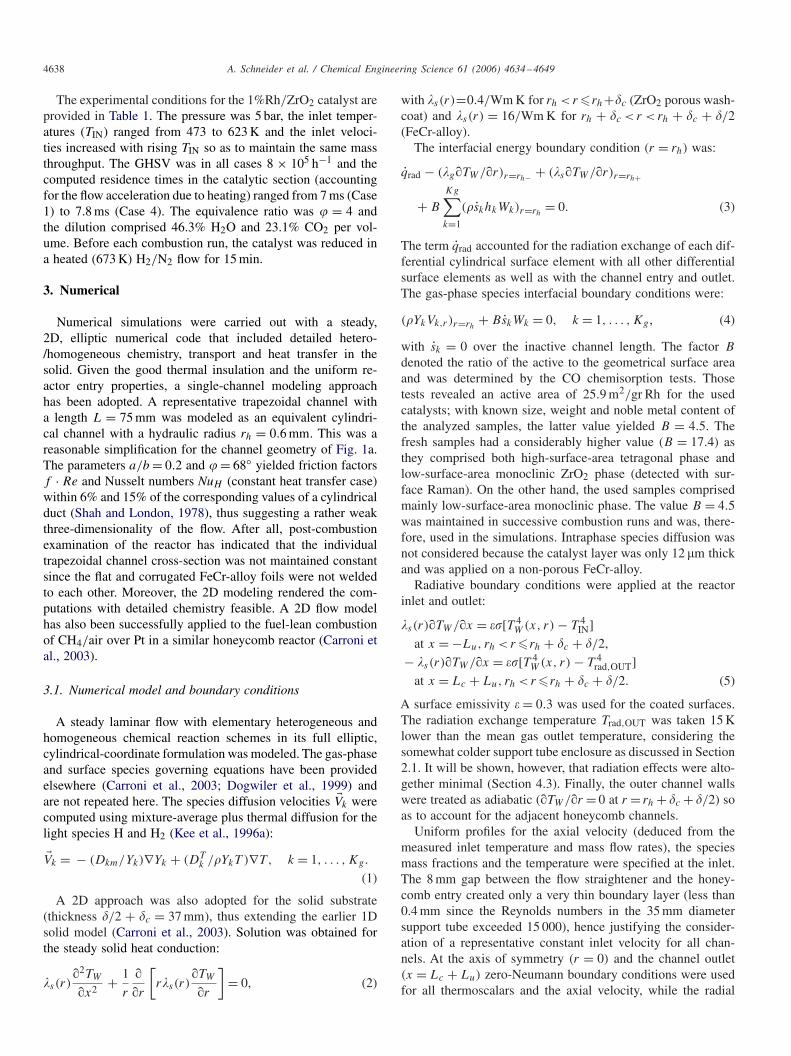
The test rig consisted of a prototype gas-turbine honeycombcatalytic reactor (Fig. 1a,b), which was positioned inside ahigh-pressure tank (Fig. 1a), and a steam-generator supplyingsuperheated steam (Fig. 1c). The reactor itself has also beenused in earlier complete oxidation studies of fuel-lean CH4/airmixtures over Pt at turbine-relevant conditions (Carroniet al., 2003). It comprised a 35 mm inner-diameter and 1.5 mmthick steel tube, whereby alternating flat and corrugated 50-�m-thick FeCr-alloy foils created a honeycomb structure (seedetail in Fig. 1b) with trapezoidal channels of hydraulic diam-eter dh = 1.2 mm. The reactor had a total length L = 75 mmand was mounted inside a well-insulated (using a 30 mm thick
4636 A. Schneider et al. / Chemical Engineering Science 61 (2006) 4634–4649
Fig. 1. (a) High-pressure test rig, (b) detail of the honeycomb reactor, and(c) steam generator. All distances are in mm. In (b) a/b = 0.2, � = 68◦ and� = 50 �m.
fiber ceramic material) cylindrical steel frame. The first andlast honeycomb sections with lengths Lu = 10 mm were cat-alytically inactive, whereas the central length Lc = 55 mm(Fig. 1a) was coated with a Rh/ZrO2 catalyst according tothe procedure outlined in Section 2.4. The inlet, outlet andreactor temperatures were monitored with five 50-�m-thickK-type (Ni/Cr–Ni/Al) sheathed thermocouples. Four of thecarrying wires were driven counterflow inside the reactorthrough four honeycomb channels so as to position the ther-mocouple beads at x = −15, 0, 27 and 55 mm (x = 0 denotesthe beginning of the Rh-coated section); a fifth thermocoupleat x = 75 mm monitored the outlet temperature. The threethermocouples inside the honeycomb (B, C and D in Fig. 1a)provided neither the true surface nor the mean gas temperaturebut rather a weighted average, which was only indicative ofthe local steady reactor temperature. Nonetheless, those mea-surements were well-suited for the determination of light-off,wherein the inlet temperature was ramped at a rate of +2 Kper minute until a vigorous steady burning state could bereached.
High-pressure bottles provided technical-grade CH4(> 99.5%), CO2, and O2. The flows were regulated and mea-sured with three Brooks mass-flow controllers, leading toequivalence ratio accuracies better than ±0.5%. The CO2, andO2 flows were preheated 3 kW resistive heater to tempera-tures up to 720 K and then mixed with superheated steam (seeFig. 1a and Section 2.2). Room-temperature methane was in-jected farther downstream. The resulting CH4/O2/CO2/H2Omixture passed through two sequential static mixers (Sulzer
SMV) and a 40-mm long packing of ceramic spheres (2-mmin diameter) that straightened the flow. Those units were ther-mally insulated with a ceramic fiber material (Fig. 1a). AK-type thermocouple positioned immediately after the staticmixers monitored the gas temperature, which was used asa feedback to control the amount of CO2/O2 preheat andthe degree of steam superheat. The honeycomb reactor waslocated 8 mm downstream of the flow straightener and wasmounted inside a 2.5 mm thick and 35 mm internal-diametersupport steel tube. To minimize the heat losses, only the firstand last 2 mm of the honeycomb contacted the steel tube; inthe remaining length, a 1-mm-thick annular air-cushion wasprovided. Finally, the support tube ended in a discharge nozzlethat directed the combustion products first to an exhaust pipeand then to a water-cooled outlet of the high-pressure tank.
The high-pressure tank that housed the reactor was astainless-steel cylindrical structure with a length of 1.8 m andan internal diameter of 0.28 m; the same casing also housedan optically accessible channel-flow catalytic reactor of ear-lier fundamental kinetic studies (Reinke et al., 2002, 2004,2005; Appel et al., 2005a). A continuous flow of flushingnitrogen removed any unwanted combustion products fromthe free volume between the vessel and the reactor assembly(Fig. 1a). Visual inspection of the reactor was achieved via aquartz window at the rear flange (Fig. 1a) and two 300×35 mmquartz windows at the tank sides (not shown in Fig. 1). Finally,the thermocouples, the gas sampling probe and its associatedwater cooling lines (see Section 2.3) were driven inside thetank through high-pressure feedthroughs positioned on fourdedicated flanges.
Radiation corrections were not required for the outlet ther-mocouple (E) measurements since the wall temperature at thereactor exit exceeded the mean gas outlet temperature (TOUT =TE) by less than 20 K (see Fig. 3). Moreover, TOUT was at themost 15 K higher than the surface temperature of the surround-ing metal support tube due to the good thermal insulation; thiswas attested by traversing radially the outlet thermocouple E.On the other hand, radiation corrections were applied to the in-let thermocouple (A) that had a direct view to the hot catalystentry. The corrections amounted to less than 8 K given the par-ticular levels of gas inlet and maximum catalyst temperature(shown in Table 1 and Fig. 3). The corrected inlet temperatures(TIN) were also consistent with the temperatures measured afterthe static mixers (∼ 10 K lower). Overall, the absolute accu-racy of the gas temperature measurements was ±10 K for thehot outlet and ±6 K for the inlet.
2.2. Steam generator
The steam generator (Fig. 1c) provided superheated steamat flow rates of 0.9–20 g/s and temperatures of 473–1273 K.Such high mass flow rates could not be supplied by com-mon electric-heater-based systems; therefore, the heat of H2/O2combustion was used to vaporize known amounts of added liq-uid water. The device consisted of a combustion chamber, agas/water supply and an electronic control unit. The combustionchamber was designed by DLR (Beer and Willms, 1993) and
A. Schneider et al. / Chemical Engineering Science 61 (2006) 4634–4649 4637
Table 1Experimental conditionsa
Case p (bar) UIN (m/s) TIN (K) ReIN
1 5 5.1 623 5902 5 4.7 573 6373 5 4.3 523 6894 5 3.9 473 755
aPressure, inlet velocity, temperature and Reynolds number. The inlet volumetric compositions for all cases are: 20.4% CH4, 10.2% O2, 46.3% H2O and23.1% CO2.
comprised three modules: the hot gas igniter, the main combus-tion chamber and the catalytic converter. In the former module asmall amount of H2/O2/N2 was ignited by conventional sparkplugs. The resulting hot exhaust gases were then flushed intothe main chamber to ignite a central H2/O2 flame, which wasstabilized by the recirculation zone of a sudden geometric ex-pansion. A continuous spray injection of demineralized liquidwater controlled the amount of steam and the reactor tempera-ture. A follow-up Ni–Pd catalyst packing converted any escap-ing H2 and O2 to H2O. To avoid hydrogen breakthrough, thecentral burner was operated slightly fuel-lean (0.98�� < 1).An equivalence-ratio probe (similar to those used in automo-tive engines) positioned at the downstream end of the catalyticconverter monitored the O2 content and determined the degreeof steam purity. Step-motor-controlled needle valves regulatedthe liquid water and the gaseous flows of the main combustor;a Micro-Motion-Elite sensor and Brooks meters measured theliquid water and the gaseous mass flows, respectively. Finally,a thermocouple positioned at the downstream end of the cat-alytic converter provided the steam temperature.
2.3. Gas analysis
A fraction of the exhaust gas was sampled with a probe po-sitioned 45 mm downstream of the reactor exit (Fig. 1a). Theprobe consisted of a water-cooled Si-coated steel tube so asto mitigate catalytic and gas-phase reactions in the sampledgas. The steam was further condensed in a serpentine-type heatexchanger (water-cooled) outside the high-pressure tank. Thedried gases entered a rack of GA and the sample port of agas chromatograph (GC). Water removal was necessary for theproper operation of both analysis instruments. However, thecompositions of the actual wet gas products could still be de-termined by carrying out element balances.
Hartmann and Braun GA (Uras-10E for CO, Magnos-6Gfor O2 and Caldos-5G for H2) were used for continuous gasanalysis; their operating principle was based on NDIR for CO,paramagnetism for O2 and thermal conductivity for H2. Theaccuracy of the measurements (determined with calibration gasmixtures) was particularly good for CO (0.3% relative errorfor 10–14% vol. CO in the dry gas) and that of O2 was stillgood despite the associated low levels (20% relative error for∼ 1% vol. O2). However, the presence of gases with thermalconductivities largely different than that of reference N2 (e.g.CH4 and CO2) resulted in larger inaccuracies for the H2 lev-els (20% relative error for typical ∼ 30% vol. H2 in the dry
gas); this effect was partly compensated by calibrating the de-vice with simulated exhaust gas compositions. More detailedanalysis was carried out with an HP-6890++ GC equipped withporous polymer and molecular siever columns and a thermalconductivity sensor. The carrier gas was helium and the analy-sis was discontinuous with one measurement every 8 min. In-tegration was performed with the HP ChemStation software,while a spreadsheet was used to calculate the final composi-tions. The GC allowed measurements of all key species. Theporous polymer column separated CO2 before the gas enteredthe molecular sieve. The GC has been tested against a selectionof different calibration gas mixtures. Even though the hydro-gen signals were weak due to the choice of He as carrier gas,for the present substantial levels (∼ 30% vol. H2) the accuracywas good (relative error for H2 ∼ 4%). The relative error inthe measurements of CH4, CO2 and CO was 4–5% and thatof O2 was 60%. For the short GC runtimes, higher hydrocar-bons could not be detected; however, the element balances haveshown that their contribution—if any—was within the experi-mental uncertainty. The GC measurements will be used in theensuing analysis while the GA data will provide an additionalcontrol for the CO and O2 compositions.
2.4. Catalyst preparation and operating conditions
The catalyst of the present investigation was 1%Rh (wt) onZrO2, prepared by incipient wetness impregnation of the ZrO2support with a Rh(NO3)3 solution. The impregnated catalystpowder was calcined at 1120 K for 10 h. A slurry prepared fromthe powder and a solvent mixture was sprayed on FeCr-alloyfoils. The coated foils were calcined at 920 K for 5 h and themeasured catalytic layer thickness was �c ≈ 12 �m. In the in-active front and rear sections (Lu = 10 mm) of the FeCr-alloyfoils, a 12 �m ZrO2 layer without rhodium was applied. Thetotal and active areas of both fresh and used Rh-coated FeCr-alloy foils were measured with BET (N2-physisorption) andCO-chemisorption, respectively. In addition, the surface com-position was determined with X-ray photoelectron spectroscopy(XPS); XPS provided information on the oxidation state of thedetected species and also showed that Fe or Cr did not diffusein the surface. Finally, surface Raman spectroscopy was usedto determine the crystal structure of the support. The detailedcatalyst characterization is outside the scope of this work andis reported elsewhere (Eriksson et al., 2005a); in the following,only information relevant to the current investigation will bepresented.
4638 A. Schneider et al. / Chemical Engineering Science 61 (2006) 4634–4649
The experimental conditions for the 1%Rh/ZrO2 catalyst areprovided in Table 1. The pressure was 5 bar, the inlet temper-atures (TIN) ranged from 473 to 623 K and the inlet veloci-ties increased with rising TIN so as to maintain the same massthroughput. The GHSV was in all cases 8 × 10⁵ h−1 and thecomputed residence times in the catalytic section (accountingfor the flow acceleration due to heating) ranged from 7 ms (Case1) to 7.8 ms (Case 4). The equivalence ratio was � = 4 andthe dilution comprised 46.3% H2O and 23.1% CO2 per vol-ume. Before each combustion run, the catalyst was reduced ina heated (673 K) H2/N2 flow for 15 min.
3. Numerical
Numerical simulations were carried out with a steady,2D, elliptic numerical code that included detailed hetero-/homogeneous chemistry, transport and heat transfer in thesolid. Given the good thermal insulation and the uniform re-actor entry properties, a single-channel modeling approachhas been adopted. A representative trapezoidal channel witha length L = 75 mm was modeled as an equivalent cylindri-cal channel with a hydraulic radius rh = 0.6 mm. This was areasonable simplification for the channel geometry of Fig. 1a.The parameters a/b = 0.2 and � = 68◦ yielded friction factorsf · Re and Nusselt numbers NuH (constant heat transfer case)within 6% and 15% of the corresponding values of a cylindricalduct (Shah and London, 1978), thus suggesting a rather weakthree-dimensionality of the flow. After all, post-combustionexamination of the reactor has indicated that the individualtrapezoidal channel cross-section was not maintained constantsince the flat and corrugated FeCr-alloy foils were not weldedto each other. Moreover, the 2D modeling rendered the com-putations with detailed chemistry feasible. A 2D flow modelhas also been successfully applied to the fuel-lean combustionof CH4/air over Pt in a similar honeycomb reactor (Carroni etal., 2003).
3.1. Numerical model and boundary conditions
A steady laminar flow with elementary heterogeneous andhomogeneous chemical reaction schemes in its full elliptic,cylindrical-coordinate formulation was modeled. The gas-phaseand surface species governing equations have been providedelsewhere (Carroni et al., 2003; Dogwiler et al., 1999) andare not repeated here. The species diffusion velocities �Vk werecomputed using mixture-average plus thermal diffusion for thelight species H and H2 (Kee et al., 1996a):
�Vk = − (Dkm/Yk)∇Yk + (DTk /�YkT )∇T , k = 1, . . . , Kg .
(1)
A 2D approach was also adopted for the solid substrate(thickness �/2 + �c = 37 mm), thus extending the earlier 1Dsolid model (Carroni et al., 2003). Solution was obtained forthe steady solid heat conduction:
�s(r)�2TW
�x2 + 1
r
�
�r
[r�s(r)
�TW
�r
]= 0, (2)
with �s(r)=0.4/Wm K for rh < r �rh+�c (ZrO2 porous wash-coat) and �s(r) = 16/Wm K for rh + �c < r < rh + �c + �/2(FeCr-alloy).
The interfacial energy boundary condition (r = rh) was:
qrad − (�g�TW/�r)r=rh− + (�s�TW/�r)r=rh+
+ B
Kg∑k=1
(�skhkWk)r=rh = 0. (3)
The term qrad accounted for the radiation exchange of each dif-ferential cylindrical surface element with all other differentialsurface elements as well as with the channel entry and outlet.The gas-phase species interfacial boundary conditions were:
(�YkVk,r )r=rh + BskWk = 0, k = 1, . . . , Kg , (4)
with sk = 0 over the inactive channel length. The factor B
denoted the ratio of the active to the geometrical surface areaand was determined by the CO chemisorption tests. Thosetests revealed an active area of 25.9 m2/gr Rh for the usedcatalysts; with known size, weight and noble metal content ofthe analyzed samples, the latter value yielded B = 4.5. Thefresh samples had a considerably higher value (B = 17.4) asthey comprised both high-surface-area tetragonal phase andlow-surface-area monoclinic ZrO2 phase (detected with sur-face Raman). On the other hand, the used samples comprisedmainly low-surface-area monoclinic phase. The value B = 4.5was maintained in successive combustion runs and was, there-fore, used in the simulations. Intraphase species diffusion wasnot considered because the catalyst layer was only 12 �m thickand was applied on a non-porous FeCr-alloy.
Radiative boundary conditions were applied at the reactorinlet and outlet:
�s(r)�TW/�x = ��[T 4W(x, r) − T 4
IN]at x = −Lu, rh < r �rh + �c + �/2,
− �s(r)�TW/�x = ��[T 4W(x, r) − T 4
rad,OUT]at x = Lc + Lu, rh < r �rh + �c + �/2. (5)
A surface emissivity � = 0.3 was used for the coated surfaces.The radiation exchange temperature Trad,OUT was taken 15 Klower than the mean gas outlet temperature, considering thesomewhat colder support tube enclosure as discussed in Section2.1. It will be shown, however, that radiation effects were alto-gether minimal (Section 4.3). Finally, the outer channel wallswere treated as adiabatic (�TW/�r = 0 at r = rh + �c + �/2) soas to account for the adjacent honeycomb channels.
Uniform profiles for the axial velocity (deduced from themeasured inlet temperature and mass flow rates), the speciesmass fractions and the temperature were specified at the inlet.The 8 mm gap between the flow straightener and the honey-comb entry created only a very thin boundary layer (less than0.4 mm since the Reynolds numbers in the 35 mm diametersupport tube exceeded 15 000), hence justifying the consider-ation of a representative constant inlet velocity for all chan-nels. At the axis of symmetry (r = 0) and the channel outlet(x = Lc + Lu) zero-Neumann boundary conditions were usedfor all thermoscalars and the axial velocity, while the radial
A. Schneider et al. / Chemical Engineering Science 61 (2006) 4634–4649 4639
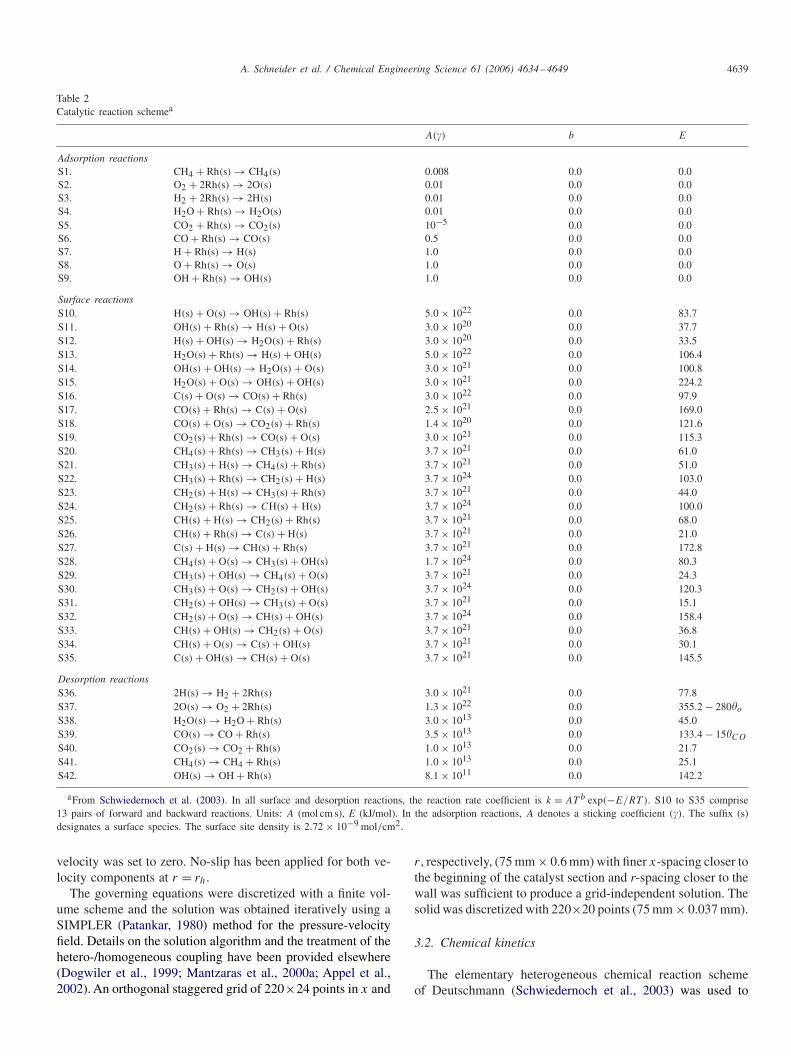
Table 2Catalytic reaction schemea
A(�) b E
Adsorption reactionsS1. CH4 + Rh(s) → CH4(s) 0.008 0.0 0.0S2. O2 + 2Rh(s) → 2O(s) 0.01 0.0 0.0S3. H2 + 2Rh(s) → 2H(s) 0.01 0.0 0.0S4. H2O + Rh(s) → H2O(s) 0.01 0.0 0.0S5. CO2 + Rh(s) → CO2(s) 10−5 0.0 0.0S6. CO + Rh(s) → CO(s) 0.5 0.0 0.0S7. H + Rh(s) → H(s) 1.0 0.0 0.0S8. O + Rh(s) → O(s) 1.0 0.0 0.0S9. OH + Rh(s) → OH(s) 1.0 0.0 0.0
Surface reactionsS10. H(s) + O(s) → OH(s) + Rh(s) 5.0 × 10²² 0.0 83.7S11. OH(s) + Rh(s) → H(s) + O(s) 3.0 × 10²⁰ 0.0 37.7S12. H(s) + OH(s) → H2O(s) + Rh(s) 3.0 × 10²⁰ 0.0 33.5S13. H2O(s) + Rh(s) → H(s) + OH(s) 5.0 × 10²² 0.0 106.4S14. OH(s) + OH(s) → H2O(s) + O(s) 3.0 × 10²¹ 0.0 100.8S15. H2O(s) + O(s) → OH(s) + OH(s) 3.0 × 10²¹ 0.0 224.2S16. C(s) + O(s) → CO(s) + Rh(s) 3.0 × 10²² 0.0 97.9S17. CO(s) + Rh(s) → C(s) + O(s) 2.5 × 10²¹ 0.0 169.0S18. CO(s) + O(s) → CO2(s) + Rh(s) 1.4 × 10²⁰ 0.0 121.6S19. CO2(s) + Rh(s) → CO(s) + O(s) 3.0 × 10²¹ 0.0 115.3S20. CH4(s) + Rh(s) → CH3(s) + H(s) 3.7 × 10²¹ 0.0 61.0S21. CH3(s) + H(s) → CH4(s) + Rh(s) 3.7 × 10²¹ 0.0 51.0S22. CH3(s) + Rh(s) → CH2(s) + H(s) 3.7 × 1024 0.0 103.0S23. CH2(s) + H(s) → CH3(s) + Rh(s) 3.7 × 10²¹ 0.0 44.0S24. CH2(s) + Rh(s) → CH(s) + H(s) 3.7 × 1024 0.0 100.0S25. CH(s) + H(s) → CH2(s) + Rh(s) 3.7 × 10²¹ 0.0 68.0S26. CH(s) + Rh(s) → C(s) + H(s) 3.7 × 10²¹ 0.0 21.0S27. C(s) + H(s) → CH(s) + Rh(s) 3.7 × 10²¹ 0.0 172.8S28. CH4(s) + O(s) → CH3(s) + OH(s) 1.7 × 1024 0.0 80.3S29. CH3(s) + OH(s) → CH4(s) + O(s) 3.7 × 10²¹ 0.0 24.3S30. CH3(s) + O(s) → CH2(s) + OH(s) 3.7 × 1024 0.0 120.3S31. CH2(s) + OH(s) → CH3(s) + O(s) 3.7 × 10²¹ 0.0 15.1S32. CH2(s) + O(s) → CH(s) + OH(s) 3.7 × 1024 0.0 158.4S33. CH(s) + OH(s) → CH2(s) + O(s) 3.7 × 10²¹ 0.0 36.8S34. CH(s) + O(s) → C(s) + OH(s) 3.7 × 10²¹ 0.0 30.1S35. C(s) + OH(s) → CH(s) + O(s) 3.7 × 10²¹ 0.0 145.5
Desorption reactionsS36. 2H(s) → H2 + 2Rh(s) 3.0 × 10²¹ 0.0 77.8S37. 2O(s) → O2 + 2Rh(s) 1.3 × 10²² 0.0 355.2 − 280�o
S38. H2O(s) → H2O + Rh(s) 3.0 × 10¹³ 0.0 45.0S39. CO(s) → CO + Rh(s) 3.5 × 10¹³ 0.0 133.4 − 15�CO
S40. CO2(s) → CO2 + Rh(s) 1.0 × 10¹³ 0.0 21.7S41. CH4(s) → CH4 + Rh(s) 1.0 × 10¹³ 0.0 25.1S42. OH(s) → OH + Rh(s) 8.1 × 10¹¹ 0.0 142.2
aFrom Schwiedernoch et al. (2003). In all surface and desorption reactions, the reaction rate coefficient is k = AT b exp(−E/RT ). S10 to S35 comprise13 pairs of forward and backward reactions. Units: A (mol cm s), E (kJ/mol). In the adsorption reactions, A denotes a sticking coefficient (�). The suffix (s)designates a surface species. The surface site density is 2.72 × 10⁻⁹ mol/cm2.
velocity was set to zero. No-slip has been applied for both ve-locity components at r = rh.
The governing equations were discretized with a finite vol-ume scheme and the solution was obtained iteratively using aSIMPLER (Patankar, 1980) method for the pressure-velocityfield. Details on the solution algorithm and the treatment of thehetero-/homogeneous coupling have been provided elsewhere(Dogwiler et al., 1999; Mantzaras et al., 2000a; Appel et al.,2002). An orthogonal staggered grid of 220×24 points in x and
r , respectively, (75 mm × 0.6 mm) with finer x-spacing closer tothe beginning of the catalyst section and r-spacing closer to thewall was sufficient to produce a grid-independent solution. Thesolid was discretized with 220×20 points (75 mm × 0.037 mm).
3.2. Chemical kinetics
The elementary heterogeneous chemical reaction schemeof Deutschmann (Schwiedernoch et al., 2003) was used to
4640 A. Schneider et al. / Chemical Engineering Science 61 (2006) 4634–4649
describe the partial oxidation of methane over rhodium. Thescheme consisted of 38 reactions, 12 surface and 6 gas-phasespecies (see Table 2). The mechanism has been augmented byfour radical adsorption/desorption reactions (S7–S9 and S42)in order to properly account for the potential onset of homoge-neous ignition (Mantzaras et al., 2000b). Unity sticking coeffi-cients were used in S7–S9 and literature values for the kineticparameters of S42 (Hickman and Schmidt, 1993). Fundamen-tal kinetic studies in an optically accessible reactor have shown(Appel et al., 2005a) that the aforementioned catalytic schemereproduced the methane conversion and synthesis gas yields inCPO of CH4/air (without exhaust gas dilution), at least overthe reactor extent were oxygen was still available. In the presentstudies a small oxygen breakthrough was always assured.
The C2/H/O gas-phase scheme of Warnatz et al. (1996)was used to assess the impact of homogeneous chemistry. Thisscheme has reproduced homogeneous ignition characteristicsin CPO of CH4/air over Rh (Appel et al., 2005a). Simula-tions of the present experiments have clearly indicated that thehomogeneous reaction pathway was negligible. The gas-phasecontribution was also negligible over the 45-mm-long gap sep-arating the reactor exit and the sampling probe as demonstratedby additional plug-flow-reactor simulations. The minimal gas-phase contribution was further attested experimentally: turningthe cooling water of the sampling probe off, resulted in only3% relative rise of the GC-measured hydrogen volumetric com-position, despite the fact that the residence time in the visiblyhot part of the probe was about 10 times longer than that of thereactor. Therefore, the inclusion of gas-phase chemistry and ofthe additional four catalytic reactions did not impact the fol-lowing simulations.
The CHEMKIN database was used to evaluate transportproperties (Kee et al., 1996a). Thermodynamic data for the gas-phase species were included in the chemical scheme (Warnatzet al., 1996). Finally, surface and gas-phase reaction rates wereevaluated with SURFACE CHEMKIN (Coltrin et al., 1996) andCHEMKIN (Kee et al., 1996b), respectively.
4. Results and discussion
4.1. Catalytic ignition
Even though steady CPO constitutes the main topic of thiswork, it is worthwhile to demonstrate that the examined cata-lyst meets light-off requirements at turbine-relevant conditions,i.e., catalytic ignition at inlet temperatures as low as 670 Kand realistically high space velocities (∼ 106 h−1). In certainprocesses with exhaust gas recycle, such as the advanced zeroemissions approach of Griffin et al. (2004), the ignition re-quirements may be less stringent since the inlet temperaturescan provisionally reach 850 K. Table 3 provides the measuredlight-off temperatures of four representative catalysts with dif-ferent Rh-loadings and supports, selected from a larger num-ber of screened catalysts. Details of the catalyst screening atthe present operating conditions are provided in Eriksson et al.(2005a), whereas at lower H2O dilutions (10% vol.) and GHSV(105 h−1) in Eriksson et al. (2005b). The mass throughput in
Table 3Catalytic ignition experimentsa
Catalyst Rh (%wt) Support Tig (K)
1 0.5 ZrO2 7002 1 ZrO2 6703 1 Ce–ZrO2 6554 1 Ce0.9La0.1O2 710
aIgnition temperature for various investigated catalysts.
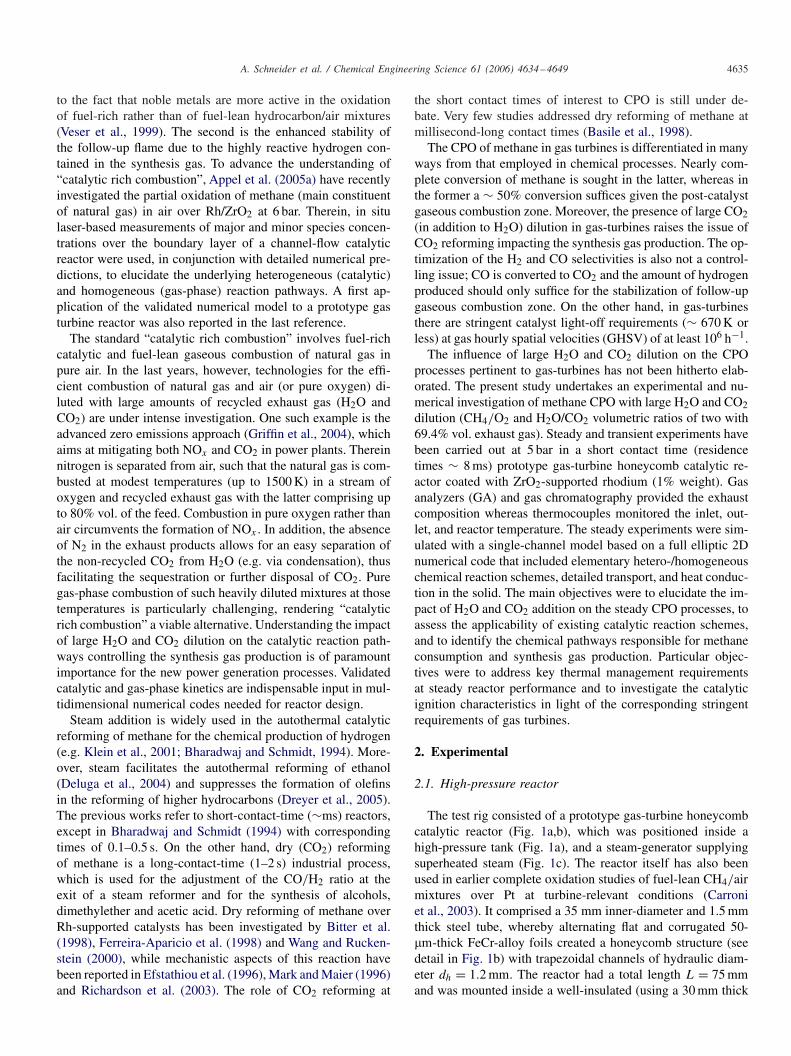
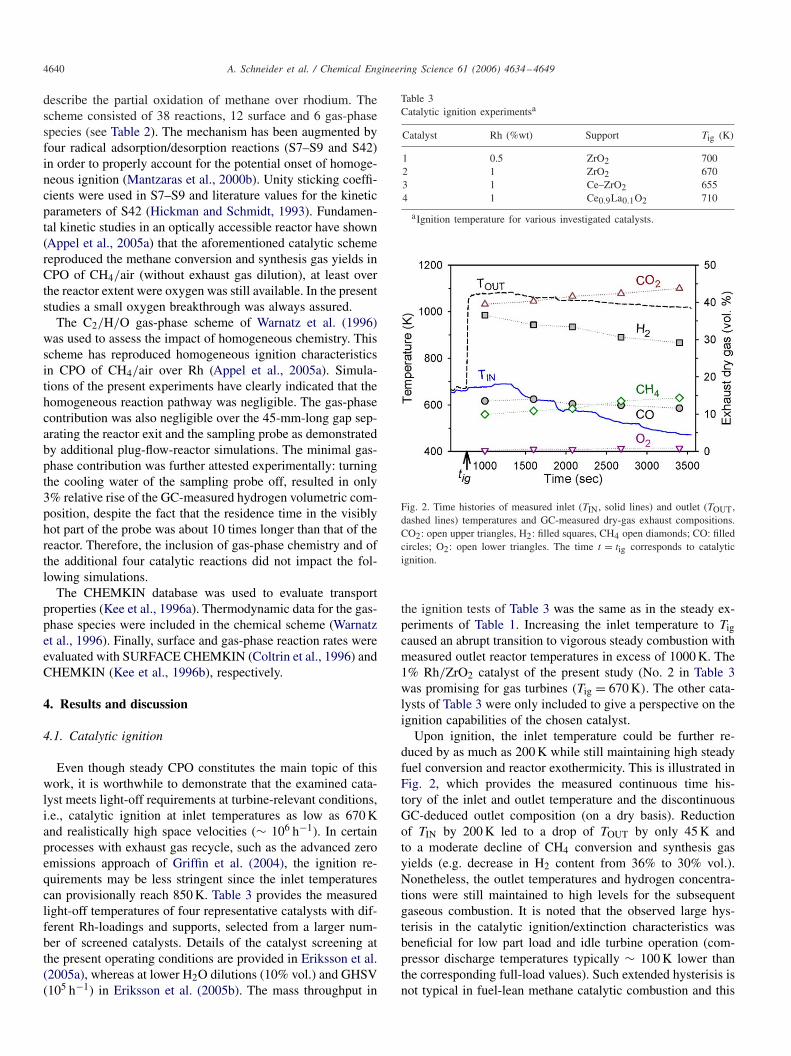
Fig. 2. Time histories of measured inlet (TIN, solid lines) and outlet (TOUT,dashed lines) temperatures and GC-measured dry-gas exhaust compositions.CO2: open upper triangles, H2: filled squares, CH4 open diamonds; CO: filledcircles; O2: open lower triangles. The time t = tig corresponds to catalyticignition.
the ignition tests of Table 3 was the same as in the steady ex-periments of Table 1. Increasing the inlet temperature to Tigcaused an abrupt transition to vigorous steady combustion withmeasured outlet reactor temperatures in excess of 1000 K. The1% Rh/ZrO2 catalyst of the present study (No. 2 in Table 3was promising for gas turbines (Tig = 670 K). The other cata-lysts of Table 3 were only included to give a perspective on theignition capabilities of the chosen catalyst.
Upon ignition, the inlet temperature could be further re-duced by as much as 200 K while still maintaining high steadyfuel conversion and reactor exothermicity. This is illustrated inFig. 2, which provides the measured continuous time his-tory of the inlet and outlet temperature and the discontinuousGC-deduced outlet composition (on a dry basis). Reductionof TIN by 200 K led to a drop of TOUT by only 45 K andto a moderate decline of CH4 conversion and synthesis gasyields (e.g. decrease in H2 content from 36% to 30% vol.).Nonetheless, the outlet temperatures and hydrogen concentra-tions were still maintained to high levels for the subsequentgaseous combustion. It is noted that the observed large hys-terisis in the catalytic ignition/extinction characteristics wasbeneficial for low part load and idle turbine operation (com-pressor discharge temperatures typically ∼ 100 K lower thanthe corresponding full-load values). Such extended hysterisis isnot typical in fuel-lean methane catalytic combustion and this
A. Schneider et al. / Chemical Engineering Science 61 (2006) 4634–4649 4641
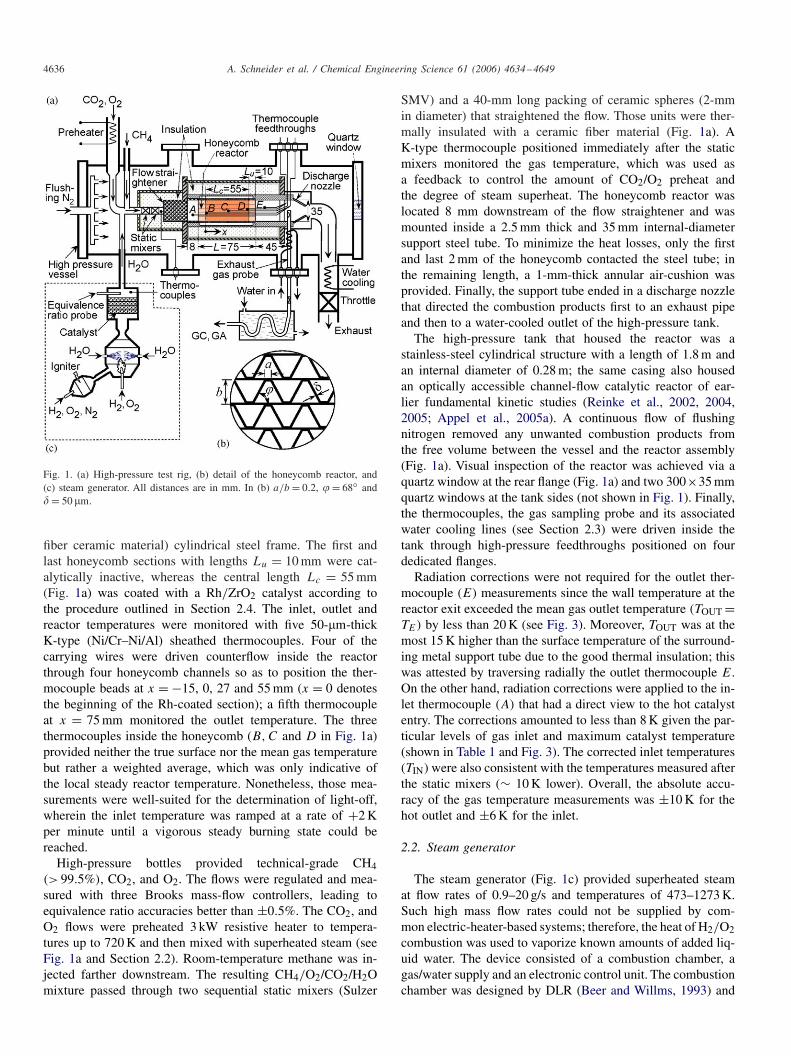
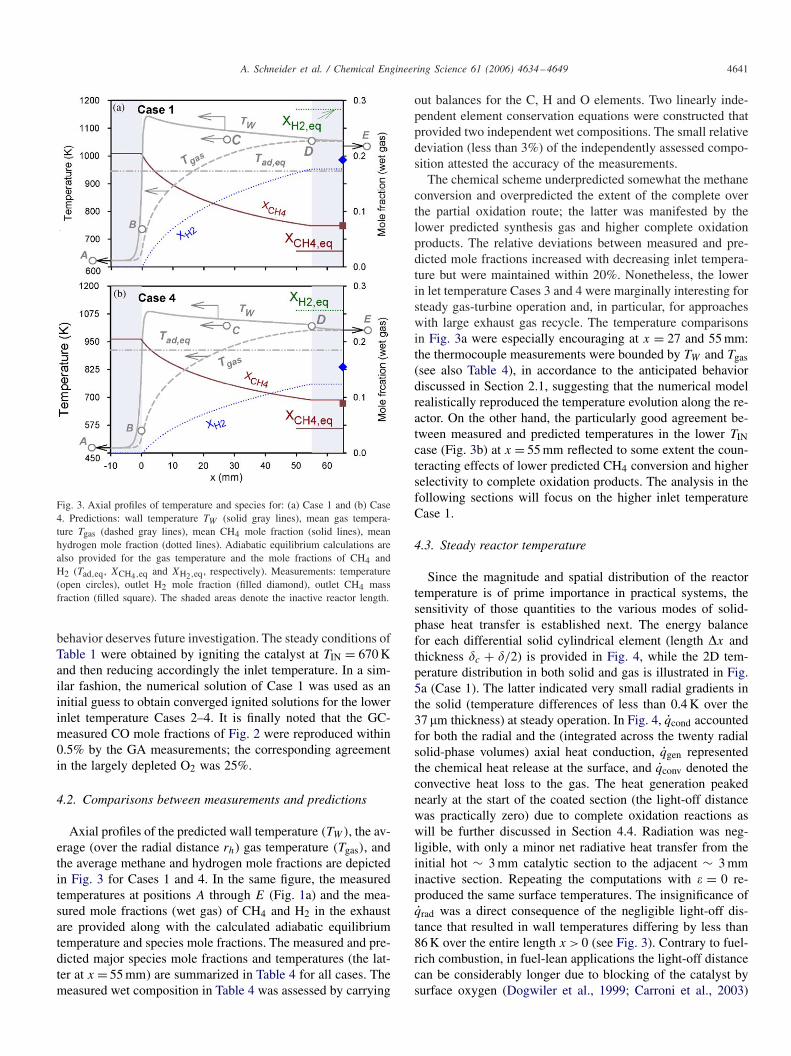
Fig. 3. Axial profiles of temperature and species for: (a) Case 1 and (b) Case4. Predictions: wall temperature TW (solid gray lines), mean gas tempera-ture Tgas (dashed gray lines), mean CH4 mole fraction (solid lines), meanhydrogen mole fraction (dotted lines). Adiabatic equilibrium calculations arealso provided for the gas temperature and the mole fractions of CH4 andH2 (Tad,eq, XCH4,eq and XH2,eq, respectively). Measurements: temperature(open circles), outlet H2 mole fraction (filled diamond), outlet CH4 massfraction (filled square). The shaded areas denote the inactive reactor length.
behavior deserves future investigation. The steady conditions ofTable 1 were obtained by igniting the catalyst at TIN = 670 Kand then reducing accordingly the inlet temperature. In a sim-ilar fashion, the numerical solution of Case 1 was used as aninitial guess to obtain converged ignited solutions for the lowerinlet temperature Cases 2–4. It is finally noted that the GC-measured CO mole fractions of Fig. 2 were reproduced within0.5% by the GA measurements; the corresponding agreementin the largely depleted O2 was 25%.
4.2. Comparisons between measurements and predictions
Axial profiles of the predicted wall temperature (TW ), the av-erage (over the radial distance rh) gas temperature (Tgas), andthe average methane and hydrogen mole fractions are depictedin Fig. 3 for Cases 1 and 4. In the same figure, the measuredtemperatures at positions A through E (Fig. 1a) and the mea-sured mole fractions (wet gas) of CH4 and H2 in the exhaustare provided along with the calculated adiabatic equilibriumtemperature and species mole fractions. The measured and pre-dicted major species mole fractions and temperatures (the lat-ter at x = 55 mm) are summarized in Table 4 for all cases. Themeasured wet composition in Table 4 was assessed by carrying
out balances for the C, H and O elements. Two linearly inde-pendent element conservation equations were constructed thatprovided two independent wet compositions. The small relativedeviation (less than 3%) of the independently assessed compo-sition attested the accuracy of the measurements.
The chemical scheme underpredicted somewhat the methaneconversion and overpredicted the extent of the complete overthe partial oxidation route; the latter was manifested by thelower predicted synthesis gas and higher complete oxidationproducts. The relative deviations between measured and pre-dicted mole fractions increased with decreasing inlet tempera-ture but were maintained within 20%. Nonetheless, the lowerin let temperature Cases 3 and 4 were marginally interesting forsteady gas-turbine operation and, in particular, for approacheswith large exhaust gas recycle. The temperature comparisonsin Fig. 3a were especially encouraging at x = 27 and 55 mm:the thermocouple measurements were bounded by TW and Tgas(see also Table 4), in accordance to the anticipated behaviordiscussed in Section 2.1, suggesting that the numerical modelrealistically reproduced the temperature evolution along the re-actor. On the other hand, the particularly good agreement be-tween measured and predicted temperatures in the lower TINcase (Fig. 3b) at x = 55 mm reflected to some extent the coun-teracting effects of lower predicted CH4 conversion and higherselectivity to complete oxidation products. The analysis in thefollowing sections will focus on the higher inlet temperatureCase 1.
4.3. Steady reactor temperature
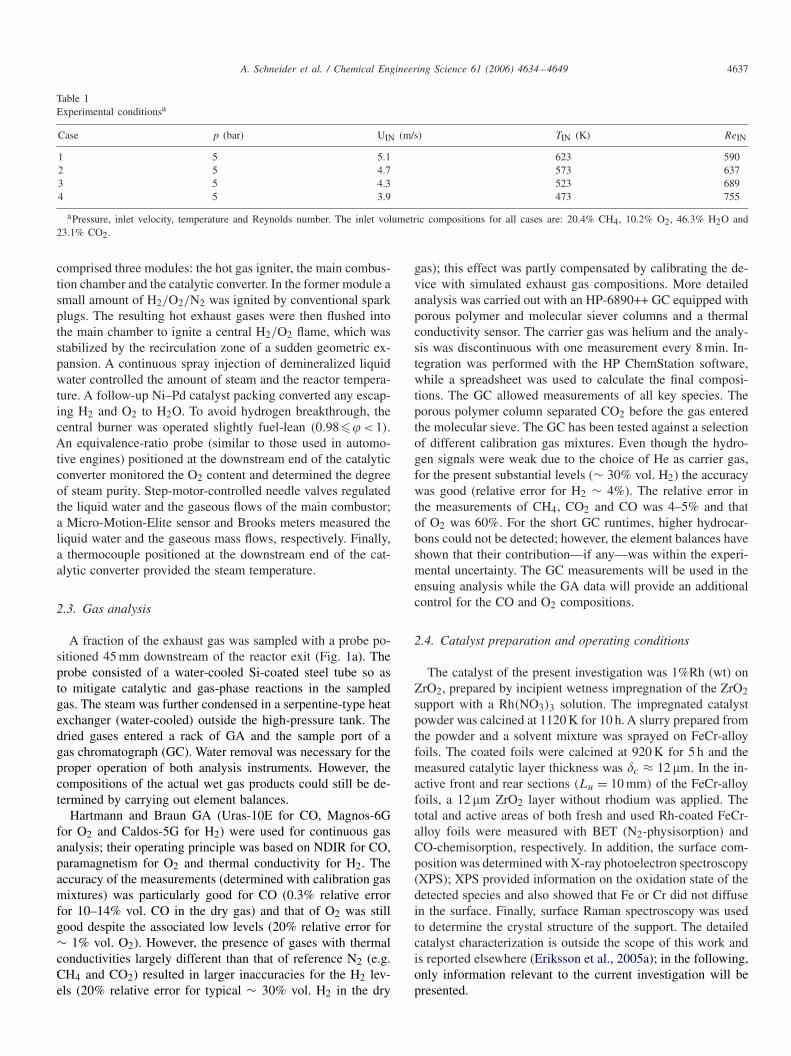
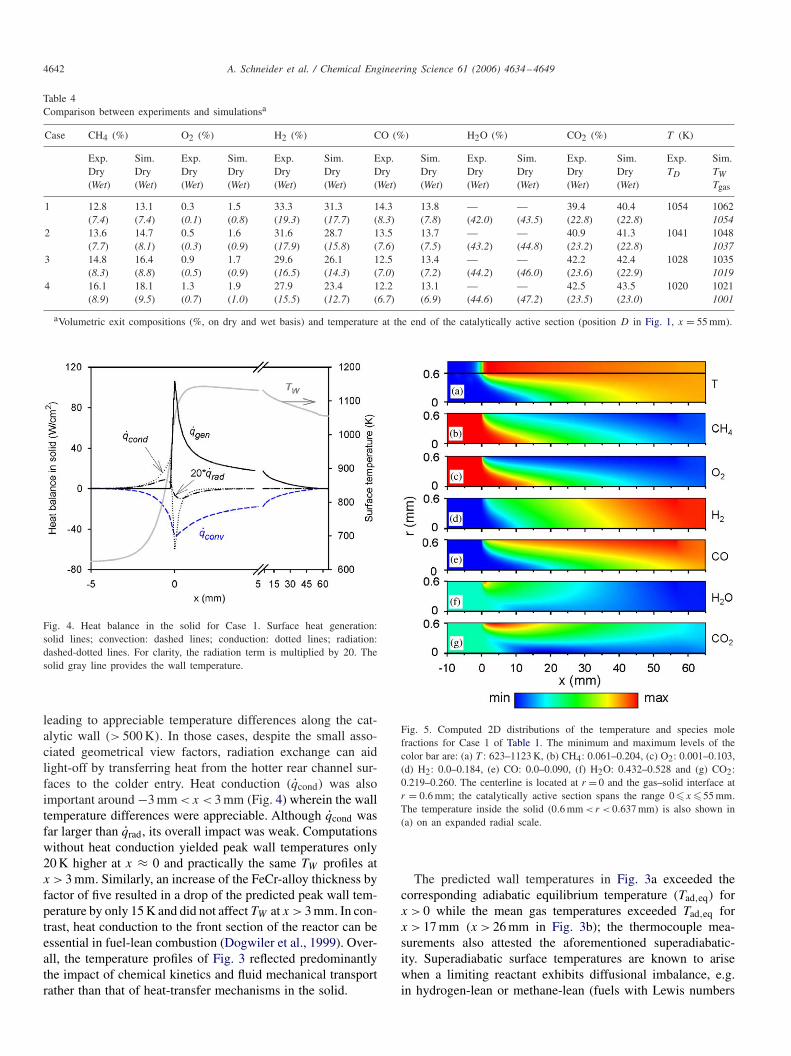
Since the magnitude and spatial distribution of the reactortemperature is of prime importance in practical systems, thesensitivity of those quantities to the various modes of solid-phase heat transfer is established next. The energy balancefor each differential solid cylindrical element (length �x andthickness �c + �/2) is provided in Fig. 4, while the 2D tem-perature distribution in both solid and gas is illustrated in Fig.5a (Case 1). The latter indicated very small radial gradients inthe solid (temperature differences of less than 0.4 K over the37 �m thickness) at steady operation. In Fig. 4, qcond accountedfor both the radial and the (integrated across the twenty radialsolid-phase volumes) axial heat conduction, qgen representedthe chemical heat release at the surface, and qconv denoted theconvective heat loss to the gas. The heat generation peakednearly at the start of the coated section (the light-off distancewas practically zero) due to complete oxidation reactions aswill be further discussed in Section 4.4. Radiation was neg-ligible, with only a minor net radiative heat transfer from theinitial hot ∼ 3 mm catalytic section to the adjacent ∼ 3 mminactive section. Repeating the computations with � = 0 re-produced the same surface temperatures. The insignificance ofqrad was a direct consequence of the negligible light-off dis-tance that resulted in wall temperatures differing by less than86 K over the entire length x > 0 (see Fig. 3). Contrary to fuel-rich combustion, in fuel-lean applications the light-off distancecan be considerably longer due to blocking of the catalyst bysurface oxygen (Dogwiler et al., 1999; Carroni et al., 2003)
4642 A. Schneider et al. / Chemical Engineering Science 61 (2006) 4634–4649
Table 4Comparison between experiments and simulationsa
Case CH4 (%) O2 (%) H2 (%) CO (%) H2O (%) CO2 (%) T (K)
Exp. Sim. Exp. Sim. Exp. Sim. Exp. Sim. Exp. Sim. Exp. Sim. Exp. Sim.Dry Dry Dry Dry Dry Dry Dry Dry Dry Dry Dry Dry TD TW
(Wet) (Wet) (Wet) (Wet) (Wet) (Wet) (Wet) (Wet) (Wet) (Wet) (Wet) (Wet) Tgas
1 12.8 13.1 0.3 1.5 33.3 31.3 14.3 13.8 — — 39.4 40.4 1054 1062(7.4) (7.4) (0.1) (0.8) (19.3) (17.7) (8.3) (7.8) (42.0) (43.5) (22.8) (22.8) 1054
2 13.6 14.7 0.5 1.6 31.6 28.7 13.5 13.7 — — 40.9 41.3 1041 1048(7.7) (8.1) (0.3) (0.9) (17.9) (15.8) (7.6) (7.5) (43.2) (44.8) (23.2) (22.8) 1037
3 14.8 16.4 0.9 1.7 29.6 26.1 12.5 13.4 — — 42.2 42.4 1028 1035(8.3) (8.8) (0.5) (0.9) (16.5) (14.3) (7.0) (7.2) (44.2) (46.0) (23.6) (22.9) 1019
4 16.1 18.1 1.3 1.9 27.9 23.4 12.2 13.1 — — 42.5 43.5 1020 1021(8.9) (9.5) (0.7) (1.0) (15.5) (12.7) (6.7) (6.9) (44.6) (47.2) (23.5) (23.0) 1001
aVolumetric exit compositions (%, on dry and wet basis) and temperature at the end of the catalytically active section (position D in Fig. 1, x = 55 mm).
Fig. 4. Heat balance in the solid for Case 1. Surface heat generation:solid lines; convection: dashed lines; conduction: dotted lines; radiation:dashed-dotted lines. For clarity, the radiation term is multiplied by 20. Thesolid gray line provides the wall temperature.
leading to appreciable temperature differences along the cat-alytic wall (> 500 K). In those cases, despite the small asso-ciated geometrical view factors, radiation exchange can aidlight-off by transferring heat from the hotter rear channel sur-faces to the colder entry. Heat conduction (qcond) was alsoimportant around −3 mm < x < 3 mm (Fig. 4) wherein the walltemperature differences were appreciable. Although qcond wasfar larger than qrad, its overall impact was weak. Computationswithout heat conduction yielded peak wall temperatures only20 K higher at x ≈ 0 and practically the same TW profiles atx > 3 mm. Similarly, an increase of the FeCr-alloy thickness byfactor of five resulted in a drop of the predicted peak wall tem-perature by only 15 K and did not affect TW at x > 3 mm. In con-trast, heat conduction to the front section of the reactor can beessential in fuel-lean combustion (Dogwiler et al., 1999). Over-all, the temperature profiles of Fig. 3 reflected predominantlythe impact of chemical kinetics and fluid mechanical transportrather than that of heat-transfer mechanisms in the solid.
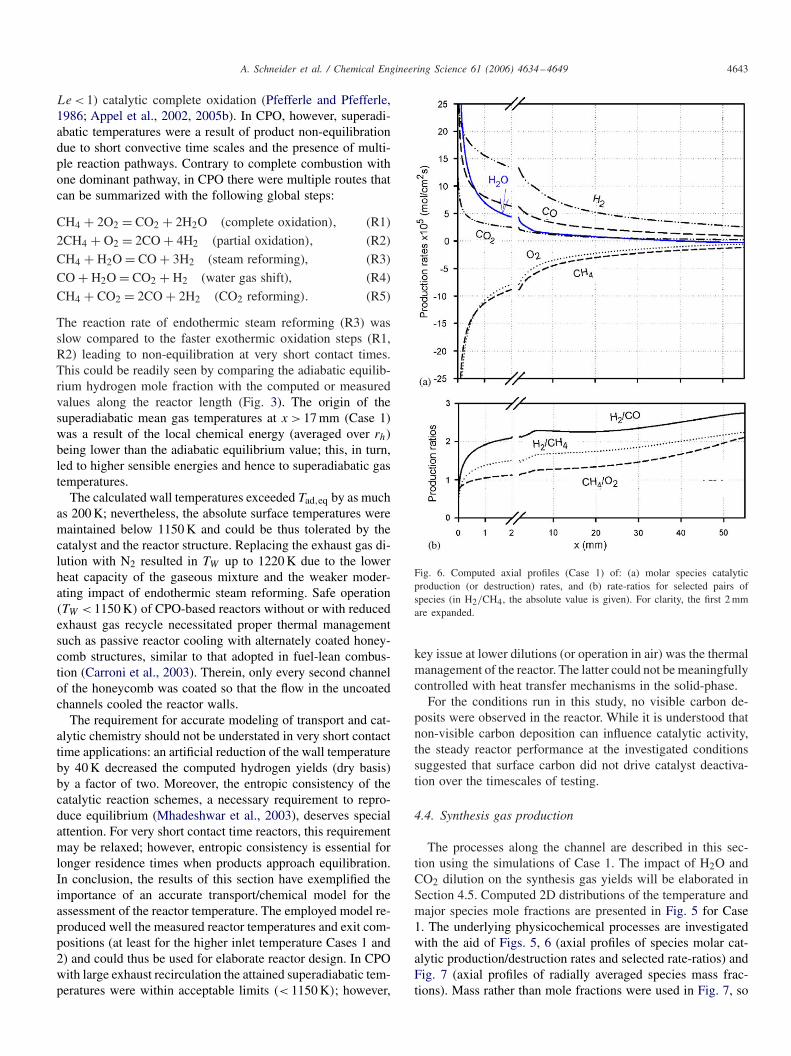
Fig. 5. Computed 2D distributions of the temperature and species molefractions for Case 1 of Table 1. The minimum and maximum levels of thecolor bar are: (a) T : 623–1123 K, (b) CH4: 0.061–0.204, (c) O2: 0.001–0.103,(d) H2: 0.0–0.184, (e) CO: 0.0–0.090, (f) H2O: 0.432–0.528 and (g) CO2:0.219–0.260. The centerline is located at r = 0 and the gas–solid interface atr = 0.6 mm; the catalytically active section spans the range 0�x �55 mm.The temperature inside the solid (0.6 mm < r < 0.637 mm) is also shown in(a) on an expanded radial scale.
The predicted wall temperatures in Fig. 3a exceeded thecorresponding adiabatic equilibrium temperature (Tad,eq) forx > 0 while the mean gas temperatures exceeded Tad,eq forx > 17 mm (x > 26 mm in Fig. 3b); the thermocouple mea-surements also attested the aforementioned superadiabatic-ity. Superadiabatic surface temperatures are known to arisewhen a limiting reactant exhibits diffusional imbalance, e.g.in hydrogen-lean or methane-lean (fuels with Lewis numbers
A. Schneider et al. / Chemical Engineering Science 61 (2006) 4634–4649 4643
Le < 1) catalytic complete oxidation (Pfefferle and Pfefferle,1986; Appel et al., 2002, 2005b). In CPO, however, superadi-abatic temperatures were a result of product non-equilibrationdue to short convective time scales and the presence of multi-ple reaction pathways. Contrary to complete combustion withone dominant pathway, in CPO there were multiple routes thatcan be summarized with the following global steps:
CH4 + 2O2 = CO2 + 2H2O (complete oxidation), (R1)
2CH4 + O2 = 2CO + 4H2 (partial oxidation), (R2)
CH4 + H2O = CO + 3H2 (steam reforming), (R3)
CO + H2O = CO2 + H2 (water gas shift), (R4)
CH4 + CO2 = 2CO + 2H2 (CO2 reforming). (R5)
The reaction rate of endothermic steam reforming (R3) wasslow compared to the faster exothermic oxidation steps (R1,R2) leading to non-equilibration at very short contact times.This could be readily seen by comparing the adiabatic equilib-rium hydrogen mole fraction with the computed or measuredvalues along the reactor length (Fig. 3). The origin of thesuperadiabatic mean gas temperatures at x > 17 mm (Case 1)was a result of the local chemical energy (averaged over rh)being lower than the adiabatic equilibrium value; this, in turn,led to higher sensible energies and hence to superadiabatic gastemperatures.
The calculated wall temperatures exceeded Tad,eq by as muchas 200 K; nevertheless, the absolute surface temperatures weremaintained below 1150 K and could be thus tolerated by thecatalyst and the reactor structure. Replacing the exhaust gas di-lution with N2 resulted in TW up to 1220 K due to the lowerheat capacity of the gaseous mixture and the weaker moder-ating impact of endothermic steam reforming. Safe operation(TW < 1150 K) of CPO-based reactors without or with reducedexhaust gas recycle necessitated proper thermal managementsuch as passive reactor cooling with alternately coated honey-comb structures, similar to that adopted in fuel-lean combus-tion (Carroni et al., 2003). Therein, only every second channelof the honeycomb was coated so that the flow in the uncoatedchannels cooled the reactor walls.
The requirement for accurate modeling of transport and cat-alytic chemistry should not be understated in very short contacttime applications: an artificial reduction of the wall temperatureby 40 K decreased the computed hydrogen yields (dry basis)by a factor of two. Moreover, the entropic consistency of thecatalytic reaction schemes, a necessary requirement to repro-duce equilibrium (Mhadeshwar et al., 2003), deserves specialattention. For very short contact time reactors, this requirementmay be relaxed; however, entropic consistency is essential forlonger residence times when products approach equilibration.In conclusion, the results of this section have exemplified theimportance of an accurate transport/chemical model for theassessment of the reactor temperature. The employed model re-produced well the measured reactor temperatures and exit com-positions (at least for the higher inlet temperature Cases 1 and2) and could thus be used for elaborate reactor design. In CPOwith large exhaust recirculation the attained superadiabatic tem-peratures were within acceptable limits (< 1150 K); however,
Fig. 6. Computed axial profiles (Case 1) of: (a) molar species catalyticproduction (or destruction) rates, and (b) rate-ratios for selected pairs ofspecies (in H2/CH4, the absolute value is given). For clarity, the first 2 mmare expanded.
key issue at lower dilutions (or operation in air) was the thermalmanagement of the reactor. The latter could not be meaningfullycontrolled with heat transfer mechanisms in the solid-phase.
For the conditions run in this study, no visible carbon de-posits were observed in the reactor. While it is understood thatnon-visible carbon deposition can influence catalytic activity,the steady reactor performance at the investigated conditionssuggested that surface carbon did not drive catalyst deactiva-tion over the timescales of testing.
4.4. Synthesis gas production
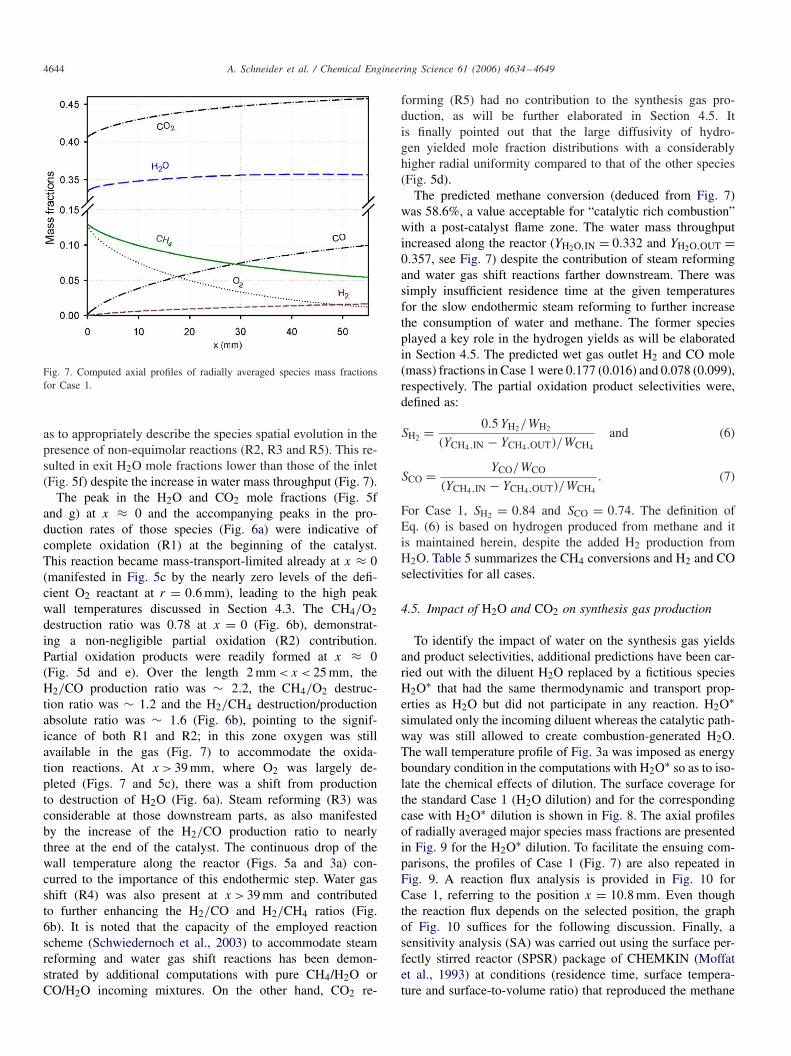
The processes along the channel are described in this sec-tion using the simulations of Case 1. The impact of H2O andCO2 dilution on the synthesis gas yields will be elaborated inSection 4.5. Computed 2D distributions of the temperature andmajor species mole fractions are presented in Fig. 5 for Case1. The underlying physicochemical processes are investigatedwith the aid of Figs. 5, 6 (axial profiles of species molar cat-alytic production/destruction rates and selected rate-ratios) andFig. 7 (axial profiles of radially averaged species mass frac-tions). Mass rather than mole fractions were used in Fig. 7, so
4644 A. Schneider et al. / Chemical Engineering Science 61 (2006) 4634–4649
Fig. 7. Computed axial profiles of radially averaged species mass fractionsfor Case 1.
as to appropriately describe the species spatial evolution in thepresence of non-equimolar reactions (R2, R3 and R5). This re-sulted in exit H2O mole fractions lower than those of the inlet(Fig. 5f) despite the increase in water mass throughput (Fig. 7).
The peak in the H2O and CO2 mole fractions (Fig. 5fand g) at x ≈ 0 and the accompanying peaks in the pro-duction rates of those species (Fig. 6a) were indicative ofcomplete oxidation (R1) at the beginning of the catalyst.This reaction became mass-transport-limited already at x ≈ 0(manifested in Fig. 5c by the nearly zero levels of the defi-cient O2 reactant at r = 0.6 mm), leading to the high peakwall temperatures discussed in Section 4.3. The CH4/O2destruction ratio was 0.78 at x = 0 (Fig. 6b), demonstrat-ing a non-negligible partial oxidation (R2) contribution.Partial oxidation products were readily formed at x ≈ 0(Fig. 5d and e). Over the length 2 mm < x < 25 mm, theH2/CO production ratio was ∼ 2.2, the CH4/O2 destruc-tion ratio was ∼ 1.2 and the H2/CH4 destruction/productionabsolute ratio was ∼ 1.6 (Fig. 6b), pointing to the signif-icance of both R1 and R2; in this zone oxygen was stillavailable in the gas (Fig. 7) to accommodate the oxida-tion reactions. At x > 39 mm, where O2 was largely de-pleted (Figs. 7 and 5c), there was a shift from productionto destruction of H2O (Fig. 6a). Steam reforming (R3) wasconsiderable at those downstream parts, as also manifestedby the increase of the H2/CO production ratio to nearlythree at the end of the catalyst. The continuous drop of thewall temperature along the reactor (Figs. 5a and 3a) con-curred to the importance of this endothermic step. Water gasshift (R4) was also present at x > 39 mm and contributedto further enhancing the H2/CO and H2/CH4 ratios (Fig.6b). It is noted that the capacity of the employed reactionscheme (Schwiedernoch et al., 2003) to accommodate steamreforming and water gas shift reactions has been demon-strated by additional computations with pure CH4/H2O orCO/H2O incoming mixtures. On the other hand, CO2 re-
forming (R5) had no contribution to the synthesis gas pro-duction, as will be further elaborated in Section 4.5. Itis finally pointed out that the large diffusivity of hydro-gen yielded mole fraction distributions with a considerablyhigher radial uniformity compared to that of the other species(Fig. 5d).
The predicted methane conversion (deduced from Fig. 7)was 58.6%, a value acceptable for “catalytic rich combustion”with a post-catalyst flame zone. The water mass throughputincreased along the reactor (YH2O,IN = 0.332 and YH2O,OUT =0.357, see Fig. 7) despite the contribution of steam reformingand water gas shift reactions farther downstream. There wassimply insufficient residence time at the given temperaturesfor the slow endothermic steam reforming to further increasethe consumption of water and methane. The former speciesplayed a key role in the hydrogen yields as will be elaboratedin Section 4.5. The predicted wet gas outlet H2 and CO mole(mass) fractions in Case 1 were 0.177 (0.016) and 0.078 (0.099),respectively. The partial oxidation product selectivities were,defined as:
SH2 = 0.5 YH2/WH2
(YCH4,IN − YCH4,OUT)/WCH4
and (6)
SCO = YCO/WCO
(YCH4,IN − YCH4,OUT)/WCH4
. (7)
For Case 1, SH2 = 0.84 and SCO = 0.74. The definition ofEq. (6) is based on hydrogen produced from methane and itis maintained herein, despite the added H2 production fromH2O. Table 5 summarizes the CH4 conversions and H2 and COselectivities for all cases.
4.5. Impact of H2O and CO2 on synthesis gas production
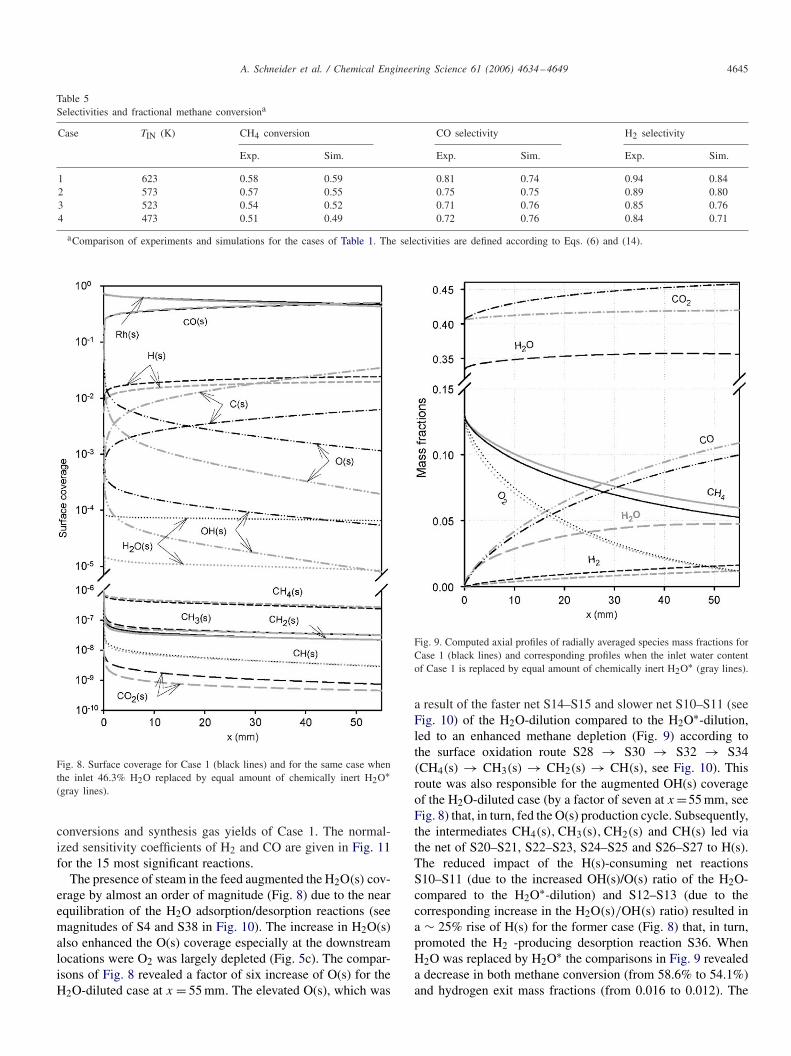
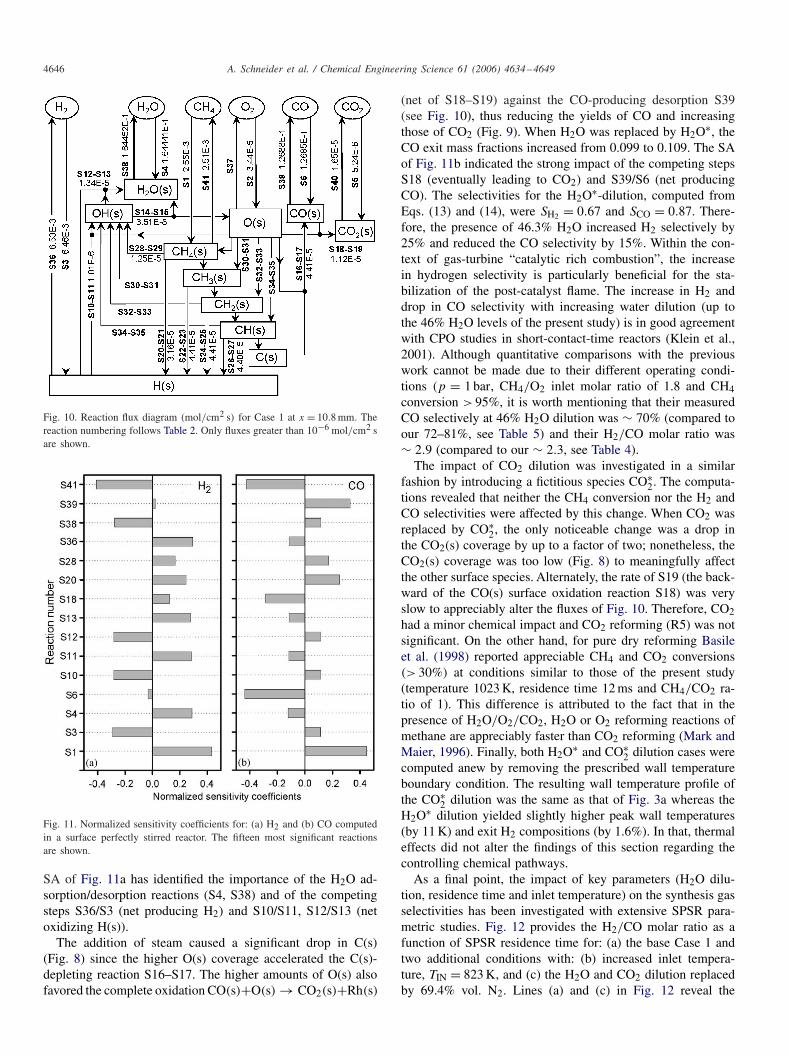
To identify the impact of water on the synthesis gas yieldsand product selectivities, additional predictions have been car-ried out with the diluent H2O replaced by a fictitious speciesH2O∗ that had the same thermodynamic and transport prop-erties as H2O but did not participate in any reaction. H2O∗simulated only the incoming diluent whereas the catalytic path-way was still allowed to create combustion-generated H2O.The wall temperature profile of Fig. 3a was imposed as energyboundary condition in the computations with H2O∗ so as to iso-late the chemical effects of dilution. The surface coverage forthe standard Case 1 (H2O dilution) and for the correspondingcase with H2O∗ dilution is shown in Fig. 8. The axial profilesof radially averaged major species mass fractions are presentedin Fig. 9 for the H2O∗ dilution. To facilitate the ensuing com-parisons, the profiles of Case 1 (Fig. 7) are also repeated inFig. 9. A reaction flux analysis is provided in Fig. 10 forCase 1, referring to the position x = 10.8 mm. Even thoughthe reaction flux depends on the selected position, the graphof Fig. 10 suffices for the following discussion. Finally, asensitivity analysis (SA) was carried out using the surface per-fectly stirred reactor (SPSR) package of CHEMKIN (Moffatet al., 1993) at conditions (residence time, surface tempera-ture and surface-to-volume ratio) that reproduced the methane
A. Schneider et al. / Chemical Engineering Science 61 (2006) 4634–4649 4645
Table 5Selectivities and fractional methane conversiona
Case TIN (K) CH4 conversion CO selectivity H2 selectivity
Exp. Sim. Exp. Sim. Exp. Sim.
1 623 0.58 0.59 0.81 0.74 0.94 0.842 573 0.57 0.55 0.75 0.75 0.89 0.803 523 0.54 0.52 0.71 0.76 0.85 0.764 473 0.51 0.49 0.72 0.76 0.84 0.71
aComparison of experiments and simulations for the cases of Table 1. The selectivities are defined according to Eqs. (6) and (14).
Fig. 8. Surface coverage for Case 1 (black lines) and for the same case whenthe inlet 46.3% H2O replaced by equal amount of chemically inert H2O∗(gray lines).
conversions and synthesis gas yields of Case 1. The normal-ized sensitivity coefficients of H2 and CO are given in Fig. 11for the 15 most significant reactions.
The presence of steam in the feed augmented the H2O(s) cov-erage by almost an order of magnitude (Fig. 8) due to the nearequilibration of the H2O adsorption/desorption reactions (seemagnitudes of S4 and S38 in Fig. 10). The increase in H2O(s)also enhanced the O(s) coverage especially at the downstreamlocations were O2 was largely depleted (Fig. 5c). The compar-isons of Fig. 8 revealed a factor of six increase of O(s) for theH2O-diluted case at x = 55 mm. The elevated O(s), which was
Fig. 9. Computed axial profiles of radially averaged species mass fractions forCase 1 (black lines) and corresponding profiles when the inlet water contentof Case 1 is replaced by equal amount of chemically inert H2O∗ (gray lines).
a result of the faster net S14–S15 and slower net S10–S11 (seeFig. 10) of the H2O-dilution compared to the H2O∗-dilution,led to an enhanced methane depletion (Fig. 9) according tothe surface oxidation route S28 → S30 → S32 → S34(CH4(s) → CH3(s) → CH2(s) → CH(s), see Fig. 10). Thisroute was also responsible for the augmented OH(s) coverageof the H2O-diluted case (by a factor of seven at x =55 mm, seeFig. 8) that, in turn, fed the O(s) production cycle. Subsequently,the intermediates CH4(s), CH3(s), CH2(s) and CH(s) led viathe net of S20–S21, S22–S23, S24–S25 and S26–S27 to H(s).The reduced impact of the H(s)-consuming net reactionsS10–S11 (due to the increased OH(s)/O(s) ratio of the H2O-compared to the H2O∗-dilution) and S12–S13 (due to thecorresponding increase in the H2O(s)/OH(s) ratio) resulted ina ∼ 25% rise of H(s) for the former case (Fig. 8) that, in turn,promoted the H2 -producing desorption reaction S36. WhenH2O was replaced by H2O∗ the comparisons in Fig. 9 revealeda decrease in both methane conversion (from 58.6% to 54.1%)and hydrogen exit mass fractions (from 0.016 to 0.012). The
4646 A. Schneider et al. / Chemical Engineering Science 61 (2006) 4634–4649
Fig. 10. Reaction flux diagram (mol/cm2 s) for Case 1 at x = 10.8 mm. Thereaction numbering follows Table 2. Only fluxes greater than 10−6 mol/cm2 sare shown.
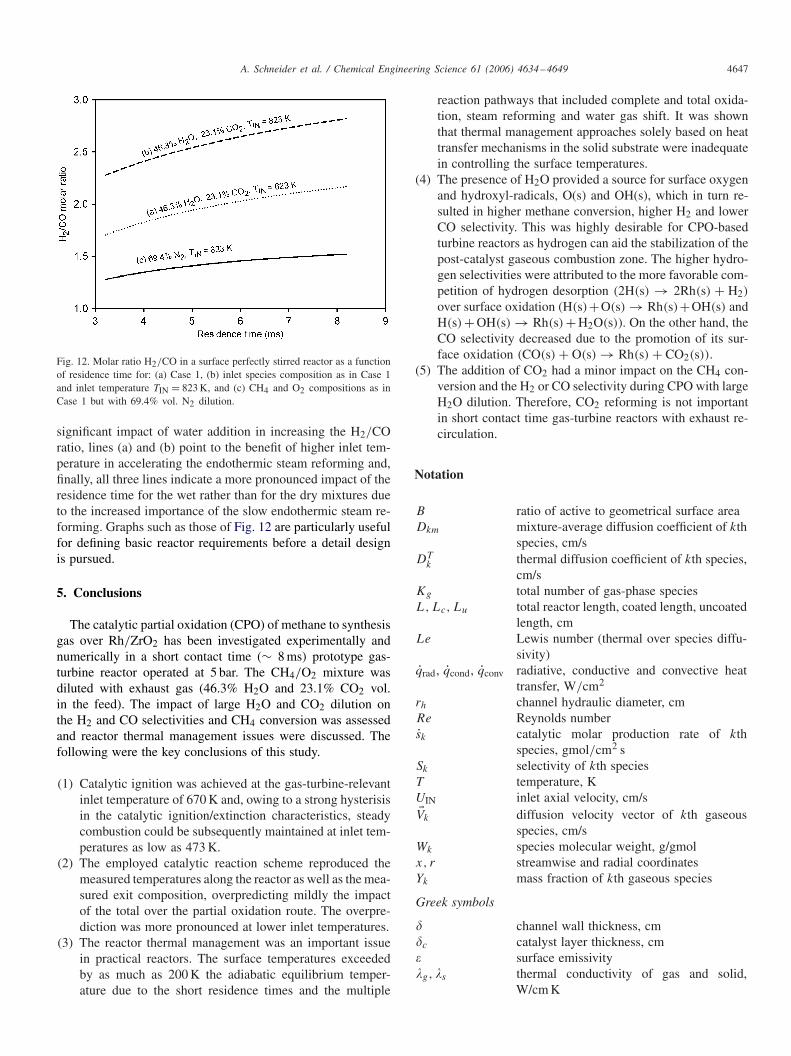
Fig. 11. Normalized sensitivity coefficients for: (a) H2 and (b) CO computedin a surface perfectly stirred reactor. The fifteen most significant reactionsare shown.
SA of Fig. 11a has identified the importance of the H2O ad-sorption/desorption reactions (S4, S38) and of the competingsteps S36/S3 (net producing H2) and S10/S11, S12/S13 (netoxidizing H(s)).
The addition of steam caused a significant drop in C(s)(Fig. 8) since the higher O(s) coverage accelerated the C(s)-depleting reaction S16–S17. The higher amounts of O(s) alsofavored the complete oxidation CO(s)+O(s) → CO2(s)+Rh(s)
(net of S18–S19) against the CO-producing desorption S39(see Fig. 10), thus reducing the yields of CO and increasingthose of CO2 (Fig. 9). When H2O was replaced by H2O∗, theCO exit mass fractions increased from 0.099 to 0.109. The SAof Fig. 11b indicated the strong impact of the competing stepsS18 (eventually leading to CO2) and S39/S6 (net producingCO). The selectivities for the H2O∗-dilution, computed fromEqs. (13) and (14), were SH2 = 0.67 and SCO = 0.87. There-fore, the presence of 46.3% H2O increased H2 selectively by25% and reduced the CO selectivity by 15%. Within the con-text of gas-turbine “catalytic rich combustion”, the increasein hydrogen selectivity is particularly beneficial for the sta-bilization of the post-catalyst flame. The increase in H2 anddrop in CO selectivity with increasing water dilution (up tothe 46% H2O levels of the present study) is in good agreementwith CPO studies in short-contact-time reactors (Klein et al.,2001). Although quantitative comparisons with the previouswork cannot be made due to their different operating condi-tions (p = 1 bar, CH4/O2 inlet molar ratio of 1.8 and CH4conversion > 95%, it is worth mentioning that their measuredCO selectively at 46% H2O dilution was ∼ 70% (compared toour 72–81%, see Table 5) and their H2/CO molar ratio was∼ 2.9 (compared to our ∼ 2.3, see Table 4).
The impact of CO2 dilution was investigated in a similarfashion by introducing a fictitious species CO∗
2. The computa-tions revealed that neither the CH4 conversion nor the H2 andCO selectivities were affected by this change. When CO2 wasreplaced by CO∗
2, the only noticeable change was a drop inthe CO2(s) coverage by up to a factor of two; nonetheless, theCO2(s) coverage was too low (Fig. 8) to meaningfully affectthe other surface species. Alternately, the rate of S19 (the back-ward of the CO(s) surface oxidation reaction S18) was veryslow to appreciably alter the fluxes of Fig. 10. Therefore, CO2had a minor chemical impact and CO2 reforming (R5) was notsignificant. On the other hand, for pure dry reforming Basileet al. (1998) reported appreciable CH4 and CO2 conversions(> 30%) at conditions similar to those of the present study(temperature 1023 K, residence time 12 ms and CH4/CO2 ra-tio of 1). This difference is attributed to the fact that in thepresence of H2O/O2/CO2, H2O or O2 reforming reactions ofmethane are appreciably faster than CO2 reforming (Mark andMaier, 1996). Finally, both H2O∗ and CO∗
2 dilution cases werecomputed anew by removing the prescribed wall temperatureboundary condition. The resulting wall temperature profile ofthe CO∗
2 dilution was the same as that of Fig. 3a whereas theH2O∗ dilution yielded slightly higher peak wall temperatures(by 11 K) and exit H2 compositions (by 1.6%). In that, thermaleffects did not alter the findings of this section regarding thecontrolling chemical pathways.
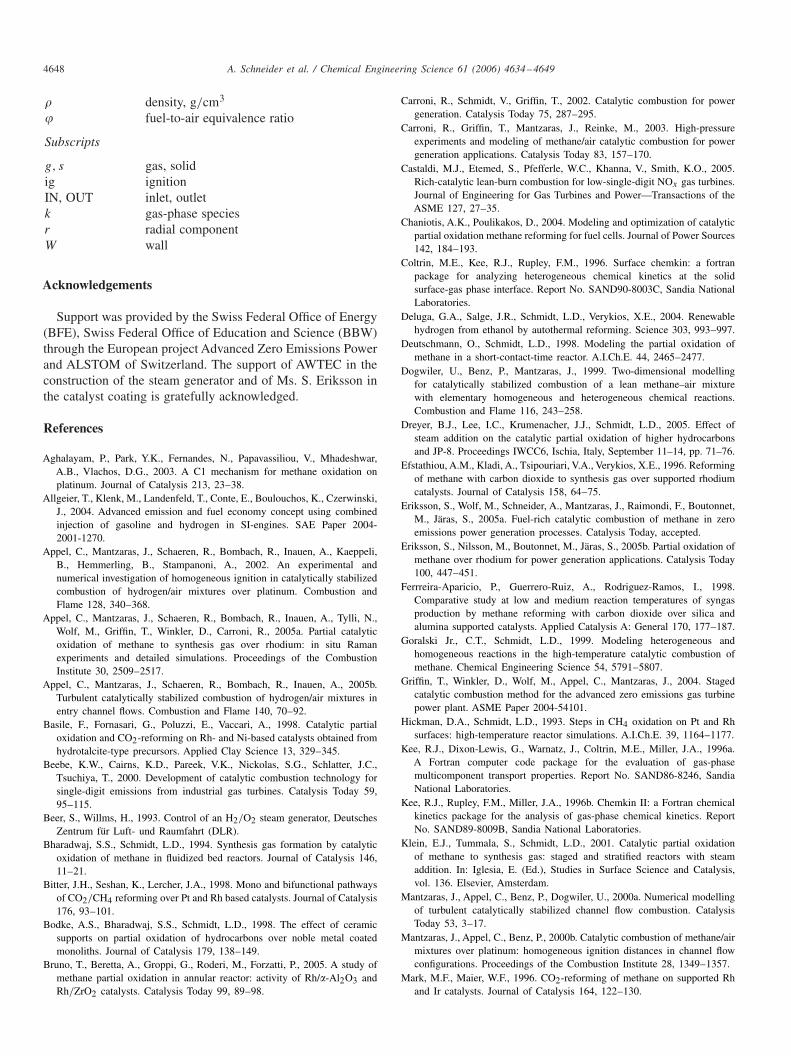
As a final point, the impact of key parameters (H2O dilu-tion, residence time and inlet temperature) on the synthesis gasselectivities has been investigated with extensive SPSR para-metric studies. Fig. 12 provides the H2/CO molar ratio as afunction of SPSR residence time for: (a) the base Case 1 andtwo additional conditions with: (b) increased inlet tempera-ture, TIN = 823 K, and (c) the H2O and CO2 dilution replacedby 69.4% vol. N2. Lines (a) and (c) in Fig. 12 reveal the
A. Schneider et al. / Chemical Engineering Science 61 (2006) 4634–4649 4647
Fig. 12. Molar ratio H2/CO in a surface perfectly stirred reactor as a functionof residence time for: (a) Case 1, (b) inlet species composition as in Case 1and inlet temperature TIN = 823 K, and (c) CH4 and O2 compositions as inCase 1 but with 69.4% vol. N2 dilution.
significant impact of water addition in increasing the H2/COratio, lines (a) and (b) point to the benefit of higher inlet tem-perature in accelerating the endothermic steam reforming and,finally, all three lines indicate a more pronounced impact of theresidence time for the wet rather than for the dry mixtures dueto the increased importance of the slow endothermic steam re-forming. Graphs such as those of Fig. 12 are particularly usefulfor defining basic reactor requirements before a detail designis pursued.
5. Conclusions
The catalytic partial oxidation (CPO) of methane to synthesisgas over Rh/ZrO2 has been investigated experimentally andnumerically in a short contact time (∼ 8 ms) prototype gas-turbine reactor operated at 5 bar. The CH4/O2 mixture wasdiluted with exhaust gas (46.3% H2O and 23.1% CO2 vol.in the feed). The impact of large H2O and CO2 dilution onthe H2 and CO selectivities and CH4 conversion was assessedand reactor thermal management issues were discussed. Thefollowing were the key conclusions of this study.
(1) Catalytic ignition was achieved at the gas-turbine-relevantinlet temperature of 670 K and, owing to a strong hysterisisin the catalytic ignition/extinction characteristics, steadycombustion could be subsequently maintained at inlet tem-peratures as low as 473 K.
(2) The employed catalytic reaction scheme reproduced themeasured temperatures along the reactor as well as the mea-sured exit composition, overpredicting mildly the impactof the total over the partial oxidation route. The overpre-diction was more pronounced at lower inlet temperatures.
(3) The reactor thermal management was an important issuein practical reactors. The surface temperatures exceededby as much as 200 K the adiabatic equilibrium temper-ature due to the short residence times and the multiple
reaction pathways that included complete and total oxida-tion, steam reforming and water gas shift. It was shownthat thermal management approaches solely based on heattransfer mechanisms in the solid substrate were inadequatein controlling the surface temperatures.
(4) The presence of H2O provided a source for surface oxygenand hydroxyl-radicals, O(s) and OH(s), which in turn re-sulted in higher methane conversion, higher H2 and lowerCO selectivity. This was highly desirable for CPO-basedturbine reactors as hydrogen can aid the stabilization of thepost-catalyst gaseous combustion zone. The higher hydro-gen selectivities were attributed to the more favorable com-petition of hydrogen desorption (2H(s) → 2Rh(s) + H2)
over surface oxidation (H(s)+O(s) → Rh(s)+OH(s) andH(s)+ OH(s) → Rh(s)+ H2O(s)). On the other hand, theCO selectivity decreased due to the promotion of its sur-face oxidation (CO(s) + O(s) → Rh(s) + CO2(s)).
(5) The addition of CO2 had a minor impact on the CH4 con-version and the H2 or CO selectivity during CPO with largeH2O dilution. Therefore, CO2 reforming is not importantin short contact time gas-turbine reactors with exhaust re-circulation.
Notation
B ratio of active to geometrical surface areaDkm mixture-average diffusion coefficient of kth
species, cm/sDT
k thermal diffusion coefficient of kth species,cm/s
Kg total number of gas-phase speciesL, Lc, Lu total reactor length, coated length, uncoated
length, cmLe Lewis number (thermal over species diffu-
sivity)qrad, qcond, qconv radiative, conductive and convective heat
transfer, W/cm2
rh channel hydraulic diameter, cmRe Reynolds numbersk catalytic molar production rate of kth
species, gmol/cm2 sSk selectivity of kth speciesT temperature, KUIN inlet axial velocity, cm/s�Vk diffusion velocity vector of kth gaseous
species, cm/sWk species molecular weight, g/gmolx, r streamwise and radial coordinatesYk mass fraction of kth gaseous species
Greek symbols
� channel wall thickness, cm�c catalyst layer thickness, cm� surface emissivity�g, �s thermal conductivity of gas and solid,
W/cm K
4648 A. Schneider et al. / Chemical Engineering Science 61 (2006) 4634–4649
� density, g/cm3
� fuel-to-air equivalence ratio
Subscripts
g, s gas, solidig ignitionIN, OUT inlet, outletk gas-phase speciesr radial componentW wall
Acknowledgements
Support was provided by the Swiss Federal Office of Energy(BFE), Swiss Federal Office of Education and Science (BBW)through the European project Advanced Zero Emissions Powerand ALSTOM of Switzerland. The support of AWTEC in theconstruction of the steam generator and of Ms. S. Eriksson inthe catalyst coating is gratefully acknowledged.
References
Aghalayam, P., Park, Y.K., Fernandes, N., Papavassiliou, V., Mhadeshwar,A.B., Vlachos, D.G., 2003. A C1 mechanism for methane oxidation onplatinum. Journal of Catalysis 213, 23–38.
Allgeier, T., Klenk, M., Landenfeld, T., Conte, E., Boulouchos, K., Czerwinski,J., 2004. Advanced emission and fuel economy concept using combinedinjection of gasoline and hydrogen in SI-engines. SAE Paper 2004-2001-1270.
Appel, C., Mantzaras, J., Schaeren, R., Bombach, R., Inauen, A., Kaeppeli,B., Hemmerling, B., Stampanoni, A., 2002. An experimental andnumerical investigation of homogeneous ignition in catalytically stabilizedcombustion of hydrogen/air mixtures over platinum. Combustion andFlame 128, 340–368.
Appel, C., Mantzaras, J., Schaeren, R., Bombach, R., Inauen, A., Tylli, N.,Wolf, M., Griffin, T., Winkler, D., Carroni, R., 2005a. Partial catalyticoxidation of methane to synthesis gas over rhodium: in situ Ramanexperiments and detailed simulations. Proceedings of the CombustionInstitute 30, 2509–2517.
Appel, C., Mantzaras, J., Schaeren, R., Bombach, R., Inauen, A., 2005b.Turbulent catalytically stabilized combustion of hydrogen/air mixtures inentry channel flows. Combustion and Flame 140, 70–92.
Basile, F., Fornasari, G., Poluzzi, E., Vaccari, A., 1998. Catalytic partialoxidation and CO2-reforming on Rh- and Ni-based catalysts obtained fromhydrotalcite-type precursors. Applied Clay Science 13, 329–345.
Beebe, K.W., Cairns, K.D., Pareek, V.K., Nickolas, S.G., Schlatter, J.C.,Tsuchiya, T., 2000. Development of catalytic combustion technology forsingle-digit emissions from industrial gas turbines. Catalysis Today 59,95–115.
Beer, S., Willms, H., 1993. Control of an H2/O2 steam generator, DeutschesZentrum für Luft- und Raumfahrt (DLR).
Bharadwaj, S.S., Schmidt, L.D., 1994. Synthesis gas formation by catalyticoxidation of methane in fluidized bed reactors. Journal of Catalysis 146,11–21.
Bitter, J.H., Seshan, K., Lercher, J.A., 1998. Mono and bifunctional pathwaysof CO2/CH4 reforming over Pt and Rh based catalysts. Journal of Catalysis176, 93–101.
Bodke, A.S., Bharadwaj, S.S., Schmidt, L.D., 1998. The effect of ceramicsupports on partial oxidation of hydrocarbons over noble metal coatedmonoliths. Journal of Catalysis 179, 138–149.
Bruno, T., Beretta, A., Groppi, G., Roderi, M., Forzatti, P., 2005. A study ofmethane partial oxidation in annular reactor: activity of Rh/-Al2O3 andRh/ZrO2 catalysts. Catalysis Today 99, 89–98.
Carroni, R., Schmidt, V., Griffin, T., 2002. Catalytic combustion for powergeneration. Catalysis Today 75, 287–295.
Carroni, R., Griffin, T., Mantzaras, J., Reinke, M., 2003. High-pressureexperiments and modeling of methane/air catalytic combustion for powergeneration applications. Catalysis Today 83, 157–170.
Castaldi, M.J., Etemed, S., Pfefferle, W.C., Khanna, V., Smith, K.O., 2005.Rich-catalytic lean-burn combustion for low-single-digit NOx gas turbines.Journal of Engineering for Gas Turbines and Power—Transactions of theASME 127, 27–35.
Chaniotis, A.K., Poulikakos, D., 2004. Modeling and optimization of catalyticpartial oxidation methane reforming for fuel cells. Journal of Power Sources142, 184–193.
Coltrin, M.E., Kee, R.J., Rupley, F.M., 1996. Surface chemkin: a fortranpackage for analyzing heterogeneous chemical kinetics at the solidsurface-gas phase interface. Report No. SAND90-8003C, Sandia NationalLaboratories.
Deluga, G.A., Salge, J.R., Schmidt, L.D., Verykios, X.E., 2004. Renewablehydrogen from ethanol by autothermal reforming. Science 303, 993–997.
Deutschmann, O., Schmidt, L.D., 1998. Modeling the partial oxidation ofmethane in a short-contact-time reactor. A.I.Ch.E. 44, 2465–2477.
Dogwiler, U., Benz, P., Mantzaras, J., 1999. Two-dimensional modellingfor catalytically stabilized combustion of a lean methane–air mixturewith elementary homogeneous and heterogeneous chemical reactions.Combustion and Flame 116, 243–258.
Dreyer, B.J., Lee, I.C., Krumenacher, J.J., Schmidt, L.D., 2005. Effect ofsteam addition on the catalytic partial oxidation of higher hydrocarbonsand JP-8. Proceedings IWCC6, Ischia, Italy, September 11–14, pp. 71–76.
Efstathiou, A.M., Kladi, A., Tsipouriari, V.A., Verykios, X.E., 1996. Reformingof methane with carbon dioxide to synthesis gas over supported rhodiumcatalysts. Journal of Catalysis 158, 64–75.
Eriksson, S., Wolf, M., Schneider, A., Mantzaras, J., Raimondi, F., Boutonnet,M., Järas, S., 2005a. Fuel-rich catalytic combustion of methane in zeroemissions power generation processes. Catalysis Today, accepted.
Eriksson, S., Nilsson, M., Boutonnet, M., Järas, S., 2005b. Partial oxidation ofmethane over rhodium for power generation applications. Catalysis Today100, 447–451.
Ferrreira-Aparicio, P., Guerrero-Ruiz, A., Rodriguez-Ramos, I., 1998.Comparative study at low and medium reaction temperatures of syngasproduction by methane reforming with carbon dioxide over silica andalumina supported catalysts. Applied Catalysis A: General 170, 177–187.
Goralski Jr., C.T., Schmidt, L.D., 1999. Modeling heterogeneous andhomogeneous reactions in the high-temperature catalytic combustion ofmethane. Chemical Engineering Science 54, 5791–5807.
Griffin, T., Winkler, D., Wolf, M., Appel, C., Mantzaras, J., 2004. Stagedcatalytic combustion method for the advanced zero emissions gas turbinepower plant. ASME Paper 2004-54101.
Hickman, D.A., Schmidt, L.D., 1993. Steps in CH4 oxidation on Pt and Rhsurfaces: high-temperature reactor simulations. A.I.Ch.E. 39, 1164–1177.
Kee, R.J., Dixon-Lewis, G., Warnatz, J., Coltrin, M.E., Miller, J.A., 1996a.A Fortran computer code package for the evaluation of gas-phasemulticomponent transport properties. Report No. SAND86-8246, SandiaNational Laboratories.
Kee, R.J., Rupley, F.M., Miller, J.A., 1996b. Chemkin II: a Fortran chemicalkinetics package for the analysis of gas-phase chemical kinetics. ReportNo. SAND89-8009B, Sandia National Laboratories.
Klein, E.J., Tummala, S., Schmidt, L.D., 2001. Catalytic partial oxidationof methane to synthesis gas: staged and stratified reactors with steamaddition. In: Iglesia, E. (Ed.), Studies in Surface Science and Catalysis,vol. 136. Elsevier, Amsterdam.
Mantzaras, J., Appel, C., Benz, P., Dogwiler, U., 2000a. Numerical modellingof turbulent catalytically stabilized channel flow combustion. CatalysisToday 53, 3–17.
Mantzaras, J., Appel, C., Benz, P., 2000b. Catalytic combustion of methane/airmixtures over platinum: homogeneous ignition distances in channel flowconfigurations. Proceedings of the Combustion Institute 28, 1349–1357.
Mark, M.F., Maier, W.F., 1996. CO2-reforming of methane on supported Rhand Ir catalysts. Journal of Catalysis 164, 122–130.
A. Schneider et al. / Chemical Engineering Science 61 (2006) 4634–4649 4649
Mhadeshwar, A.B., Wang, H., Vlachos, D.G., 2003. Thermodynamicconsistency in microkinetic development of surface reaction mechanisms.American Chemical Society 226 U530 011-Fuel.
Moffat, H.K., Kee, R.J., Grcar, J.F., Miller, J.A., 1993. Surface PSR: a fortranprogram for modeling well-stirred reactors with gas and surface reactions.Report No. SAND91-8001, Sandia National Laboratories.
Norton, D.G., Vlachos, D.G., 2005. Hydrogen assisted self ignition ofpropane/air mixtures in catalytic microburners. Proceedings of theCombustion Institute 30, 2473–2480.
Patankar, S.V., 1980. Numerical Heat Transfer and Fluid Flow. HemispherePubl. Corp., New York.
Pfefferle, W.C., Pfefferle, L.D., 1986. Catalytically stabilized combustion.Progress in Energy and Combustion Science 12, 25–41.
Reinke, M., Mantzaras, J., Schaeren, R., Bombach, R., Kreutner, W.,Inauen, A., 2002. Homogeneous ignition in high-pressure combustionof methane/air over platinum: comparison of measurements and detailednumerical predictions. Proceedings of the Combustion Institute 29,1021–1029.
Reinke, M., Mantzaras, J., Schaeren, R., Bombach, R., Inauen, A., Schenker,S., 2004. High-pressure catalytic combustion of methane over platinum:in situ experiments and detailed numerical predictions. Combustion andFlame 136, 217–240.
Reinke, M., Mantzaras, J., Bombach, R., Schenker, S., Inauen, A., 2005.Gas phase chemistry in catalytic combustion of methane/air mixtures overplatinum at pressures of 1 bar to 16 bar. Combustion and Flame 141,448–468.
Richardson, J.T., Garrait, M., Hung, J.-K., 2003. Carbon dioxide reformingwith Rh and Pt-Re catalysts dispersed on ceramic foam supports. AppliedCatalysis A: General 255, 69–82.
Schwiedernoch, R., Tischer, S., Correa, C., Deutschmann, O., 2003.Experimental and numerical study on the transient behavior of partialoxidation of methane in a catalytic monolith. Chemical EngineeringScience 58, 633–642.
Shah, R.K., London, A.L., 1978. Laminar Flow Forced Convection in Ducts.Academic Press, New York. p. 257.
Veser, G., Ziauddin, M., Schmidt, L.D., 1999. Ignition in alkane oxidationon noble-metal catalysts. Catalysis Today 47, 219–228.
Wang, H.Y., Ruckenstein, E., 2000. Carbon dioxide reforming of methaneto synthesis gas over supported rhodium catalysts: the effect of support.Applied Catalysis A: General 204, 143–152.
Warnatz, J., Dibble, R.W., Maas, U., 1996. Combustion, Physical andChemical Fundamentals, Modeling and Simulation. Springer, New York.