Embed Size (px)
Citation preview
V7201406
On Shelf Availability
1

On Shelf Availability
Group Supply ChainDirector
Group IT and Logistics Director
Brunei HK Philippines VietnamCambodia Indonesia SingaporeChina Macau TaiwanDubai Malaysia Thailand
Brunei HK Philippines VietnamCambodia Indonesia SingaporeChina Macau TaiwanDubai Malaysia Thailand
Publications on On Shelf AvailabilityBook Stock Accuracy
Retail Stock Take Store ReplenishmentRetail Supply Chain
Wellcome Giant 7-Eleven IKEAMannings/Guardian
Parknshop Fortress Watsons
Supermarket HypermarketConvenience/
Mini MartElectrical Furniture
Drugstore/Perfumerie
2
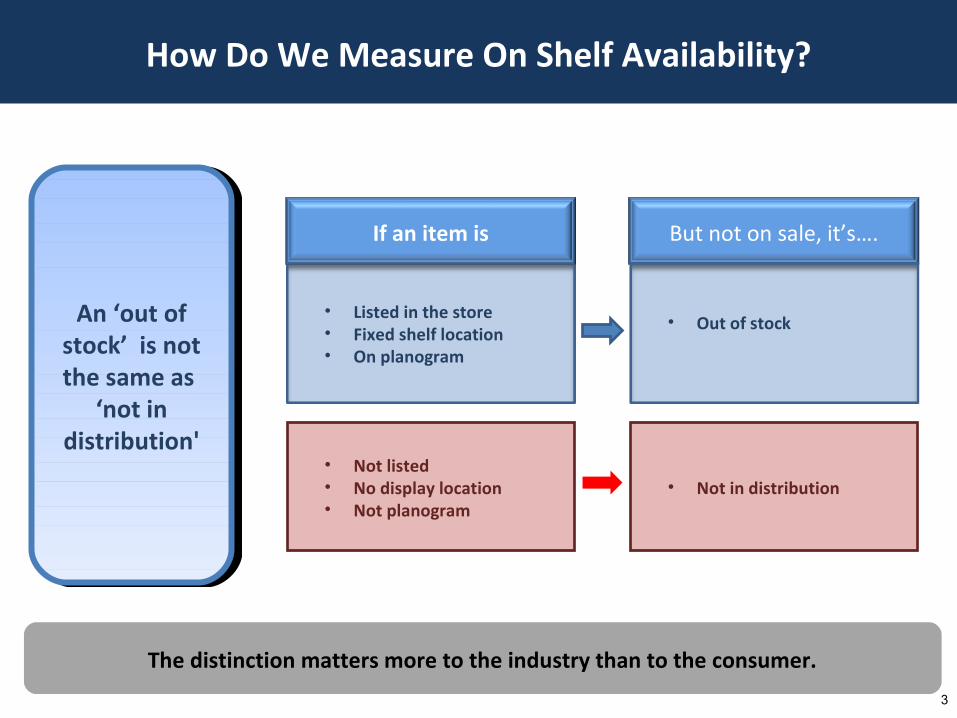
How Do We Measure On Shelf Availability?
The distinction matters more to the industry than to the consumer.
An ‘out of stock’ is not the same as
‘not in distribution'
An ‘out of stock’ is not the same as
‘not in distribution'
• Listed in the store• Fixed shelf location• On planogram
If an item is
• Not listed• No display location• Not planogram
But not on sale, it’s….
• Out of stock
• Not in distribution
3

When is a product out of stock?
• 1 piece of stock = in stock
• 0 stock = out of stock
• 1 piece of stock = in stock
• 0 stock = out of stock
The Retailer’s
View
• Missing from shelf / missing from checkout / missing from promotional slot.
• Minimum 2 pieces / 3 pieces / minimum credible display…
• Missing from shelf / missing from checkout / missing from promotional slot.
• Minimum 2 pieces / 3 pieces / minimum credible display…
The Supplier’s
View
4

When is a product out of stock?
• I expected it be on sale in the store but it wasn’t• I expected it be on sale in the store but it wasn’t
The Consumer’s
View
5
Consumers do not know the difference between a range decision and a failure in the supply chain.
They measure us with expectations, sometimes unreasonably.

Which Retailer Has The Best Availability?
Limited range Discounter
Supermarket
1010 5050
Hypermarket
200200
Convenience store
5Range of Noodles Listed
1010 4949 1801805Lines in stock
100%100% 98%98% 90%90%100%Availability
60%60% 80%80% 90%90%30%% of items on sale in terms of value share of market
Is 100% availability of 10 items better than 90% availability of 200?
No retailer offers 100% of all the items on sale across the entire market.
6

Which Out of stock matter more than others?
• 100 variants in the range• 40 variants from Australia• 20 at the same price point• 5 others on promo / lower price• Consumer can easily switch
• Only 1 item on sale• Consumer needs the item to bake
a cake• 5 other ingredients on the
shopping list• Retailer loses the whole basket if
the key item is not available
7

Sometimes it’s good to be out of stock
• At the end of the season / after the festival
• ‘When it’s gone it’s gone’ promotions
• Sell the fresh products through each day to prove that they’re fresh
• Clearing old stock
• Launching the new i-phone!
8
Not every gap is a lost sale.
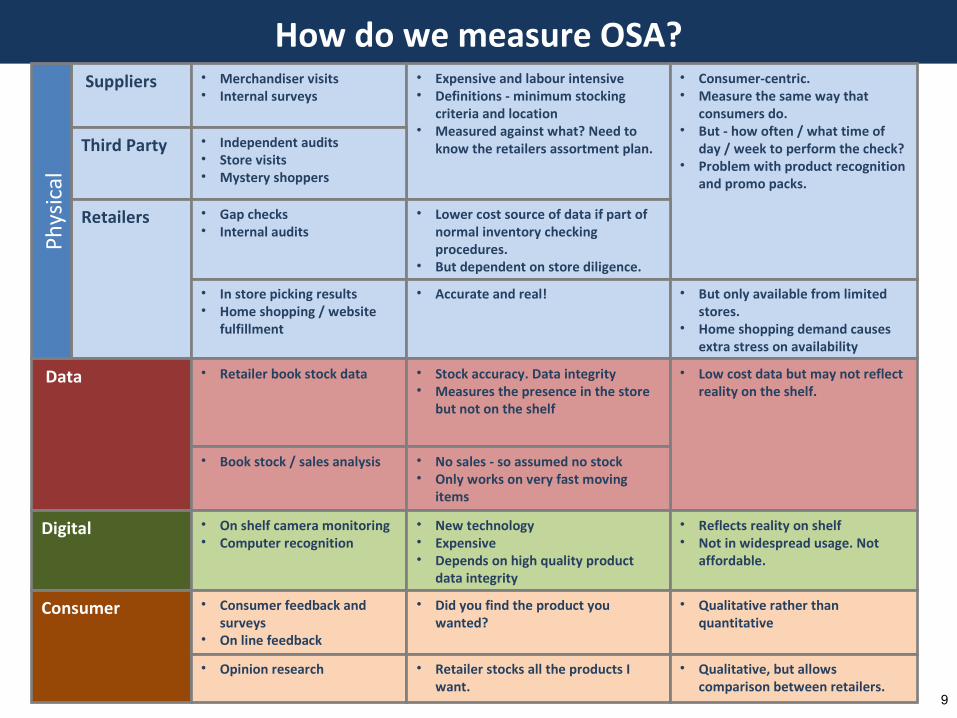
How do we measure OSA? Suppliers • Merchandiser visits
• Internal surveys• Expensive and labour intensive• Definitions - minimum stocking
criteria and location• Measured against what? Need to
know the retailers assortment plan.
• Consumer-centric. • Measure the same way that
consumers do.• But - how often / what time of
day / week to perform the check?• Problem with product recognition
and promo packs.
Third Party • Independent audits• Store visits• Mystery shoppers
Retailers • Gap checks• Internal audits
• Lower cost source of data if part of normal inventory checking procedures.
• But dependent on store diligence.
• In store picking results• Home shopping / website
fulfillment
• Accurate and real! • But only available from limited stores.
• Home shopping demand causes extra stress on availability
Data • Retailer book stock data • Stock accuracy. Data integrity• Measures the presence in the store
but not on the shelf
• Low cost data but may not reflect reality on the shelf.
• Book stock / sales analysis • No sales - so assumed no stock• Only works on very fast moving
items
Digital • On shelf camera monitoring• Computer recognition
• New technology• Expensive• Depends on high quality product
data integrity
• Reflects reality on shelf• Not in widespread usage. Not
affordable.
Consumer • Consumer feedback and surveys
• On line feedback
• Did you find the product you wanted?
• Qualitative rather than quantitative
• Opinion research • Retailer stocks all the products I want.
• Qualitative, but allows comparison between retailers.
Physical
9
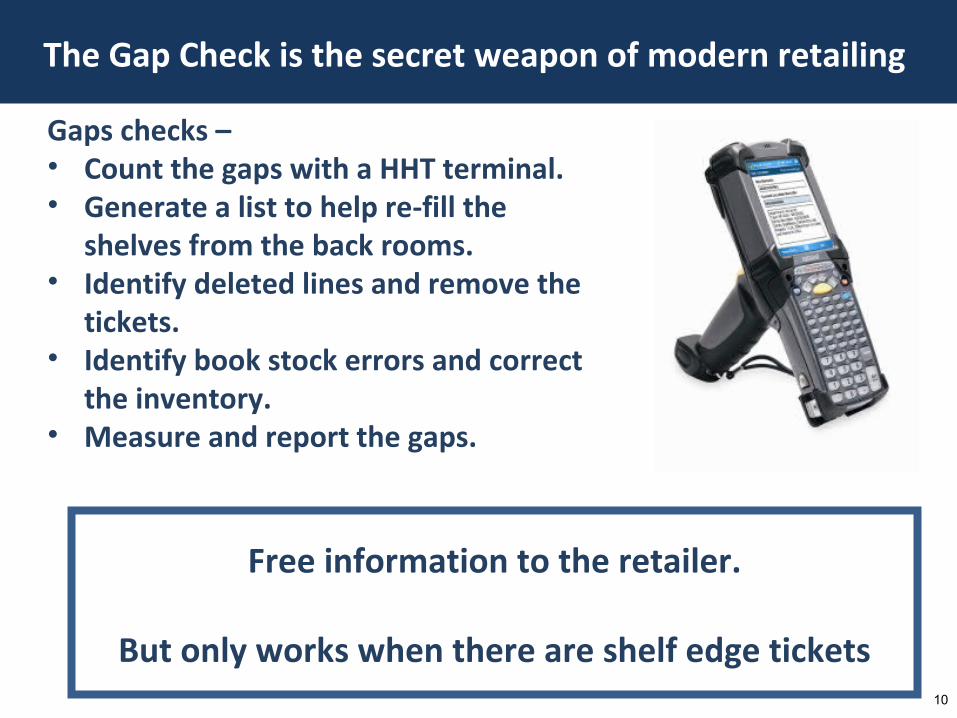
The Gap Check is the secret weapon of modern retailing
Gaps checks – • Count the gaps with a HHT terminal.• Generate a list to help re-fill the
shelves from the back rooms.• Identify deleted lines and remove the
tickets.• Identify book stock errors and correct
the inventory.• Measure and report the gaps.
10
Free information to the retailer.
But only works when there are shelf edge tickets

How do we measure OSA?
• In every way possible!!!!!!• In every way that we can afford to!!!!!!!!!• All the way along the supply chain!!!!!!!
Stock in store
(Book stock)
Stock on shelf( gap checks /
surveys )
Consumer research
and satisfaction
Supplier to Retailer DC Fulfillment
• Bad supplier fulfillment may not result in bad OSA (slow selling items/overstocked stores ) • Good supplier fulfillment may not help the product stay on sale (fast selling items / bad
planograms or store rotation)
Every point in the supply chain needs to be measured.
But the consumer OSA is the most critical
11
Supplier DCTo Store
Fulfillment

Where Does The Supply Chain Break Down?
Store stock rotation and shelf filling
Planogram / assortment control
Store replenishment(ordering from warehouse)
Supplier availability
DC replenishment ( ordering from suppliers )
12
The store is where most of the problems take place. But the cause is often further back in the chain….

Who loses when there is an Out of Stock?
• Buy from another retailer
Who loses? Retailer or Supplier?Consumers’ Reaction To An Out Of Stock
• Retailer.
• Buy a different variant from the same supplier - Trade up- Trade down
- Trade down
• both gain ( marginally )• both lose ( marginally )
• Buy a different brand from the same retailer- Trade up- Trade down
• Retailer gains ( marginally )• Supplier loses• Retailer loses ( marginally ) Supplier
loses • Delays purchase / buys later
- No loss of consumption- Loss of consumption
• Neither loses• Both lose
• Most studies indicate that retailers lose approx 25% from an out of stock• Suppliers lose approx 50%
13

The Economics of On Shelf Availability
1% availability x 25% loss x 30% margin = 0.075% cost1% availability x 25% loss x 30% margin = 0.075% costRetailers
1% availability x 50% loss x 50% margin = 0.25% cost1% availability x 50% loss x 50% margin = 0.25% costSuppliers
The impact for suppliers can be 3 times higher than for retailers!
14

Life lessons on OSA
• Counter-intuitive, more stock means less availability. ( Higher stocks cause congestion. Stores lose the stock in the back rooms. )
• Continuous flow is better than stop and start.
Less is more
• It's hard to find and retain staff at store level.
• Central teams are better at ordering than store staff
Minimize the store role
• Simple replenishment systems such as Min Max often work better than complex algorithms
• Most interventions make things worse rather than better.
Keep it simple, stupid
• Non-selling products get in the way and reduce OSA
• High availability of products that consumers do not want to buy is a waste of time.
Bad products drive out good.
15

What can suppliers do to improve OSA?
• Too often , OSA is a stick to beat the retailer with in order to push more stock into the system.
• Forget about stock. Think about sales to consumers.
• Too often , OSA is a stick to beat the retailer with in order to push more stock into the system.
• Forget about stock. Think about sales to consumers.
Concentrate on sell -out rather than sell-in
• Align data, KPI's and measurement.
• Align data, KPI's and measurement.
Speak the same language
• Reduce lead time. Increase frequency. Remove MOQ's.
• A constant supply, not a stop and go model.
• Reduce lead time. Increase frequency. Remove MOQ's.
• A constant supply, not a stop and go model.
Create a constant flow
• Remove the non-sellers.• Cut out non-value-added
promotions and price changes.• Make it easier for stores and
consumers.
• Remove the non-sellers.• Cut out non-value-added
promotions and price changes.• Make it easier for stores and
consumers.
Simplify. Simplify. Simplify.
16

What is an Appropriate On Shelf Availability Target?
• Tipping point• 80% - 90%• Customers may give up and take all their
shopping elsewhere
• Must improve• 90% - 95%• Worth significant investment to improve
availability• Potential payback in terms of sales
• Minimum• 95% - 97.5%• Harder to link an increase in sales with higher
OSA
• Manage trade offs• 97.5% - 98.5%• Are the benefits worth the costs?• Should we save costs in the supply chain rather
than invest in availability?
• Over-investment• 98.5% - 99.5%• Missing trade-offs? Manage the same outcome
with less capital or space?
• Out of business• 99.5%+• Consumers aren't buying the products.• Find another job.
17

Final thoughts….
• Customers have a different view on ‘on shelf availability’. What matters most to you often matters least to them.
• Focus on getting the right products to the right shelf. Not every item to every shelf.
• There is a trade off between cost and availability. And no obvious link between availability and sales.
• Nobody ever fixes bad sales with better availability. When sales are below forecast, products don’t sell out.
• Nobody ever fixes availability with more stock. Only by moving it faster to the right place.
18