Embed Size (px)
Citation preview

Virginia Commonwealth University Virginia Commonwealth University
VCU Scholars Compass VCU Scholars Compass
Theses and Dissertations Graduate School
2017
Orthodontists' and Parents' Perspective of Occlusion in Varying Orthodontists' and Parents' Perspective of Occlusion in Varying
Anterior-Posterior Positions: A Comparative Study Anterior-Posterior Positions: A Comparative Study
David H. Lindsey Virginia Commonwealth University
Follow this and additional works at: https://scholarscompass.vcu.edu/etd
Part of the Orthodontics and Orthodontology Commons
© David Hikaru Lindsey
Downloaded from Downloaded from https://scholarscompass.vcu.edu/etd/4758
This Thesis is brought to you for free and open access by the Graduate School at VCU Scholars Compass. It has been accepted for inclusion in Theses and Dissertations by an authorized administrator of VCU Scholars Compass. For more information, please contact [email protected].

© David Hikaru Lindsey 2017
All Rights Reserved

ORTHODONTISTS’ AND PARENTS’ PERSPECTIVE OF OCCLUSION IN VARYING
ANTERIOR-POSTERIOR POSITIONS: A COMPARATIVE STUDY
A thesis submitted in partial fulfillment of the requirements for the degree of Master of Science
in Dentistry at Virginia Commonwealth University.
By
David Hikaru Lindsey, D.D.S.
B.S. Psychobiology, University of California, Los Angeles, June 2010
D.D.S., University of California, Los Angeles School of Dentistry, June 2015
Director: Dr. Bhavna Shroff, D.M.D., M.Dent.Sc., M.P.A.
Virginia Commonwealth University Department of Orthodontics Program Director
Virginia Commonwealth University
Richmond, Virginia
May 2017

ii
ACKNOWLEDGEMENT
I would like to first thank the Virginia Commonwealth University Department of Orthodontics for
the opportunity to develop the clinical and didactic skills necessary to excel in an orthodontic
career in a welcoming and supportive environment. Specifically, I would like to express my
sincere gratitude to Dr. Bhavna Shroff for her encouragement, assistance, and commitment. She
has continually exceeded all required responsibilities to ensure successful completion of this
project and guide my professional development. Additionally, I would like to thank Drs. Steven
Lindauer, Eser Tüfekçi, and Caroline Carrico for their contributions and thoughtful input.
Furthermore, I would like to extend my gratitude to my co-residents for creating a positive and
constructive environment to learn and grow. I would also like to thank Jamie Dodd for the
countless hours spent meticulously measuring and inputting data. Lastly, I would like to thank my
family, most notably my wife, Misha, for her love, patience, and unselfishness to allow me to
pursue my career dreams and our daughter, Kaylee, for providing endless joy and inspiration.

iii
TABLE OF CONTENTS
ACKNOWLEDGEMENT .............................................................................................................. ii
LIST OF TABLES ......................................................................................................................... iv
LIST OF FIGURES ....................................................................................................................... vi
LIST OF APPENDICES ............................................................................................................... vii
ABSTRACT .................................................................................................................................... ii
INTRODUCTION .......................................................................................................................... 1
MATERIALS AND METHODS .................................................................................................... 4
RESULTS ....................................................................................................................................... 8
DISCUSION ................................................................................................................................. 24
CONCLUSIONS........................................................................................................................... 40
REFERENCES ............................................................................................................................. 41
APPENDICES .............................................................................................................................. 49
VITA ............................................................................................................................................. 69

iv
LIST OF TABLES
Table 1. Survey Order. ................................................................................................................... 6
Table 2. Intra and Inter-Reliability Scores ..................................................................................... 8
Table 3: Survey Demographics ...................................................................................................... 9
Table 4. Factors Associated with Outcome Acceptability ........................................................... 10
Table 5. Pairwise Comparisons for VAS by Respondent and Malocclusion .............................. 12
Table 6. Pairwise Comparison for VAS by Respondent and Compliance ................................... 13
Table 7. Pairwise Comparisons for VAS by Respondent and Treatment Time ........................... 14
Table 8. Orthodontists’ Acceptability of Treatment for Associated Factors .............................. 15
Table 9. Average VAS Score for Orthodontists by Gender ........................................................ 15
Table 10. Parent Acceptability of Treatment for Associated Factors ......................................... 16
Table 11. Factors Associated with Extension of Treatment Time ............................................... 17
Table 12. All Pairwise Comparisons for Differences in Additional Treatment Time ................. 19
Table 13. Pairwise Comparison for Additional Treatment Months based on Respondent and
Compliance ................................................................................................................................... 20
Table 14. Pairwise Comparison of Additional Treatment Months based on Completed Months and
Respondent Type .......................................................................................................................... 22
Table 15. Factors Associated with Orthodontists for Extension of Treatment ........................... 23
Table 16. Pairwise Comparison of Extension of Treatment Length by Years in Practice for
Orthodontists ................................................................................................................................. 24
Table 17. Factors Associated with Parents for Extension of Treatment ...................................... 24
Table 18. Orthodontist and Parent Response for Ideal and Actual Treatment Times .................. 26

v
Table 19. Comparison of Orthodontists and Parents Perception of Ideal and Actual Reported
Treatment Times ........................................................................................................................... 28
Table 20. Average Treatment Times (Actual, Ideal) by Respondent in Months ........................ 29
Table 21. Comparison of Average Treatment Times (Actual, Ideal) between Orthodontists and
Parents ........................................................................................................................................... 29

vi
LIST OF FIGURES
Figure 1. Estimated Acceptability by Respondent and Malocclusion ......................................... 11
Figure 2. Adjusted Acceptability by Respondent and Compliance ............................................. 13
Figure 3. Estimated Acceptability by Respondent and Treatment Time ..................................... 14
Figure 4. Orthodontist Average Acceptability by Years in Practice ............................................ 16
Figure 5. Additional Treatment Time in Months by Respondent and Malocclusion .................. 18
Figure 6. Additional Treatment Time by Respondent and Compliance ...................................... 20
Figure 7. Additional Treatment Months based on Months Completed and Respondent Type ... 21
Figure 8. Additional Treatment Time for Orthodontists by Years in Practice ............................ 23
Figure 9. Ideal and Actual Treatment Times for Extraction Cases .............................................. 27
Figure 10. Ideal and Actual Treatment Times for Non-Extraction Cases ................................... 27

vii
LIST OF APPENDICES
Appendix 1. Survey to Orthodontists - Version A ....................................................................... 49
Appendix 2. Survey to Parents - Version B ................................................................................. 59

ABSTRACT
ORTHODONTISTS’ AND PARENTS’ PERSPECTIVE OF OCCLUSION IN VARYING
ANTERIOR-POSTERIOR POSITIONS: A COMPARATIVE STUDY
By David H. Lindsey, D.D.S.
A thesis submitted in partial fulfillment of the requirements for the degree of Master of Science
in Dentistry at Virginia Commonwealth University.
Virginia Commonwealth University, 2017
Thesis Director: Bhavna Shroff, D.M.D., M.Dent.Sc., M.P.A.
Program Director, Department of Orthodontics
Objective: The purpose was to compare orthodontists’ and parents’ perception of orthodontic
treatment outcomes in the anterior-posterior (AP) dimension. Assessment of treatment time and
compliance were also investigated.
Material and Methods: Parallel surveys for orthodontists (n=1000) and parents (n=750)
displayed occlusions from 3 mm Class III (Cl III:3) to 3 mm Class II. Participants rated occlusal
relationships on a 100 mm VAS from least to most acceptable (0-100).
Results: 233 orthodontists (23%) and 243 parents (32%) responded. Orthodontists (mean=93.9,
25.9) and parents (mean=80.7, 40.9) rated Class I (Cl I) occlusion most and Cl III:3 least
acceptable. No significant difference was found between outcomes at 18 months versus 24
months. For all cases, parents were willing to extend treatment duration longer than orthodontists.
Conclusions: Orthodontists and parents viewed treatment outcomes in the AP dimension
differently, rating Cl I as most acceptable. Parents were willing to extend treatment longer than
orthodontists.

1
INTRODUCTION
The length of orthodontic treatment is important to patients and their parents, and
orthodontists must routinely answer questions regarding how much longer treatment will continue.
Factors affecting the duration of orthodontic treatment have been investigated and include patient
compliance and severity of malocclusion.1-3 A wide range in the duration of treatment has been
reported.1, 2, 4, 5 The average treatment time among private practice orthodontic offices ranges from
23.1 months to 28.6 months.1, 2 A similar duration of 27.5 months was reported for treatment in a
residency program.4 Wenger et al. found that Class II malocclusions require the greatest amount
of time to complete treatment (29.9 months) compared to 26 months for Class I malocclusions and
28 months for Class III malocclusions.5 Yet, orthodontists and patients desire shorter treatment
times, and some advances in dental materials and orthodontic techniques may help shorten
treatment duration.6-9
In addition to demanding shorter treatment times, multiple studies have demonstrated that
orthodontic patients and their parents have high treatment outcome expectations.10-12 Completing
orthodontic treatment may sensitize patients to minor esthetic problems during and after treatment,
resulting in even higher esthetic demands.11 Despite increased awareness by laypeople,
orthodontists demonstrate a greater ability to recognize esthetic disharmonies.10, 13, 14 The different
perception of esthetics by orthodontists and laypeople creates potential discrepancies between how
orthodontists and laypeople assess the quality of orthodontic treatment.
Patient cooperation and compliance levels vary noticeably, with poor cooperation and
compliance being associated with increased treatment duration.2 Multiple studies have
investigated factors associated with poor compliance, which include patients’ sex with males less

2
cooperative than females, influence of parents, severity of malocclusion, increased missed
appointments, and inadequate oral hygiene.1-3, 15, 16 Fink and Smith proposed that the number of
missed appointments correlates with overall compliance.1 Mehra et al. found that 95% of
orthodontists report terminating treatment early in up to 5% of their noncompliant patients. The
remaining 5% of orthodontists surveyed routinely end treatment early in 5-10% of their
noncompliant patients.16
Orthodontists must balance the decision to continue treatment with the potential risks of
development of white spot lesions, apical root resorption, periodontal defects, and continued lack
of compliance.17-22 The decision to either continue or prematurely end treatment is further
complicated in cases where the patient’s chief complaint has been addressed, functional occlusion
established, and parents/patients want to cease treatment before the attainment of an ideal
occlusion. While adolescent patients’ concerns and needs must be considered during treatment,
ultimately treatment decisions are determined by the legal guardian, which most commonly is the
parent. By determining discrepancies between the orthodontists’ and parents’ perception of
treatment outcomes, the orthodontist can better address patients’ expectations.4, 23 Additionally,
understanding parents’ perception of malocclusions allows orthodontists to create goals for
orthodontic treatment and to recommend treatment that encompasses more than an initial chief
complaint.
Previous studies comparing orthodontists and laypeople have relied on facial drawings24,
25, altering intraoral photographs11, 13, 26, or modifying full facial photographs.27-29 In this study
digital models were used to analyze perceived preferences of orthodontists compared to laypeople
for occlusal changes in the anterior-posterior (AP) dimension. While previous methods were
appropriate to evaluate facial and dental esthetics, possible uncontrolled biases were introduced

3
when using extraoral and intraoral photographs such as tooth shade, lip thickness, and gingival
pigmentation.30, 31 Recent studies have verified the efficacy of utilizing digital models as accurate
representations of overjet and canine and molar classification.32, 33 Through digital modeling
software, the potential biases of tooth and gingival shades can be controlled. Additionally, the
software can allow quantifiable alterations in the AP direction.
With patients’ and parents’ concerns regarding treatment length and demands for improved
smile esthetics, research is needed to determine if patients and parents are willing to compromise
the overall treatment outcome for shorter treatment duration. If patients or parents are willing to
compromise, the orthodontist also must decide if he/she is willing to compromise the standards of
care to meet patients’ and parents’ expectations.
The specific aims of this study were to compare and quantify orthodontists’ and parents’:
1) acceptability of occlusal relationships in varying AP positions; 2) perception of orthodontic
treatment duration; 3) willingness to extend treatment time to achieve a more acceptable treatment
outcome. The null hypothesis was that no statistical differences exist between orthodontists’ and
parents’ preference of occlusal relationships, treatment duration, and willingness to extend
treatment time.
4
MATERIALS AND METHODS
Image Design
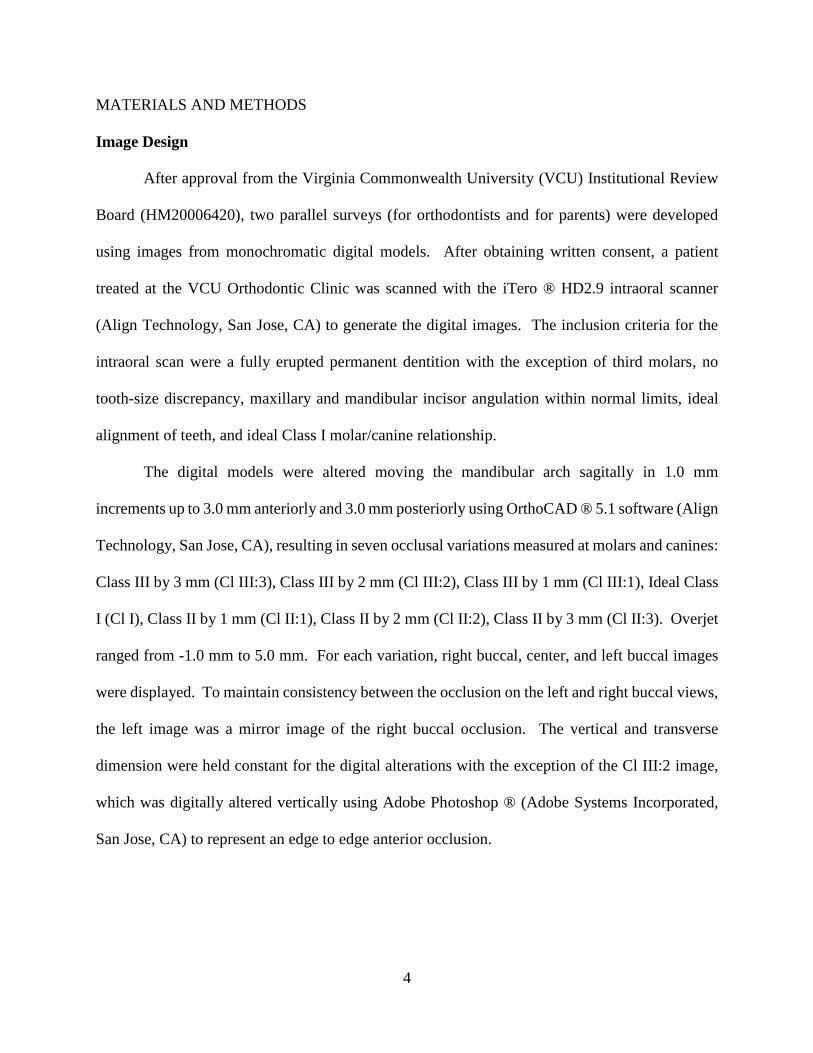
After approval from the Virginia Commonwealth University (VCU) Institutional Review
Board (HM20006420), two parallel surveys (for orthodontists and for parents) were developed
using images from monochromatic digital models. After obtaining written consent, a patient
treated at the VCU Orthodontic Clinic was scanned with the iTero ® HD2.9 intraoral scanner
(Align Technology, San Jose, CA) to generate the digital images. The inclusion criteria for the
intraoral scan were a fully erupted permanent dentition with the exception of third molars, no
tooth-size discrepancy, maxillary and mandibular incisor angulation within normal limits, ideal
alignment of teeth, and ideal Class I molar/canine relationship.
The digital models were altered moving the mandibular arch sagitally in 1.0 mm
increments up to 3.0 mm anteriorly and 3.0 mm posteriorly using OrthoCAD ® 5.1 software (Align
Technology, San Jose, CA), resulting in seven occlusal variations measured at molars and canines:
Class III by 3 mm (Cl III:3), Class III by 2 mm (Cl III:2), Class III by 1 mm (Cl III:1), Ideal Class
I (Cl I), Class II by 1 mm (Cl II:1), Class II by 2 mm (Cl II:2), Class II by 3 mm (Cl II:3). Overjet
ranged from -1.0 mm to 5.0 mm. For each variation, right buccal, center, and left buccal images
were displayed. To maintain consistency between the occlusion on the left and right buccal views,
the left image was a mirror image of the right buccal occlusion. The vertical and transverse
dimension were held constant for the digital alterations with the exception of the Cl III:2 image,
which was digitally altered vertically using Adobe Photoshop ® (Adobe Systems Incorporated,
San Jose, CA) to represent an edge to edge anterior occlusion.

5
Participants
The orthodontist surveys (Appendix A1) were mailed to 1,000 orthodontists randomly
selected from a geographical weighted representation of all 9,277 active U.S. members of the
American Association of Orthodontists (AAO). The weighted representation was developed to
limit location bias of respondents by determining the ratio of active AAO members per state to
total U.S. active AAO members. The parent surveys (Appendix A2) were given to 750 parents of
children currently in active orthodontic treatment who did not receive Phase I orthodontic therapy
or previous comprehensive treatment. Parent participants were randomly selected from 15
different orthodontic offices, including the VCU Orthodontic Clinic. The remaining 14
orthodontic offices were selected from the current members of Virginia Orthodontic Education
and Research Foundation and practicing part-time faculty members of VCU Department of
Orthodontics. The orthodontic practices were located in Virginia, North Carolina, and Idaho.
Each of the 15 offices received 50 questionnaire packets.
Measurements
Using a 100 mm visual analogue scale (VAS) anchored by “least acceptable” and “most
acceptable”, participants were asked to mark their preference for each of the seven varying occlusal
relationships. For the control, a repeat of the ideal occlusal relationship was included to measure
participant reliability. Thus, a total of eight cases were presented to participants. The order of the
eight sets was randomized utilizing a random number generator within Microsoft Excel ®
(Microsoft Corporation, Redmond, WA). All VAS scores were measured using Fowler 6”/150
mm Electronic Caliper 54-100-77-2 (Fred V Fowler Co Inc., Newton, MA) by two examiners (DL
and JD). Inter-rater and intra-rater reliability were determined by each examiner independently

6
measuring 50 VAS scores, then repeating the measurements 7 days later.
Treatment Duration
To investigate if the amount of time in treatment impacted the orthodontists’ and parents’
perception of treatment outcome or willingness to extend orthodontic treatment to achieve a more
desired occlusal relationship, each case was presented at 18 months or 24 months of orthodontic
treatment. For both the orthodontist and parent surveys, two versions (A and B) were created.
Each version displayed the eight sets of images at either 18 months or 24 months. A random
number generator within Microsoft Excel ® (Microsoft Corporation, Redmond, WA) determined
which version of the survey contained the 18 month or 24 month image set (Table 1).
Version A Version B
1) Cl I – 24 months 1) Cl II:3 – 18 months
2) Cl II:2 – 18 months 2) Cl III:2 – 24 months
3) Cl III:3 – 18 months 3) Cl I – 18 months
4) Cl III:2 – 18 months 4) Cl III:3 – 24 months
5) Cl II:1 – 18 months 5) Cl II:2 – 24 months
6) Cl I – 24 months 6) Cl II:1 – 24 months
7) Cl II:3 – 24 months 7) Cl III:1 – 18 months
8) Cl III:1 – 24 months 8) Cl I – 18 months
Table 1. Survey Order.

7
Data Collection
The orthodontist surveys were sent by mail. Initial nonresponders received a second
mailing 6 weeks after the initial mailing. The parent surveys were delivered to each participating
office with no second round of mailing. Study data were collected and managed using REDCap
(Research Electronic Data Capture) software hosted at VCU. This program is a secure web-based
application designed to support data capture for research studies, data verification and export
procedures to statistical packages.34
Statistical Analysis
Outcome acceptability (VAS score 0 – 100 mm) and additional treatment time were
estimated using repeated measures analysis to account for variability among respondents.
Parameters included in all models were the respondent type (orthodontists or parents), case
malocclusion, treatment duration (18 or 24 months), and compliance. Additionally, two-way
interactions were fit to determine potential differences in the effect of malocclusion, treatment
time, and patient compliance between parents and orthodontists. All post hoc pairwise
comparisons were adjusted using Tukey’s HSD to account for multiple comparisons. A
significance level of 0.05 was set for all statistical models. SAS Enterprise Guide v.6.1 (SAS
Institute Inc., Cary, NC) was used for all analyses.

8
RESULTS
Rater Calibration
The two examiners (DL and JD) were nearly identical in measuring the calibration data
with an inter-rater reliability of 0.99 (Table 2). The strong correlation for both the intra-rater and
inter-rater reliability measurements of the initial 50 VAS scores provided confidence for the
accuracy of the complete data set.
Table 2. Intra and Inter-Reliability Scores
Correlation
Rater 1 0.99781
Rater 2 0.99999
Inter-Rater 0.99881
Control Measurements
The average difference between the two scores for the control image was 0.46 (SD=16.95).
The two scores were compared using TOST for equivalence and found to be equivalent within ±
2 on the VAS (90% CL on mean: -0.84 – 1.76).
Survey Demographics
The data were collected from July through November 2016. The response rates were 23%
(n = 233) and 32% (n = 243) for orthodontists and parents, respectively (Table 3). For
orthodontists, 78% of respondents were male and 22% were female. Orthodontists with American
Board of Orthodontics (ABO) certification represented 38% of the total respondents. The majority

9
of orthodontists that responded (79%) had been in practice 30 years or less. For parents, 14% of
respondents were male and 86% were females. The majority of parents (82%) were between 35
to 54 years old with 94% of the children in treatment were between 11 to 16 years old.
Table 3: Survey Demographics
Parents n % Orthodontists n %
Response Rate 243 32% Response Rate 233 23%
Gender Gender
Male 33 14% Male 181 78%
Female 203 86% Female 50 22%
Age (years) ABO Certified 87 38%
25-34 24 10% Years in Practice
35-44 110 46% 1-10 57 25%
45-54 86 36% 11-20 69 30%
55-64 15 6% 21-30 56 24%
65+ 3 1% 31-40 37 16%
Child: Gender 41 + 13 6%
Male 107 45%
Female 130 55%
Child: Age (years)
8-10 8 3%
11-13 130 55%
14-16 92 39%
17+ 7 3% Child: Months of Treatment
Completed
1-6 52 22%
7-12 42 18%
13-18 100 43%
19-24 23 10%
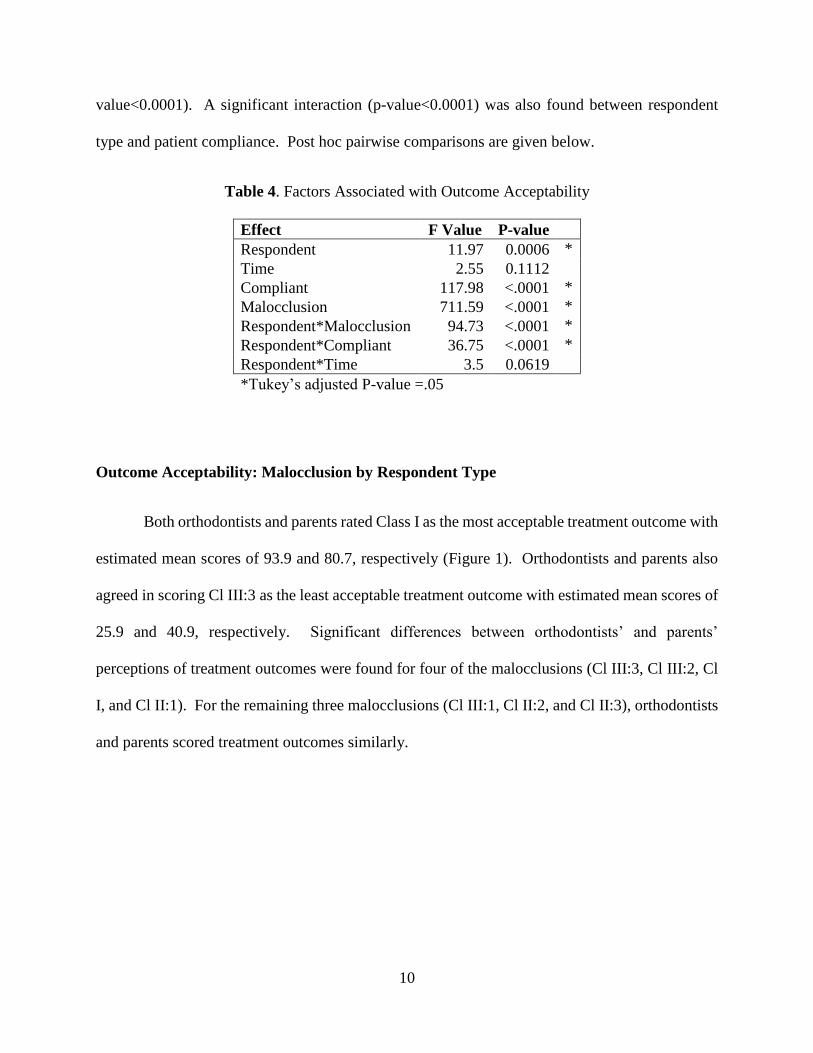
Outcome Acceptability: Associated Factors
Factors associated with overall acceptability of treatment outcomes included malocclusion,
compliance of the patient, type of respondent (orthodontist or parent), and time in treatment (Table
4). The interaction between respondent type and malocclusion had the strongest association (p-
10
value<0.0001). A significant interaction (p-value<0.0001) was also found between respondent
type and patient compliance. Post hoc pairwise comparisons are given below.
Table 4. Factors Associated with Outcome Acceptability
Effect F Value P-value
Respondent 11.97 0.0006 *
Time 2.55 0.1112
Compliant 117.98 <.0001 *
Malocclusion 711.59 <.0001 *
Respondent*Malocclusion 94.73 <.0001 *
Respondent*Compliant 36.75 <.0001 *
Respondent*Time 3.5 0.0619
*Tukey’s adjusted P-value =.05
Outcome Acceptability: Malocclusion by Respondent Type
Both orthodontists and parents rated Class I as the most acceptable treatment outcome with
estimated mean scores of 93.9 and 80.7, respectively (Figure 1). Orthodontists and parents also
agreed in scoring Cl III:3 as the least acceptable treatment outcome with estimated mean scores of
25.9 and 40.9, respectively. Significant differences between orthodontists’ and parents’
perceptions of treatment outcomes were found for four of the malocclusions (Cl III:3, Cl III:2, Cl
I, and Cl II:1). For the remaining three malocclusions (Cl III:1, Cl II:2, and Cl II:3), orthodontists
and parents scored treatment outcomes similarly.

11
Figure 1. Estimated Acceptability by Respondent and Malocclusion
* Indicates significant difference between orthodontists and parents at 0.05 level (Tukey’s
adjusted)
The largest difference in perception of acceptability between orthodontists and parents
was 25.5 ± 1.56 for Cl III:2 with parents rating occlusion significantly more acceptable than
orthodontists (Table 5). Orthodontists rated each occlusal variation statistically different, while
parents did not show a statistical difference in the acceptability between Cl I and Cl III:1 (2.0 ±
1.35). For orthodontists, the greatest change in the level of acceptability between two consecutive
cases was between Cl III:1 and Cl III:2 (37.2 ± 1.58). For parents, the greatest change between
two consecutive cases was between Cl III:2 and Cl III:3 (27.0 ± 1.54).
25.9
40.9 42.3
67.9
79.5 78.7
93.9
80.7
86.0
73.3
63.4 62.2
52.7 53.7
0
10
20
30
40
50
60
70
80
90
100
Ort
ho
do
nti
st
Par
ent
Ort
ho
do
nti
st
Par
ent
Ort
ho
do
nti
st
Par
ent
Ort
ho
do
nti
st
Par
ent
Ort
ho
do
nti
st
Par
ent
Ort
ho
do
nti
st
Par
ent
Ort
ho
do
nti
st
Par
ent
Cl III: 3 Cl III: 2 Cl III: 1 Cl I Cl II: 1 Cl II: 2 Cl II: 3
Estimated Acceptability (VAS 0-100) by Respondent and
Malocclusion*
*
*
*

12
Table 5. Pairwise Comparisons for VAS by Respondent and Malocclusion
Comparison
Estimated
Difference SE P-value
Cl II:1 Orthodontists vs Parents 12.7 1.56 <.0001 *
Cl III:1 Orthodontists vs Parents 0.8 1.57 1
Cl II:2 Orthodontists vs Parents 1.2 1.56 1
Cl III:2 Orthodontists vs Parents -25.5 1.56 <.0001 *
Cl II:3 Orthodontists vs Parents -1.0 1.57 1
Cl III:3 Orthodontists vs Parents -15.0 1.56 <.0001 *
Cl I: Orthodontists vs Parents 13.2 1.11 <.0001 *
Orthodontists: Class II:1 vs Cl III:1 6.5 1.58 0.0033 *
Orthodontists: Cl II:1 vs Cl II:2 22.6 1.58 <.0001 *
Orthodontists: Cl II:1 vs Cl I -7.9 1.37 <.0001 *
Orthodontists: Cl III:1 vs Cl III:2 37.2 1.58 <.0001 *
Orthodontists: Cl III:1 vs Cl I -14.4 1.37 <.0001 *
Orthodontists: Cl II:2 vs Cl III:2 21.1 1.57 <.0001 *
Orthodontists: Cl II:2 vs Cl II:3 10.7 1.57 <.0001 *
Orthodontists: Cl II:3 vs Cl III:3 26.8 1.57 <.0001 *
Parents: Cl II:1 vs Cl III:1 -5.3 1.55 0.0375 *
Parents: Cl II:1 vs Cl II:2 11.1 1.55 <.0001 *
Parents: Cl II:1 vs Cl I -7.4 1.34 <.0001 *
Parents: Cl III:1 vs Cl III:2 10.8 1.55 <.0001 *
Parents: Cl III:1 vs Cl I -2.0 1.35 0.9644
Parents: Cl II:2 vs Cl III:3 8.5 1.55 <.0001 *
Parents: Cl III:2 vs Cl III:3 27.0 1.54 <.0001 *
Parents: Cl II:3 vs Cl III:3 12.8 1.55 <.0001 *
*Indicates statistically significant difference (Tukey's adjusted P-value)
Outcome Acceptability: Compliance by Respondent Type
Both orthodontists and parents rated treatment outcomes for noncompliant patients
significantly more acceptable than treatment outcomes for compliant patients (Figure 2). Pairwise
comparison of respondent and compliance regardless of malocclusion or treatment duration
showed differences in the estimated VAS means (Table 6). Orthodontists and parents did not
significantly differ in VAS scores for the noncompliant patients (p=0.3048). For the compliant
patients, parents rated the treatment outcomes significantly higher than orthodontists (VAS mean
score of 64.0 versus 58.7, respectively) for a significant estimated difference of 5.3 ± 0.79 (p-

13
value<0.0001).
Figure 2. Adjusted Acceptability by Respondent and Compliance
* Indicates significant at 0.05 level (Tukey’s adjusted)
Table 6. Pairwise Comparison for VAS by Respondent and Compliance
Comparison
Estimated
Difference SE P-value
Noncompliant: Orthodontists vs Parents 1.4 0.80 0.3048
Compliant: Orthodontists vs Parents -5.3 0.79 <.0001*
Orthodontists: Noncompliant vs Complaint 9.4 0.79 <.0001*
Parents: Noncompliant vs Compliant 2.7 0.78 0.0038*
* Indicates significant at 0.05 level (Tukey’s adjusted)
68.1 66.7
58.764.0
0
10
20
30
40
50
60
70
80
90
100
Orthodontist Parent Orthodontist Parent
Noncompliant Compliant
Estimated Acceptability (VAS 0-100) by Respondent and
Patient Compliance*
*
*

14
Outcome Acceptability: Treatment Time by Respondent Type
While controlling for compliance and type of malocclusion, a significant difference was
found between orthodontists’ and parents’ ratings of treatment outcomes at 18 months (p-
value=0.0010) (Figure 3). No statistical difference was found between orthodontists’ and parents’
ratings of treatment outcomes at 24 months (p-value=0.64). No statistical differences were found
for orthodontists’ nor parents’ preference for treatment outcomes at 18 months compared to 24
months (Table 7).
Figure 3. Estimated Acceptability by Respondent and Treatment Time
* Indicates significant at 0.05 level (Tukey’s adjusted)
Table 7. Pairwise Comparisons for VAS by Respondent and Treatment Time
Comparison
Estimated
Difference SE P-value
18 months: Orthodontists vs Parents -3.0 0.80 0.0010*
24mo: Orthodontists vs Parents -0.9 0.79 0.6403
Orthodontists: 18mo vs 24mo -0.2 0.79 0.9974
Parents: 18mo vs 24mo 1.9 0.78 0.0661
* Indicates significant at 0.05 level (Tukey’s adjusted)
63.3 66.3 63.5 64.4
0.0
10.0
20.0
30.0
40.0
50.0
60.0
70.0
80.0
90.0
100.0
Orthodontist Parent Orthodontist Parent
18 mo 24 mo
Estimated Acceptability (VAS 0-100) by
Respondent and Treatment Time
*

15
Outcome Acceptability: Respondent Type
Orthodontists
After adjusting for time in treatment, compliance, and malocclusion, significant differences
in case acceptability were found for gender and years in practice when orthodontists’ responses
were analyzed separately (Table 8). ABO certified orthodontists and non-ABO certified
orthodontists did not differ significantly in scoring treatment outcomes (p-value=0.18). Females
scored treatment outcomes lower than males with an average difference of 4.5 between genders
(Table 9). Initially, the number of years in practice indicated a significant difference in the
acceptance of malocclusions (p-value=0.04); however after adjusting for multiple comparisons, no
statistical differences were seen among each interval of years in practice (Figure 4). Orthodontists
in practice for 11 to 30 years, on average, scored treatment outcomes marginally higher than both
orthodontists practicing less than 11 years or more than 30 years.
Table 8. Orthodontists’ Acceptability of Treatment for Associated Factors
Effect P-value
Time in Treatment 0.5389
Compliance <.0001*
Malocclusion <.0001*
ABO Certified (Yes vs No) 0.1842
Years in Practice 0.0414*
Gender <.0001*
* Indicates significant at 0.05 level (Tukey’s adjusted)
Table 9. Average VAS Score for Orthodontists by Gender
Gender
Average
VAS
Standard
Error
Female 59.7 0.8132
Male 64.2 0.4483

16
Figure 4. Orthodontist Average Acceptability by Years in Practice
Parents
Significant differences were found for VAS scores of malocclusion acceptability when
analyzing parent responses individually (Table 10). After adjusting for case treatment time (18
months vs 24 months), compliance, and malocclusion, parents’ gender and current treatment
duration for their child were not significant.
Table 10. Parent Acceptability of Treatment for Associated Factors
Effect P-value
Time in Treatment 0.0646
Compliance 0.0073 *
Malocclusion <.0001 *
Gender: Guardian 0.118
Age of Child 0.0594
Gender: Child 0.0731
Child: Months Treatment Completed 0.1087
* Indicates significant at 0.05 level (Tukey’s adjusted)
60.8 63.2 62.8 60.8 61.9
0.0
10.0
20.0
30.0
40.0
50.0
60.0
70.0
1-10 11-20 21 - 30 31 - 40 41 +
Average Treatment Acceptability by Years in Practice

17
Extension of Treatment Length: Associated Factors
Significant differences were found in the amount of time orthodontists and parents were
willing to extend treatment duration (Table 11). As with outcome acceptability, many factors were
dependent on respondent type. Malocclusion and patient compliance were associated with
respondent type (p-value<0.0001). Time in treatment was not associated with respondent type (p-
value=0.2853).
Table 11. Factors Associated with Extension of Treatment Time
Effect F Value P-value
Respondent 430.4 <.0001 *
Time 23.92 <.0001 *
Compliant 99.65 <.0001 *
Malocclusion 308.31 <.0001 *
Respondent*Malocclusion 25.32 <.0001 *
Respondent*Compliant 68.86 <.0001 *
Respondent*Time 1.14 0.2853
* Indicates significant at 0.05 level (Tukey’s adjusted)
Extension of Treatment Length: Malocclusion by Respondent Type
For each type of malocclusion, parents were willing to extend treatment longer than
orthodontists (Figure 5). Although parents would continue treatment longer in Cl III:3 and Cl
III:2, the differences of -0.8 ± 0.24 months (p-value = 0.099) and -0.1 ± 0.24 months (p-value =
1), respectively, between orthodontists and parents were not significantly different (Table 12). The
largest discrepancies between orthodontists and parents’ extension of treatment were for Cl I (3.1
± 0.17 months) and Cl II:1 (3.1 ± 0.24 months).

18
Figure 5. Additional Treatment Time in Months by Respondent and Malocclusion
* Indicates significant at 0.05 level (Tukey’s adjusted)
8.7
9.4
6.6 6.7
3.4
5.2
2.2
5.4
3.1
6.25.7
7.8
6.9
8.7
0
2
4
6
8
10
12
Ort
ho
do
nti
st
Par
ent
Ort
ho
do
nti
st
Par
ent
Ort
ho
do
nti
st
Par
ent
Ort
ho
do
nti
st
Par
ent
Ort
ho
do
nti
st
Par
ent
Ort
ho
do
nti
st
Par
ent
Ort
ho
do
nti
st
Par
ent
Cl III: 3 Cl III: 2 Cl III: 1 Cl I Cl II: 1 Cl II: 2 Cl II: 3
Estimated Additional Treatment Time (Months) by Respondent
and Malocclusion
* *
* *
*

19
Table 12. All Pairwise Comparisons for Differences in Additional Treatment Time
Comparison
Difference in Additional
Treatment Months SE P-value Cl II:1 Orthodontists vs Parents -3.1 0.24 <.0001 *
Cl III:1 Orthodontists vs Parents -1.8 0.25 <.0001 *
Cl II:2 Orthodontists vs Parents -2.1 0.24 <.0001 *
Cl III:2 Orthodontists vs Parents -0.1 0.24 1 Cl II:3 Orthodontists vs Parents -1.8 0.24 <.0001 *
Cl III:3 Orthodontists vs Parents -0.8 0.24 0.0999 Cl I: Orthodontists vs Parents -3.1 0.17 <.0001 *
Orthodontists: Cl II:1 vs Cl III:1 -0.4 0.25 0.9787 Orthodontists: Cl II:1 vs Cl II:2 -2.6 0.25 <.0001 *
Orthodontists: Cl II:1 vs Cl I 0.9 0.21 0.0048 *
Orthodontists: Cl III:1 vs Cl I 1.2 0.21 <.0001 *
Orthodontists: Cl II:2 vs Cl III:2 -0.9 0.24 0.0108 *
Orthodontists: Cl II:2 vs Cl III:3 -1.2 0.24 <.0001 *
Orthodontists: Cl III:2 vs Cl III:3 -2.1 0.25 <.0001 *
Orthodontists: Cl II:3 vs Cl III:3 -1.8 0.25 <.0001 *
Parents: Cl II:1 vs Cl III:1 1.0 0.24 0.003 *
Parents: Cl II:1 vs Cl II:2 -1.6 0.24 <.0001 *
Parents: Cl II:1 vs Cl I 0.9 0.21 0.0025 *
Parents: Cl III:1 vs Cl III:2 -1.5 0.24 <.0001 *
Parents: Cl III:1 vs Cl I -0.1 0.21 1 Parents: Cl II:2 vs Cl III:2 1.1 0.24 0.0006 *
Parents: Cl II:2 vs Cl II:3 -0.9 0.24 0.0283 *
Parents: Cl III:2 vs Cl III:3 -2.7 0.24 <.0001 *
* Indicates significant at 0.05 level (Tukey’s adjusted)
Extension of Treatment Length: Patient Compliance by Respondent Type
With respect to compliance, orthodontists and parents significantly differed in the amount
of time each would continue orthodontic treatment (Figure 6). For compliant patients,
orthodontists would end treatment 1.1 ± 0.12 months earlier than parents (Table 13). For
noncompliant patients, orthodontists would end treatments 2.6 ± 0.12 months earlier than parents.
Orthodontists would extend treatment 1.6 ± 0.12 months longer for compliant patients compared
to treatment for noncompliant patients. On average, parents would continue treatment an
additional 7 months regardless of level of compliance.

20
Figure 6. Additional Treatment Time by Respondent and Compliance
* Indicates significant at 0.05 level (Tukey’s adjusted)
Table 13. Pairwise Comparison for Additional Treatment Months based on Respondent and
Compliance
Comparison
Difference
in
Additional
Treatment
Months SE P-value
Compliant: Orthodontists vs Parents -1.1 0.12 <.0001*
Noncompliant: Orthodontists vs Parents -2.6 0.12 <.0001*
Orthodontists: Noncompliant vs Compliant -1.6 0.12 <.0001*
Parents: Noncompliant vs Compliant -0.1 0.12 0.6265
* Indicates significant at 0.05 level (Tukey’s adjusted)
4.4
7.0
6.0
7.1
0
1
2
3
4
5
6
7
8
Orthodontist Parent Orthodontist Parent
Noncompliant Compliant
Estimated Additional Treatment Time (Months) by
Respondent and Patient Compliance
* *
*

21
Extension of Treatment Length: Completed Treatment Time
Significant differences were found between orthodontists’ and parents’ willingness to
extend treatment duration for outcomes at 18 months compared to outcomes at 24 months (Figure
7). Parents would extend treatment 1.9 ± 0.1 months and 1.7 ± 0.1 months longer than
orthodontists for treatment outcomes at 18 months and 24 months, respectively (Table 14). Parents
extended treatment 0.5 ± 0.1 months longer if occlusion presented was at 18 months instead of 24
months (p-value < 0.0002). Orthodontists extended treatment 0.3 ± 0.1 months for 18 month cases
compared to 24 month cases (p-value < 0.0381).
Figure 7. Additional Treatment Months Based on Months Completed and Respondent Type
* Indicates significant at 0.05 level (Tukey’s adjusted)
5.4
7.3
5.1
6.8
0.0
1.0
2.0
3.0
4.0
5.0
6.0
7.0
8.0
Orthodontist Parent Orthodontist Parent
18 mo 24 mo
Estimated Additional Treatment Time (Months)
by Respondent and Completed Treatment Time
* *

22
Table 14. Pairwise Comparison of Additional Treatment Months based on Completed Months
and Respondent Type
Comparison
Estimated Difference
in Additional
Treatment Time SE P-value
Orthodontists: 18 vs 24 Months 0.3 0.1 0.0381*
18 Months: Orthodontists vs Parents -1.9 0.1 <.0001*
24 Months: Orthodontists vs Parents -1.7 0.1 <.0001*
Parents: 18 Months vs 24 Months 0.5 0.1 0.0002*
* Indicates significant at 0.05 level (Tukey’s adjusted)
Extension of Treatment Length: Respondent Type
Orthodontists
After adjusting for time in treatment, compliance, and malocclusion strictly for
orthodontists, a number of factors including ABO certification, years in practice, and gender of
practitioner were associated with differences in estimated extensions of treatment time (Table 15).
Non-ABO certified orthodontists would extend treatment an estimated difference of 0.3 months
longer than ABO certified orthodontists. The impact of the number of years in practice differed
significantly. Orthodontists within the first 1 to 10 years of practice extended treatment the least
at 5 months, on average, and orthodontists within 21 to 30 years of practice extended treatment the
most at 5.6 months, on average (Figure 8). A significant difference was found between the
orthodontists practicing 21 to 30 years and those within the first 20 years of practice (Table 16).
Orthodontists within the first 10 years of practice also would extend treatment duration
significantly less than practitioners with 31 to 40 years of experience (p-value=0.0169).

23
Table 15. Factors Associated with Orthodontists for Extension of Treatment
Effect P-value
Time in Treatment 0.0013*
Compliance <.0001*
Malocclusion <.0001*
ABO Certified (Yes vs No) 0.003*
Years in Practice 0.0002*
Gender 0.0001*
* Indicates significant at 0.05 level (Tukey’s adjusted)
Figure 8. Additional Treatment Time for Orthodontists by Years in Practice
5.0 5.1
5.6 5.55.3
0.0
1.0
2.0
3.0
4.0
5.0
6.0
1-10 11-20 21 - 30 31 - 40 41 +
Additional Treatment Time (in Months) by Years in Practice

24
Table 16. Pairwise Comparison of Extension of Treatment Length by Years in Practice for
Orthodontists
Years in
Practice Comparison
Estimated
Difference SE P-Value
1-10 11-20 -0.1103 0.1418 0.9367
1-10 21-30 -0.6171 0.1506 0.0006 *
1-10 31-40 -0.5277 0.1687 0.0169 *
1-10 41+ -0.3193 0.2487 0.7014
11-20 21-30 -0.5068 0.1417 0.0039 *
11-20 31-40 -0.4174 0.1598 0.0716
11-20 41+ -0.209 0.2411 0.9087
21-30 31-40 0.08942 0.1671 0.9836
21-30 41+ 0.2978 0.2458 0.7449
31-40 41+ 0.2084 0.2555 0.9256
* Indicates significant at 0.05 level (Tukey’s adjusted)
Parents
After adjusting for treatment time, compliance, and malocclusion for only parents, the age
of a child was significantly associated with extension of treatment time (Table 17). Parents of
children 14 years and older would extend treatment longer than parents of 8 to 13 year olds, 7.33
months compared to 6.95 months, respectively. The number of months that their child had been
in treatment and the gender of both parents and children were not associated with extension of
treatment length.
Table 17. Factors Associated with Parents for Extension of Treatment
Effect P-value
Time in Treatment <.0001*
Compliance 0.2357
Malocclusion <.0001*
Gender: Guardian 0.3299
Age of Child 0.0136*
Gender: Child 0.0776
Child: Months Treatment Completed 0.9797
* Indicates significant at 0.05 level (Tukey’s adjusted)

25
Ideal Compared to Actual Treatment Length
In the following sections, ideal refers to the perceived amount of time a patient should be
in orthodontic treatment. Actual treatment time refers to the number of months necessary to
complete orthodontic treatment.
Both orthodontists and parents reported their perceived ideal treatment times (Table 18).
Additionally, each orthodontist was asked to self-report his/her actual average treatment time for
both extraction and non-extraction cases. Significant differences were found between
orthodontists’ treatment times for extraction cases compared to non-extraction cases for both ideal
(p-value<0.0001) and actual treatment length (p-value<0.0001) (Table 18). Parents were asked to
recall the length of treatment time their orthodontist estimated during the initial consultation,
which is henceforth defined as the orthodontist-reported treatment time. Since all parents in this
study had a child that was currently in orthodontic treatment, parents were not able to provide the
actual time needed to complete their child’s comprehensive treatment. Therefore, the parents’
orthodontist-reported treatment time was used to represent the parents’ perspective for actual
treatment length. For parents, extraction and non-extraction information were determined by
asking each parent if their child had extractions of permanent teeth as part of orthodontic treatment
(Figure 9, Figure 10).

26
Table 18. Orthodontist and Parent Response for Ideal and Actual Treatment Times
Orthodontist
P-valueα
Ideal Treatment Times
(months)
Extraction Cases:
n (%)
Non-Extraction
Cases: n (%)
<0.0001
12-15 1 (0%) 19 (8%)
16-19 20 (9%) 91 (40%)
20-23 108 (47%) 90 (39%)
24-27 95 (41%) 28 (12%)
28+ 8 (3%) 2 (1%)
Actual Treatment Times
(months)
Extraction Cases:
n (%)
Non-Extraction
Cases: n (%)
<0.0001
12-15 0 (0%) 7 (3%)
16-19 8 (3%) 74 (32%)
20-23 71 (31%) 105 (46%)
24-27 136 (59%) 42 (18%)
28+ 17 (7%) 2 (1%)
Parents
Ideal Treatment Time
(months)
Extraction Cases:
n (%)
Non-Extraction
Cases: n (%)
0.0542
12-15 4 (7%) 18 (10%)
16-19 5 (9%) 42 (24%)
20-23 15 (26%) 47 (27%)
24-27 29 (51%) 60 (34%)
28+ 4 (7%) 7 (4%)
Orthodontist-Reported
Treatment Time (months)
Extraction Cases:
n (%)
Non-Extraction
Cases: n (%)
0.0618
12-15 2 (4%) 24 (14%)
16-19 10 (18%) 45 (25%)
20-23 9 (16%) 33 (19%)
24-27 29 (52%) 65 (37%)
28+ 6 (11%) 10 (6%) αChi-squared test for differences between extraction and non-extraction cases

27
Figure 9. Ideal and Actual Treatment Times for Extraction Cases
Figure 10. Ideal and Actual Treatment Times for Non-Extraction Cases
0%
9%
47%41%
3%0% 3%
31%
59%
7%7% 9%
26%
51%
7%4%
18% 16%
52%
11%
0%
10%
20%
30%
40%
50%
60%
70%
80%
90%
100%
12-15 Months 16-19 20-23 24-27 28+
Extraction Cases: Anticipated and Reported Treatment Times
Orthodontists: Ideal Orthodontists: Actual Parents: Ideal Parents: Ortho Reported
8%
40% 39%
12%
1%3%
32%
46%
18%
1%
10%
24% 27%34%
4%
14%
25%19%
37%
6%
0%
10%
20%
30%
40%
50%
60%
70%
80%
90%
100%
12-15 Months 16-19 20-23 24-27 28+
Non-Extraction Cases: Ideal and Actual Treatment Times
Orthodontists: Ideal Orthodontists: Actual Parents: Ideal Parents: Ortho Reported

28
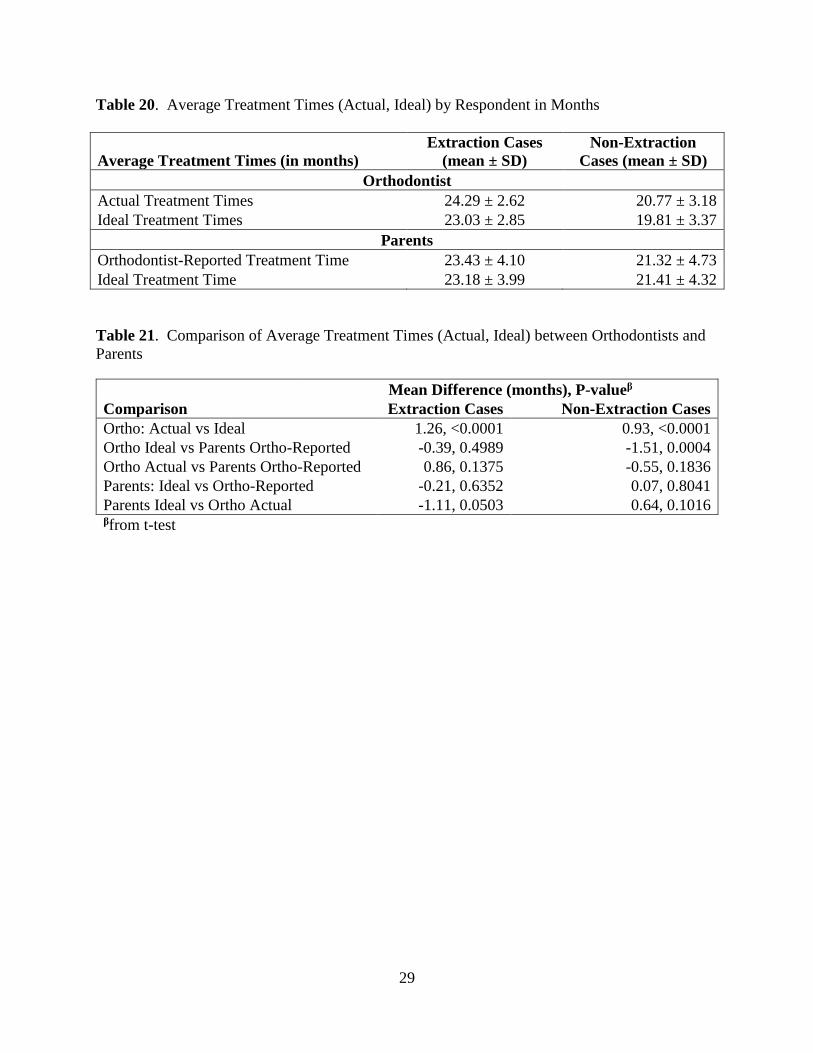
Orthodontists reported significantly longer actual treatment times than what they believed
was the ideal treatment duration for both extraction and non-extraction cases (Table 19). The
average difference was 1.26 months for extraction cases (p-value<0.0001) and 0.93 months for
non-extraction (p-value<0.0001) (Table 20, Table 21).
There were also significant differences between what the parents reported their orthodontist
stated compared to both the orthodontists’ ideal and actual times (p-value<0.0001). In general,
the parents’ orthodontist-reported treatment times were longer than the treatment times that the
orthodontists stated (Table 21). The only exception was for extraction cases; orthodontists stated
actual treatment times 0.86 months longer than the parents’ orthodontist-reported times, though
the difference was not statistically significant (p-value=0.1375). Orthodontists’ ideal treatment
for non-extraction was significantly shorter by 1.51 months than parents’ orthodontist-reported
treatment times (p-value=0.0004).
The difference between parents’ perception of ideal treatment length and the time initially
stated by their child’s orthodontist (orthodontist-reported treatment time) was not significant for
either extraction or non-extraction cases (p-value=0.3764 and p-value=0.3907, respectively).
Table 19. Comparison of Orthodontists and Parents Perception of Ideal and Actual Reported
Treatment Times
Comparison P-valueα
Extraction Cases Non-Extraction Cases
Ortho: Actual vs Ideal <0.0001 0.024
Ortho Ideal vs Parents Ortho-Reported <0.0001 <0.0001
Ortho Actual vs Parents Ortho-Reported <0.0001 <0.0001
Parents: Ideal vs Ortho-Reported 0.3764 0.3907
Parents Ideal vs Ortho Actual 0.0005 <0.0001 αfrom Chi-Squared test
29
Table 20. Average Treatment Times (Actual, Ideal) by Respondent in Months
Average Treatment Times (in months)
Extraction Cases
(mean ± SD)
Non-Extraction
Cases (mean ± SD)
Orthodontist
Actual Treatment Times 24.29 ± 2.62 20.77 ± 3.18
Ideal Treatment Times 23.03 ± 2.85 19.81 ± 3.37
Parents
Orthodontist-Reported Treatment Time 23.43 ± 4.10 21.32 ± 4.73
Ideal Treatment Time 23.18 ± 3.99 21.41 ± 4.32
Table 21. Comparison of Average Treatment Times (Actual, Ideal) between Orthodontists and
Parents
Mean Difference (months), P-valueβ
Comparison Extraction Cases Non-Extraction Cases
Ortho: Actual vs Ideal 1.26, <0.0001 0.93, <0.0001
Ortho Ideal vs Parents Ortho-Reported -0.39, 0.4989 -1.51, 0.0004
Ortho Actual vs Parents Ortho-Reported 0.86, 0.1375 -0.55, 0.1836
Parents: Ideal vs Ortho-Reported -0.21, 0.6352 0.07, 0.8041
Parents Ideal vs Ortho Actual -1.11, 0.0503 0.64, 0.1016 βfrom t-test

30
DISCUSSION
Demographics
The study consisted of parallel surveys that investigated orthodontists’ and parents’
perception of occlusion in the AP dimension. The 23% response rate for orthodontists and 32%
response rate for parents was similar to response rates for mailed surveys to dentists and
orthodontists in recent studies.35, 36 Hardigan et al. found response rates were highest among
dentists at 26% if surveys were mailed.35 Best et al. reported similar response rates of 37% for
orthodontists and 23% for general dentists.36 The percentages of orthodontist respondents that
were male (78%) and female (22%) were similar to the reported percentages of 73% male and 27%
female from the 2016 membership of the American Association of Orthodontists.37 Kleim et al.
reported a distribution of 81% male and 19% female orthodontists.38 Additionally, Kleim et al.
found the median years of practice was 22, which corroborate the response characteristic of this
study regarding 79% of respondents have practiced less than 30 years.
For parents, the distribution of sex and age was comparable to that of the parents included
in a previous survey by Uribe et al.8 The larger proportion of females that completed the survey
indicates mothers are more likely to wait in the office during their child’s orthodontic appointment,
as surveys were administered to parents in-office.
Class I Occlusion
Angle first introduced the classification system for occlusal relationships.39 Andrews
added that while ideal occlusion involves more than the first molar relationship, the first key
presented in his classic paper of a normal, ideal occlusion was Class I molar relationship.40

31
Without the presence of a tooth-size discrepancy, establishing Class I occlusion with proper
alignment within both dental arches will also idealize the overbite and overjet. Both orthodontists
and parents rated Class I with the highest rated VAS score, indicating a strong preference for
orthodontic treatment finishing in ideal Class I occlusion.
The advantages of Class I occlusion have been discussed in the literature. English et al.
demonstrated the benefit of Class I occlusion for providing more effective masticatory function
compared to Class II and Class III occlusions in the ability to break down food particles.41
However, little evidence beyond masticatory function supports a clear health advantage of a Class
I occlusion over Class II and Class III occlusions. Turp et al. found no correlation between
temporomandibular disorders to type of occlusion.42 Additionally, Geiger reported no difference
in periodontal disease for different Angle Classifications.43
The findings of the current study suggest another benefit of Class I occlusion is that both
orthodontists and parents view Class I as the most acceptable treatment outcome, which may also
represent an esthetic preference. Previous studies have indicated that esthetics is one of the main
motivations for both patients and parents to seek orthodontic treatment.12, 15, 44-46 Daniels et al.
found that both patients (93.4%) and parents (91.6%) ranked esthetics as the primary reason for
pursuing orthodontic treatment.15 Prabakaran et al. identified esthetics as the most important factor
for patients and the second most important factor for parents to seek orthodontic treatment.44 Since
esthetic improvements motivate parents and patients to seek orthodontic treatment, attainment of
an ideal Class I occlusion provides the most esthetic outcome and may best address the patient’s
or parent’s chief concerns.

32
Respondent Type
Orthodontist
The number of ABO certified respondents (38%) was roughly equal to the national
average. ABO certification did not produce a difference in scoring treatment outcomes, indicating
board certification status does not influence orthodontists’ rating of acceptability of treatment
outcomes. Since all orthodontist must attend a graduate residency program, the lack of difference
between certified and non-certified orthodontist is likely because all graduate programs educate
orthodontists to have the highest standards. While no difference was seen between certified and
non-certified orthodontists, the authors recognize the positive value of board certification, which
includes the commitment to achieving the highest level of personal accomplishment within the
specialty.
The only significant differences between orthodontists were sex and the number of years
in practice. Since the proportion of female respondents was lower than males, the difference in
VAS scores may be a result of a smaller sample size, as the standard error for average VAS scores
for females was close to double that of males (0.81 and 0.44, respectively). However, the larger
variation with female orthodontists was also seen in a study by Parekh et al. that found female
orthodontists utilized more of the scale when rating on a VAS.47 Possibly, the female orthodontists
were more discerning when they completed a VAS, or male orthodontists on average were more
consistent in scoring a VAS. Regardless, the fact a statistical difference was found between male
and female orthodontists despite females having a larger variation likely represented a true
difference. Regarding the intervals for years in practice, once adjusted for multiple comparisons,
no statistical difference was seen in the number of years an orthodontist has practiced.

33
Orthodontists were able to statistically differentiate each of the occlusal variations with a
trend toward scoring Class II occlusions more favorably than Class III occlusions. Since the
prevalence of Class II malocclusions are around 50% of the U.S. population compared to around
5% for Class III malocclusions, orthodontists treat more Class II malocclusions.48 The greater
frequency of treatment for Class II malocclusions may explain why orthodontists scored Class II
malocclusions more acceptable than Class III malocclusions. With more familiarity in treating
Class II malocclusions, orthodontists may have greater confidence in correcting this malocclusion,
which led to overall higher VAS scores. In conjunction to the molar/canine classification, the
overjet may have influenced how orthodontists rated Class II and Class III malocclusions. The
slightly increased overjet in Cl II:2 and Cl II:3 was scored more acceptable than the end-to-end
anterior bite represented by Cl III:2 and the anterior crossbite in Cl III:3.
Parents
Parents did not statistically differentiate between Cl I and Cl III:1, indicating that parents
may not see a difference between these two malocclusions. The inability for a layperson to notice
a 1 mm difference has been documented in previous studies.11, 13 Kokich et al. found that laypeople
did not reach a threshold for finding symmetric alterations of maxillary anterior teeth unesthetic
until there was a 2 mm discrepancy.13 For unilateral crown length asymmetries, Kokich et al.
found the threshold was 1.5 mm for laypeople.11 However, in the current study parents were able
to notice 1 mm changes in the AP dimension for all other occlusal relationships presented. While
parents were able to notice 1 mm changes, the range of VAS scores was greater for the
orthodontists (range = 25.9 to 93.9) compared to the parents (range = 40.9 to 80.7).

34
Compared to orthodontists, parents rated Cl III:2 more acceptable than Cl II:2. While the
absolute value of the 2 mm deviation from Cl I was the same, parents responded differently
depending if the deviation was anterior or posterior. One explanation is that parents may have
noticed the overjet relationship. These results, along with the fact parents did not differentiate
between Cl I and Cl III:1, suggest that parents viewed less overjet as more esthetic. However, Cl
III:3 was found to be the least acceptable treatment outcome. Likely, the presence of an anterior
crossbite accounted for the lowest VAS scores. Another possible reason Class III occlusions
trended more acceptable than Class II occlusions is that parents may think an ideal bite involves
the anterior teeth occluding edge to edge.
Compliance
For the purpose of this study compliance referred to patients who attended orthodontic
appointments on time, had great oral hygiene, did not break brackets, and followed the
orthodontist’s instructions regarding foods to avoid and wearing elastics. Parents and orthodontists
found noncompliant patients’ treatment outcomes more acceptable than treatment outcomes with
adequate patient compliance. Both orthodontists and parents may have rated noncompliant
treatment outcomes less objectively and more acceptable because the outcomes described were
achieved without adequate patient compliance. In other words, the outcomes from compliant
patients may have been scored more stringently.
Riedman et al. found similar results when objective orthodontists’ assessments were
compared to the subjective rating by patients. Results revealed discrepancies in assessments, with
the patients’ ratings of outcomes more positive than the orthodontists’ ratings. Furthermore, when

35
comparing a group of ideal treatment to a group of compromised treatment, a high level of patient
satisfaction was attained with a shorter treatment duration and with less orthodontic appliances in
the compromised group.14
Treatment Length: 18 month versus 24 month
While 18 and 24 months may be frequently considered as average duration for treatment,
these time points are not supported in the literature.1-5 Thus, the selection of 18 months and 24
months arbitrarily represented two time points that are commonly discussed as expected treatment
lengths. The orthodontists’ ideal treatment times were remarkably close at 19.81 months for non-
extraction cases and 23.03 months for extraction.
If the percentage of orthodontic cases involving extractions decreases, it is possible that
overall treatment duration may decrease. Proffit analyzed the rate of extractions at the University
of North Carolina from the 1950s to the 1990s, finding a cyclical pattern in the frequency of
extractions with the rate of extractions around 30% in 1953 and 1993.49 More recently, Jackson
et al. looked at extraction rates for the first decade of the 21st century at the University of North
Carolina and found extraction rates decreased from 37.4% in 2000 to 22.9% in 2011.50 According
to the 2014 report by Keim et al., the frequency of extractions cases in private practice has steadily
decreased from 35% of cases in 1986 to 15% of cases in 2014.38 However, while extraction rates
have decreased, this does not necessarily equate to decreased treatment lengths. For instance,
treatment duration could actually increase if an orthodontist is committed to treating with non-
extraction therapy when a patient has severe crowding, large overjet, anterior open bite, or a
skeletal discrepancy.

36
Analyzing treatment length by respondent type and case acceptability, there was a
statistical significant difference between orthodontists and parents’ perception of treatment
outcomes after 18 months of treatment. Yet, the statistical significance was not clinically relevant
due to the small VAS difference of three points on a 100 point scale.
Extension of Treatment
Overall parents were willing to extend treatment longer than orthodontists. This may be
due to the lack of knowledge by parents to the potential harm that may develop when braces are
left on too long (root resorption, white spot lesions, and periodontal issues). Another potential
reason for parents’ willingness to extend treatment is that parents do not have the same level of
knowledge regarding biology of tooth movement and biomechanics compared to orthodontists.
Additionally, parents are normally the financially responsible party for orthodontic treatment.
Since there is a monetary investment by the parents, they may be willing to extend treatment to
achieve a more ideal result. Regardless of the reason why parents are willing to extend orthodontic
treatment longer than orthodontists, orthodontists should utilize their expertise to inform parents
and patients when the risks of continuing orthodontic treatment outweighs the benefits.
The results of this study may help clinicians predict the amount of time parents will prolong
treatment to achieve a more ideal treatment outcome. Often ideal Class I classification at the
canines and molars is a goal of orthodontic treatment. During the detailing and finishing phase of
treatment, achieving the perfect, socked-in classification can be challenging. The difficulty of
achieving ideal Class I occlusion is further complicated in cases where patients are burned out
from treatment and are noncompliant with elastic wear. Regardless of the level of patient

37
compliance, parents are willing to extend treatment for an additional 7 months, while orthodontists
will extend treatment 4.4 months for noncompliant patients up to 6 months for compliant patients.
The difference in orthodontists’ extension of treatment between noncompliant and compliant
patients demonstrates orthodontists are more willing to terminate treatment with poor compliance.
Additionally, regardless of AP discrepancy, parents would extend treatment 2 months
longer than orthodontists. When the AP discrepancy is within 1 mm from ideal, parents would
extend treatment 5-6 months to achieve ideal Class I occlusion, which on average is 2-3 months
longer than orthodontists. In the absence of any factors that may cause deleterious effects to the
patient, orthodontists may want to consider extending treatment for an additional 2-3 months
longer than they normally would, if needed to achieve a more ideal treatment outcome, as parents
did not want to compromise treatment outcomes and were not concerned with prolonged treatment
durations.
Cl III:3 was viewed as the malocclusion that both orthodontists and parents were willing
to extend treatment the longest (8.7 months and 9.4 months, respectively). Since this malocclusion
was also rated the least acceptable malocclusion, both parents and orthodontists may have
recognized the difficulty of correcting a 3 mm AP discrepancy with an anterior crossbite.
Interestingly, orthodontists were willing to spend 1.8 more months correcting Cl III:3 than Cl II:3
despite both malocclusions having a 3 mm AP discrepancy. Again, this may be a result of a greater
prevalence of Class II malocclusions leading to greater confidence by the orthodontist to
predictably correct Class II relationships. Alternatively, the anterior crossbite present with the Cl
III:3 malocclusion may account for the increase in treatment duration. Alleviating an anterior
crossbite may involve treatment mechanics to temporarily disarticulate the bite, and therefore take
more time to correct.

38
When comparing 18 months of treatment versus 24 months of treatment, significant
differences were found between orthodontists and parents at both time points, between the parents’
responses at both time points, and between the orthodontists’ responses at both time points (Table
14). However, the orthodontists’ assessment at 18 months compared to the orthodontists’
assessment at 24 months only differed by an estimated difference of 0.3 months, which is not
clinically relevant. The difference between the parents’ responses at 18 months and 24 months
was only 0.5 months, which is not clinically relevant.
The significant differences found among orthodontists’ willingness to extend treatment are
not clinically relevant. The 0.3 months difference between ABO and non-ABO certified
orthodontists and 0.6 months difference seen between orthodontists in the first 10 years of practice
and orthodontists practicing 21 to 30 years are clinically negligible.
Expected vs Actual Treatment Times
Orthodontists slightly underestimated their ideal treatment time compared to their actual
treatment time, with mean differences of 1.26 months for extraction cases and 0.93 months for
non-extraction cases. While the orthodontists predicted slightly shorter treatment times than are
realized, the statistical difference has little clinical relevance.
Parents stated the ideal treatment time to be 21.41 months for non-extraction cases and
23.18 months for extraction cases. Uribe et al. surveyed 200 parents who believed treatment
should last more than 24 months; however, 94% of the parents wished for treatment to last less
than 24 months.8 Parents’ expectation regarding treatment length was consistent with what parents
recalled their orthodontist initially estimating for treatment length. Two possibilities exist to

39
explain the high level of consistency. One, parents listen during the consultation with the
orthodontist and believe the amount of time the orthodontist states is accurate. Or, parents that
completed orthodontic treatment during their adolescence may relate the time needed to complete
their orthodontic treatment as a reference for the ideal treatment length. In other words, the
parents’ past experience completing orthodontic treatment may influence their current perception
of treatment time. Fink and Smith found the average length of treatment in 1992 was 23.1 months.1
Alger reported an average treatment length of 22.0 months in 1988.51 With 56% of the parents
younger than 45 years old, it is likely that if they completed orthodontic treatment as an adolescent,
their orthodontic treatment would have been completed during the late 1980s or early 1990s and
likely fallen in the range of treatment duration listed above.
Limitations
The study design introduces several potential biases, including: nonrespondent bias, recall
bias, obsequiousness bias, and attention bias. The design of using digital models may have
decreased the potential of introducing factors associated with the shades of teeth and gingiva.
However, while orthodontists are accustomed to viewing study casts, parents may have had
difficulty analyzing the digital images. The significant differences found with little clinical
relevance are likely due to large sample size and small variability in answers.

40
CONCLUSIONS
Orthodontists and parents view orthodontic treatment outcomes in the AP dimension
differently.
Class I occlusion is rated as the most acceptable outcome by both orthodontist and parents.
Orthodontists and parents do not differ in acceptance of treatment outcomes when
comparing the same result at 18 months versus 24 months.
Parents are willing to extend treatment duration longer than orthodontists.

41
REFERENCES
42
REFERENCES
1. Fink DF, Smith RJ. The duration of orthodontic treatment. Am J Orthod Dentofacial Orthop.
1992;102:45-51.
2. Beckwith FR, Ackerman RJ, Cobb CM, Tira DE. An evaluation of factors affecting duration of
orthodontic treatment. Am J Orthod Dentofacial Orthop.1999;115:439-447.
3. Skidmore KJ, Brook KJ, Thomson WM, Harding WJ. Factors influencing treatment time in
orthodontic patients. Am J Orthod Dentofacial Orthop. 2006;129:230-238.
4. Vig KWL, Firestone A, Wood W, Lenk M. Quality of Orthodontic Treatment. Semin Orthod.
2007;13:81-87.
5. Wenger R, Douangpanya S, Vig K, Beck M, Vig P. Classes I, II and III differences in severity,
duration and orthodontic results [abstract]. J Dent Res. 1996;75:437.
6. Eliades T. Orthodontic materials research and applications: part 2. Current status and projected
future developments in materials and biocompatibility. Am J Orthod Dentofacial Orthop.
2007;131:253-262.
7. Long H, Pyakurel U, Wang Y, Liao L, Zhou Y, Lai W. Interventions for accelerating orthodontic
tooth movement: a systematic review. Angle Orthod. 2012;83:164-171.
8. Uribe F, Padala S, Allareddy V, Nanda R. Patients', parents', and orthodontists' perceptions of
the need for and costs of additional procedures to reduce treatment time. Am J Orthod Dentofacial
Orthop. 2014;145:S65-S73.

43
9. Dibart S, Keser EI. Piezocision™: Minimally invasive periodontally accelerated orthodontic
tooth movement procedure. Orthodontically Driven Corticotomy: Tissue Engineering to Enhance
Orthodontic and Multidisciplinary Treatment. 2014:119.
10. Petrone J, Fishell J, Berk NW, Kapur R, Sciote J, Weyant RJ. Relationship of malocclusion
severity and treatment fee to consumer’s expectation of treatment outcome. Am J Orthod
Dentofacial Orthop. 2003;124:41-45.
11. Kokich VO, Kokich VG, Kiyak HA. Perceptions of dental professionals and laypersons to
altered dental esthetics: asymmetric and symmetric situations. Am J Orthod Dentofacial Orthop.
2006;130:141-151.
12. Pabari S, Moles DR, Cunningham SJ. Assessment of motivation and psychological
characteristics of adult orthodontic patients. Am J Orthod Dentofacial Orthop. 2011;140:e263-
e272.
13. Kokich VO, Kiyak HA, Shapiro PA. Comparing the perception of dentists and lay people to
altered dental esthetics. J Esthet Restor Dent. 1999;11:311-324.
14. Riedmann T, Georg T, Berg R. Adult patients' view of orthodontic treatment outcome
compared to professional assessments. J Orofac Orthop. 1999;60:308-320.
15. Daniels AS, Seacat JD, Inglehart MR. Orthodontic treatment motivation and cooperation: a
cross-sectional analysis of adolescent patients' and parents' responses. Am J Orthod Dentofacial
Orthop. 2009;136:780-787.

44
16. Mehra T, Nanda RS, Sinha PK. Orthodontists' assessment and management of patient
compliance. Angle Orthod. 1998;68:115-122.
17. Geiger AM, Gorelick L, Gwinnett AJ, Benson BJ. Reducing white spot lesions in orthodontic
populations with fluoride rinsing. Am J Orthod Dentofacial Orthop. 1992;101:403-407.
18. Bishara SE, Ostby AW. White spot lesions: formation, prevention, and treatment. Semin
Orthod. 2008;14:174-182.
19. Levander E, Malmgren O. Evaluation of the risk of root resorption during orthodontic
treatment: a study of upper incisors. Eur J Orthod. 1988;10:30-38.
20. Linge L, Linge BO. Patient characteristics and treatment variables associated with apical root
resorption during orthodontic treatment. Am J Orthod Dentofacial Orthop. 1991;99:35-43.
21. Ong MM, Wang H. Periodontic and orthodontic treatment in adults. Am J Orthod Dentofacial
Orthop. 2002;122:420-428.
22. Cardaropoli D, Gaveglio L. The influence of orthodontic movement on periodontal tissues
level. Semin Orthod. 2007;13:234-245.
23. McKeta N, Rinchuse DJ, Close JM. Practitioner and patient perceptions of orthodontic
treatment: is the patient always right? J Esthet Restor Dent. 2012;24:40-50.
24. Reichmuth M, Greene KA, Orsini MG, Cisneros GJ, King GJ, Kiyak HA. Occlusal perceptions
of children seeking orthodontic treatment: impact of ethnicity and socioeconomic status. Am J
Orthod Dentofacial Orthop. 2005;128:575-582.
45
25. Kiyak HA. Comparison of esthetic values among Caucasians and Pacific‐Asians. Community
Dent Oral Epidemiol. 1981;9:219-223.
26. Machado AW, Moon W, Gandini LG. Influence of maxillary incisor edge asymmetries on the
perception of smile esthetics among orthodontists and laypersons. Am J Orthod Dentofacial
Orthop. 2013;143:658-664.
27. Beyer JW, Lindauer SJ. Evaluation of dental midline position. Semin Orthod. 1998;4:146-152.
28. Abu Arqoub SH, Al-Khateeb SN. Perception of facial profile attractiveness of different antero-
posterior and vertical proportions. Eur J Orthod. 2011;33:103-111.
29. Orsini MG, Huang GJ, Kiyak HA, et al. Methods to evaluate profile preferences for the
anteroposterior position of the mandible. Am J Orthod Dentofacial Orthop. 2006;130:283-291.
30. Tin-Oo MM, Saddki N, Hassan N. Factors influencing patient satisfaction with dental
appearance and treatments they desire to improve aesthetics. BMC oral health. 2011;11:1.
31. Cotrim ER, Vasconcelos Júnior ÁV, Haddad, Ana Cristina Soares Santos, Reis SAB.
Perception of adults' smile esthetics among orthodontists, clinicians and laypeople. Dental Press
J Orthod. 2015;20:40-44.
32. Dragstrem K, Galang-Boquiren MTS, Obrez A, Viana MGC, Grubb JE, Kusnoto B. Accuracy
of digital American Board of Orthodontics Discrepancy Index measurements. Am J Orthod
Dentofacial Orthop. 2015;148:60-66.

46
33. Bootvong K, Liu Z, McGrath C, et al. Virtual model analysis as an alternative approach to
plaster model analysis: reliability and validity. Eur J Orthod. 2010;32:589-595.
34. Harris PA, Taylor R, Thielke R, Payne J, Gonzalez N, Conde JG. Research electronic data
capture (REDCap)—a metadata-driven methodology and workflow process for providing
translational research informatics support. J Biomed Inform. 2009;42:377-381.
35. Hardigan PC, Succar CT, Fleisher JM. An analysis of response rate and economic costs
between mail and web-based surveys among practicing dentists: a randomized trial. J Community
Health. 2012;37:383-394.
36. Best AD, Shroff B, Carrico CK, Lindauer SJ. Treatment management between orthodontists
and general practitioners performing clear aligner therapy. Angle Orthod. 2016.
37. American Association of Orthodontists. AAO Membership by the numbers. Available at:
https://www.aaoinfo.org/education/data-and-research. Accessed February 9, 206.
38. Keim RG, Gottlieb EL, Vogels DS,3rd, Vogels PB. 2014 JCO study of orthodontic diagnosis
and treatment procedures, Part 1: results and trends. J Clin Orthod. 2014;48:607-630.
39. Angle EH. Treatment of Malocclusion of the Teeth: Angle's System. White Dental
Manufacturing Company; 1907.
40. Andrews LF. The six keys to normal occlusion. Am J Orthod. 1972;62:296-309.
41. English JD, Buschang PH, Throckmorton GS. Does Malocclusion Affect Masticatory
Performance? Angle Orthod. 2002;72:21-27.
47
42. Türp J, Greene C, Strub J. Dental occlusion: a critical reflection on past, present and future
concepts. J Oral Rehabil. 2008;35:446-453.
43. Geiger AM. Malocclusion as an etiologic factor in periodontal disease: a retrospective essay.
Am J Orthod Dentofacial Orthop. 2001;120:112-115.
44. Prabakaran R, Seymour S, Moles DR, Cunningham SJ. Motivation for orthodontic treatment
investigated with Q-methodology: patients’ and parents’ perspectives. Am J Orthod Dentofacial
Orthop. 2012;142:213-220.
45. McKiernan EX, McKiernan F, Jones ML. Psychological profiles and motives of adults seeking
orthodontic treatment. Int J Adult Orthodon Orthognath Surg. 1992;7:187-198.
46. Lin F, Ren M, Yao L, He Y, Guo J, Ye Q. Psychosocial impact of dental esthetics regulates
motivation to seek orthodontic treatment. Am J Orthod Dentofacial Orthop. 2016;150:476-482.
47. Parekh SM, Fields HW, Beck M, Rosenstiel S. Attractiveness of variations in the smile arc and
buccal corridor space as judged by orthodontists and laymen. Angle Orthod. 2006;76:557-563.
48. Proffit WR, Fields HW,Jr, Moray LJ. Prevalence of malocclusion and orthodontic treatment
need in the United States: estimates from the NHANES III survey. Int J Adult Orthodon
Orthognath Surg. 1998;13:97-106.
49. Proffit WR. Forty-year review of extraction frequencies at a university orthodontic clinic.
Angle Orthod. 1994;64:407-414.
48
50. Jackson TH, Guez C, Lin F, Proffit WR, Ko C. Extraction frequencies at a university
orthodontic clinic in the 21st century: Demographic and diagnostic factors affecting the likelihood
of extraction. Am J Orthod Dentofacial Orthop. 2017;151:456-462.
51. Alger D. Appointment frequency versus treatment time. Am J Orthod Dentofacial Orthop.
1988;94:436-439.

49
APPENDICES
Appendix 1. Survey to Orthodontists - Version A
You are invited to participate in a research study investigating the acceptability of orthodontic
treatment outcomes. All responses are anonymous and no personal identifiers will be collected.
You may stop taking the questionnaire at any point and withdraw from the study. The survey
should take 5 – 10 minutes to complete. If you elect to participate, please read and follow the
instructions below. Thank you for your participation.
Instructions:
The following survey contains 8 sets of images. Each set contains 3 views (right, center, left) of
digital models from an orthodontic patient. For each set of images, please imagine that this is a
patient that you are treating. Depending on the image, the patient has been in active treatment for
either 18 or 24 months.
You will be asked to evaluate each image as the treatment outcome for a compliant patient and a
noncompliant patient. For the purpose of this study, compliance refers to patients who: attend
orthodontic appointments on time, have great oral hygiene, do not break brackets, and follow the
orthodontist’s instructions regarding foods to avoid and wearing elastics.
Please mark on the lines below each image indicating how acceptable you rate the present result.
Once you have marked the line, please immediately answer the question directly below the scale
and proceed to the next set of images/questions. After you have evaluated all images, please
answer all of the remaining questions to the best of your ability.
Once you have completed the survey, please place the survey packet in the return envelope
provided.
If you have any further questions, you may contact the research team at:
VCU Office of Research
Subjects Protection
Bhavna Shroff, D.D.S., M.D.Sc.
Department of Orthodontics
David Lindsey, D.D.S.
Department of Orthodontics
800 East Leigh Street,
Suite 3000
VCU School of Dentistry
520 N. 12th St.
VCU School of Dentistry
520 N. 12th St.
BioTech One Building
Box 980568
Richmond, VA 23298
Richmond, VA 23298
(804) 828-9326
Richmond, VA 23298
(804) 828-0843

50
1. The models shown below represent a patient that has been in treatment for 24 months.
I. Please indicate on the scale below how acceptable you find the above treatment
outcome for a compliant patient after 24 months of treatment.
Least Acceptable 0 100 Most Acceptable
A) How many additional months would you be willing to continue orthodontic treatment
to achieve ideal results in a compliant patient?
0-3 months 4-7 months 8-11 months 12+ months
II. Please indicate on the scale below how acceptable you find the above treatment
outcome for a noncompliant patient after 24 months of treatment.
Least Acceptable 0 100 Most Acceptable
B) How many additional months would you be willing to continue orthodontic treatment
to achieve ideal results in a noncompliant patient?
0-3 months 4-7 months 8-11 months 12+ months
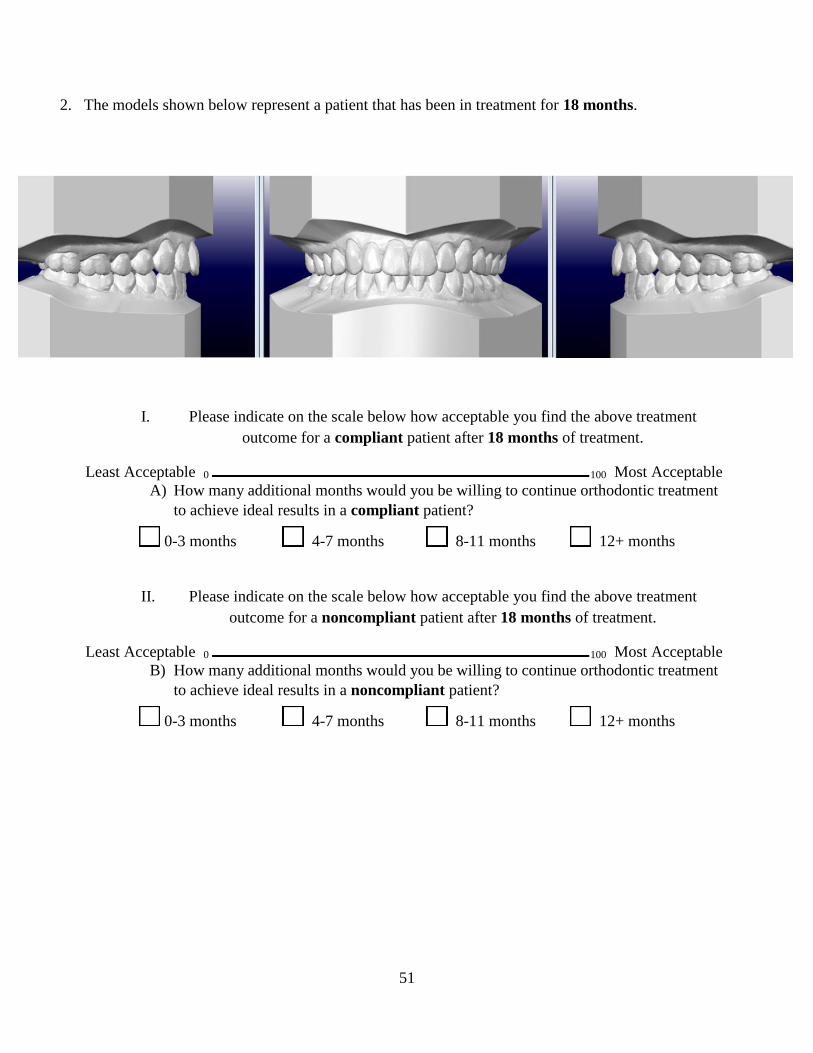
51
2. The models shown below represent a patient that has been in treatment for 18 months.
I. Please indicate on the scale below how acceptable you find the above treatment
outcome for a compliant patient after 18 months of treatment.
Least Acceptable 0 100 Most Acceptable
A) How many additional months would you be willing to continue orthodontic treatment
to achieve ideal results in a compliant patient?
0-3 months 4-7 months 8-11 months 12+ months
II. Please indicate on the scale below how acceptable you find the above treatment
outcome for a noncompliant patient after 18 months of treatment.
Least Acceptable 0 100 Most Acceptable
B) How many additional months would you be willing to continue orthodontic treatment
to achieve ideal results in a noncompliant patient?
0-3 months 4-7 months 8-11 months 12+ months

52
3. The models shown below represent a patient that has been in treatment for 18 months.
I. Please indicate on the scale below how acceptable you find the above treatment
outcome for a compliant patient after 18 months of treatment.
Least Acceptable 0 100 Most Acceptable
A) How many additional months would you be willing to continue orthodontic treatment
to achieve ideal results in a compliant patient?
0-3 months 4-7 months 8-11 months 12+ months
II. Please indicate on the scale below how acceptable you find the above treatment
outcome for a noncompliant patient after 18 months of treatment.
Least Acceptable 0 100 Most Acceptable
B) How many additional months would you be willing to continue orthodontic treatment
to achieve ideal results in a noncompliant patient?
0-3 months 4-7 months 8-11 months 12+ months

53
4. The models shown below represent a patient that has been in treatment for 18 months.
I. Please indicate on the scale below how acceptable you find the above treatment
outcome for a compliant patient after 18 months of treatment.
Least Acceptable 0 100 Most Acceptable
A) How many additional months would you be willing to continue orthodontic treatment
to achieve ideal results in a compliant patient?
0-3 months 4-7 months 8-11 months 12+ months
II. Please indicate on the scale below how acceptable you find the above treatment
outcome for a noncompliant patient after 18 months of treatment.
Least Acceptable 0 100 Most Acceptable
B) How many additional months would you be willing to continue orthodontic treatment
to achieve ideal results in a noncompliant patient?
0-3 months 4-7 months 8-11 months 12+ months

54
5. The models shown below represent a patient that has been in treatment for 18 months.
I. Please indicate on the scale below how acceptable you find the above treatment
outcome for a compliant patient after 18 months of treatment.
Least Acceptable 0 100 Most Acceptable
A) How many additional months would you be willing to continue orthodontic treatment
to achieve ideal results in a compliant patient?
0-3 months 4-7 months 8-11 months 12+ months
II. Please indicate on the scale below how acceptable you find the above treatment
outcome for a noncompliant patient after 18 months of treatment.
Least Acceptable 0 100 Most Acceptable
B) How many additional months would you be willing to continue orthodontic treatment
to achieve ideal results in a noncompliant patient?
0-3 months 4-7 months 8-11 months 12+ months

55
6. The models shown below represent a patient that has been in treatment for 24 months.
I. Please indicate on the scale below how acceptable you find the above treatment
outcome for a compliant patient after 24 months of treatment.
Least Acceptable 0 100 Most Acceptable
A) How many additional months would you be willing to continue orthodontic treatment
to achieve ideal results in a compliant patient?
0-3 months 4-7 months 8-11 months 12+ months
II. Please indicate on the scale below how acceptable you find the above treatment
outcome for a noncompliant patient after 24 months of treatment.
Least Acceptable 0 100 Most Acceptable
B) How many additional months would you be willing to continue orthodontic treatment
to achieve ideal results in a noncompliant patient?
0-3 months 4-7 months 8-11 months 12+ months

56
7. The models shown below represent a patient that has been in treatment for 24 months.
I. Please indicate on the scale below how acceptable you find the above treatment
outcome for a compliant patient after 24 months of treatment.
Least Acceptable 0 100 Most Acceptable
A) How many additional months would you be willing to continue orthodontic treatment
to achieve ideal results in a compliant patient?
0-3 months 4-7 months 8-11 months 12+ months
II. Please indicate on the scale below how acceptable you find the above treatment
outcome for a noncompliant patient after 24 months of treatment.
Least Acceptable 0 100 Most Acceptable
B) How many additional months would you be willing to continue orthodontic treatment
to achieve ideal results in a noncompliant patient?
0-3 months 4-7 months 8-11 months 12+ months

57
8. The models shown below represent a patient that has been in treatment for 24 months.
I. Please indicate on the scale below how acceptable you find the above treatment
outcome for a compliant patient after 24 months of treatment.
Least Acceptable 0 100 Most Acceptable
A) How many additional months would you be willing to continue orthodontic treatment
to achieve ideal results in a compliant patient?
0-3 months 4-7 months 8-11 months 12+ months
II. Please indicate on the scale below how acceptable you find the above treatment
outcome for a noncompliant patient after 24 months of treatment.
Least Acceptable 0 100 Most Acceptable
B) How many additional months would you be willing to continue orthodontic treatment
to achieve ideal results in a noncompliant patient?
0-3 months 4-7 months 8-11 months 12+ months

58
Please answer the following questions.
1) How old are you?
25 – 34 yo 35 – 44 yo 45 – 54 yo 55 – 64 yo 65+ yo
2) Please check the box with your gender:
Male Female
3) Are you currently ABO certified?
Yes No
4) How many years have you practiced orthodontics?
1 – 10 11 – 20 21 – 30 31 – 40 41 +
5) In months, how long is your average treatment time?
Extraction Case: 12 – 15 16 – 19 20 – 23 24 – 27 28 +
Non-extraction Case: 12 – 15 16 – 19 20 – 23 24 – 27 28 +
6) In months, ideally, how long do you think a patient should be in treatment?
Extraction Case: 12 – 15 16 – 19 20 – 23 24 – 27 28 +
Non-extraction Case: 12 – 15 16 – 19 20 – 23 24 – 27 28 +
7) Comments:

59
Appendix 2. Survey to Parents - Version B
You are invited to participate in a research study investigating the acceptability of orthodontic
treatment outcomes. All responses are anonymous and no personal identifiers will be collected.
You may stop taking the questionnaire at any point and withdraw from the study. The survey
should take 5 – 10 minutes to complete. If you elect to participate, please read and follow the
instructions below. Thank you for your participation.
Instructions:
The following survey contains 8 sets of images. Each set contains 3 views (right, center, left) of
digital models from an orthodontic patient. For each set of images, please imagine that this is
your child’s teeth. Depending on the image, the patient has been in active treatment for either 18
or 24 months.
You will be asked to evaluate each image as the treatment outcome for a compliant patient and a
noncompliant patient. For the purpose of this study, compliance refers to patients who: attend
orthodontic appointments on time, have great oral hygiene, do not break brackets, and follow
orthodontist’s instructions regarding foods to avoid and wearing elastics.
Please mark on the lines below each image indicating how acceptable you rate the present result.
Once you have marked the line, please immediately answer the question directly below the scale
and proceed to the next set of images/questions. After you have evaluated all images, please
answer all of the remaining questions to the best of your ability.
Once you have completed the survey, please return this packet to the office staff member that
handed it to you.
If you have any further questions, you may contact the research team at:
VCU Office of Research
Subjects Protection
Bhavna Shroff, D.D.S., M.D.Sc.
Department of Orthodontics
David Lindsey, D.D.S.
Department of Orthodontics
800 East Leigh Street,
Suite 3000
VCU School of Dentistry
520 N. 12th St.
VCU School of Dentistry
520 N. 12th St.
BioTech One Building
Box 980568
Richmond, VA 23298
Richmond, VA 23298
(804) 828-9326
Richmond, VA 23298
(804) 828-0843

60
1. The models shown below represent a patient that has been in treatment for 18 months.
I. Please indicate on the scale below how acceptable you find the above treatment
outcome for a compliant patient after 18 months of treatment.
Least Acceptable 0 100 Most Acceptable
C) How many additional months would you be willing to continue orthodontic treatment
to achieve ideal results in a compliant patient?
0-3 months 4-7 months 8-11 months 12+ months
II. Please indicate on the scale below how acceptable you find the above treatment
outcome for a noncompliant patient after 18 months of treatment.
Least Acceptable 0 100 Most Acceptable
D) How many additional months would you be willing to continue orthodontic treatment
to achieve ideal results in a noncompliant patient?
0-3 months 4-7 months 8-11 months 12+ months

61
2. The models shown below represent a patient that has been in treatment for 24 months.
I. Please indicate on the scale below how acceptable you find the above treatment
outcome for a compliant patient after 24 months of treatment.
Least Acceptable 0 100 Most Acceptable
C) How many additional months would you be willing to continue orthodontic treatment
to achieve ideal results in a compliant patient?
0-3 months 4-7 months 8-11 months 12+ months
II. Please indicate on the scale below how acceptable you find the above treatment
outcome for a noncompliant patient after 24 months of treatment.
Least Acceptable 0 100 Most Acceptable
D) How many additional months would you be willing to continue orthodontic treatment
to achieve ideal results in a noncompliant patient?
0-3 months 4-7 months 8-11 months 12+ months
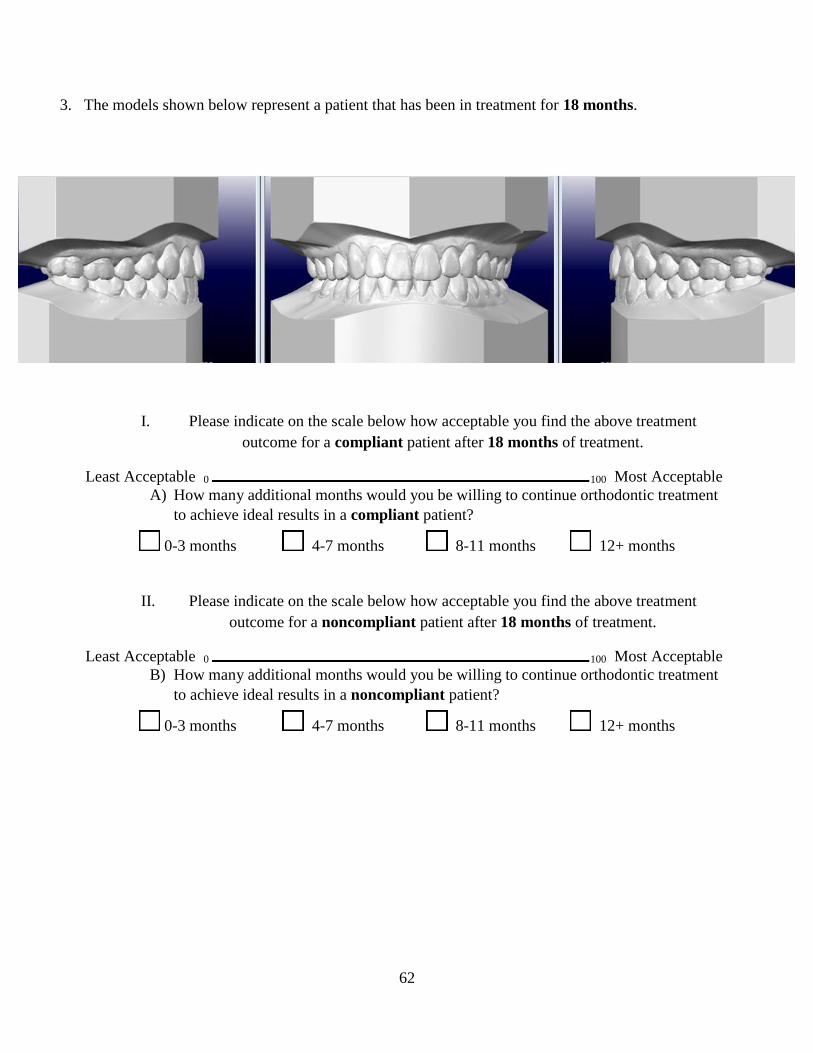
62
3. The models shown below represent a patient that has been in treatment for 18 months.
I. Please indicate on the scale below how acceptable you find the above treatment
outcome for a compliant patient after 18 months of treatment.
Least Acceptable 0 100 Most Acceptable
A) How many additional months would you be willing to continue orthodontic treatment
to achieve ideal results in a compliant patient?
0-3 months 4-7 months 8-11 months 12+ months
II. Please indicate on the scale below how acceptable you find the above treatment
outcome for a noncompliant patient after 18 months of treatment.
Least Acceptable 0 100 Most Acceptable
B) How many additional months would you be willing to continue orthodontic treatment
to achieve ideal results in a noncompliant patient?
0-3 months 4-7 months 8-11 months 12+ months

63
4. The models shown below represent a patient that has been in treatment for 24 months.
I. Please indicate on the scale below how acceptable you find the above treatment
outcome for a compliant patient after 24 months of treatment.
Least Acceptable 0 100 Most Acceptable
A) How many additional months would you be willing to continue orthodontic treatment
to achieve ideal results in a compliant patient?
0-3 months 4-7 months 8-11 months 12+ months
II. Please indicate on the scale below how acceptable you find the above treatment
outcome for a noncompliant patient after 24 months of treatment.
Least Acceptable 0 100 Most Acceptable
B) How many additional months would you be willing to continue orthodontic treatment
to achieve ideal results in a noncompliant patient?
0-3 months 4-7 months 8-11 months 12+ months

64
5. The models shown below represent a patient that has been in treatment for 24 months.
I. Please indicate on the scale below how acceptable you find the above treatment
outcome for a compliant patient after 24 months of treatment.
Least Acceptable 0 100 Most Acceptable
A) How many additional months would you be willing to continue orthodontic treatment
to achieve ideal results in a compliant patient?
0-3 months 4-7 months 8-11 months 12+ months
II. Please indicate on the scale below how acceptable you find the above treatment
outcome for a noncompliant patient after 24 months of treatment.
Least Acceptable 0 100 Most Acceptable
B) How many additional months would you be willing to continue orthodontic treatment
to achieve ideal results in a noncompliant patient?
0-3 months 4-7 months 8-11 months 12+ months

65
6. The models shown below represent a patient that has been in treatment for 24 months.
I. Please indicate on the scale below how acceptable you find the above treatment
outcome for a compliant patient after 24 months of treatment.
Least Acceptable 0 100 Most Acceptable
A) How many additional months would you be willing to continue orthodontic treatment
to achieve ideal results in a compliant patient?
0-3 months 4-7 months 8-11 months 12+ months
II. Please indicate on the scale below how acceptable you find the above treatment
outcome for a noncompliant patient after 24 months of treatment.
Least Acceptable 0 100 Most Acceptable
B) How many additional months would you be willing to continue orthodontic treatment
to achieve ideal results in a noncompliant patient?
0-3 months 4-7 months 8-11 months 12+ months

66
7. The models shown below represent a patient that has been in treatment for 18 months.
I. Please indicate on the scale below how acceptable you find the above treatment
outcome for a compliant patient after 18 months of treatment.
Least Acceptable 0 100 Most Acceptable
A) How many additional months would you be willing to continue orthodontic treatment
to achieve ideal results in a compliant patient?
0-3 months 4-7 months 8-11 months 12+ months
II. Please indicate on the scale below how acceptable you find the above treatment
outcome for a noncompliant patient after 18 months of treatment.
Least Acceptable 0 100 Most Acceptable
B) How many additional months would you be willing to continue orthodontic treatment
to achieve ideal results in a noncompliant patient?
0-3 months 4-7 months 8-11 months 12+ months

67
8. The models shown below represent a patient that has been in treatment for 18 months.
I. Please indicate on the scale below how acceptable you find the above treatment
outcome for a compliant patient after 18 months of treatment.
Least Acceptable 0 100 Most Acceptable
A) How many additional months would you be willing to continue orthodontic treatment
to achieve ideal results in a compliant patient?
0-3 months 4-7 months 8-11 months 12+ months
II. Please indicate on the scale below how acceptable you find the above treatment
outcome for a noncompliant patient after 18 months of treatment.
Least Acceptable 0 100 Most Acceptable
B) How many additional months would you be willing to continue orthodontic treatment
to achieve ideal results in a noncompliant patient?
0-3 months 4-7 months 8-11 months 12+ months

68
Please answer the following questions. For questions regarding your child, please select the
response that represents your child that is currently completing orthodontic treatment. If you have
multiple children currently in orthodontic treatment, please select the response that corresponds to
your child that started treatment first.
1) How old are you?
25 – 34 yo 35 – 44 yo 45 – 54 yo 55 – 64 yo 65+ yo
2) Please check the box with your gender:
Male Female
3) How old is your child?
8 – 10 yo 11 – 13 yo 14 – 16 yo 17+ yo
4) Please check the box with your child’s gender:
Male Female
5) Please check the box with the type of orthodontic appliance your child has:
Braces Clear Aligners/Invisalign ®
6) Did your child have any adult teeth extracted as part of his/her orthodontic treatment?
Yes No
7) When your child started treatment, how many months did your orthodontist tell you treatment would take?
12 – 15 16 – 19 20 – 23 24 – 27 28 +
8) How many months has your child been in orthodontic treatment?
1 – 6 7 – 12 13 – 18 19 – 24 25 +
9) How many more months do you expect your child to be in braces/Invisalign ®?
1 – 6 7 – 12 13 – 18 19 – 24 25 +
10) Ideally, how many months do you think your child should be in braces/Invisalign ® from start to finish?
12 – 15 16 – 19 20 – 23 24 – 27 28 +
11) Comments:

69
VITA
David Lindsey was born on April 30, 1987 to Ronald Lindsey and Fawn Kimura Lindsey in San
Diego, California. However, he was raised in Los Alamitos, California along with his younger brother and
sister, Michael and Kate, respectively. After his graduation from Los Alamitos High School in 2005, David
received a Bachelor of Science Degree in Psychobiology with a Minor in Biomedical Research from the
University of California, Los Angeles in June 2010. He completed his dental education at the University
of California, Los Angeles School of Dentistry in 2015. David continued his advanced training at Virginia
Commonwealth University, where he received a Certificate of Orthodontics and Masters of Science in
Dentistry in 2017. He intends to begin private practice in the Central Coast of California.