Embed Size (px)
Citation preview

Miller, K.G., Sugarman, P.J., Browning, J.V., et al.Proceedings of the Ocean Drilling Program, Initial Reports Volume 174AX (Suppl.)
4. FORT MOTT SITE1
Peter J. Sugarman, Kenneth G. Miller, Peter P. McLaughlin Jr.,James V. Browning, John Hernandez, Donald Monteverde, Jane Uptegrove, Stefanie J. Baxter, Thomas E. McKenna, A. Scott Andres, Richard N. Benson, Kelvin W. Ramsey, Todd Keyser, Miriam E. Katz, Alicia Kahn, Andrea Friedman, Matt Wojtko, Mark D. Feigenson, Richard K. Olsson, Gil Brenner, Jean M. Self-Trail, and Gene Cobbs III2
INTRODUCTION
The following, who are listed in alphabetical order, are responsiblefor the given sections:
Chief scientists: McLaughlin, Miller, SugarmanStaff scientist: BrowningOperations: Cobbs IIILithostratigraphy: Andres, Baxter, Benson, Browning, Hernandez,
Kahn, Katz, Keyser, McKenna, McLaughlin, Miller, Monteverde,Ramsey, Sugarman, Uptegrove
Biostratigraphy:Calcareous nannofossils: Self-TrailPalynomorphs: Brenner, McLaughlin
Logging: Baxter, McLaughlin
FORT MOTT SITE SUMMARY
Fort Mott was the eighth site drilled as part of the New Jersey CoastalPlain Drilling Project and the fifth site drilled as part of Leg 174AX.Drilling at Fort Mott State Park, New Jersey (39°36′19.956″N,75°33′07.175″W; elevation = 3.79 ft [1.2 m]; Delaware City, Delaware,7.5′ quadrangle, Salem County, New Jersey) targeted Upper and LowerCretaceous sequences and aquifers with an 820-ft (249.9 m) corehole
1Sugarman, P.J., Miller, K.G., McLaughlin, P.P., Jr., Browning, J.V., Hernandez, J., Monteverde, D., Uptegrove, J., Baxter, S.J., McKenna, T.E., Andres, A.S., Benson, R.N., Ramsey, K.W., Keyser, T., Katz, M.E., Kahn, A., Friedman, A., Wojtko, M., Feigenson, M.D., Olsson, R.K., Brenner, G., Self-Trail, J.M., and Cobbs, G., III, 2004. Fort Mott Site. In Miller, K.G., Sugarman, P.J., Browning, J.V., et al., Proc. ODP, Init. Repts., 174AX (Suppl.), 1–50 [Online]. Available from World Wide Web: <http://www-odp.tamu.edu/publications/174AXSIR/VOLUME/CHAPTERS/174AXS_4.PDF>. [Cited YYYY-MM-DD]2Scientific Party addresses.
Ms 174AXSIR-105

P.J. SUGARMAN ET AL.CHAPTER 4, FORT MOTT SITE 2
drilled 3–23 October, 2001. At Fort Mott, we recovered 638.85 ft (194.7m); mean recovery was 78% for the 820 ft (249.9 m) cored. Gamma ray,conductivity, spontaneous potential, and resistivity downhole logs werecollected from the borehole. Cretaceous sediments lie beneath a 27.7-ft(8.4 m) veneer of Quaternary sediments. A thin (8.4 ft; 2.6 m), weath-ered, basal transgressive systems tract (TST) of an uppermost Cretaceous(Campanian?) sequence is preserved beneath the Quaternary sedi-ments; its stratigraphic correlation is unclear, although it probably cor-relates to the upper Englishtown or Marshalltown sequences of Miller etal. (2004). A thick Campanian (CC19) sequence is found below thistruncated sequence. It is a typical New Jersey Cretaceous sequence witha thin glauconite sand TST at the base (Merchantville Formation), athick clay-silt to silty very fine sand lower high-stand systems tract(HST) in the middle (Woodbury Formation), and a silty sandy upperHST at the top (Englishtown Formation). Previous mapping of this areawas incorrect in not recognizing the Woodbury Formation (sedimentswere assigned to the Englishtown Formation), which is 30.7 ft (9.36 m)thick. Beneath the Merchantville sequence, a thin, predominantly siltyupper Santonian? sequence is tentatively correlated with the Cheese-quake Formation, although no age was determined because of lack ofcalcareous fossils. The Magothy Formation is thin at Fort Mott (16.1 ft;4.9 m) and appears to be a single nonmarine Turonian sequence (Mag-othy II? of Miller et al., 2004). This formation is thicker and composes amajor aquifer to the northeast and downdip. For example, at the Leg174AX Ancora site, the Magothy Formation is 105.1 ft (32.03 m) thickand consists of two separate sequences (Magothy II and Magothy III).
The majority of the sediments recovered (678.9 ft; 206.93 m) at FortMott were from the Potomac Formation. Fort Mott coring collected oneof the most detailed updip sedimentary records from the Potomac For-mation, including strata from Potomac Formation Units 1–3 (Lower toUpper Cretaceous; Barremian (?)–lower Cenomanian). The Potomacsection is composed primarily of nonmarine fluvial/upper delta plaindeposits that have commonly been overprinted by ancient soil-formingprocesses, leaving thick intervals of paleosols. The overall depositionalmodel for the Potomac Formation is interpreted as an anastomosed flu-vial system. However, the possibility exists that laterally pervasive sandsat the bases of Potomac Units 2 and 3 in New Jersey are marine deltafront deposits. The Potomac Formation is dated using a palynologicalzonation developed in the Atlantic coastal plain continental Cretaceoussections. Pollen Zone I (?Barremian–Aptian), Pollen Zone II (Albian)and its subzones, and Pollen Zone III (Albian–lower Cenomanian) wererecognized in the Fort Mott core, and these zones generally correspondto lithologic units defined in the hole. However, the exact stratigraphiccontacts between these pollen zones in the core were difficult to placebecause of non-fossiliferous intervals produced by the destruction of or-ganic material by soil-forming processes.
The highest subdivision, Potomac Unit 3 (141.1–363.6 ft; 43.01–110.83 m), is a thick section (222.5 ft; 67.8 m) of paleosols and fluvialsediments (channel and overbank facies). The interval is dominated bydeeply weathered clays and silts, with an ~60-ft (18.3 m)-thick sectionof sand at its base. This sand is the largest aquifer in this region.
Potomac Unit 2 (363.6–599.7 ft; 110.83–182.79 m; 236.1 ft [71.96 m]thick) is well defined at the top contact but poorly defined at its lowercontact with Potomac Unit 1. The upper part of Unit 2 has more strati-graphic intervals that are less severely weathered than Unit 3, allowingbetter interpretation of sedimentary facies and more detailed pollen
P.J. SUGARMAN ET AL.CHAPTER 4, FORT MOTT SITE 3
analysis. This more detailed analysis allowed recognition of SubzonesIIC and IIB within Unit 2. Within Potomac Unit 2, sediments correlatedwith pollen Zone IIC are organic rich and are interpreted to be depositsfrom an anastomosed fluvial system. Common facies include flood-basin, lacustrine, and overbank deposits. Zone IIB contains similar fa-cies (along with crevasse splay) and a thick channel sand, althoughdeeply weathered paleosols are also present, making it extremely diffi-cult to accurately map the Zone II/Zone I boundary. Therefore, the in-terval between 599.7 and 644.1 ft (182.79 and 196.32 m) is assigned toundifferentiated Units 1–2, although we favor assignment to Unit 2.
Potomac Unit 1 (644.1–820 ft; 196.32–249.94 m) is 109.4 ft (33.3 m)thick in this borehole. It is also interpreted as sediments deposited in ananastomosed fluvial system, with channel fill, overbank, and swampdeposits. Intervals of colluviated material are also present. Deeplyweathered paleosols are formed on this ancient fluvial sediment.
Hydrogeologic Summary
Three of the units penetrated in the Fort Mott corehole containaquifer-quality sands in the coastal plain of New Jersey and Delaware:the Englishtown Formation, the Magothy Formation, and the PotomacFormation. The Englishtown Formation contains too high a percentageof clay and silt and is too thin to be used as an aquifer in this area. TheMagothy Formation is also too thin at Fort Mott (13–18.3 ft; 3.96–5.58m) to constitute a potential major aquifer; it is correlative with the up-per Potomac-Raritan-Magothy (PRM) aquifer of Zapecza (1989). Thereare several sand intervals in the Potomac Formation that may makehigh-quality aquifers. The best aquifer is ~73 feet (22 m) thick and isfound at the base of Potomac Unit 3. It is tentatively correlated with themiddle PRM aquifer of Zapecza (1989). The gross thickness of the Unit 3aquifer is significant, and it can be subdivided into thinner upper andlower aquifer subunits. The upper subunit, screened at the nearby FinnsPoint National Cemetery well at 282–319 ft (85.95–97.23 m), appears atFort Mott at 291.4–310.6 ft (88.82–94.67 m) and is separated from thelower subunit at 320.4–364.25 ft (97.66–111.02 m) by a thin confiningbed at 310.6–320.4 ft (94.67–97.66 m). Hydrologic testing would be re-quired to establish the effectiveness of this confining bed. Another po-tential aquifer appears below a thick confining bed in Potomac Unit 2from 565.1 to 596.8 ft (172.24 to 181.90 m). Because the sediment iscomposed of very fine to fine sand, this potential aquifer requires test-ing to determine its output.
BACKGROUND AND OBJECTIVES
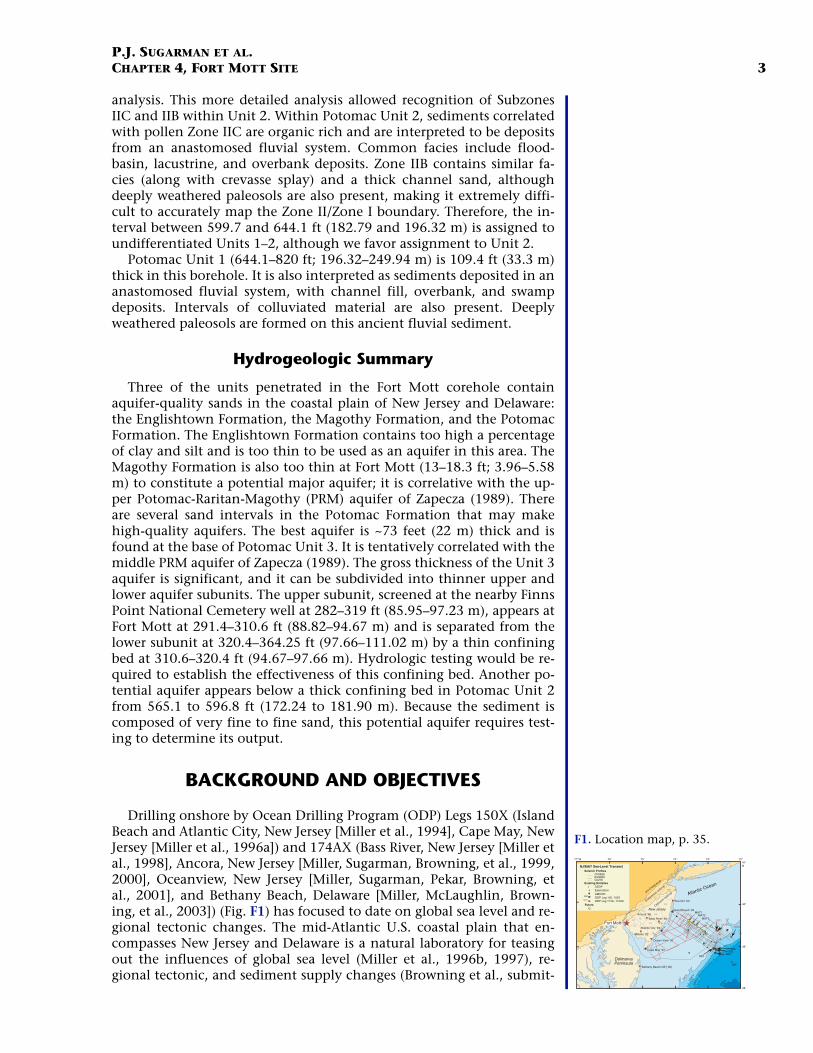
Drilling onshore by Ocean Drilling Program (ODP) Legs 150X (IslandBeach and Atlantic City, New Jersey [Miller et al., 1994], Cape May, NewJersey [Miller et al., 1996a]) and 174AX (Bass River, New Jersey [Miller etal., 1998], Ancora, New Jersey [Miller, Sugarman, Browning, et al., 1999,2000], Oceanview, New Jersey [Miller, Sugarman, Pekar, Browning, etal., 2001], and Bethany Beach, Delaware [Miller, McLaughlin, Brown-ing, et al., 2003]) (Fig. F1) has focused to date on global sea level and re-gional tectonic changes. The mid-Atlantic U.S. coastal plain that en-compasses New Jersey and Delaware is a natural laboratory for teasingout the influences of global sea level (Miller et al., 1996b, 1997), re-gional tectonic, and sediment supply changes (Browning et al., submit-
+ ++
++++
+
+
++
Cape May ‘94
1072
902
903904
1071
905
906
1073
Ocean View ‘99
72°73°75° 74°76°77°W
38°
39°
41°N
40°Future
Ew9009Ch0698
Oc270
Seismic Profiles
Existing DrillsitesDSDPExplorationAMCORODP Leg 150, 150X903
ODP Leg 174A, 174AX1072
+
+
+ +
+
+
++
I
+I
MAT1
MAT3MAT2
DelmarvaPeninsula
pre-Cretace
ous
2000
m1000
m
3000
m
200
m
NJ/MAT Sea-Level Transect
Bethany Beach,DE (‘00)
++
Island Beach ‘93
Atlantic Ocean
Sea Girt ‘03
Fort MottCU
Millville ‘02
Atlantic City ‘93
Ancora ‘98
Bass River ‘96
New JerseyCenozo
ic outcr
op
Cretaceous o
utcrop
CM
SAGL
AT
CD
BU
OC
MN
F1. Location map, p. 35.

P.J. SUGARMAN ET AL.CHAPTER 4, FORT MOTT SITE 4
ted [N1]). This region is also inhabited by over 10 million people (2 mil-lion in southern New Jersey, 0.8 million in Delaware [0.5 milliondepend on groundwater], and 8 million in Maryland and northern Vir-ginia), many of whom rely on groundwater for their day-to-day suste-nance. Because of this, drilling at Bass River, Ancora, and Oceanview,New Jersey, was partially funded by the New Jersey Geological Survey(NJGS). Similarly, drilling at Bethany Beach, Delaware, was partiallyfunded by the Delaware Geological Survey (DGS). Both the NJGS andthe DGS have endeavored to understand the relationship amonggroundwater resources (aquifers), their confining units, and sequencestratigraphy.
Sequence stratigraphy was pioneered by Exxon Production ResearchCompany in their quest to understand the geological controls on oil-bearing units (e.g., Vail et al., 1977; Posamentier et al., 1988). Sequencesare unconformity-bounded units that provide a predictable pattern fornot only oil but also water-bearing beds (aquifers). In the New Jerseyand Delaware coastal plains, marine sequences consist of basal uncon-formities, thin lower TST sands, thick medial lower HST silty clays andsilts, and thick upper HST sands (Sugarman et al., 1993). Lowstand sys-tems tracts are largely missing in the onshore coastal plain. The upperHST sands generally compose aquifers, whereas the silty lower HSTunits compose confining units (Sugarman and Miller, 1997). Under-standing the sequence stratigraphy of the coastal plain provides a pre-dictability for the distribution of groundwater resources.
With this in mind, the NJGS funded drilling targeting aquifers in thesouthern part of the state, namely Salem and Cumberland Counties(Fig. F1). This region currently derives nearly all of its drinking watersupplies from groundwater (Cauller et al., 1999). This is especially truefor southwestern Cumberland County, where surface water supply isnonexistent. Critical issues face water resource planners in this area, asin many areas of New Jersey, where the demand for water is projected toincrease significantly over the next 20 yr. The Salem/Cumberland areais projected to be one of the five fastest growing areas in New Jersey,highlighting the need for additional water resources and intelligent wa-ter resource planning. Continuous coring of sequences in this region isneeded to help determine the areal distribution of aquifers to allow effi-cient use of water resources.
In addition to water use, planners must consider saltwater intrusionand regulatory issues. One of the major aquifers in this region, the PRMaquifer system (Fig. F2), is susceptible to saltwater intrusion because ofproximity to the Delaware estuary and heavy pumping in surroundingareas. Regulatory issues include the existence of water supply CriticalArea No. 2 in northern Gloucester, Camden, and Burlington Counties,where pumpage is regulated, and its proximity to the Pinelands, a pro-tected region. The resulting scenario is one of numerous restrictionscoupled with vulnerable aquifers. These concerns have resulted in theinitiation of a Water Supply Action Plan for the Salem/Gloucester/Cum-berland area calling for a focus on evaluating the effect of proposedPRM withdrawals. The PRM is the major aquifer of focus because otherregional confined aquifers, including the Wenonah–Mount Laurel andthe Piney Point, have relatively low yields based on aquifer testing andare therefore inadequate to satisfy anticipated future demands in Salemand Gloucester Counties (note: the PRM is too deep to presently be con-sidered in Cumberland County).
Planning and regulation of aquifers in this region are additionallycomplicated by the fact that New Jersey shares the PRM aquifer system
50 100 150 25 50 75
T.D. 820 ft
Aquifer sand
Cheesequake
Merchantville
Woodbury
l. Englishtown
?u. Englishtown
Cape May
Magothy
Potomacunit 3
Potomacunit 2
Potomacunit 1
MerchantvilleIII
Cheesequake
Magothy II
?u. Englishtown
Cape May
Potomac 3
?Potomac 2b
Potomac 1
undifferentiated
Englishtownaquifer system
Pot
omac
–Rar
itan–
Mag
othy
aqu
ifer
syst
em
Upperaquifer
Middleaquifer
?Loweraquifer
?Pleistocene
Upp
er C
reta
ceou
sLo
wer
Cre
tace
ous
Cam
pani
an
?Campanian/?Santonian?Coniacian/? Turonian
Campanian/?Santonian
Cen
oman
ian
uppe
r A
lbia
nA
ptia
n
~98.9 Ma
~112.2 Ma
?Potomac 2aPotomacunit 1 or 2
0
50
100
150
200
250
300
350
400
450
500
550
600
650
700
750
800
Dep
th (
ft)
Gamma log ResistivityFormation Sequence
Hydrostratigraphicunit
(Zapecza, 1989)Series/Stage
Confiningbed
Confiningbed
Confiningbed
~97 Ma bycorrelationto Ancora
Merchantville-Woodburyconfining
bed
F2. Lithologic and hydrostrati-graphic terminology, p. 36.

P.J. SUGARMAN ET AL.CHAPTER 4, FORT MOTT SITE 5
with Delaware. Current and future PRM withdrawals in Delaware mayhave significant potential effects on the quantity and quality of thePRM aquifer system in New Jersey and vice versa. A coordinated studyof the hydrogeology of the PRM between New Jersey and Delaware isneeded to develop strategies to protect and restore the PRM and to helpensure the availability of freshwater to meet future needs in the LowerDelaware Basin.
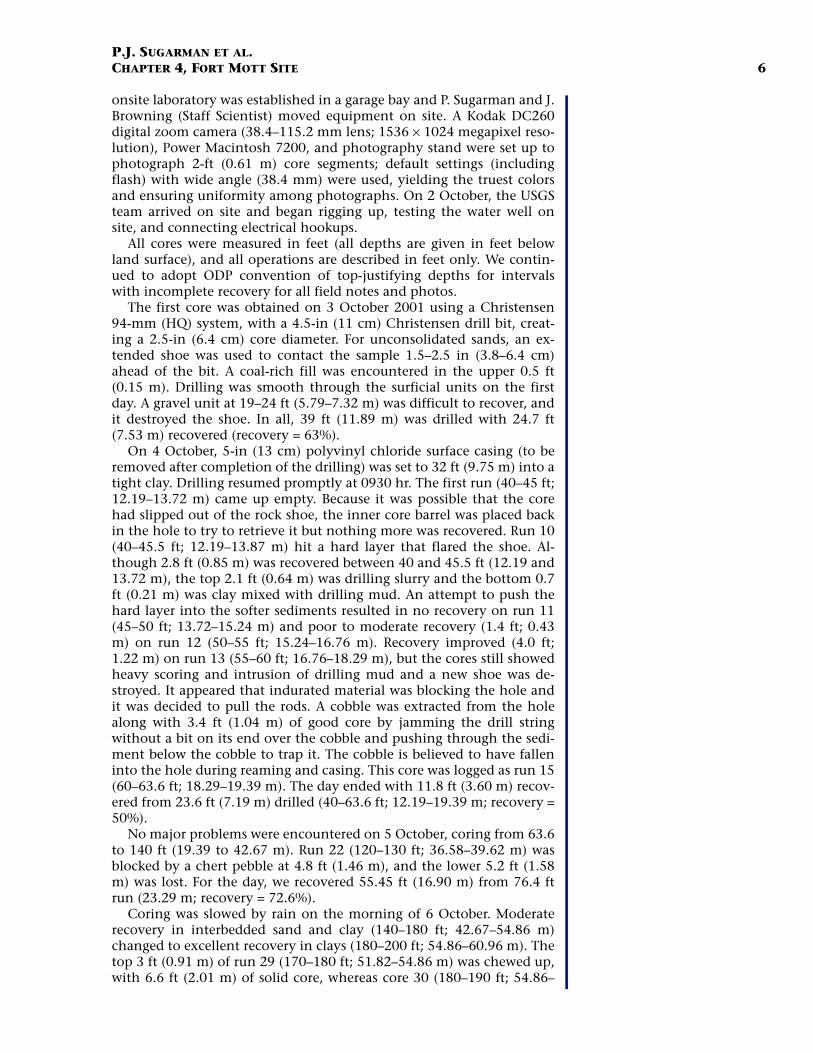
One of the primary objectives of NJGS-funded coastal plain drilling isto evaluate the geologic framework of Salem and Cumberland Counties,with a main emphasis on the PRM aquifer system. To this end, two stra-tigraphic control coreholes were proposed by the NJGS. The first, at sce-nic Fort Mott State Park on the Delaware River (Fig. F1), was completedin October 2001 and was the eighth continuously cored boreholedrilled in New Jersey as part of the New Jersey Coastal Plain DrillingProject. The second was drilled in 2002 at Millville, New Jersey (Fig. F1),and will be reported in a subsequent site report. The Fort Mott coreholewas drilled to a depth of 820 ft (249.94 m) and provides a continuouslysampled borehole to investigate the water resource potential of two crit-ical water-bearing units (aquifers) within the Magothy and PotomacFormations. These are two of the primary aquifers in the New Jerseycoastal plain in a belt that parallels the Delaware River from Monmouththrough Salem Counties. These units are made up of clay-silt and inter-bedded sands deposited in riverine and nearshore paleoenvironments(Fig. F3) during the middle part of the Cretaceous, ~125–84 m.y. ago.Our understanding of the distribution of these clays and sands is criticalfor prediction of water resources and pollution remediation in thesouthern part of the state, but it is limited by lateral facies changes andpoor sampling of the formations in both outcrop and discontinuouslysampled water wells. Continuous geological samples obtained at FortMott provide new insights into the complex environments of deposi-tion, especially in the Potomac Formation (e.g., Fig. F3), and their im-pact on the distribution of water resources.
Drilling and study of the Fort Mott borehole was a collaborativeproject: the NJGS provided scientific personnel and funds to drill theborehole; the DGS provided scientific personnel and downhole loggingsupport; Rutgers, The State University of New Jersey, provided sciencepersonnel and logistical support; the U.S. Geological Survey (USGS)drilled the hole; and ODP provided publications support. The Fort Mottsite is the most updip location drilled to date by this team. Recoverywas good (78%), with 639 of 820 ft (194.77 of 249.94 m) recovered. Afull suite of wireline logs was obtained to 800 ft (243.84 m). The on-sitescientific team provided preliminary descriptions of sedimentary tex-ture, structure, color, and fossil content and identified lithostrati-graphic units, lithologic contacts, and sequences.
OPERATIONS
Drilling at Fort Mott State Park, New Jersey (39°36′19.956″N,75°33′07.175″W; elevation = 3.79 ft [1.2 m]; Delaware City, Delaware,7.5′ quadrangle, Salem County, New Jersey) began in early October2001. Drilling operations were superintended by Gene Cobbs, USGSEastern Earth Surface Processes Team; Gene Cobbs III was the driller.Space, water, and electricity were provided by the New Jersey Depart-ment of Parks at the Fort Mott State Park maintenance yard (courtesy ofFort Mott State Park Chief Ranger Patricia Cianflone). On 1 October, an
Gleyed Overbank/Floodplain460-462 ft
Swamps805-807 ft
Oxidized Soils270-272 ft
Fluvial Channels296-298 ft
Lake/Oxbow500-502 ft
A
F3. Facies models, p. 37.
P.J. SUGARMAN ET AL.CHAPTER 4, FORT MOTT SITE 6
onsite laboratory was established in a garage bay and P. Sugarman and J.Browning (Staff Scientist) moved equipment on site. A Kodak DC260digital zoom camera (38.4–115.2 mm lens; 1536 × 1024 megapixel reso-lution), Power Macintosh 7200, and photography stand were set up tophotograph 2-ft (0.61 m) core segments; default settings (includingflash) with wide angle (38.4 mm) were used, yielding the truest colorsand ensuring uniformity among photographs. On 2 October, the USGSteam arrived on site and began rigging up, testing the water well onsite, and connecting electrical hookups.
All cores were measured in feet (all depths are given in feet belowland surface), and all operations are described in feet only. We contin-ued to adopt ODP convention of top-justifying depths for intervalswith incomplete recovery for all field notes and photos.
The first core was obtained on 3 October 2001 using a Christensen94-mm (HQ) system, with a 4.5-in (11 cm) Christensen drill bit, creat-ing a 2.5-in (6.4 cm) core diameter. For unconsolidated sands, an ex-tended shoe was used to contact the sample 1.5–2.5 in (3.8–6.4 cm)ahead of the bit. A coal-rich fill was encountered in the upper 0.5 ft(0.15 m). Drilling was smooth through the surficial units on the firstday. A gravel unit at 19–24 ft (5.79–7.32 m) was difficult to recover, andit destroyed the shoe. In all, 39 ft (11.89 m) was drilled with 24.7 ft(7.53 m) recovered (recovery = 63%).
On 4 October, 5-in (13 cm) polyvinyl chloride surface casing (to beremoved after completion of the drilling) was set to 32 ft (9.75 m) into atight clay. Drilling resumed promptly at 0930 hr. The first run (40–45 ft;12.19–13.72 m) came up empty. Because it was possible that the corehad slipped out of the rock shoe, the inner core barrel was placed backin the hole to try to retrieve it but nothing more was recovered. Run 10(40–45.5 ft; 12.19–13.87 m) hit a hard layer that flared the shoe. Al-though 2.8 ft (0.85 m) was recovered between 40 and 45.5 ft (12.19 and13.72 m), the top 2.1 ft (0.64 m) was drilling slurry and the bottom 0.7ft (0.21 m) was clay mixed with drilling mud. An attempt to push thehard layer into the softer sediments resulted in no recovery on run 11(45–50 ft; 13.72–15.24 m) and poor to moderate recovery (1.4 ft; 0.43m) on run 12 (50–55 ft; 15.24–16.76 m). Recovery improved (4.0 ft;1.22 m) on run 13 (55–60 ft; 16.76–18.29 m), but the cores still showedheavy scoring and intrusion of drilling mud and a new shoe was de-stroyed. It appeared that indurated material was blocking the hole andit was decided to pull the rods. A cobble was extracted from the holealong with 3.4 ft (1.04 m) of good core by jamming the drill stringwithout a bit on its end over the cobble and pushing through the sedi-ment below the cobble to trap it. The cobble is believed to have falleninto the hole during reaming and casing. This core was logged as run 15(60–63.6 ft; 18.29–19.39 m). The day ended with 11.8 ft (3.60 m) recov-ered from 23.6 ft (7.19 m) drilled (40–63.6 ft; 12.19–19.39 m; recovery =50%).
No major problems were encountered on 5 October, coring from 63.6to 140 ft (19.39 to 42.67 m). Run 22 (120–130 ft; 36.58–39.62 m) wasblocked by a chert pebble at 4.8 ft (1.46 m), and the lower 5.2 ft (1.58m) was lost. For the day, we recovered 55.45 ft (16.90 m) from 76.4 ftrun (23.29 m; recovery = 72.6%).
Coring was slowed by rain on the morning of 6 October. Moderaterecovery in interbedded sand and clay (140–180 ft; 42.67–54.86 m)changed to excellent recovery in clays (180–200 ft; 54.86–60.96 m). Thetop 3 ft (0.91 m) of run 29 (170–180 ft; 51.82–54.86 m) was chewed up,with 6.6 ft (2.01 m) of solid core, whereas core 30 (180–190 ft; 54.86–

P.J. SUGARMAN ET AL.CHAPTER 4, FORT MOTT SITE 7
57.91 m) had 1 ft (0.92 m) of “chew” at top. The day ended with 45.9 ft(13.99 m) recovered from 60 ft run (18.29 m; recovery = 76.5%).
Recovery on 7 October was excellent. We drilled from 200 to 245 ft(60.96 to 74.68 m), with 90% recovery (40.3 ft [12.28 m] recovered of45 ft [13.72 m] drilled). Excellent recovery continued during the first 3runs on 8 October (245–270 ft drilled; 25.15 ft recovered; 74.68–82.30m drilled; 7.66 m recovered), but recovery dropped sharply on runs 40and 41 (270–290 ft; 82.30–88.39 m). There were no obvious problemsin run 40 (270–280 ft; 82.30–85.34 m), with 4.8 ft (1.46 m) of clay re-covered. The core was lost from the barrel in the next coring run (280–290 ft; 85.34–88.39 m), but 3.1 ft (0.94 m) was recovered on 9 Octoberby running the inner core barrel back in for the core. This core may rep-resent material from anywhere between the bottom of the overlying re-covered interval at 274.8 ft (83.76 m) and the bottom of this run at 290ft (88.39 m), but its top is hung at 280 ft (85.34 m).
Coring continued on 9 October with a change from mottled clay tocoarse sand and some gravel. Drilling was limited to 25 ft (7.62 m) forthe day (19.45 ft [5.93 m]; recovery = 78%) because the inner core barrelbecame stuck ~100 ft (30.48 m) from the bottom of the hole. The corefrom run 44 (300–303.5 ft; 91.44–92.51 m) was intruded with drillingmud. The top 2 ft (0.61 m) of the core from run 45 (303.5–310 ft;92.51–94.49 m) may be drilling slurry.
On 10 October we cored 50 ft (15.24 m) from 315 to 365 ft (96.01 to111.25 m). Below 330 ft (100.58 m) the drillers added bentonite to thedrilling mud to equalize the pressure inside and outside the core barrel.For all subsequent coring runs on this day, drilling was slightly faster tominimize drilling mud invasion into sands and extra care was taken topump long enough to clear drilled sand from the hole. A hard bed wasencountered during the drilling of the last core (run 53; 360–365 ft;109.73–111.25 m), destroying a coring shoe. The day ended with 40.5 ft(12.34 m) recovered from 50 ft run (15.24 m; recovery = 81%). Pumpingafter each run to clean out sand, as well as increasing the mud weight,probably helped contribute to the excellent recovery in a sand-domi-nated interval.
Recovery on 11 October was excellent, although the dominant mot-tled clay lithology kept the drilling rate slow. The drillers had been us-ing a modified shoe with long springs inside to help capture the core.Using the modified shoe allowed them to move the shoe back up insideof the bit, allowing the bit to cut faster. All of these modified shoes wereexpended and we were relegated to using a regular rock shoe. The rockshoe contacts the clay just behind the carbide cutters and in front ofthe diamonds, reducing the speed at which clay is cut. The lack of mod-ified shoes resulted in slower drilling. Recovery was 100% for the day(45 ft [13.72 m] from 375 to 410 ft [114.3 to 124.97 m]).
On 12 October, clay gave way to sand and drilling speeds increased.Below 418 ft (127.41 m), the sand content increased in the core anddrilling was much quicker to 474 ft (144.48 m). At 474 ft (144.48 m) thedrillers encountered a lithified zone or large nodule in the hole, andthey stopped the run after 5 ft (1.52 m) in a gray clay. The day endedwith 59.2 ft (18.04 m) recovered from 65 ft run (21.33 m; recovery =91%).
Coring in clay continued on 13 October from 475 to 530 ft (144.78to 161.54 m), with 52.15 ft (15.90 m) recovered (95%). Coring wasfaster in the morning in gray, slightly micaceous silty clays, but slowedin the afternoon as we reencountered mottled red, green, and grayclays.

P.J. SUGARMAN ET AL.CHAPTER 4, FORT MOTT SITE 8
Drilling was suspended on 14 October as the drillers returned to Re-ston, Virginia, to get additional supplies. The rods were turned in themorning and in the evening to prevent binding in the hole. No prob-lems were encountered on return from Reston and smooth coring re-sumed on 15 October. Drilling became easier on runs 73–74 (540–560ft; 164.59–170.69 m) as we penetrated silts. Easy drilling continued, butrecovery dropped in sands on runs 75–77 (560–590 ft; 170.69–179.83m). The day ended at 590 ft (179.83 m) with 41.7 ft (12.71 m) recovered(69.5%).
On 16 October, run 78 (590–598 ft; 179.83–182.27 m) penetrated aharder zone at the top of the run and was stopped at a hard layer at 598ft (182.27 m). Run 79 (598–605 ft; 182.27–184.40 m) recovered only 2 ftof sand and interbedded clay, whereas run 80 (605–610 ft; 184.40–185.93 m) became plugged with clay, blowing away the underlyingsand. The interbedded sands and clays hindered recovery. Run 81 (610–616 ft; 185.93–187.76 m) slipped out of the core barrel. We went downwith the 10-ft (3.05 m) barrel and drilled another 4 ft (1.22 m; 610–620ft; 185.92–188.98 m), recovering 8.4 ft (2.56 m). The final run (620–630ft; 188.98–192.02 m) obtained 8.1 ft (2.47 m). For the day, 26.9 ft (8.20m) was recovered from 40 ft (12.19 m) drilled (recovery = 67.3%).
At the beginning of the day on October 17, runs 83–84 (630–650 ft;192.02–198.12 m) penetrated silty sands. Drilling slowed near the endof run 84 at 644.1 ft (196.32 m) when we penetrated a very hard clayeysilt. The drillers stopped the run after drilling 6.5 ft (1.98 m); only 4.7 ft(1.43 m) was recovered. The hard lithology continued in run 85, whichwas stopped after 4.5 ft (1.37 m) at 651 ft (198.42 m) with 6.0 ft (1.83m) recovered. We believe the top 1.5 ft (0.46 m) of run 85 representsmaterial from the bottom of run 84. Run 86 drilled very slowly, and thecore catcher was destroyed during the run. Only 1.85 ft (0.56 m) of 9.0ft (2.74 m) run was recovered (with the remainder probably still in thebottom of the hole, having slipped out of the core catcher). The sameinterval was re-run as run 86A, and an additional 1.2 ft (0.37 m) of corewas recovered, likely from the bottom part of the run interval, making atotal of 3.05 ft (0.93 m) recovered for this 9.0-ft (2.74 m) interval. Forthe day, 21.9 ft (6.68 m) was recovered from 30 ft (9.14 m) drilled (re-covery = 73%).
On 18 October, drilling was slow with good recovery (>96.5%) as themottled clays become harder. The drilling ended with 30 ft (9.14 m)drilled to 690 ft (210.31 m). The core was dropped on the last 10 ft (3.05m) run, but completely recovered.
On 19 October, the rods were stuck in the hole because of swellingclays, so the mud was thinned and circulated until about 0900 hr. Drill-ing resumed with a 4-ft (1.22 m) run, with a recovery of 2.15 ft (0.66m). The core was mangled (undercut) because the material was veryhard. A 6-ft (1.83 m) run followed, and 6.1 ft (1.86 m) of core was recov-ered (693.9–700 ft; 211.50–213.36 m). The day finished with a 10-ft(3.05 m) run (700–710 ft; 213.36–216.41 m), from which 10.25 ft (3.12m) was recovered. The drillers pulled the rods up 200 ft (60.96 m) at theend of the day to avoid the swelling clays that caused the rods to stickthat morning. For the day, 16.5 ft (5.03 m) was recovered from 20 ft(6.10 m) drilled (recovery = 83%).
On 20 October, a first attempt to core 5 ft (710–715 ft; 216.41–217.93m) yielded no recovery. A rock shoe was used in this interval, and thecore likely slipped through the metal core catcher because of undercut-ting. After some modification of the catcher, drilling resumed for an ad-ditional 5 ft (1.52 m; 715–720 ft; 217.93–219.46 m), targeted at recover-

P.J. SUGARMAN ET AL.CHAPTER 4, FORT MOTT SITE 9
ing the lost core (710–715 ft; 216.41–217.93 m) as well as the additionalfootage (715–720 ft; 217.93–219.46 m). On attempting to retrieve thisinterval, the core again slipped through the catcher. The core barrel waslowered, this time with a short snout shoe and plastic core catcher, andthe interval was drilled again, finally recovering 2.9 ft (0.88 m) of the10-ft (3.05 m) interval cored (recovery = 29%). The following coring run(720–725 ft; 219.46–220.98 m) went fairly smoothly and recovered 2.8ft (0.85 m) of 5 ft (1.52 m) drilled (recovery = 56%). The interval from725 to 730 ft (220.98 to 222.50 m) was very hard; 5.5 ft (1.68 m) of corewas recovered of 5 ft (1.52 m) drilled (recovery = 110%), including thebottom of the previous coring run. The final core for the day, 730–740ft (222.50–225.55 m), began with a hard interval and concluded with asofter interval at its base. Recovery was 9.2 ft (2.80 m). For the day, 20.4ft (6.22 m) was recovered from 30 ft (9.14 m) drilled (recovery = 68%).
There was no drilling on Sunday, 21 October. Drilling resumed on 22October. Approximately 50% of the first run (740–748 ft; 225.55–227.99m) was recovered. Recovery improved to 84% on the next run (748–753.5 ft; 227.99–299.67 m); this core cut faster than the previous run.Recovery between 753.5 and 760 ft (299.56 and 231.65 m) was 5.15 ft(1.57 m; recovery = 79%); the last 0.5 ft (0.15 m) was very hard. Recov-ery from 760 to 765 ft (231.65 to 233.17 m) was perfect. The last 0.7 ft(0.21 m) was much harder, resulting in a new shoe being fitted for thenext run. The day concluded with a 10-ft (3.05 m) run from 765 to 775ft (233.17 to 236.22 m) and 75% recovery (7.5 ft; 2.29 m). For the day,26.35 ft (8.03 m) of core was recovered from 35 ft (10.67 m) drilled (re-covery = 75%).
The final day of coring was 23 October, as we reached our targetdepth of 800 ft (243.84 m). The first run of the day had no recoveryfrom 775 to 780 ft (236.22 to 237.74 m). When the core barrel was re-trieved, we discovered that the core catcher was inside out. The nextrun (780–785 ft; 237.74–239.27 m) recovered 5.1 ft (1.55 m) of core, (re-covery = 102%). Run 105 (785–795 ft; 239.27–242.32 m) recovered 7.7ft (2.35 m). Another 10-ft (3.05 m) run (795–805 ft; 242.32–246.36 m)was attempted as penetration was easy, but only 4.5 ft (1.37 m) was re-covered. The next 5-ft (1.52 m) section was drilled from 805 to 810 ft(245.36 to 246.89 m), with 5.2 ft (1.58 m) recovered. The run wasstopped at 5 ft (1.52 m) to switch back to a hard rock shoe for the nextrun. The final core run (810–820 ft; 246.89–249.94 m) recovered 4 ft(1.22 m) of core. Drilling was easy, and basement saprolite or rock wasnever encountered.
At Fort Mott, we recovered 638.85 ft (194.7 m) from a total hole of820 ft (249.9 m); mean recovery was 78% for the 820 ft (249.9 m) cored.Lithologies were described on site and subsequently at the Rutgers corefacility; these descriptions form the basis for the preliminary lithologicdescriptions. Samples were obtained at ~5-ft (1.52 m) intervals for bio-stratigraphic and coarse-fraction lithologic studies. Cores were cut into2-ft (0.61 m) sections, labeled at top and bottom of each section, placedinto split PVC pipe (3-in [7.6 cm] diameter), wrapped in plastic sheet-ing, and stored in 2-ft (0.61 m) wax boxes. A total of 119 core boxeswere moved to permanent storage at the Rutgers University core libraryfor further study.

P.J. SUGARMAN ET AL.CHAPTER 4, FORT MOTT SITE 10
LITHOSTRATIGRAPHY
Summary
The on-site scientific team provided preliminary descriptions of sedi-mentary texture, structure, color, fossil content, identification of litho-stratigraphic units (NJGS Information Circular 1, 1990), and lithologiccontacts (Table T1; Figs. F4, F5, F6, F7). Subsequent studies integratedpreliminary descriptions with additional descriptions, biostratigraphy(nannoplankton and pollen), and the gamma ray log. Unconformitieswere identified on the basis of physical stratigraphy, including irregularcontacts, reworking, bioturbation, major facies changes, gamma raypeaks, and paraconformities inferred from biostratigraphic breaks. Forthe nonmarine and nearshore sections in the Potomac and MagothyFormations, lithofacies interpretations provide the primary means ofrecognizing unconformities and interpreting paleoenvironments; thisinformation is supplemented by palynostratigraphy.
Cumulative percent plots of the sediments in the cores were com-puted from washed samples. Each sample was dried and weighed beforewashing, and the dry weight was used to compute the percentage ofsand. This differs from the method used in previous New Jersey coastalplain cores (Bass River, Island Beach, Atlantic City, and Cape May), inwhich the samples were not dried before washing.
Facies Model
New Jersey coastal plain strata were deposited on the trailing edge ofa passively subsiding continental margin (e.g., Grow and Sheridan,1988). Thermoflexural subsidence and sediment loading along a hingedmargin has dominated the creation of accommodation space (e.g., Ko-minz et al., 1998). The depositional environment of the Lower Creta-ceous to basal Upper Cretaceous (Barremian–lowermost Cenomanian)Potomac Formation was predominantly terrestrial, whereas the UpperCretaceous to Miocene was primarily marine. Previous studies have in-terpreted the sediments of the Potomac Formation as having been de-posited in a nearshore delta plain or coastal plain setting, and this del-taic influence continued into the marine sediments of the LateCretaceous and Miocene (Owens et al., 1970).
Potomac Formation sediments in the Fort Mott borehole and else-where are predominantly fine grained (clays, silty clays, and clayeysilts), with a few critical sand bodies. The finer-grained units are inmany intervals heavily overprinted by soil-forming processes. Theserange from light blue and gray gleyed soils indicating soil formation inreduced conditions to dark red (lateritic?) soils indicating oxidized con-ditions. These silty clays and clayey silts were probably deposited asheavily vegetated overbank deposits. Variations in color and downholelogs (Figs. F4, F5, F6, F7) are found on the 2- to 3-ft (60–90 cm) and 10-ft (3 m) scales; these cycles appear to reflect differences in evaporationand precipitation with red oxidized sediments (high gamma log values)alternating with gray or gleyed reduced sediments (low gamma log val-ues). This cyclicity not only reflects regional climate changes, its regu-larity implies a global imprint on climate and precipitation (e.g., Mi-lankovitch periodicities).
Owens et al. (1970) interpreted the facies of the Potomac Formationas being deposited in a delta plain and delta front. His facies model forthe Potomac Formation interpreted sand facies as fluvial-dominated
T1. Core descriptions, Fort Mott borehole, p. 43.
Rec
over
y
g g g
g
g
ggg
ggg
g gg
ggg
50 100
MerchantvilleFormation
Mag
othy
F
orm
a tio
n
CheesequakeFormation
Potomac Formation– unit 3
Cap
e M
ay
Fo r
ma t
ion
Woo
d bur
y F
orm
a tio
nlo
wer
En g
lisht
own
Fo r
ma t
ion
Marshalltown/upper Englishtown
Formation
g g
25 50 75
Resistivity
Gamma
B
B
B
B
B
CC19
CC19CC19
PollenNannos
?Qua
tern
ary
Rare
B
B
ZoneV
50150
?Upp
erC
reta
ceou
s
“up p
e r P
RM
aqu i
f er”
27. 7
36. 1
113.
312
514
1.1
MFS
Est
uarin
ein
ner
nerit
i cIn
ner
nerit
icP
rode
lta?M
iddl
ene
riti c
?Inn
erne
riti c
low
er d
elta
pla
i n/
uppe
r e s
tuar
ine
Clay
Silty clay
Silt
Muddy sand/sandy mud
Quartz sand
Glauconite
Fine/very finequartz sand
Sphaerosiderite
Medium and coarsergrained quartz sand
Clay and silt
Cemented
Glauconitesand
Other
Mica
B – BarrenMFS – Maximum Flooding surface
SB – Sequence BoundaryGravelly/gravel
Cross bed
Glauconiteg g
Lignite/lignitic
Shells/shelly
Burrows/bioturbated
Dep
th (
ft)
LithologyCumulative
percentGeophysical logs Biostratigraphy Formation
0
10
20
30
40
50
60
70
80
90
100
110
120
130
140
150
F4. Stratigraphy for various forma-tions, p. 39.
Re
co
ve
ry
Mo
ttle
dM
ott
led
Org
ani c
rich
Sa
nd
yM
ott
-le
dS
an
dy
Po
tom
ac F
orm
atio
n –
un
it 3
Magothy Fm.
“lo
we
r-m
iddle
”m
idd
le a
qu
ife
r“u
pp
er ”
mid
dle
aq
uife
r
256. 8
141. 1
259. 9
290.6
5310. 6
320. 4
Gamma Biostratigraphy
Formation
25 50 75
Resistivity
Zone III
Zone III
B
B
100 200 50
148
alluvial plain
overbank
swamp
164.2
terrestrialsoils
swamp
terrestrialsoils
fluvial
floodplain/overbank
?fluvial
?fluvial/meandering
Potomac Fm.– unit 2
363.6
?
Clay
Silty clay
Silt
Muddy sand/sandy mud
Quartz sand
Glauconite
Fine/very finequartz sand
Sphaerosiderite
Medium and coarsergrained quartz sand
Clay and silt
Cemented
Glauconitesand
Other
Mica
B – BarrenMFS – Maximum Flooding surface
SB – Sequence BoundaryGravelly/gravel
Cross bed
Glauconiteg g
Lignite/lignitic
Shells/shelly
Burrows/bioturbated
De
pth
(ft
)
250
300
150
200
350
LithologyCumulative
percentGeophysical logs Environment
F5. Stratigraphy for Potomac Unit 3, p. 40.
Mo t
tled
Mo t
tled
Org
a nic
ric
hO
rga n
ic r
i ch /
Sa n
d y
Pot
o mac
For
ma t
ion
– u n
it 2
508.
1555
5.1
“low
er a
q uife
r ”
417.
7
25 50 75
10050 150
Resistivity
ZoneIIC-III?
Zone IIC
Zone IIC
Zone IIB
Zone IIB
Zone IIBorZone I
B
B
terrestrialsoils
floodplain/overbank
oxbow
overbank
fluvial
lacustrineflood plain
lacustrine
terrestrialsoils
lacustrine
?fluvial
crevassesplay
50 363.
659
9.7
Rec
over
y
Gamma Biostratigraphy
Formation
Clay
Silty clay
Silt
Muddy sand/sandy mud
Quartz sand
Glauconite
Fine/very finequartz sand
Sphaerosiderite
Medium and coarsergrained quartz sand
Clay and silt
Cemented
Glauconitesand
Other
Mica
B – BarrenMFS – Maximum Flooding surface
SB – Sequence BoundaryGravelly/gravel
Cross bed
Glauconiteg g
Lignite/lignitic
Shells/shelly
Burrows/bioturbated
Dep
th (
ft)
LithologyCumulative
percentGeophysical logs Environment
400
450
500
550
600
F6. Stratigraphy for Potomac Unit 2, p. 41.

P.J. SUGARMAN ET AL.CHAPTER 4, FORT MOTT SITE 11
delta front deposits (Fig. F3B). We consider that the Potomac Formationwas deltaically influenced but also propose that the depositional envi-ronment encompasses elements of an anastomosing river environment,(Fig. F3A) corresponding well with much of the observed Potomac fa-cies (Figs. F3A, F5, F6, F7).
Anastomosed systems are streams that are divided into multiple co-existent channels that have stable islands or bars separating the chan-nels (Smith and Smith, 1980). Bar stability is provided by either vegeta-tion or fine-grained sediments or both working together (Makaske,2001). Anastomosed systems differ from braided systems in that thechannel and bar stability in the anastomosed system prevents the riverfrom reworking sediments and organic-rich sediments. As a result, anas-tomosed systems are dominated by fine floodplain deposits and or-ganic-rich sediments or coals. Channel sands in the anastomosed sys-tem are generally more confined and tend to aggrade (Makaske, 2001).Anastomosing rivers are believed to form by avulsion splitting the pri-mary flow into two or more channels. Avulsion is facilitated by a low-gradient floodplain and by rapidly elevating baselevel control down-stream (Smith and Smith, 1980). Rapid sea level rise in the Holocene isconsidered a factor in elevating base level, leading to anastomosis(Makaske, 2001), and such a model may be applicable to the mid-Creta-ceous at Fort Mott. Because anastomosing rivers are aggradational fea-tures, their chances for preservation are good.
Major environments and sedimentary facies for the anastomosingriver system were described by Smith and Smith (1980), and we followtheir classification (Fig. F3A). Two major environments are found in ananastomosed system. The channel facies consists of gravel and coarsesand (Fig. F3A). In contrast, fine-grained overbank deposits composethe majority of the sediments (Fig. F3A). Levees flanking the rivers con-sist of sandy silt and silty sand containing roots. Low areas betweenlevees have lakes and peat bogs or back swamps; they are differentiatedbased upon the frequency with which they receive water and their con-nection to the main channels. Lakes are intermittently supplied withfine sediment including laminated clay and silty clay with sparse or-ganic matter. Peat bogs and back swamps have no direct connection tothe main channels and may receive clastic sediments only during timesof flood. Sediments are organic-rich (up to 98% organic matter) siltyclay and clayey silt. Finally, crevasse splays are recognized as thin layersof sand and fine gravel rarely more than 40 cm thick (Smith and Smith,1980).
An outstanding question is the extent to which the anastomosingenvironment includes the upper delta plain environments. Many mod-ern workers now consider the channels in a deltaic environment to befundamentally similar to anastomosing channels in a continental set-ting (see Makaske, 2001, for discussion). Thus, the contrast with thedeltaic model outlined by Owens et al. (1970) is minor except for theinterpretation of the sand bodies.
The anastomosing model (Fig. F3A) does not adequately explain thethick sand bodies at the base of the Potomac Formation Units 3 and 2(290.65–363.6 ft [88.59–110.83 m] and 555.1–599.7 ft [169.19–182.79m], respectively). These sand bodies appear to be laterally continuousand may extend from New Jersey into Delaware. They can be traced ongamma logs within New Jersey a distance of 24 mi (40 km). Such wide-spread sand sheets are difficult to explain using the anastomosingstream model. The thick widespread nature of sands at the base of Poto-mac Unit 3 have the geometry of a delta front shoreline sand, although
T. D. 820 ft
615.
475
376
079
5
Mot
tled
San
d y/s
ilty
Mo t
tled
San
dy
25 7550
50 100 150 50
Resistivity
Zone IIBorZone 1
Zone I
lacustrine
lacustrine/soil
fluvial/lacustrine/overbank
terr
estr
ial s
o ils
o ve r
p rin
t ing
o ve r
b an k
de p
o sits
channel fill
swamp
Pot
omac
For
ma t
ion
– u n
it 1
Pot
o ma c
For
ma t
ion
– u n
it 2
o r u
nit 1
710.
6
colluvium?
colluvium?
floodplain
Zone IIBorZone 1
644.
159
9.7
Mot
tled
Sa n
dy
Rec
over
y
Gamma Biostratigraphy
Formation
Clay
Silty clay
Silt
Muddy sand/sandy mud
Quartz sand
Glauconite
Fine/very finequartz sand
Sphaerosiderite
Medium and coarsergrained quartz sand
Clay and silt
Cemented
Glauconitesand
Other
Mica
B – BarrenMFS – Maximum Flooding surface
SB – Sequence BoundaryGravelly/gravel
Cross bed
Glauconiteg g
Lignite/lignitic
Shells/shelly
Burrows/bioturbated
Dep
th (
ft)
LithologyCumulative
percentGeophysical logs Environment
650
700
750
800
600
terrestrialsoils
terrestrialsoils
channel fill
F7. Stratigraphy for Potomac Units 2 and 1, p. 42.

P.J. SUGARMAN ET AL.CHAPTER 4, FORT MOTT SITE 12
no direct marine evidence has been uncovered within them. If this in-terpretation is correct, then at least for Potomac Unit 3 the sedimentsmay represent a transgressive–regressive cycle, with delta front sands(Fig. F3B) being prograded over by an anastomosed river system or deltaplain deposits, including lower delta plain interdistributary lakes,marshes and swamps, and upper delta plain deeply weathered soils.
Cape May Formation
Interval: 1.5–27.7 ft (0.46–8.44 m)Age: ?middle–late Pleistocene–?Holocene
Below a fill typified by coal (1.0–1.5 ft; 0.30–0.45 m), fine–mediumlaminated silty quartz sand (1.5–2.1 ft; 0.45–0.64 m) and heavily bur-rowed sandy silt (6.0–7.85 ft; 1.83–2.39 m) were deposited in estuarineenvironments (Fig. F4) similar to the adjacent Delaware River estuary.Fine sands with interbedded silty clays appear from 7.85 to 8.7 ft (2.39to 2.65 m) and overlie a gravelly sand (9.9–11.1 ft; 3.02–3.38 m) thatcoarsens downsection to gravel (16.2–16.4 ft; 4.93–5.00 m). This patternof gravel grading up to sand repeats at 16.4–19.6 ft (5.00–5.97 m) basedon the gamma log and is interpreted as channels in an estuary. A softtwisted clay (20–20.9 ft; 6.10–6.37 m), reflecting some coring distur-bance, overlies orange-colored slightly sandy silt (20.9–21.4 ft; 6.37–6.52m), returning to gray silty clay (21.4–21.6 ft; 6.52–6.58 m). Silty clay(25.0–26.4 ft; 7.62–8.05 m) grades down to silty, slightly clayey, mica-ceous laminated sand that becomes coarser downsection from 26.95 to27.7 ft (8.21 to 8.44 m) to a gravel channel fill at 27.5–27.7 ft (8.38–8.44m). A sharp contact at 27.7 ft (8.44 m) separates the gravel from lami-nated silty clay of the Cretaceous below.
The complex juxtaposition of channel gravels, cross-bedded to lami-nated sands, sandy silts, and burrowed clays is typical of estuarine envi-ronments. The burrowed clays, silts, sands, and gravels between 1.5 and27.7 ft (0.46 and 8.44 m) at Fort Mott, New Jersey, are interpreted ashighstand “Delaware Bay” deposits. In New Jersey, these sediments aregenerally assigned to the Cape May Formation (Newell et al., 2000).Across the Delaware River, this unit would be assigned to the LynchHeights or Scotts Corner Formation (Ramsey, 1993).
Marshalltown?/Upper Englishtown? Formation
Interval: 27.7–36.1 ft (8.44–11.00 m)Age: Campanian
A major lithologic change appears at an erosional surface at 27.7 ft(8.44 m), separating poorly sorted sands above (the Pleistocene–Holocene? Cape May Formation) from silty, micaceous, laminated Cre-taceous clays below (Fig. F4). Clays from 27.7 to 32 ft (8.44 to 9.75 m)are weathered to a light gray from the typical dark greenish clays below32 ft (9.75 m); they are slightly siltier in the top 0.5 ft (0.15 m). The colordifference appears to be because of subaerial exposure of these marineclays. The clays continue to 35.9 ft (10.94 m), contain rare pyrite andflakes of plant debris, display faint silty laminae, are slightly micaceous,and are burrowed with 2- to 10-mm-diameter sand-filled burrows. Theclays are siltier and slightly sandier near the base. A thin glauconite sand(35.9–36.1 ft; 10.94–11.00 m) is mixed with silty clay and concretions.

P.J. SUGARMAN ET AL.CHAPTER 4, FORT MOTT SITE 13
A distinct contact at 36.1 ft (11.00 m) separates glauconite sandabove from quartz sand below and is interpreted as a prominent UpperCretaceous sequence boundary separating a glauconitic clay from siltyupper HST sand. The section from 27.1 to 36.1 ft (8.26 to 11.00 m) ap-pears to represent a distinct sequence (Figs. F2, F4). It overlies sands as-signed to the Englishtown Formation and clays assigned to the Wood-bury Formation below, and thus could be the equivalent of the lowerclayier facies of the “upper” Englishtown Formation, or a clayey, lessglauconitic facies of the Marshalltown Formation.
Englishtown Formation
Interval: 36.1–60 ft (11.00–18.29 m)Age: Campanian
Micaceous, clayey-silty fine to medium quartz sand with plant debris(36.1–38.7 ft; 11.00–11.80 m) composes the HST of a sequence that is as-signed to the lower Englishtown Formation. Burrowed, micaceous, verysilty sands to sandy silts (upper HST; 50–60 ft; 15.24–18.29 m) appear be-low an interval of poor recovery (38.7–50.0 ft; 11.80–15.24 m). Thesefiner-grained sediments reflect a downward-fining succession. Theboundary with the underlying Woodbury Formation is tentativelyplaced at the downhole appearance of >50% silt and clay (Fig. F4) at ~60ft (18.29 m), although this contact is admittedly gradational and couldbe placed slightly higher upsection.
Woodbury Formation
Interval: 60–100.7ft (18.29–30.69 m)Age: Campanian
Micaceous silts and clays with sand laminae below 60 ft (18.29 m) aretentatively assigned to the Woodbury Formation, although previousmapping suggested that the Woodbury pinches out along strike north ofFort Mott (Owens et al., 1970). Silts and clays that we assign to theWoodbury Formation at Fort Mott may be equivalent to a finer-grainedfacies of the Englishtown Formation (Owens et al., 1970) (Fig. F4); thisfacies has been previously assigned to the Merchantville Formation inNew Jersey at outcrop (Owens et al., 1970) (Fig. F4) and Delaware (Ben-son and Spoljaric, 1996). The assignment of this unit at Fort Mott toZone CC19 (Fig. F4) agrees with correlations to the Woodbury sequence(Miller et al., 2004).
A trace of shells appears in the very micaceous, slightly clayey siltswith burrowed sand laminae, between 60 and 63.6 ft (18.29 and 19.39m). The sediments continue to fine downsection, with very clayey siltswith scattered sand laminae (70–90 ft; 21.34–27.43 m) to predomi-nantly silty clay with fewer sand laminae (below 90 ft; 27.43 m) and atrace of shell material; the mica also becomes finer grained downsec-tion. The sediments are highly bioturbated, with burrows filled withvery fine sand. Traces of glauconite appear at 94 ft (28.65 m) and be-come common (2%–5% of the core) below 99 ft (30.18 m). Glauconitesand increases at 100.7 ft (30.69 m), where there is concentration ofgypsum on the core surface (100.5–100.6 ft; 30.63–30.66 m), an ammo-nite? fragment (100.7 ft; 30.69 m), and a minor gamma ray peak (Fig.F4); the contact with the underlying Merchantville Formation is grada-tional and a maximum flooding surface (MFS) is placed at this point.

P.J. SUGARMAN ET AL.CHAPTER 4, FORT MOTT SITE 14
The Woodbury Formation at Fort Mott was deposited in a prodelta en-vironment. Calcareous nannoplankton Zone CC19 (Campanian) wasidentified from the Woodbury Formation at 61.5, 71.1, and 73.6 ft(18.8, 21.67, and 22.43 m; see “Biostratigraphy,” p. 28).
Merchantville Formation
Interval: 100.7–113.3 ft (30.69–34.53 m)Age: Campanian [Santonian?]
The Merchantville Formation in the Fort Mott borehole is mainly aglauconitic, slightly quartzose silt to glauconite silty clay to glauconite-quartzose silty sand (Fig. F4). The section from 100.7 to 108 ft (30.69 to32.92 m) consists of glauconitic-rich clay layers interbedded with lessglauconitic clay. The unit is heavily burrowed with prominent largeclay-lined burrows. Between 100.7 and 105 ft (30.69 and 32.00 m), large(5 mm–5 cm) indurated brown clay burrows/clay blebs (weathered shellmaterial?) yield a mottled brown-green aspect to the core; less common,smaller brown burrows are found from 105 to 108 ft (32.00 to 32.92 m),and scattered, small brown burrows continue below this. Below 104.0 ft(31.70 m), the section consists of glauconitic, quartzose, very silty,slightly clayey sand with sandy burrow fills that continues to 113.3 ft(34.53 m); the section is heavily burrowed and has less glauconite, lessclay, and fewer brown clay burrows than above. This suggests a generaltransgression from 104 to 113.3 ft (31.70 to 34.53 m), a condensed sec-tion from 104 to 100.7 ft (31.70 to 30.69 m), and an MFS at 100.7 ft(30.69 m). The Merchantville Formation at Fort Mott was deposited inneritic (middle?) environments. No age-diagnostic nannofossils or pol-len were identified.
Cheesequake Formation
Interval: 113.3–125 ft (34.53–38.10 m)Age: ?Campanian or ?Santonian
At 113.3 ft (34.53 m), there is a shift from glauconitic silt/silty sandabove to glauconite-free silt below (Fig. F4). Glauconite is burroweddown to 114.25 ft (34.82 m), and it was difficult to pick out a distinctcontact until the core was split. This silt is assigned to the CheesequakeFormation of Litwin et al. (1993) based on lithologic similarity and stra-tigraphic position between the Merchantville and Magothy Formations.The Cheesequake Formation consists of a single sequence containing avery micaceous, highly bioturbated “blue” silt; traces of glauconite ap-pear downsection at 118.5 ft (36.12 m) and increase downsection to ahighly burrowed, slightly glauconitic silt with clay-lined burrows at thebase. Small granules and pebbles on the outside of the core appear to bewashed downhole except for pebbles at the base of the succession below119 ft (36.27 m). These pebbles were probably reworked from the Mag-othy Formation. (A shark tooth was found at 121.6 ft; 37.06 m.) TheCheesequake Formation at Fort Mott was deposited in neritic (inner–middle?) environments. It composes a truncated sequence with a thin(<5 ft; 1.52 m) TST consisting of glauconitic silt and a thicker (>7 ft; 2.13m) lower HST consisting of silt; upper HST sands are absent at Fort Mott.In this region sands reported from the “lower Merchantville Formation”near Camden (Farlekas et al., 1976) are considered HST deposits. A chert

P.J. SUGARMAN ET AL.CHAPTER 4, FORT MOTT SITE 15
pebble that blocked the core barrel at 124.8 ft (38.04 m) may mark thecontact with the underlying Magothy Formation.
Magothy Formation
Interval: 125–141.1 ft (38.10–43.01 m)Age: Coniacian/Turonian?
The Magothy Formation was first encountered at 130 ft (39.62 m) be-low a coring gap (124.8–130 ft; 38.04–39.62 m), where it consists ofmoderately well sorted, lignitic, medium quartz sand. We place the con-tact at 125 ft (38.10 m) based on the gamma and resistivity log signature(Fig. F4) that indicates sands below ~125 ft (38.10 m). Sands are brokenby a thin gray clay (136.0–137.0 ft; 41.45–41.76 m) with thin sand inter-beds and lignite beds (136.1–136.3 and 136.8–136.85 ft; 41.48–41.54and 41.70–41.71 m). A pyrite nodule is present at 136.7 ft (41.67 m).Sands similar to above recur at 137.0–137.3 ft (41.76–41.85 m), with adark gray clay layer from 137.3 to 137.9 ft (41.85 to 42.03 m), switchingback to sands from 137.9 to 138.2 ft (42.03 to 42.12 m), a clay from 138.2to 138.4 ft (42.12 to 42.18 m), a coring gap from 138.4 to 140 ft (42.18to 42.67 m), interlaminated lignitic clay and fine–medium sand from140 to 140.9 ft (42.67 to 42.95 m), and a granular medium–very coarsesand bed (140.9–141.1 ft; 42.95–43.01 m) with lignitic chunks at a dis-tinct contact at 141.1 ft (43.01 m).
The very thin Magothy Formation (16.1 ft; 4.91 m) here appears tocompose one sequence (Magothy II) (Miller et al., 2004) deposited influvial (lower delta plain?) or upper estuarine environments. The Rari-tan Formation and its downdip equivalent, the Bass River Formation,are cut out at Fort Mott, with the Magothy Formation directly overlyingthe Potomac Formation. The Magothy Formation at Fort Mott is as-signed to pollen Zone V of Christopher (1982), which is generally corre-lated with the upper Turonian–Santonian; the absence of stratigraphi-cally higher advanced Normapolles suggests late Turonian.
Potomac Formation
Interval: 141.1–820 ft (43.01–249.94 m)Age: earliest Cenomanian to Aptian (possibly Barremian)
The Potomac Formation can be lithostratigraphically subdivided intoat least three distinct units based on successions of medium to finequartz sands overlain by fine-grained units (clay and silty clay). Thehighest, Potomac Unit 3, is well defined at its base (363.6 ft; 110.83 m)by the contact of the “middle aquifer” sands with an underlying confin-ing unit (Figs. F2, F5). The base of the middle unit, Potomac Unit 2,could be placed at the base of the “lower aquifer” (599.7 ft; 182.79 m) orslightly lower at the base of an unnamed sand (644.1 ft; 196.32 m). Thelowest, Potomac Unit 1, also has a medium to fine quartz sand that rep-resents the lowest section recovered at Fort Mott.
The Potomac Formation elsewhere in the Atlantic coastal plain isbiostratigraphically subdivided using palynology into Zone I (?Barre-mian–Aptian), Zone II (Albian), and Zone III (Albian–lower Cenoman-ian). At Fort Mott, there is a general correspondence of the lithostrati-graphic zones defined in this study to the biostratigraphic zones of thesame number. The possible exception is the placement of the base ofUnit 2 and with respect to the base of Zone II. The base of lithostrati-
P.J. SUGARMAN ET AL.CHAPTER 4, FORT MOTT SITE 16
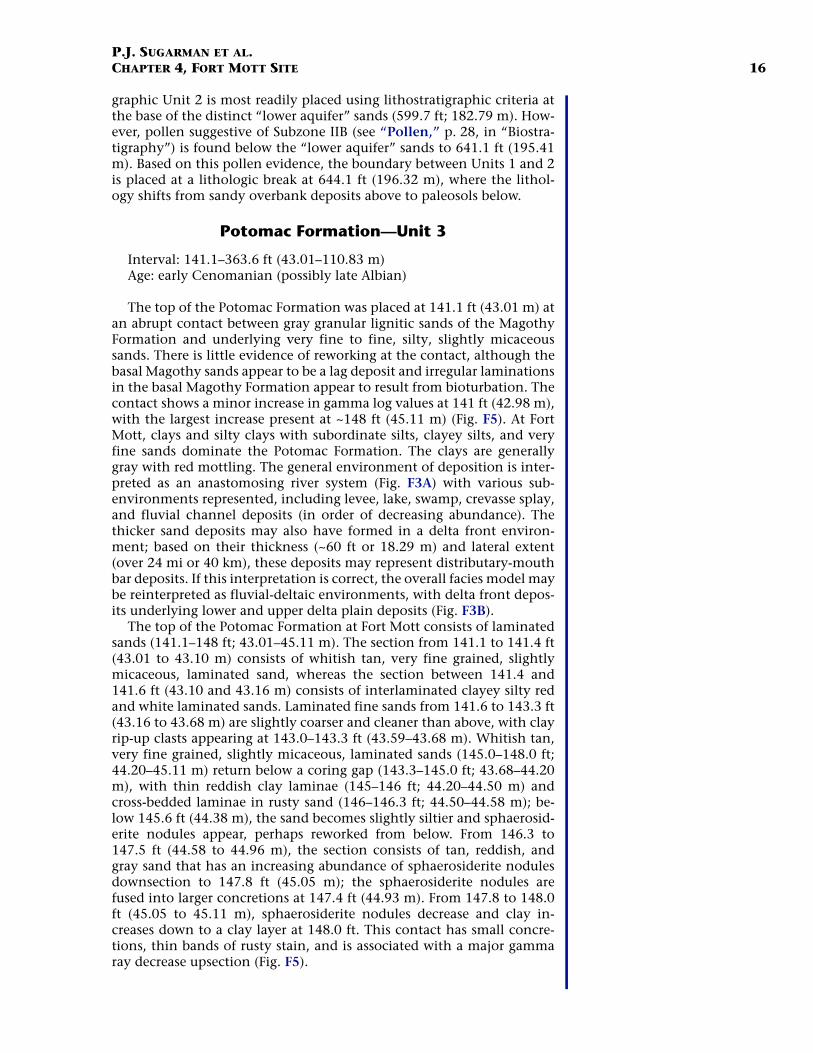
graphic Unit 2 is most readily placed using lithostratigraphic criteria atthe base of the distinct “lower aquifer” sands (599.7 ft; 182.79 m). How-ever, pollen suggestive of Subzone IIB (see “Pollen,” p. 28, in “Biostra-tigraphy”) is found below the “lower aquifer” sands to 641.1 ft (195.41m). Based on this pollen evidence, the boundary between Units 1 and 2is placed at a lithologic break at 644.1 ft (196.32 m), where the lithol-ogy shifts from sandy overbank deposits above to paleosols below.
Potomac Formation—Unit 3
Interval: 141.1–363.6 ft (43.01–110.83 m)Age: early Cenomanian (possibly late Albian)
The top of the Potomac Formation was placed at 141.1 ft (43.01 m) atan abrupt contact between gray granular lignitic sands of the MagothyFormation and underlying very fine to fine, silty, slightly micaceoussands. There is little evidence of reworking at the contact, although thebasal Magothy sands appear to be a lag deposit and irregular laminationsin the basal Magothy Formation appear to result from bioturbation. Thecontact shows a minor increase in gamma log values at 141 ft (42.98 m),with the largest increase present at ~148 ft (45.11 m) (Fig. F5). At FortMott, clays and silty clays with subordinate silts, clayey silts, and veryfine sands dominate the Potomac Formation. The clays are generallygray with red mottling. The general environment of deposition is inter-preted as an anastomosing river system (Fig. F3A) with various sub-environments represented, including levee, lake, swamp, crevasse splay,and fluvial channel deposits (in order of decreasing abundance). Thethicker sand deposits may also have formed in a delta front environ-ment; based on their thickness (~60 ft or 18.29 m) and lateral extent(over 24 mi or 40 km), these deposits may represent distributary-mouthbar deposits. If this interpretation is correct, the overall facies model maybe reinterpreted as fluvial-deltaic environments, with delta front depos-its underlying lower and upper delta plain deposits (Fig. F3B).
The top of the Potomac Formation at Fort Mott consists of laminatedsands (141.1–148 ft; 43.01–45.11 m). The section from 141.1 to 141.4 ft(43.01 to 43.10 m) consists of whitish tan, very fine grained, slightlymicaceous, laminated sand, whereas the section between 141.4 and141.6 ft (43.10 and 43.16 m) consists of interlaminated clayey silty redand white laminated sands. Laminated fine sands from 141.6 to 143.3 ft(43.16 to 43.68 m) are slightly coarser and cleaner than above, with clayrip-up clasts appearing at 143.0–143.3 ft (43.59–43.68 m). Whitish tan,very fine grained, slightly micaceous, laminated sands (145.0–148.0 ft;44.20–45.11 m) return below a coring gap (143.3–145.0 ft; 43.68–44.20m), with thin reddish clay laminae (145–146 ft; 44.20–44.50 m) andcross-bedded laminae in rusty sand (146–146.3 ft; 44.50–44.58 m); be-low 145.6 ft (44.38 m), the sand becomes slightly siltier and sphaerosid-erite nodules appear, perhaps reworked from below. From 146.3 to147.5 ft (44.58 to 44.96 m), the section consists of tan, reddish, andgray sand that has an increasing abundance of sphaerosiderite nodulesdownsection to 147.8 ft (45.05 m); the sphaerosiderite nodules arefused into larger concretions at 147.4 ft (44.93 m). From 147.8 to 148.0ft (45.05 to 45.11 m), sphaerosiderite nodules decrease and clay in-creases down to a clay layer at 148.0 ft. This contact has small concre-tions, thin bands of rusty stain, and is associated with a major gammaray decrease upsection (Fig. F5).
P.J. SUGARMAN ET AL.CHAPTER 4, FORT MOTT SITE 17
The sequence and environmental significance of these laminatedsands is unclear: (1) it is unclear if this sand is a local overbank environ-ment (e.g., crevasse splay), a local fluvial meandering sand, or a region-ally significant sand; and (2) although the sands are bracketed byabrupt erosional contacts, the lower surface may be a local erosionalfeature of a fluvial/alluvial plain environment, whereas the upper sur-face is clearly the contact with the Magothy Formation and has regionalsignificance. The interval at 125–148 ft (38.10–45.11 m) is correlativewith the upper aquifer within the PRM aquifer system (Fig. F2). Thisaquifer, a major water producer to the north–northeast in Salem andGloucester Counties, is a minor aquifer here, as well as to the south. Forexample, wells at Fort Mott and adjacent Finns Point are screened inthe aquifer below (291.4–310.6 ft; 88.82–94.67 m), within the PotomacFormation (middle aquifer of the PRM aquifer system).
Slightly silty clay with hard concretions present from 148 to 149 ft(45.11 to 45.42 m), and 150 to 153 ft (45.72 to 46.63 m) is mostly lightgray with mottling of greenish gray and dusky red. A gray clay (153–153.5 ft; 46.63–46.79 m) and very fine sand with orange mottling(153.5–154.3 ft; 46.79–47.03 m) overlie a thicker interval of interlami-nated silty clay and very fine sand with scattered cross laminations(154.3–164.2 ft; 47.03–50.05 m) and indications of deformed laminae(soft sediment deformation?) (155–158 ft; 47.24–48.16 m). The sectionat 157–158 ft (47.85–48.16 m) is darker gray than above or below withscattered lignite and may be more organic rich. The mottled clays andinterlaminated clay-sands were deposited in subaerial overbank andsubaqueous overbank (e.g., swamp) environments, respectively.
A thick interval of interfluvial mottled clay paleosols appears belowthe interlaminated clay and sand. Whitish gray to light gray silty claywith clayey silt laminae and red mottles are present from 164.2 to 256.8ft (50.05 to 78.27 m). The silty clay contains dusky red zones with con-cretions (172.6, 173.5, and 175.0 ft; 52.61, 52.88, and 53.34 m), whichinclude features resembling root traces and drab halos around roottraces (164–172.6 ft; 49.99–52.61 m; spanning a coring gap from 167–170 ft; 50.9–51.82 m). From 180 to 182 ft (54.86 to 55.47 m), the lightgray silty clay contains thin olive and red bands and sphaerosideritenodules with reddish rinds (?hematite). From 182 to 195.7 ft (55.47 to52.61 m), the whitish gray silty clay is banded with hematitic red siltyclays with sphaerosiderite nodules and a few root traces (190–191,192.5–193.5, and 195–195.3 ft; 57.91–58.22, 58.67–58.98, and 59.44–59.53 m). The section at 195.7–197.7 ft (59.65–60.26 m) is a mostly redand olive-brown mottled silty clay, whereas that at 197.7–200.2 ft(60.26–61.02 m) is a banded light gray and olive-gray silty clay. Mottledred and gray very fine sandy silt with sphaerosiderite nodules with red-dish rinds (201.8–203 ft; 61.51–61.87 m) breaks an otherwise monoto-nous series of clays. The interval from 203.8 to 215.2 ft (62.12 to 65.59m) is a banded to mottled red (orange and dusky) and white silty claywith sphaerosiderite nodules. Red silty clay with thin whitish bands(215.3–217.2, 219.4–220.0, and 223–223.7 ft; 65.62–66.20, 66.87–67.06,and 67.97–68.18 m) alternate with the banded to mottled red (orangeand dusky) and white silty clay with sphaerosiderite nodules. At 223.7ft (68.18 m), there is a surface overlying intensely mottled whitish siltyclay that shows signs of breccia-like fabric (223.7–225.6 ft; 68.18–68.76m). Red and white mottled silty clays that persist from 225.6 to 248.2 ft(68.76 to 75.65 m) can be split into more intensively mottled redder in-tervals (227.0–230.3, 234.0–236.5, and 247.7–248.2 ft; 69.19–70.20,71.32–72.09, and 75.50–75.65 m), whiter intervals with sphaerosiderite

P.J. SUGARMAN ET AL.CHAPTER 4, FORT MOTT SITE 18
nodules (230.3–234 and 241.5–245.5 ft; 70.20–71.32 and 73.61–74.83m), and mottled gray and red intervals (236.5–241.5 and 245.5–247.7ft; 72.09–73.61 and 74.83–75.50 m). A contact at 248.2 ft (75.65 m) sep-arates red clay from brown, white, and red mottled silty clay where themottles extend over 0.5 ft (0.15 m; 248.2–250.2 ft; 75.65–76.26 m).There is transition from 250.2 to 256.8 ft (76.26 to 78.27 m) thatchanges downsection from alternating light gray and olive-gray mot-tled silty clay with sphaerosiderite nodules to darker gray silty clay(254–256.0 ft; 77.42–78.03 m) to organic-rich (lignitic) clayey silt(256.0–256.8 ft; 78.03–78.27 m) to a contact at 256.8 ft (78.27 m). Thisdarkening downsection reflects a change in environmental oxidationfrom mottled paleosols above to swampy subaqueous environments be-low.
A thin break of very fine to fine sandy clayey silt with common lig-nite and disseminated pyrite (256.8–259.9 ft; 78.27–79.22 m) underliesthe paleosols and overlies an erosional contact with another interval ofpaleosols at 259.9 ft (79.22 m). Rusty mottling at 258.0–259.0 ft (78.64–78.94 m) and rare reddish clay mottles at 259.3 ft (79.03 m) documentincipient soil formation in this predominantly subaqueous environ-ment. Otherwise, the section from 259 to 259.9 ft (78.94 to 79.22 m) isgray with abundant charcoal (the charcoal may document dry seasonforest fires). There are granules at the irregular contact at 259.9 ft (79.22m). This section represents deposition in a swampy floodplain environ-ment and a possible rise/fall of baselevel.
Mottled paleosol clays return from 259.9 to 274.8 ft (79.22 to 83.76m). From 259.9 to 262 ft (79.22 to 79.86 m), oxidized sediments re-appear, characterized by predominantly light gray to light olive-tansilty clay with minor red mottling and sphaerosiderite nodules with he-matite rinds. The interval at 262–265 ft (79.86–80.77 m) is predomi-nantly red mottled silty clay with light gray to light olive-tan mottles,decreasing sphaerosiderite nodules, and increasing dusky red mottlingdownsection. From 265 to 270 ft (80.77 to 82.30 m), the lithology re-turns to light gray to light olive-tan clay with common dusky red mot-tles, whereas that at 270–274.8 ft (82.30–83.76 m) returns to red siltyclay with extensive light gray to light olive mottles. The mottles crosscut, suggesting multiple generations of formation; some follow crackswhereas other halos are probably root traces. This lithology continuesfrom 280 to 280.8 ft (85.34 to 85.59 m) below a coring gap (274.8–280ft; 83.76–85.34 m). The section from 280.8 to 281 ft (85.59 to 85.65 m)is a light gray silty clay, whereas that at 281–283.3 ft (85.65–86.35 m) ismedium gray silty clay with reddish mottles near the bottom. The sec-tion below 282.8 ft (86.20 m) is a slightly sandy clay. Below a coring gap(283.3–290 ft; 86.35–88.39 m) are gray silts with very fine to fine sandand common sphaerosiderite nodules with hematite rinds (290–290.65ft; 88.39–88.59 m) that overlie a distinctive bright red slightly sandyclayey silt (290.65–290.95 ft; 88.59–88.68 m). The clays from 259.9 to290.95 (79.22 to 88.68 m) represent terrestrial soils developed on anoverbank.
A shift in sediment type to a predominantly sand section with a fewmud breaks characterizes the core from 290.65 to 363.6 ft (88.59 to110.83 m). Sands and silty sands are present from 290.65 to 296.7 ft(88.59 to 90.43 m). These whitish, very fine “sugar” sands include siltierzones (290.95–291.1 and 293.6–293.7 ft; 88.68–88.73 and 89.49–89.52m), with silt lamina, mica, disseminated sphaerosiderite nodules, andopaque heavy mineral laminae common throughout. The sands at293.65–296.7 ft (89.50–90.43 m) are fine–medium grained, have less

P.J. SUGARMAN ET AL.CHAPTER 4, FORT MOTT SITE 19
silt, are laminated to cross laminated in places (including opaque min-eral lamination), and are slightly brownish (because of intrusion ofdrilling mud). A very coarse sand with gravel appears below a sharpcontact at 296.7 ft (90.43 m). The gravel is coarsest from 297.0 to 297.3ft (90.53 to 90.62 m), with grains up to 1 cm in diameter. The changefrom this gravelly sand to progressively finer clasts up to 290 ft (88.39m) appears to represent a fining-upward fluvial succession. This gravellysand is underlain by a structureless medium to coarse quartz sand at297.3–298.5 ft (90.62–90.98 m).
The underlying section consists of several fining-upward fluvial suc-cessions from pebbly granule beds to fine–medium sands: 300–300.4,300.4–302.5, 302.5–306.7, and 306.7–310.6 ft (91.44–91.56, 91.56–92.20, 92.20–93.48, and 93.48–94.67 m). Opaque black mineral lami-nae are present in the sands. It is not clear if these sands aremeandering, anastomosing, or delta front; the repetitive reasonablythick (2–4 ft; 0.61–1.22 m) successions of granules to fine sand with in-clined laminations indicative of trough cross beds may have been de-posited in anastomosing (or possibly meandering) environments. Thebase of the sand–granule succession is at 310.6 ft (94.67 m) where claysreturn.
The sand from 290.65 to 310.6 ft (88.59 to 94.67 m) composes anaquifer screened at nearby Finns Point. This is the “upper sand” of themiddle aquifer of the PRM aquifer system; this “upper middle” sand canbe identified at Artificial Island near Salem, New Jersey (well 33–401; 10mi [16 km] to the south) (Cauller et al., 1999), at Clayton, New Jersey(24 mi [40 km] to the east) (Owens et al., 1998), and Delaware City, Del-aware (3 mi [5 km] to the southwest) (Benson and McLaughlin, 2001;McLaughlin and Benson, 2002) and is thus laterally persistent. It is ab-sent at New Castle, Delaware (3 mi [5 km] to the north) (Benson andMcLaughlin, 2001; McLaughlin and Benson, 2002). This lateral persis-tence suggests that the sands may be part of a larger deltaic system andpossibly a delta front sand.
From 310.6 to 320.3 ft (94.67 to 97.63 m), the core consists of mica-ceous clayey silts characterized by an alternation between light bluishgray, gray with purple mottles (including banding and halos aroundroot traces), and gray with red clayey mottles. The environment is inter-preted as floodplain/overbank altered by soil-formation processes. Themicaceous silts probably reflect provenance, with a source from thenearby Piedmont.
The section recovered from 320.4 to 337.9 ft (97.66 to 102.99 m) ispredominantly sand. The sands fine upsection from slightly micaceousmedium–coarse at the base (337.9 ft; 102.99 m) to micaceous, silty, veryfine sand with laminations of opaque heavy minerals at the top. A thinclay interval indicated on the gamma log was poorly recovered (328–330 ft; 99.97–100.58 m), although the section at 327.8–328 ft (99.91–99.97 m) is slightly clayey silty sand. Silty clay appears at 337.9 ft(102.99 m) as shown by higher gamma log values (Fig. F5). Between337.9 and 352.15 ft (102.99 and 107.34 m), there are interbedded finesands and sandy clayey silts. The sand beds are very fine to mediumgrained, between 0.4 and 1.1 ft (12 and 34 cm) thick, and in manyplaces are invaded by red drilling mud. The silts commonly have inter-laminated clays and are light greenish gray.
The section is again dominated by sand from 352.15 to 363.6 ft(107.34 to 110.83 m). The sands range from medium to fine grained,have a few slightly silty zones, and display clay rip-up clasts (355–355.5and 361–361.5 ft; 108.20–108.36 and 110.03–110.19 m) and, in places,

P.J. SUGARMAN ET AL.CHAPTER 4, FORT MOTT SITE 20
show fining-upward packages. The coarser sands are red owing to drill-ing mud invasion. An irregular cemented sand appears at 355.9 ft(108.48 m). The base of the section consists of crumbly granular sands(362.8–363.6 ft; 110.58–110.83 m), iron cemented intervals (363.3–363.4 ft; 110.73–110.76 m), and charcoal (363.5–363.6 ft; 110.79–110.83 m). They are tentatively interpreted as meandering river depos-its, partly based on the lack of any evidence of marine deposition,although it is possible they are delta front. The contact at the base ofthe sands at 363.6 ft (110.83 m) may be a sequence boundary.
The sands from 320.4 to 363.6 ft (97.66 to 110.83 m) compose the“middle” (320.4–337.9 ft; 97.66–102.99 m) and “lower” (352.15–365 ft;107.34–111.25 m) part of the middle aquifer of the PRM aquifer system.Elsewhere (Owens et al., 1998), this aquifer has been assigned to pollenZone III (Cenomanian) (Benson and McLaughlin, 2001) and the confin-ing unit below has been assigned to Zone II (Albian). Most of PotomacUnit 3 is barren of pollen at Fort Mott (Fig. F5).
Potomac Formation—Unit 2
Interval: 363.6–599.7 ft (110.83–182.79 m)Age: Albian
The interval at 363.6–599.7 ft (110.83–182.79 m) is assigned to the Po-tomac Unit 2 (Figs. F6, F7). From 363.6 to 417.7 ft (110.83 to 127.31 m),the interval is a gray silty clay, frequently mottled red, with commonroot structures throughout; these are interpreted as paleosols. Four lith-ologic types are recognized in this interval based on the color and natureof mottling:
1. Light gray silty clays with subvertical 20- to 30-mm red mottlesinterpreted as root traces (365–367.5, 401–404, and 408–416 ft;111.52–112.01, 122.22–123.14, and 124.36–126.80 m); the sec-tion from 410 to 416 ft (124.97 to 126.801 m) has sphaerosider-ite nodules with hematite oxidation rims;
2. A similar lithology with abundant orange and dusky red smallmottles (approaching a breccia fabric) that appear to be intenseroot traces and soil cracks (e.g., 376–390 and 416–417.7 ft;114.60–118.87 and 126.80–127.31 m);
3. A more intensely mottled zone with subequal gray and red to apredominantly red mottled interval with thick root traces rang-ing from 30 to 40 mm and sphaerosiderite nodules (with hema-tite oxidation rims) (390–401 and 406–408 ft; 118.87–122.22and 123.75–124.36 m); and
4. Banded red and light gray silty clay (404–406 ft; 123.14–123.75m).
A transition to coarser, less oxidized facies appears below 417.7 ft(127.31 m). At 417.7–419 ft (127.31–127.71 m), the silty clays becometannish gray with increasing amounts of silt. Interbeds of very silty, veryfine sands appear at 419 ft (127.71 m), and the interlaminated siltyclays/clayey silts grade down to predominantly silty, very fine sands at420 ft (128.02 m). The gamma log shows low values from 417 to 438 ft(127.10 to 133.50 m), consistent with the higher sand content, althoughthis interval is too silty to compose an aquifer. At 424–426 ft (129.24–129.84 m) the sands gradually coarsen downsection from very silty, veryfine sand to silty fine sand to clean fine sand. The sand from 425.5 to

P.J. SUGARMAN ET AL.CHAPTER 4, FORT MOTT SITE 21
426 ft (129.69 to 129.84 m) contains reddish silty and organic-rich lam-inae with hints of cross bedding. From 426.0 to 426.3 ft (129.84 to129.94 m) the fine sand is siltier. The interval at 430–430.6 ft (131.06–131.25 m) is a light gray clayey sandy silt with common small charcoalfragments. A charcoal-rich bed (430.6–431.1 ft; 131.25–131.40 m) con-sists of a clayey, sandy silt matrix and charcoal up to 10 mm, a pyritenodule (431.0 ft; 131.37 m), and almost pure charcoal at the base. Belowthis is a bed (431.1–431.35 ft; 131.40–131.48 m) with interlaminatedclayey silt and charcoal flake layers. The interval at 431.35–432.1 ft(131.48–131.70 m) consists of two charcoal clast layers (431.35–431.45and 431.55–431.65 ft; 131.48–131.51 and 131.54–131.57 m) within azone dominated by clay rip-up clasts that include fragments of hema-tite(?), cemented and pyritic concretions, and charcoal, as well as com-mon very fine mica. The features evident from 425.5 to 432.1 ft (129.69to 131.70 m) indicate subaqueous overbank deposition within the flood-plain and, hence, more humid conditions in contrast to soil/subaerialdeposition in the section above. A surface in the core at 432.1 ft (131.70m) separates grayish brown lignite-rich clay above from laminated sandysilt and sand below.
The section at 432.1–438.0 ft (131.70–133.50 m) consists of me-dium–dark gray silty clay with a few interlaminated sands. Mica andcharcoal are common in both the silts and sands, with charcoal concen-trations at 433.5, 433.7, and 434.8 ft (132.13, 132.19, and 132.53 m)and a zone at 436.5–438 ft (133.05–133.50 m). In a few places there arereddish concretions and red clays (432.3 and 437.15 ft; 131.77 and133.24 m), with other scattered red clay beds. These interlaminated siltsand sands probably represent cutoff channel/oxbow lake sedimentationadjacent to a soil-forming floodplain.
More uniform finer-grained sediments return below a coring gap(438–440 ft; 133.50–134.11 m) associated with a gamma kick (439 ft;133.81 m). The section from 440 to 445 ft (134.11 to 135.64 m) consistsof fairly homogeneous light gray slightly clayey silt with commonsphaerosiderite nodules. This section probably represents an incipientsoil on the levee/overbank. Below this, the section becomes more lami-nated, more micaceous, darker gray slightly clayey silt with scattereddark (?organic rich) laminae (445–447.5 ft; 135.64–136.40 m). In situsphaerosiderite nodules are lacking from 445 to 446.3 ft (135.64 to136.03 m). This section probably represents more subaqueous influencethan above. Darker micaceous clayey silts with common scattered veryfine charcoal fragments and scattered very fine sand beds, sand-filledburrows or root traces, and very dark gray clay (447.5–452 ft; 136.40–137.77 m) appear to represent deposition in a fluvial-lacustrine envi-ronment (?oxbow lake). The unit below this (452–458.15 ft; 137.77–139.64 m) is similar, although slightly darker and lacking sand; itappears to be a lacustrine deposit.
An interesting contact is present at 458.8 ft (139.84 m). From 458.15to 458.8 ft (139.64 to 139.84 m), the lithology consists of an organic-rich clayey silt with graded, abundant dispersed charcoal (ranging insize from silt sized to 2 mm diameter) beds at its base. A yellowish tanclayey sandy silt below the contact (458.8–458.95 ft; 139.84–139.89 m)appears to represent subaerial weathering of the underlying subaqueoussilts (458.95–469.05 ft; 139.89–142.97 m). The contact at 458.8 ft(139.84 m) may represent a transition from a desiccated lake/overbankdeposit to a deeper-water lake above (i.e., a change to wetter condi-tions), although in marine facies this would be interpreted as a se-quence boundary.

P.J. SUGARMAN ET AL.CHAPTER 4, FORT MOTT SITE 22
Complex gray silt and clay facies deposited in subaqueous flood-basins appear below the 458.8 ft (139.84 m) contact: light gray clayeysilts (458.95–459.05 ft; 139.89–139.92 m), laminated clays with clay rip-up clasts and scattered charcoals (459.05–459.4 ft; 139.92–140.03 m),and dark grayish brown clayey silt with common dispersed charcoalfragments (459.4–460.0 ft; 140.03–140.21 m). The section from 460 to461 ft (140.21 to 140.51 m) is a clay that has been disturbed by coring.Interbedded gray clayey silt to silty clay with charcoal zones (461–466ft; 140.51–142.04 m) include clay rip-up clasts (e.g., 461.5 ft; 140.67 m).
Between 461 and 508.15 ft (140.51 and 154.88 m) the cores are pre-dominantly dark gray silty clay with dispersed fine plant debris, inter-bedded silty very fine sands, and scattered charcoal fragments. Specialfeatures include: (1) thin sand laminae; (2) slightly sandy, heavily bio-turbated sandy zones; and (3) cemented red lithified concentrations(Table T2). These red zones and concretions appear to be plinthites (ce-mented concretions) in an overbank/desiccated lake setting. Pyrite con-cretions appear at 463.8 ft (141.37 m).
Color varies in the clayey beds because of changing oxidation. From461 to 471 ft (140.51 to 143.56 m), they are light to medium gray; from471 to 471.5 ft (143.56 to 143.71 m), a lavender hue is present; at471.5–475 ft (143.71–144.78 m), the clays are light to medium gray;and brownish gray hues become common from 475 to 480 ft (144.78 to146.30 m). Color laminations of gray, light brown, and red dominatethe interval from 480 to 498.4 ft (146.30 to 151.91 m). The colorchanges at 498.4 ft (151.91 m) to a darker distinctly laminated darkgray with olive-gray bands. From 500.0 to 507.6 ft (152.40 to 154.72m), the section is interlaminated gray and tan. The color boundariestend to be more gradational than sharp.
These fine-grained sediments appear to have been deposited in smalllakes in a fluvial setting. The paucity of sand and lack of abundant or-ganic matter/pyrite argues against cutoff channel/oxbow lake sub-environments and points toward larger floodplain standing lakes. Al-though the burrowed sands are suggestive of estuarine environments,occasional soil concretions indicate subaerial exposure, consistent withephemeral lakes. There are hints of cyclicity on a small (2–3 ft; 60–90cm) scale in the gamma logs and cores and ~10-ft (3.05 m) cyclicity onthe gamma logs.
The section returns to red and light gray silts and clays at 508.25 ft(154.91 m) at a sharp contact. An indurated yellowish to blackishclayey silty sand (508.2–508.25 ft; 154.90–154.95 m) overlies the irregu-lar contact; this indurated interval is overlain by blebs of red clay(508.15–508.2 ft; 154.88–154.90 m), apparently reworked from below,and a return to blackish clayey silty sand (507.6–508.15 ft; 154.72–154.88 m). This contact could either be a sequence boundary or a faciesshift from soils in an alluvial floodplain to a lake in the floodplain.There is a change in gamma log signature at ~508.25 ft (154.95 m) fromsmaller, thinner variations above to thicker, large-scale variations be-low.
Mottled clays and silts deposited as soils appear below the 508.25 ft(154.95 m) surface and continue to a surface at 555.1 ft (167.98 m). Thesection at 508.25–508.55 ft (154.95–155.01 m) is banded red and lightolive-gray clay with sparse sphaerosiderite nodules overlying a coringgap. The section below this (510–512 ft; 155.45–156.06 m) consists of alight gray, slightly micaceous silty clay with common sphaerosideritenodules and red mottles following what appear to be large root traces.The interval from 512 to 515 ft (156.06 to 156.97 m) is a light gray, very
T2. Cumulative percent data, p. 45.

P.J. SUGARMAN ET AL.CHAPTER 4, FORT MOTT SITE 23
silty micaceous clay with small circular sand zones that may be root fillsand common sphaerosiderite nodules with hematite rinds that increasein abundance downsection.
The section is silty overall down to 515 ft (156.97 m), predominantlyclay from 517 to 520 ft (157.58 to 158.50 m), and returning again to siltat 520–529.9 ft (158.50–161.51 m). From 515.0 to 519.5 ft (156.97 to158.34 m) the section is a mottled, orange-red, light olive-gray siltyclay. The section at 519.15–520.35 ft (158.24–158.60 m) is an olive-graysilty clay with small reddish brown mottles and a trace of mica. From520.35 to 523.5 ft (158.60 to 159.56 m) the section consists of lightolive-gray, slightly micaceous clayey silt with 1-cm-thick red mottlesand abundant small sphaerosiderite nodules (very fine sand size). Thesection from 523.5 to 529.3 ft (159.56 to 161.33 m) consists of a returnto light gray, very silty micaceous clay with common sphaerosideritenodules and small cracks with black (?manganese) infill. The interval at529.3–530.9 ft (161.33–161.82 m) is light olive-gray and brown mottledclay with sphaerosiderite nodules transitioning downsection to 538.3 ft(164.07 m) to mostly brown, mottled, slightly silty, slightly micaceousclays with some reddish and grayish mottles and scattered sphaerosid-erite nodules. From 538.3 to 546.0 ft (164.07 to 166.42 m) the sectionreturns to a light olive-gray clay with orange-red and dusky red mottlesand sphaerosiderite nodules, abundant in places. The mottles appear tofollow traces of large roots. The section at 546.0–550.4 ft (166.42–167.76 m) is light gray to light brownish gray very silty clay with brownmottles. The section from 550.4 to 550.5 ft (167.76 to 167.79 m) is alight gray to olive-green banded silty clay. The interval between 550.5and 551.1 ft (167.79 and 167.98 m) is a brown and light gray silty clay.At 551.1–555.2 ft (167.98–169.22 m) is a light olive-gray silty clay withlight brown mottles and thin sand. A sharp contact at 555.1 ft (169.19m) separates silty clay above from very charcoal rich, medium to darkgray clay below; reworked charcoal laminae continue up above the con-tact to 555.0 ft (169.16 m). The underlying clay continues with raresand laminae to 558 ft (170.08 m) and is interpreted as a lacustrine de-posit. The contact at 555.1 ft (167.98 m) is marked by a gamma log kick(Fig. F6) and could be either a sequence boundary or a shift to paleosolsabove from lacustrine deposits below.
From 558 to 560.3 ft (170.08 to 170.78 m), the clay becomes increas-ingly sandy downsection. The section between 560.3 and 560.8 ft(170.78 and 170.93 m) is interbedded fine–very fine sand and sandydark gray clay with common charcoal. The underlying bed (560.8–563.7 ft; 170.93–171.82 m) is very fine micaceous sand with scatteredthin interlaminated clay layers and abundant charcoal. At 563.7–563.8ft (171.82–171.85 m) is a thin silty clayey very fine micaceous sand.Sands from 560.3 to 563.7 ft (170.78 to 171.82 m) appear to have toomuch interlaminated clay and charcoal to compose a good aquifer.There is a coring gap at 563.8–570 ft (171.85–173.74 m).
Sands continue from 570 to 596.8 ft (173.74 to 181.90 m), constitut-ing a potential aquifer. The sands from 570 to 580.5 ft (173.74 to 176.94m) are generally very fine to fine grained, lignitic, and slightly silty,with thin clay interbeds at 574.0–574.9, 577.1–580.5, and 580.9–581.1ft (174.96–175.23, 175.90–176.94, and 177.06–177.12 m). Interbeddedsands and clays continue below this: very fine carbonaceous sands(581.1–581.8 ft; 177.12–177.33 m), a silty clay layer (581.8–582 ft;177.33–177.39 m), and a very fine sand with scattered carbonaceousmaterial (582–582.3 ft; 177.39–177.49 m). Below a coring gap (582.3–590 ft; 177.49–179.83 m), the sediments coarsen downward to 593.3 ft

P.J. SUGARMAN ET AL.CHAPTER 4, FORT MOTT SITE 24
(180.84 m) from fine sand with scattered charcoal fragments (up to 4cm long) to granuliferous sand. An irregular contact at 593.3 ft (180.84m) with a rip-up clast of underlying material appears to be the base of achannel. Thus, the section from 581.1 to 593.3 ft (177.12 to 180.84 m)appears to be fluvial channel fill; however, a marine channel interpreta-tion cannot be precluded. The section at 593.3–596.0 ft (180.84–181.66m) is very charcoal rich (fragments from 2–3 mm to 6 cm across), mica-ceous, very fine sand with cross beds and soft-sediment deformationfeatures probably deposited in a fluvial overbank/crevasse splay setting.Interbedded fine–very fine sands and clays with abundant charcoalcompose the section from 596.0 to 599.7 ft (181.66 to 182.79 m): aclayey sandy silt with soft-sediment deformation features and abundantcharcoal fragments (596.8–598.4 ft; 181.90–182.39 m), a fine–very finesand with charcoal (598.4–599.0 ft; 182.39–182.58 m), a sandy charcoalbed (599.0–599.2 ft; 182.58–182.64 m), a clay (599.2–599.4 ft; 182.64–182.70 m), and a fine–very fine sand (599.4–599.7 ft; 182.70–182.79m). These are also tentatively interpreted as crevasse splay environ-ments.
The sands and interbedded clays from 560.3 to 599.7 ft (170.78 to182.79 m) are assigned to pollen Zone IIB (Albian) (556.2 and 577 ft;169.53 and 175.87 m) (see “Biostratigraphy,” p. 28) or Zone IIB/I (Ap-tian or older) (599 ft; 182.58 m).
Potomac Formation—Unit 2 or Unit 1
Interval: 599.7–644.1 ft (182.79–196.32 m)Age: Aptian or Albian
A sharp irregular contact at 599.7 ft (182.79 m) separates sand abovefrom paleosols below. The contact may be a sequence boundary. The sec-tion below includes a silty clay (599.7–600.0 ft; 182.79–182.88 m), sandysilt (below a coring gap; 600–605 ft; 182.88–184.40 m), with scatteredsphaerosiderite nodules with hematite rinds (605–606.2 ft; 184.40–184.77 m), and gray and heavily mottled, red, slightly silty clay withabundant sphaerosiderite nodules representing interfluvial paleosols(606.2–615.4 ft; 184.77–187.57 m) (Fig. F7). These clays become slightlysandy and less mottled below 613.5 ft (186.99 m). A contact at 615.4 ft(187.57 m) separates the light gray sandy clay with sphaerosiderite nod-ules above from dark gray (?organic rich) slightly silty clay below.
The gray clays (615.4–620.1 ft; 187.57–189.01 m) contain small char-coal fragments, lack sphaerosiderite nodules, and have thin micaceoussand interbeds below 617 ft (188.06 m). They are interpreted as lacus-trine. This facies continues to 620.1 ft (189.01 m), where there is a re-turn to lighter gray mottled silty clays.
Different clays appear from 620.1 to 628.1 ft (189.01 to 191.44 m). At620.1–625.7 ft (189.01–190.71 m) the section contains variably light tomedium gray sandy clayey silts with olive mottling and evidence of bio-turbation in places. Between 621.7 and 622.5 ft (189.49 and 189.74 m)this mottled interval is relatively hard, with obvious root casts and/ordesiccation cracks; below this the mottling is less intense and bioturba-tion is more obvious. This passes downward into a slightly darker, lami-nated, medium gray sandy clayey silt with scattered charcoal fragmentsat 625.7–626.4 ft (190.71–190.93 m). Interbedded dark and light grayclay and sandy clay is present from 626.4 to 628.1 ft (190.93 to 191.44m), with a coring gap to 630 ft (192.02 m). The environment of deposi-tion of the section from 620.1 to 628.1 ft (189.01 to 191.44 m) is uncer-

P.J. SUGARMAN ET AL.CHAPTER 4, FORT MOTT SITE 25
tain; the facies are consistent with cutoff channel/floodplain lakes, al-though slight mottling of the section indicates incipient soil formation.
Sands and silts predominate from 630.0 to 644.1 ft (196.32 to 198.99m). Silty sand with white rip-up clasts (630.0–630.3 ft; 192.02–192.12m) overlies an erosional contact (630.3 ft; 192.12 m). Interbedded mica-ceous, gray sandy silt alternates with burrowed silty fine sand to 637.6ft (194.34 m); sphaerosiderite nodules appear sporadically from 630.5to 632.0 ft (192.18 to 192.63 m), again suggesting incipient soil forma-tion on a fluvial (proximal levee?)-lacustrine (cutoff channel?) environ-ment. Bedding is obscured above 632 ft (192.63 m) and laminated be-low. Another sharp, irregular contact at 637.6 ft (194.34 m) separatesthe silty sand above from clayey fine sand below. Soft, silty, very finesand (637.6–638.2 ft; 194.34–194.52 m) passes downsection to a seriesof fining-upward successions of medium sand to fine sand to clay withvariably abundant charcoal, possibly representing overbank deposits,that are present to 644.1 ft (196.32 m).
As discussed above, the lithologic assignment of the section from599.7 to 644.1 ft (182.79 to 196.32 m) is problematic. It may constitutea distinct sequence (Subunit 2a or 1b), be part of the larger Unit 2 se-quence, or be part of the Unit 1 sequence. Based on the distinct faciessuccessions from sand to clay upsection, we favor this being a distinctsequence.
Potomac Formation—Unit 1
Interval: 644.1–820 ft (196.32–249.94 m)Age: Aptian (possibly Barremian)
From 644.1 ft to 649.2 ft (196.32 to 197.88 m) the section consists ofan extremely hard, clayey, light gray silt with an interval of burrowedsilty sand (648.3–648.8 ft; 197.60–197.75 m). At 649.2–652.7 ft (197.88–198.94 m) is a succession that passes from mottled orange and light grayslightly sandy, slightly clayey silt downsection to darker grayish brownslightly sandy clayey silt with abundant sandy burrows/rootlet fills; thisappears to be the same lithology decreasingly affected by soil processesdownsection. Sporadic sphaerosiderite nodules appear from 649 to 651ft (197.82 to 198.42 m). The environment appears to be fluvial overbankswamp with common organic matter overprinted by soil processes ex-emplified by root casts.
Below 652.7 ft (198.94 m) the section returns to a heavily mottledcharacter, which persists through 710.6 ft (216.59 m). The section alter-nates between clay and silt and between zones of extensive mottlingand grayer gleyed zones. The mottling below 652.7 ft (198.94 m) be-comes particularly intense compared to upper sections of the borehole,suggesting intense soil weathering under tropical–subtropical condi-tions of varying seasonal precipitation. The section between 652.7 and652.85 ft (198.94 and 198.99 m) consists of light gray silty clay above acoring gap (652.85–658.8 ft; 198.99–200.80 m). From 658.8 to 660 ft(200.80 to 201.17 m), the lithology is light gray clay with sphaerosider-ite nodules and red mottling and banding. The mottled zones are com-monly characterized by intensely mottled and cracked red, brown, andolive fine-grained lithologies with scattered concretions. The interval at660–665 ft (201.17–202.69 m) is predominantly clay with sphaerosider-ite nodules; the mottles are red and appear rootlike and commonly be-come narrower downward. From 665 to 676 ft (202.69 to 206.04 m),the section is siltier with fine micaceous sand at 670.1–671 ft (204.25–

P.J. SUGARMAN ET AL.CHAPTER 4, FORT MOTT SITE 26
204.52 m) and contains sphaerosiderite nodules altered to hematitethroughout; gamma log values are distinctly lower in this section. From670.1 to 673.6 ft (204.25 to 205.31 m) the core is mostly orange-redwith olive, orange, and gray mottles with small (up to 5 mm) dusky redconcretions (hematite cemented sand). The interval at 673.6–676.1 ft(205.31–206.08 m) is slightly sandy to clayey light gray micaceous siltwith common sphaerosiderite nodules with hematite rinds and smallhematite concretions. A dramatic change appears at an uneven contactat 676.1 ft (206.08 m) to a deeply mottled red to dusky red to olive tolight gray extensively cracked, slightly silty clay that continues to 685.2ft (208.85 m) with a few zones of small (up to 1 cm) hematite concre-tions. From 685.2 to 690.2 ft (208.85 to 210.37 m), large orange to olivemottles are present on light gray to pinkish clay with little silt andsmall hematite concretions (up to 2 mm) concentrated in the orange-olive mottles. Deeply mottled, red, intensely cracked clay continues at690.2–703.9 ft (210.37–214.55 m) with scattered sphaerosiderite nod-ules, common small hematite concretions in deeper red zones, and or-ange to olive mottles from 703 to 703.9 ft (214.27 to 214.55 m). Anabrupt change to light pinkish purple clayey, slightly sandy, micaceoussilt is present at 703.9 ft (214.55 m) with scattered hematite grains aftersphaerosiderite. Light pinkish purple clay continues to 705.55 ft(215.05 m), where the section changes to light gray slightly clayeymicaceous silt (705.55–710.6 ft; 215.05–216.59 m) that becomes in-creasing sandy downsection with a few red and olive mottles andsphaerosiderite nodules. The bottom of this section (710.3–710.6 ft;216.50–216.59 m) has abundant small holes filled with very fine sandsthat are probably root casts.
A heterolithic interval appears at 710.6–722.8 ft (216.59–220.31 m)(Fig. F7). From 710.6 to 712.9 ft (216.59 to 217.29 m) the lithology isheterogeneous, with mottled red and gray very clayey sandy silt andblebs of other lithologies (silty clay and very sandy clayey silt) lackingsphaerosiderite nodules; this facies may be colluvium. Below a coringgap (712.9–720 ft; 216.59–219.46 m), is a heterolithic bed (720–722 ft;219.46–220.07 m) with mottled micaceous sandy clayey silt with clastsup to 7 mm that is more deeply cracked and redder at the top. At 722 ft(220.07 m), the section becomes sandy, with very silty micaceous sandto 722.8 ft (220.31 m) followed by a coring gap (722.8–725 ft; 220.31–220.98 m). The sand is poorly sorted, fines upward from medium tovery fine grained, and is marked at its base by a few angular pebbles upto 1 cm in diameter.
The section from 725 to 732.2 ft (220.98 to 223.17 m) consists ofspectacularly mottled, poorly sorted sandy silt. The section has large (1–5 cm) light gray mottles on a deep red base lithology. The light graymottles frequently have olive rims from 1 to 10 mm wide; at the core ofsome of the light gray mottles are areas of weak red color. The mottlingmay represent alteration in a rooted soil zone affected by an alternationof oxidizing and gleying (reducing) conditions because of water tablerise and fall over a century- to millennial-scale time interval.
An interval of gray poorly sorted silty sand appears from 732.2 to734.4 ft (223.17 to 223.85 m) with scattered sphaerosiderite nodulesand hematite concretions. This is underlain by another extensivelymottled zone between 734.4 and 738.3 ft (223.85 and 225.03 m), butthis zone is different than that at 725–732.2 ft (220.98–223.17 m). It ismostly clay to silty clay, dominated by deep red colors and olive-yellowpatches with isolated light gray zones. The dusky red clay areas are dis-crete and appear to be individual clay pieces that may have physically

P.J. SUGARMAN ET AL.CHAPTER 4, FORT MOTT SITE 27
moved into this deposit by soil or slope processes (e.g., colluvium). Avery hard silt/siltstone appears at 738.3–738.6 ft (225.03–225.13 m).This indurated zone is underlain by a very soft interval of interlami-nated whitish sand and clay from 738.6 to 739.1 ft (225.13 to 225.28m), probably representing overbank deposition.
Laminated deep red clays are present from 739.1 to 743.9 ft (225.28to 226.59 m) with scattered white mottles and subordinate interbeddedmicaceous white clayey silts. These laminated clays and silts were ap-parently deposited under subaqueous conditions (?floodplain).
Below a coring gap (743.9–748 ft; 226.59–227.99 m) is an intenselymottled, variably micaceous deep red and pinkish white sandy, slightlyclayey silt (748–752.8 ft; 227.99–229.45 m) with dusky red irregularconcretions and some olive mottles and light olive-brown mottling pre-dominating in a slightly sandier zone (e.g., 751.5–752 ft; 229.06–229.21m). The lower part of the section (752–752.8 ft; 229.21–229.45 m) hasextensive “wormy” mottling and cracks.
A major lithologic change appears in a coring gap (752.8–753.5 ft;229.45–229.67 m). The section at 753.5–758.15 ft (229.67–231.08 m) isa predominantly medium–dark gray zone with interbedded silty fine–coarse sand, silty clay, sandy silts with scattered lignite, mica, sand-filled root casts or burrows in the lower part, and soft-sediment defor-mation (756–756.5 ft; 230.43–230.58 m). This section may represent awet fluvial overbank environment (perhaps swamp subenvironment).
Clays and clayey silts return at 760–765.6 ft (231.65–233.35 m).Brown silty clay and clayey silt (760–762.9 ft; 231.65–232.53 m) andmottled red orangish tan and gray slightly silty clay with cracks andsphaerosiderite nodules (762.9–“765.05” ft; 232.53–“233.19” m) repre-sent intense paleosol formation. Dark gray silty clay with charcoal(765.05–765.6 ft; 233.19–233.35 m) represents a wet floodplain envi-ronment.
A coarse-grained unit found from 765.6 to 769.2 ft (233.35 to 234.45m) is expressed as a distinct low on the gamma log. Mottled tan and ol-ive sandy silt with organic flecks (765.6–767 ft; 233.35–233.78 m) over-lies a very sandy silt to very silty sand (767–769.2 ft; 233.78–234.45 m)that is predominantly fine to medium grained. The sand is mottled redand olive near the top to light gray near the base and appears to becoarser near the base. The silts and sands may represent overbank de-posits altered into soil near the top.
An abrupt change is present at 769.2 ft (234.45 m) to mottled olive-yellow and light gray hard, waxy clayey silt (769.2–771.6 ft; 234.45–235.18 m) with cracks and scattered red mottles that represents anotherpaleosol. It passes downward into a sandy silt at 771.6 ft (235.18 m) andto a poorly sorted fine–coarse silty sand at 772.3 ft (235.40 m) thatagain probably represents an overbank deposit.
Below a coring gap (772.5–780 ft; 235.46–237.74 m), slightly siltyclay returns (780–789 ft; 237.74–240.49 m) as a deep red mottled inter-val. The upper part (780–783 ft; 237.74–238.66 m) has abundant smallmottles of various shades of red. Tan and light gray mottles appear at783 ft (238.66 m). Deep dusky red and black-red mottles appear at785.5 ft (239.42 m) (manganese-iron oxide?). The section becomes in-creasingly indurated and slightly sandy downsection. Olive-coloredmottles contain scattered small (<1 mm) hematite nodules, probablyafter sphaerosiderite. The sediments represent multiple generations ofpaleosols as indicated by multiple generations of mottling with differ-ent-colored rims and cores.

P.J. SUGARMAN ET AL.CHAPTER 4, FORT MOTT SITE 28
The section from 789 to 790.5 ft (240.49 to 240.94 m) is a fining-upward succession from a fine- to medium-grained quartz with coarse-grained sphaerosiderite nodules to a silty medium- to fine-grained sandto slightly sandy silt. It probably represents a crevasse splay depositwithin the overbank.
Red mottled clay with root casts (790.5–791.5 ft; 240.94–241.25 m)grades down to into a light gray sphaerosiderite nodule-rich slightly mi-caceous silt (791.8 ft; 241.34 m) that coarsens downward to a silty sand(795 ft; 243.32 m) and a slightly silty sand (797 ft; 242.93 m) to amedium–coarse sand (798.05 ft; 243.25 m). Mottled material at the topis a deep red with small, “wormy,” whitish mottles. The sand is mica-ceous and in the basal part contains very angular quartz grains that sug-gest proximity to source. The entire succession probably represents achannel-fill deposit.
Another cycle from 798.05 to 799.5 ft (243.25 to 243.69 m) consistsof a fining-upward succession from slightly micaceous fine–mediumsand to a clayier, siltier, mostly fine-grained sand. Below a coring gap(799.5–805 ft; 243.69–245.36 m), a dark gray lignitic micaceous clayeysilt (805–808.65 ft; 245.36–246.48 m) abruptly overlies a silty clay. Thesilt probably represents a swamp environment.
From 808.65 to 808.9 ft (246.48 to 246.55 m) the section coarsensdownsection from a soft, light medium gray, slightly silty clay thatoverlies a very hard, medium light gray, slightly sandy clayey silt(808.9–811 ft; 246.55–247.19 m) to sandy silt (811–812 ft; 247.19–247.50 m) to whiteish gray slightly silty medium sand (813–814 ft;247.80–248.11 m). The section becomes progressively darker and pur-plish upsection above the bottom of the hole (814 ft; 248.11 m). Thus,from the bottom of the hole to 808.65 ft (246.48 m) the cores trace afining-upward succession deposited as a channel fill.
BIOSTRATIGRAPHY
Calcareous nannoplankton
Samples were taken at 35.4 ft (10.8 m), 61.5 ft (18.8 m), 71.1 ft (21.7m), 73.6 ft (22.4 m), 84 ft (25.6 m), 100.3 ft (30.6 m), 110.4 ft (33.7 m),and 120.7 ft (36.8 m) in the marine section above the Magothy Forma-tion. The only samples that contained nannoplankton were 61.5 ft(18.8 m), 71.1 ft (21.7 m), and 73.6 ft (22.4 m). These samples con-tained Aspidolithus parcus constrictus (first occurrence [FO] in ZoneCC18) but lack Marthasterites furcatus (last occurrence at top of ZoneCC18) and Ceratolithoides aculeus (FO at the base of CC20), which placesthem firmly in Zone CC19. The background assemblage is Campanian.
Pollen
Eleven nonmarine samples were analyzed from the Fort Mott core-hole by G. Brenner for palynomorphs, pollen, and spores (Table T3),and preliminary examination was made of 16 samples from the Poto-mac Formation by P.P. McLaughlin. Sample recovery was variable (5 of16 examined by McLaughlin were barren), but several samples recov-ered a well-preserved flora. Samples are assigned ages using the zona-tions of Brenner (1967) (Figs. F2, F4, F5, F6, F7) and Doyle and Robbins(1977). A sample at 137.5 ft (41.91 m) is assigned to Zone V; because itlacks advanced Normapolles, it is interpreted as late Turonian. Samples
T3. Pollen occurrences, p. 48.

P.J. SUGARMAN ET AL.CHAPTER 4, FORT MOTT SITE 29
between 157 and 162.8 ft (47.85 and 49.62 m) are assigned to Zone IIIand interpreted as early Cenomanian. Zonal assignment of the sampleat 435.4 ft (132.71 m) may be either Subzone IIC (late Albian) or possi-bly Zone III (early Cenomanian). Samples between 465.4 and 500 ft(141.85 and 152.4 m) were assigned to Subzone IIC (late Albian). Sam-ples between 556.2 and 577.2 ft (169.53 and 175.93 m) were assigned toSubzone IIB (Albian). The biostratigraphic assignment of samples from599.3 ft (182.67 m) and 641.1 ft (195.41 m) is equivocal and could beeither to Subzone IIB or to Zone I. Brenner (this study) assigned bothsamples to Zone I (Aptian) based on the apparent absence of tricolpatepollen, tricolporate pollen, and pteridophyte spores typical of Zone II inthe Patapsco Formation of Maryland. In addition, he notes an increasein the pollen of Classopollis, Eucommiidites, Cicatricosisporites, andsmooth triangular trilete spores of Cyatheaceae that are characteristic ofthe Patuxent-Arundel succession (Zone I) (?Barremian–Aptian) in Mary-land. McLaughlin (this study) additionally reports very small (12 µm)faintly reticulate tricolpoiroidate angiosperm pollen (aff. Tricolpites albi-ensis) and another small angiosperm pollen similar to Retitricolpites vir-gius in these two samples, suggesting assignment to Subzone IIB (Al-bian). Assignment to Subzone IIB is consistent with log correlationsthat suggest the 599.3 ft (182.67 m) level at Fort Mott should corre-spond to ~515 ft (156.97 m) in Dc53-07 to ~590 ft (179.83 m) or so atEc14-01 in Delaware, both of which were recognized as Subzone IIB byDoyle and Robbins (1977). The sample at 806.0 ft (245.7 m) is placed inZone I (Aptian).
STRONTIUM ISOTOPE CHRONOSTRATIGRAPHY
Sr isotopic age estimates were obtained from mollusk shells. Approxi-mately 4–6 mg of shells or foraminiferal tests were cleaned ultra-sonically and dissolved in 1.5-N HCl. Sr was separated using standardion-exchange techniques (Hart and Brooks, 1974) and analyzed on aVG Sector mass spectrometer at Rutgers University (New Jersey). Inter-nal precision on the sector for the data set averaged 0.000009 and theexternal precision is approximately ±0.000020 (Oslick et al., 1994). NBS987 is measured for these analysis at 0.710255 (2σ standard deviation0.000008; n = 22) normalized to 86Sr/88Sr of 0.1194.
Cretaceous ages were assigned using linear regressions developed forupper Coniacian through Maastrichtian sections by Miller et al. (2004).Using a similar upper Campanian–Maastrichtian regression, Sugarmanet al. (1995) conservatively estimated age errors of ±1.9 m.y. at the 95%confidence interval for one Sr isotopic analysis; age errors for the coevaland older sections are purportedly one order of magnitude better ac-cording to Howarth and McArthur (1997). We estimate that the maxi-mum Sr isotopic age resolution for this interval is ±1 m.y. (i.e., the ex-ternal precision of ~0.000020 divided by the slopes of the regressions of~0.000020/m.y.)
Strontium isotopic ages were obtained from three samples in theWoodbury Formation in the Fort Mott borehole (Fig. F4). The sample at61 ft (18.59 m) (86Sr/87Sr = 0.707678 ± 12) yielded an age estimate of73.8 Ma; the sample at 62.6 ft (19.08 m) (86Sr/87Sr = 0.707622 ± 7)yielded an age estimate of 75.6 Ma; and a sample at 84.2 ft (25.66 m)(86Sr/87Sr = 0.707620 ± 6) yielded an age estimate of 75.7 Ma. These agesare substantially younger than the ages that would be expected based

P.J. SUGARMAN ET AL.CHAPTER 4, FORT MOTT SITE 30
on calcareous nannofossil biostratigraphy, and it is concluded thatthese samples have been altered by diagenesis.
SUMMARY AND FUTURE WORK
Drilling at Fort Mott was successful in providing data to evaluate lo-cal and regional aquifers. It also was an important site for understand-ing the regional and global significance of the Aptian–lowermost Ceno-manian (~120–98 Ma) Potomac Formation (possibly Barremian in part).This unit can comprise more than one half of the entire thickness ofthe coastal plain section; for example, at Cape May it is nearly 1100 mof a total coastal plain section of 1900 m (Olsson et al., 1988). Under-standing age, porosity, and thickness of the Potomac Formation is im-portant for improving backstripping of the Upper Cretaceous andyounger section for sea level studies. This constituted the primary impe-tus for including this site as part of Leg 174AX, which has as a majorobjective of obtaining a sea level record by backstripping Cretaceoussections at Ancora, Bass River, Millville, and Sea Girt. However, drillingat Fort Mott also yielded surprising new insights into the depositionalhistory of the coastal plain and potentially provides a key record for de-ciphering the climate and chronology of deposition of the mid-Creta-ceous on this margin.
The Potomac Formation has been previously interpreted as a fluvialunit deposited in a delta plain or coastal plain setting. Our examinationof the Potomac Formation at Fort Mott yields the following observa-tions:
1. Potomac Formation sediments in the Fort Mott borehole andelsewhere are predominantly fine grained (clays, silty clays, andclayey silts), with a few critical sand bodies. Many of the finer-grained intervals are heavily overprinted by soil-forming pro-cesses. These range from light blue and gray gleyed soils formedin poorly drained, reducing conditions to dark red soils indicat-ing highly oxidized conditions. These silty clays and clayey siltswere probably deposited as heavily vegetated levee deposits.Variations in color appear to reflect differences in evaporationand precipitation. The general depositional environment of thePotomac Formation best fits an anastomosing river system char-acterized by extremely low topographic gradients. Lakes are acommon subenvironment of such systems, and we interpret sev-eral organic-rich fine-grained intervals as lacustrine deposits,some as oxbow lakes and some as larger alluvial plain lakes.
2. Sand bodies at the bases of Potomac Units 3 (lowermost Ceno-manian) and 2 (Albian) appear laterally continuous in southern-most New Jersey; these sands may be present on top ofpreviously unrecognized sequence boundaries. These sequenceboundaries potentially reflect baselevel (in this case related tosea level) lowerings. Two other sands in Unit 1 are also candidatesequence boundaries.
3. These thick, apparently continuous sands have the geometries ofdelta front shoreline sands, although no direct marine evidencehas been uncovered within them. If this interpretation is correct,then these sands may constitute the transgressive systems tractsand the anastomosing river facies model represents the high-stand systems tracts. Thus, the basal delta front sands were pro-

P.J. SUGARMAN ET AL.CHAPTER 4, FORT MOTT SITE 31
graded over by delta plain deposits, including lower delta plaininterdistributary lakes, marshes, and swamps and upper deltaplain deeply weathered soils.
4. Cyclicity is evident in both the color and downhole logs (Figs.F4, F5, F6, F7). In particular, cyclicity is noted on the 2- to 3-ft(60–90 cm) and 10-ft (3 m) scales. Red oxidized sediments (highgamma log values) alternate with gray or gleyed reduced sedi-ments (low gamma log values), providing colorful bar codes forspectral analysis. This cyclicity not only reflects regional climatechanges, but its regularity implies a global imprint on climateand precipitation (e.g., Milankovitch periodicities). Future workis needed to test the assumption that these cycles represent pre-cession and short eccentricity cycles, with hints of the long ec-centricity cycle.
5. Identification of precessional and eccentricity cycles may, in thefuture, provide a potential means to parse time in these largelynonmarine units. Pollen biostratigraphy only allows coarse cor-relation to the stage level, suggesting that the age of these sedi-ments are is ~98–120 Ma. Further investigation may allow us toprovide an astronomical correlation for these sediments.
Recognizing that possibly global processes of eustatic change (e.g., thesequence boundaries) and evaporation–precipitation cycles with possi-ble Milankovtich periodicities sheds new light onto these otherwise mo-notonous soils and sands. Like the Newark Basin Upper Triassic–LowerJurassic redbeds, the stratigraphic record should reveal entirely new sto-ries by integrating continuous coring with new tools and new insights.

P.J. SUGARMAN ET AL.CHAPTER 4, FORT MOTT SITE 32
REFERENCES
Benson, R.N., and McLaughlin, P.P., 2001. New perspectives on correlation of nonma-rine depositional packages in the Cretaceous Potomac Formation, Delaware coastalplain. Geol. Soc. Am. Bull., 33:100. (Abstract)
Benson, R.N., and Spoljaric, N., 1996. Stratigraphy of the post-Potomac Cretaceousand Tertiary rocks of central Delaware. Bull.—Del., Geol. Surv., Vol. 20.
Brenner, G.J., 1967. Early angiosperm pollen differentiation in the Albian to Ceno-manian deposits of Delaware (U.S.A.). Rev. Paleobot. Palynol., 1:219–227.
Cauller, S.J., Carleton, G.B., and Storck, M.J., 1999. Hydrogeology of, water with-drawal from, and water levels and chloride concentrations in the major coastalplain aquifers of Gloucester and Salem Counties, New Jersey. U.S. Geol. Surv. Water-Resour. Invest. Rep., 98–4136.
Christopher, R.A., 1982. The occurrence of the Complexiopollis–Atlantopolis Zone(palynomorphs) in the Eagle Ford Group (Upper Cretaceous) of Texas. J. Paleontol.,56:525–541.
Doyle, J.A., and Robbins, E.I., 1977. Angiosperm pollen zonation of the continentalCretaceous of the Atlantic Coastal Plain and its applications to deep wells in theSalisbury Embayment. Palynology, 1:43–78.
Farlekas, G.M., Nemickas, B., and Gill, H.E., 1976. Geology and ground-waterresources of Camden County, New Jersey. U.S. Geol. Surv. Water-Resour. Invest. Rep.,76.
Grow, J.A., and Sheridan, R.E., 1988. U.S. Atlantic continental margin: a typicalAtlantic-type or passive continental margin. In Sheridan, R.E., and Grow, J.A.(Eds.), The Geology of North America (Vol. I-2): The Atlantic Continental Margin: U.S.:Boulder (Geol. Soc. Am.), 1–7.
Hart, S.R., and Brooks, C., 1974. Clinopyroxene-matrix partitioning of K, Rb, Cs, andBa. Geochim. Cosmochim. Acta, 38:1799–1806.
Howarth, R.J., and McArthur, J.M., 1997. Statistics for strontium isotope stratigraphy:a robust LOWESS fit to the marine Sr-isotope curve for 0 to 260 Ma, with look-uptable for the derivation of numerical age. J. Geol., 105:441–456.
Kominz, M.A., Miller, K.G., and Browning, J.V., 1998. Long-term and short-term glo-bal Cenozoic sea-level estimates. Geology, 26:311–314.
Litwin, R.J., Sohl, N.F., Owens, J.P., and Sugarman, P.J., 1993. Palynological analysis ofa newly recognized upper Cretaceous marine unit at Cheesequake, New Jersey.Palynology, 17:123–135.
Makaske, B., 2001. Anastomosing rivers: a review of their classification, origin andsedimentary products. Earth-Sci. Rev., 53:149–196.
McLaughlin, P.P., and Benson, R.N., 2002. Application of palynomorph biostratigra-phy to correlation of aquifer units in nonmarine facies of the Cretaceous PotomacFormation, Delaware coastal plain. Palynology, 26:270. (Abstract)
Miall, A.D., 1996. The Geology of Fluvial Deposits: Sedimentary Facies, Basin Analysis andPetroleum Geology: Berlin (Springer).
Miller, K.G., Newell, W., Snyder, S.W., et al., 1994. Proc. ODP, Init. Repts., 150X: Col-lege Station, TX (Ocean Drilling Program).
Miller, K.G., Browning, J.V., Pekar, S.F., and Sugarman, P.J., 1997. Cenozoic evolutionof the New Jersey coastal plain: changes in sea level, tectonics, and sediment sup-ply. In Miller, K.G., Newell, W., and Snyder, S.W. (Eds.), Proc. ODP, Sci. Results,150X: College Station, TX (Ocean Drilling Program), 361–373.
Miller, K.G., Liu, C., Browning, J.V., Pekar, S.F., Sugarman, P.J., Van Fossen, M.C., Mul-likin, L., Queen, D., Feigenson, M.D., Aubry, M.-P., Burckle, L.D., Powars, D., andHeibel, T., 1996a. Cape May site report. Proc. ODP, Init. Repts., 150X (Suppl.): Col-lege Station TX (Ocean Drilling Program), 5–28.
Miller, K.G., McLaughlin, P.P., Browning, J.V., Benson, R.N., Sugarman, P.J., Hernan-dez, J., Ramsey, K.W., Baxter, S.J., Feigenson, M.D., Aubry, M.-P., Monteverde, D.H.,

P.J. SUGARMAN ET AL.CHAPTER 4, FORT MOTT SITE 33
Cramer, B.S., Katz, M.E., McKenna, T.E., Strohmeier, S.A., Pekar, S.F., Uptegrove, J.,Cobbs, G., Cobbs, G., III, and Curtin, S.E., 2003. Bethany Beach site. In Miller,K.G., Sugarman, P.J., Browning, J.V., et al., Proc. ODP, Init. Repts., 174AX (Suppl.), 1–85 [CD-ROM]. Available from: Ocean Drilling Program, Texas A&M University,College Station TX 77845-9547, USA.
Miller, K.G., Mountain, G.S., and Leg 150 Shipboard Party and Members of the NewJersey Coastal Plain Drilling Project, 1996b. Drilling and dating New Jersey Oli-gocene–Miocene sequences: ice volume, global sea level and Exxon records. Sci-ence, 271:1092–1995.
Miller, K.G., Sugarman, P.J., Browning, J.V., Cramer, B.S., Olsson, R.K., de Romero, L.,Aubry, M.-P., Pekar, S.F., Georgescu, M.D., Metzger, K.T., Monteverde, D.H., Skin-ner, E.S., Uptegrove, J., Mullikin, L.G., Muller, F.L., Feigenson, M.D., Reilly, T.J.,Brenner, G.J., and Queen, D., 1999. Ancora site. In Miller, K.G., Sugarman, P.J.,Browning, J.V., et al., Proc. ODP, Init. Repts., 174AX (Suppl.), 1–65 [Online]. Avail-able from World Wide Web: http://www-odp.tamu.edu/publications/174AXSIR/VOLUME/CHAPTERS/174AXS_1.PDF. [Cited 2004-08-24]
Miller, K.G., Sugarman, P.J., Browning, J.V., Kominz, M.A., Olsson, R.K., Feigenson,M.D., and Hernandez, J.C., 2004. Upper Cretaceous sequences and sea-level his-tory, New Jersey coastal plain. Geol. Soc. Am. Bull., 116:368–393.
Miller, K.G., Sugarman, P.J., Browning, J.V., Olsson, R.K., Pekar, S.F., Reilly, T.J.,Cramer, B.S., Aubry, M.-P., Lawrence, R.P., Curran, J., Stewart, M., Metzger, J.M.,Uptegrove, J., Bukry, D., Burckle, L.H., Wright, J.D., Feigenson, M.D., Brenner, G.J.,and Dalton, R.F., 1998. Bass River site. In Miller, K.G., Sugarman, P.J., Browning,J.V., et al., Proc. ODP, Init. Repts., 174AX: College Station, TX (Ocean Drilling Pro-gram), 5–43.
Miller, K.G., Sugarman, P.J., Browning, J.V., Pekar, S.F., Katz, M.E., Cramer, B.S., Mon-teverde, D., Uptegrove, J., McLaughlin, P.P., Jr., Baxter, S.J., Aubry, M.-P., Olsson,R.K., Van Sickel, B., Metzger, K., Feigenson, M.D., Tiffin, S., and McCarthy, F., 2001.Ocean View site. In Miller, K.G., Sugarman, P.J., Browning, J.V., et al., Proc. ODP,Init. Repts., 174AX (Suppl.), 1–72 [CD-ROM]. Available from: Ocean Drilling Pro-gram, Texas A&M University, College Station TX 77845-9547, USA.
Miller, K.G., Sugarman, P.J., Browning, J.V., Cramer, B.S., Olsson, R.K., de Romero, L.,Aubry, M.-P., Pekar, S.F., Georgescu, M.D., Metzger, K.T., Monteverde, D.H., Skin-ner, E.S., Uptegrove, J., Mullikin, L.G., Muller, F.L., Feigenson, M.D., Reilly, T.J.,Brenner, G.J., Queen, D., 2000. Ancora site. In Miller, K.G., Sugarman, P.J., Brown-ing, J.V., et al., Proc. ODP, Init. Repts., 174AX (Suppl.), 1–85 [CD-ROM]. Availablefrom: Ocean Drilling Program, Texas A&M University, College Station TX 77845-9547, USA.
Newell, W.L., Powars, D.S., Owens, J.P., Stanford, S.D., and Stone, B.D., 2000. Surficialgeologic map of central and southern New Jersey, 1:100,000. U.S. Geol. Surv. MapSer., I-2540-D.
NJGS Information Circular 1, 1990. Generalized stratigraphic table for New Jersey.New Jersey Geol. Surv.
Olsson, R.K., Gibson, T.G., Hansen, H.J., and Owens, J.P., 1988. Geology of the north-ern Atlantic coastal plain: Long Island to Virginia. In Sheridan, R.E., and Grow, J.A.(Eds.), The Geology of North America (Vol. I-7): The Atlantic Continental Margin: U.S.:Boulder (Geol. Soc. Am.), 87–105.
Oslick, J.S., Miller, K.G., Feigenson, M.D., and Wright, J.D., 1994. Oligocene–Miocenestrontium isotopes: stratigraphic revisions and correlation to an inferred glacio-eustatic record. Paleoceanography, 9(3):427–443.
Owens, J.P., Minard, J.P., Sohl, N.F., and Mello, J.F., 1970. Stratigraphy of the outcrop-ping post-Magothy Upper Cretaceous formations in southern New Jersey andnorthern Delmarva Peninsula, Delaware and Maryland. U.S. Geol. Surv. Prof. Pap.,674.

P.J. SUGARMAN ET AL.CHAPTER 4, FORT MOTT SITE 34
Owens, J.P., Sugarman, P.J., Sohl, N.F., Parker, R.A., Houghton, H.F., Volkert, R.A.,Drake, A.A., Jr., and Orndorff, R.C., 1998. Bedrock geologic map of central andsouthern New Jersey, 1:100,000. Misc. Invest. Ser. Map, I-2540-B.
Posamentier, H.W., Jervey, M.T., and Vail, P.R., 1988. Eustatic controls on clasticdeposition, I. Conceptual framework. In Wilgus, C.K., Hastings, B.S., Kendall,C.G.St.C., Posamentier, H.W., Ross, C.A., and Van Wagoner, J. (Eds.), Sea-LevelChanges: An Integrated Approach. Spec. Publ.—Soc. Econ. Paleontol. Mineral.,42:109–124.
Ramsey, K.W., 1993. Geologic map of the Milford and Mispillion River Quadrangles,1:24,000. Del., Geol. Surv., Geol. Map, 8.
Reading, H.G., 1986. Sedimentary Environments and Facies: Boston (Blackwell ScientificPubl.).
Smith, D.G., and Smith, N.D., 1980. Sedimentation in anastomosed river systems:examples from alluvial valleys near Banff, Alberta. J. Sediment. Petrol., 50:157–164.
Sugarman, P.J., and Miller, K.G., 1997. Correlation of Miocene sequences and hydro-geologic units, New Jersey Coastal Plain. In Segall, M.P., Colquhoun, D.J., andSiron, D.L. (Eds.), Evolution of the Atlantic Coastal Plain–Sedimentology, Stratigraphy,and Hydrogeology. Sediment. Geol., 108:3–18.
Sugarman, P.J., Miller, K.G., Bukry, D., and Feigenson, M.D., 1995. Uppermost Cam-panian–Maestrichtian strontium isotopic, biostratigraphic, and sequence strati-graphic framework of the New Jersey coastal plain. Geol. Soc. Am. Bull., 107:19–37.
Sugarman, P.J., Miller, K.G., Owens, J.P., and Feigenson, M.D., 1993. Strontium iso-tope and sequence stratigraphy of the Miocene Kirkwood Formation, southernNew Jersey. Geol. Soc. Am. Bull., 105:423–436.
Vail, P.R., Mitchum, R.M., Jr., Todd, R.G., Widmier, J.M., Thompson, S., III, Sangree,J.B., Bubb, J.N., and Hatlelid, W.G., 1977. Seismic stratigraphy and global changesof sea level. Mem.—Am. Assoc. Pet. Geol., 26:49–212.
Zapecza, O.S., 1989. Hydrogeologic framework of the New Jersey coastal plain. Geol.Surv. Prof. Pap. (U.S.), 1404-B.

P.J. SUGARMAN ET AL.CHAPTER 4, FORT MOTT SITE 35
Figure F1. Location map showing existing ODP boreholes analyzed as a part of the New Jersey/Mid-Atlantic(MAT) sea level transect. Also shown are multichannel seismic data (MCS) from Ewing cruise 9009(Ew9009), Oceanus cruise (Oc270), and Cape Hatteras cruise (CH0698). Fort Mott borehole location is shownas a star. MN = Monmouth County, OC = Ocean County, BU = Burlington County, CD = Camden County,GL = Gloucester County, AT = Atlantic County, SA = Salem County, CU = Cumberland County, CM = CapeMay County.
+ ++
++++
+
+
++
Cape May ‘94
1072
902
903904
1071
905
906
1073
Ocean View ‘99
72°73°75° 74°76°77°W
38°
39°
41°N
40°Future
Ew9009Ch0698
Oc270
Seismic Profiles
Existing DrillsitesDSDPExplorationAMCORODP Leg 150, 150X903
ODP Leg 174A, 174AX1072
+
+
+ +
+
+
++
I
+I
MAT1
MAT3MAT2
DelmarvaPeninsula
pre-Cretace
ous
2000
m1000
m
3000
m
200
m
NJ/MAT Sea-Level Transect
Bethany Beach,DE (‘00)
++
Island Beach ‘93
Atlantic Ocean
Sea Girt ‘03
Fort MottCU
Millville ‘02
Atlantic City ‘93
Ancora ‘98
Bass River ‘96
New JerseyCenozo
ic outcr
op
Cretaceous o
utcrop
CM
SAGL
AT
CD
BU
OC
MN
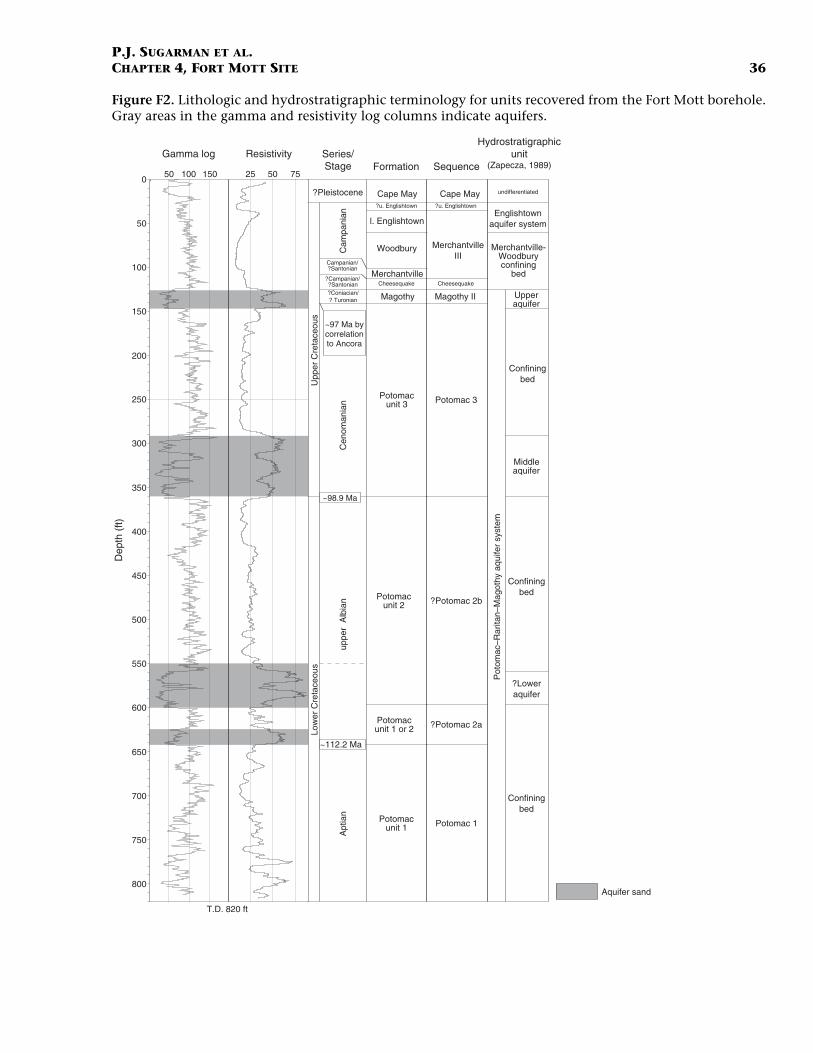
P.J. SUGARMAN ET AL.CHAPTER 4, FORT MOTT SITE 36
Figure F2. Lithologic and hydrostratigraphic terminology for units recovered from the Fort Mott borehole.Gray areas in the gamma and resistivity log columns indicate aquifers.
50 100 150 25 50 75
T.D. 820 ft
Aquifer sand
Cheesequake
Merchantville
Woodbury
l. Englishtown
?u. Englishtown
Cape May
Magothy
Potomacunit 3
Potomacunit 2
Potomacunit 1
MerchantvilleIII
Cheesequake
Magothy II
?u. Englishtown
Cape May
Potomac 3
?Potomac 2b
Potomac 1
undifferentiated
Englishtownaquifer system
Pot
omac
–Rar
itan–
Mag
othy
aqu
ifer
syst
em
Upperaquifer
Middleaquifer
?Loweraquifer
?Pleistocene
Upp
er C
reta
ceou
sLo
wer
Cre
tace
ous
Cam
pani
an
?Campanian/?Santonian?Coniacian/? Turonian
Campanian/?Santonian
Cen
oman
ian
uppe
r A
lbia
nA
ptia
n
~98.9 Ma
~112.2 Ma
?Potomac 2aPotomacunit 1 or 2
0
50
100
150
200
250
300
350
400
450
500
550
600
650
700
750
800
Dep
th (
ft)
Gamma log ResistivityFormation Sequence
Hydrostratigraphicunit
(Zapecza, 1989)Series/Stage
Confiningbed
Confiningbed
Confiningbed
~97 Ma bycorrelationto Ancora
Merchantville-Woodburyconfining
bed

P.J. SUGARMAN ET AL.CHAPTER 4, FORT MOTT SITE 37
Figure F3. A. Facies model for anastomosed river sedimentation from the Potomac Formation (modifiedfrom Miall, 1996). Photographs are examples of each facies in a core from given levels in the Fort Mott bore-hole. (Continued on next page.)
Gleyed Overbank/Floodplain460-462 ft
Swamps805-807 ft
Oxidized Soils270-272 ft
Fluvial Channels296-298 ft
Lake/Oxbow500-502 ft
A

P.J. SUGARMAN ET AL.CHAPTER 4, FORT MOTT SITE 38
Figure F3 (continued). B. Facies model for delta plain sedimentation from the Potomac Formation (mod-ified from Reading, 1986). Photographs are examples of each facies in a core from given levels in the FortMott borehole.
Interdistributary lakes,marshes and swamps
805-807 ft
Soils270-272 ft
Continuous delta frontshoreline sand
296-298 ft
Upper Delta Plain
Lower Delta Plain
Delta Front
B
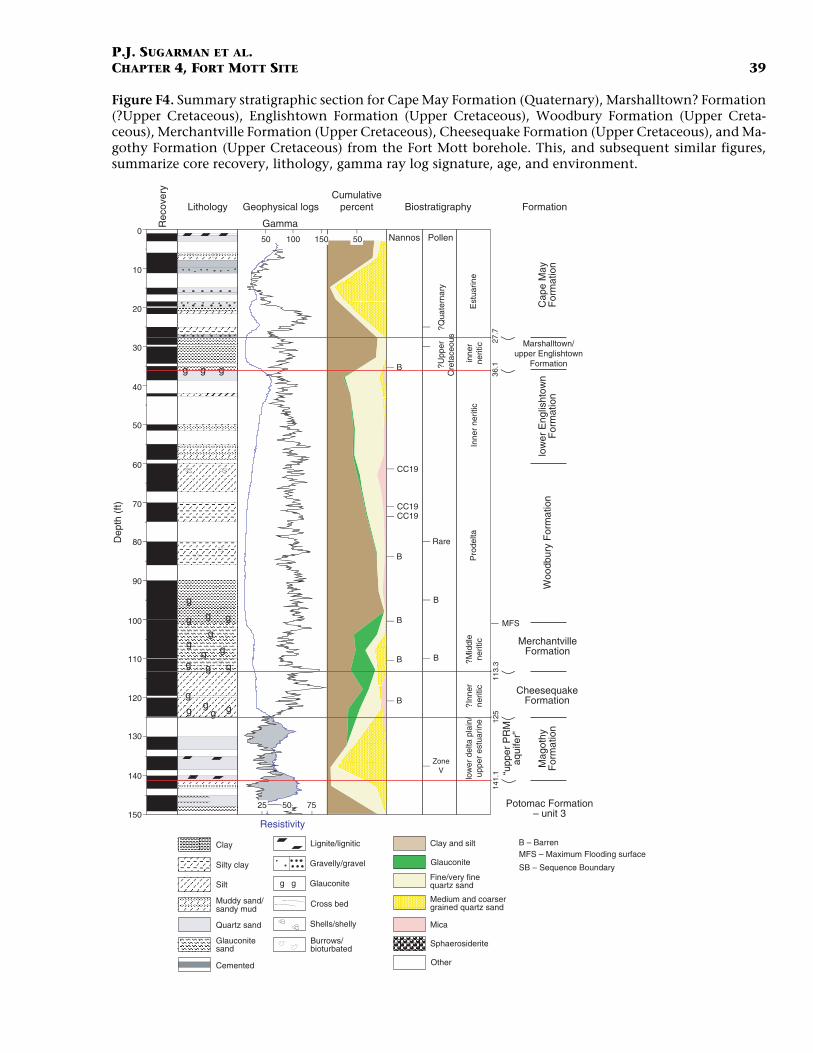
P.J. SUGARMAN ET AL.CHAPTER 4, FORT MOTT SITE 39
Figure F4. Summary stratigraphic section for Cape May Formation (Quaternary), Marshalltown? Formation(?Upper Cretaceous), Englishtown Formation (Upper Cretaceous), Woodbury Formation (Upper Creta-ceous), Merchantville Formation (Upper Cretaceous), Cheesequake Formation (Upper Cretaceous), and Ma-gothy Formation (Upper Cretaceous) from the Fort Mott borehole. This, and subsequent similar figures,summarize core recovery, lithology, gamma ray log signature, age, and environment.
Rec
over
y
g g g
g
g
ggg
ggg
g gg
ggg
50 100
MerchantvilleFormation
Mag
othy
F
orm
atio
n
CheesequakeFormation
Potomac Formation– unit 3
Cap
e M
ay
For
mat
ion
Woo
dbur
y F
orm
atio
nlo
wer
Eng
l isht
own
For
mat
ion
Marshalltown/upper Englishtown
Formation
g g
25 50 75
Resistivity
Gamma
B
B
B
B
B
CC19
CC19CC19
PollenNannos
?Qua
tern
ary
Rare
B
B
ZoneV
50150
?Upp
erC
reta
ceou
s
“upp
er P
RM
aqui
fer ”
27.7
36.1
113.
312
514
1.1
MFS
Est
uarin
ein
ner
nerit
icIn
ner
nerit
icP
rode
lta?M
iddl
ene
riti c
?Inn
erne
ritic
low
er d
elta
pla
in/
uppe
r es
tuar
ine
Clay
Silty clay
Silt
Muddy sand/sandy mud
Quartz sand
Glauconite
Fine/very finequartz sand
Sphaerosiderite
Medium and coarsergrained quartz sand
Clay and silt
Cemented
Glauconitesand
Other
Mica
B – BarrenMFS – Maximum Flooding surface
SB – Sequence BoundaryGravelly/gravel
Cross bed
Glauconiteg g
Lignite/lignitic
Shells/shelly
Burrows/bioturbated
Dep
th (
ft)
LithologyCumulative
percentGeophysical logs Biostratigraphy Formation
0
10
20
30
40
50
60
70
80
90
100
110
120
130
140
150

P.J. SUGARMAN ET AL.CHAPTER 4, FORT MOTT SITE 40
Figure F5. Summary stratigraphic section for Potomac Unit 3 (Cenomanian) from the Fort Mott borehole.
Rec
over
y
Mot
tled
Mot
tled
Org
anic
rich
San
dyM
ott-
led
San
dy
Pot
omac
For
mat
ion
– un
it 3
Magothy Fm.
“low
er-m
iddl
e”m
iddl
e aq
uife
r“u
pper
”m
iddl
eaq
uife
r
256.
814
1.1
259.
929
0.65
310.
632
0.4
Gamma Biostratigraphy
Formation
25 50 75
Resistivity
Zone III
Zone III
B
B
100 200 50
148
alluvial plain
overbank
swamp
164.
2
terrestrialsoils
swamp
terrestrialsoils
fluvial
floodplain/overbank
?fluvial
?fluvial/meandering
Potomac Fm.– unit 2
363.
6
?
Clay
Silty clay
Silt
Muddy sand/sandy mud
Quartz sand
Glauconite
Fine/very finequartz sand
Sphaerosiderite
Medium and coarsergrained quartz sand
Clay and silt
Cemented
Glauconitesand
Other
Mica
B – BarrenMFS – Maximum Flooding surface
SB – Sequence BoundaryGravelly/gravel
Cross bed
Glauconiteg g
Lignite/lignitic
Shells/shelly
Burrows/bioturbated
Dep
th (
ft) 250
300
150
200
350
LithologyCumulative
percentGeophysical logs Environment

P.J. SUGARMAN ET AL.CHAPTER 4, FORT MOTT SITE 41
Figure F6. Summary stratigraphic section for Potomac Unit 2 partim (Albian), from the Fort Mott borehole.
Mot
tled
Mot
tled
Org
anic
ric
hO
rgan
ic r
ich/
San
dy
Pot
omac
For
mat
ion
– un
it 2
508.
1555
5.1
“low
er a
quife
r ”
417.
7
25 50 75
10050 150
Resistivity
ZoneIIC-III?
Zone IIC
Zone IIC
Zone IIB
Zone IIB
Zone IIBorZone I
B
B
terrestrialsoils
floodplain/overbank
oxbow
overbank
fluvial
lacustrineflood plain
lacustrine
terrestrialsoils
lacustrine
?fluvial
crevassesplay
50 363.
659
9.7
Rec
over
yGamma Biostratigraphy
Formation
Clay
Silty clay
Silt
Muddy sand/sandy mud
Quartz sand
Glauconite
Fine/very finequartz sand
Sphaerosiderite
Medium and coarsergrained quartz sand
Clay and silt
Cemented
Glauconitesand
Other
Mica
B – BarrenMFS – Maximum Flooding surface
SB – Sequence BoundaryGravelly/gravel
Cross bed
Glauconiteg g
Lignite/lignitic
Shells/shelly
Burrows/bioturbated
Dep
th (
ft)
LithologyCumulative
percentGeophysical logs Environment
400
450
500
550
600

P.J. SUGARMAN ET AL.CHAPTER 4, FORT MOTT SITE 42
Figure F7. Summary stratigraphic section for Potomac Unit 2 partim (Albian) and Potomac Unit 1 (Aptian)from the Fort Mott borehole. T.D. = total depth.
T. D. 820 ft
615.
475
376
079
5
Mot
tled
San
dy/s
ilty
Mot
tled
San
d y
25 7550
50 100 150 50
Resistivity
Zone IIBorZone 1
Zone I
lacustrine
lacustrine/soil
fluvial/lacustrine/overbank
terr
estr
ial s
oils
over
prin
ting
over
bank
dep
osit s
channel fill
swamp
Pot
omac
For
mat
ion
– un
it 1
Pot
omac
Fo r
mat
ion
– un
it 2
or u
n it 1
710.
6
colluvium?
colluvium?
floodplain
Zone IIBorZone 1
644.
159
9.7
Mot
tled
San
dy
Rec
over
yGamma Biostratigraphy
Formation
Clay
Silty clay
Silt
Muddy sand/sandy mud
Quartz sand
Glauconite
Fine/very finequartz sand
Sphaerosiderite
Medium and coarsergrained quartz sand
Clay and silt
Cemented
Glauconitesand
Other
Mica
B – BarrenMFS – Maximum Flooding surface
SB – Sequence BoundaryGravelly/gravel
Cross bed
Glauconiteg g
Lignite/lignitic
Shells/shelly
Burrows/bioturbated
Dep
th (
ft)
LithologyCumulative
percentGeophysical logs Environment
650
700
750
800
600
terrestrialsoils
terrestrialsoils
channel fill
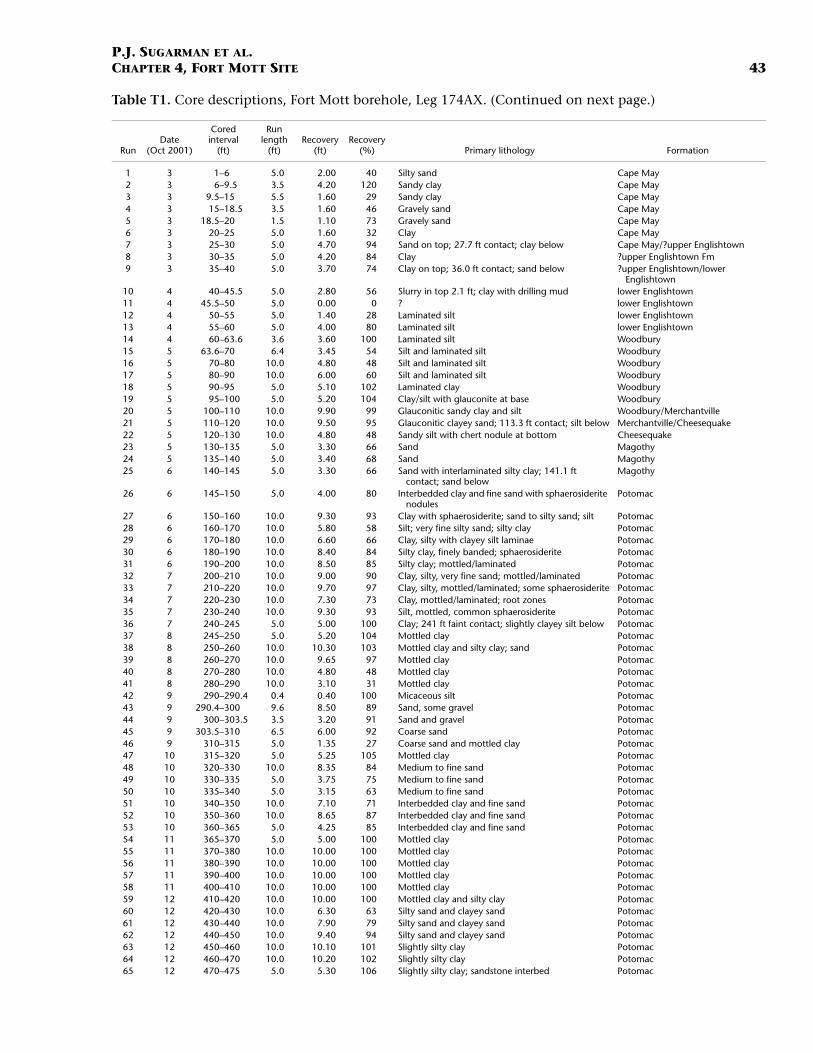
P.J. SUGARMAN ET AL.CHAPTER 4, FORT MOTT SITE 43
Table T1. Core descriptions, Fort Mott borehole, Leg 174AX. (Continued on next page.)
RunDate
(Oct 2001)
Cored interval
(ft)
Run length
(ft)Recovery
(ft)Recovery
(%) Primary lithology Formation
1 3 1–6 5.0 2.00 40 Silty sand Cape May2 3 6–9.5 3.5 4.20 120 Sandy clay Cape May3 3 9.5–15 5.5 1.60 29 Sandy clay Cape May4 3 15–18.5 3.5 1.60 46 Gravely sand Cape May5 3 18.5–20 1.5 1.10 73 Gravely sand Cape May6 3 20–25 5.0 1.60 32 Clay Cape May7 3 25–30 5.0 4.70 94 Sand on top; 27.7 ft contact; clay below Cape May/?upper Englishtown8 3 30–35 5.0 4.20 84 Clay ?upper Englishtown Fm9 3 35–40 5.0 3.70 74 Clay on top; 36.0 ft contact; sand below ?upper Englishtown/lower
Englishtown10 4 40–45.5 5.0 2.80 56 Slurry in top 2.1 ft; clay with drilling mud lower Englishtown11 4 45.5–50 5.0 0.00 0 ? lower Englishtown12 4 50–55 5.0 1.40 28 Laminated silt lower Englishtown13 4 55–60 5.0 4.00 80 Laminated silt lower Englishtown14 4 60–63.6 3.6 3.60 100 Laminated silt Woodbury15 5 63.6–70 6.4 3.45 54 Silt and laminated silt Woodbury16 5 70–80 10.0 4.80 48 Silt and laminated silt Woodbury17 5 80–90 10.0 6.00 60 Silt and laminated silt Woodbury18 5 90–95 5.0 5.10 102 Laminated clay Woodbury19 5 95–100 5.0 5.20 104 Clay/silt with glauconite at base Woodbury20 5 100–110 10.0 9.90 99 Glauconitic sandy clay and silt Woodbury/Merchantville21 5 110–120 10.0 9.50 95 Glauconitic clayey sand; 113.3 ft contact; silt below Merchantville/Cheesequake22 5 120–130 10.0 4.80 48 Sandy silt with chert nodule at bottom Cheesequake23 5 130–135 5.0 3.30 66 Sand Magothy24 5 135–140 5.0 3.40 68 Sand Magothy25 6 140–145 5.0 3.30 66 Sand with interlaminated silty clay; 141.1 ft
contact; sand belowMagothy
26 6 145–150 5.0 4.00 80 Interbedded clay and fine sand with sphaerosiderite nodules
Potomac
27 6 150–160 10.0 9.30 93 Clay with sphaerosiderite; sand to silty sand; silt Potomac28 6 160–170 10.0 5.80 58 Silt; very fine silty sand; silty clay Potomac29 6 170–180 10.0 6.60 66 Clay, silty with clayey silt laminae Potomac30 6 180–190 10.0 8.40 84 Silty clay, finely banded; sphaerosiderite Potomac31 6 190–200 10.0 8.50 85 Silty clay; mottled/laminated Potomac32 7 200–210 10.0 9.00 90 Clay, silty, very fine sand; mottled/laminated Potomac33 7 210–220 10.0 9.70 97 Clay, silty, mottled/laminated; some sphaerosiderite Potomac34 7 220–230 10.0 7.30 73 Clay, mottled/laminated; root zones Potomac35 7 230–240 10.0 9.30 93 Silt, mottled, common sphaerosiderite Potomac36 7 240–245 5.0 5.00 100 Clay; 241 ft faint contact; slightly clayey silt below Potomac37 8 245–250 5.0 5.20 104 Mottled clay Potomac38 8 250–260 10.0 10.30 103 Mottled clay and silty clay; sand Potomac39 8 260–270 10.0 9.65 97 Mottled clay Potomac40 8 270–280 10.0 4.80 48 Mottled clay Potomac41 8 280–290 10.0 3.10 31 Mottled clay Potomac42 9 290–290.4 0.4 0.40 100 Micaceous silt Potomac43 9 290.4–300 9.6 8.50 89 Sand, some gravel Potomac44 9 300–303.5 3.5 3.20 91 Sand and gravel Potomac45 9 303.5–310 6.5 6.00 92 Coarse sand Potomac46 9 310–315 5.0 1.35 27 Coarse sand and mottled clay Potomac47 10 315–320 5.0 5.25 105 Mottled clay Potomac48 10 320–330 10.0 8.35 84 Medium to fine sand Potomac49 10 330–335 5.0 3.75 75 Medium to fine sand Potomac50 10 335–340 5.0 3.15 63 Medium to fine sand Potomac51 10 340–350 10.0 7.10 71 Interbedded clay and fine sand Potomac52 10 350–360 10.0 8.65 87 Interbedded clay and fine sand Potomac53 10 360–365 5.0 4.25 85 Interbedded clay and fine sand Potomac54 11 365–370 5.0 5.00 100 Mottled clay Potomac55 11 370–380 10.0 10.00 100 Mottled clay Potomac56 11 380–390 10.0 10.00 100 Mottled clay Potomac57 11 390–400 10.0 10.00 100 Mottled clay Potomac58 11 400–410 10.0 10.00 100 Mottled clay Potomac59 12 410–420 10.0 10.00 100 Mottled clay and silty clay Potomac60 12 420–430 10.0 6.30 63 Silty sand and clayey sand Potomac61 12 430–440 10.0 7.90 79 Silty sand and clayey sand Potomac62 12 440–450 10.0 9.40 94 Silty sand and clayey sand Potomac63 12 450–460 10.0 10.10 101 Slightly silty clay Potomac64 12 460–470 10.0 10.20 102 Slightly silty clay Potomac65 12 470–475 5.0 5.30 106 Slightly silty clay; sandstone interbed Potomac

P.J. SUGARMAN ET AL.CHAPTER 4, FORT MOTT SITE 44
66 13 475–480 5.0 5.40 108 Silty clay, mottled/laminated Potomac67 13 480–490 10.0 8.65 87 Silty clay with interlaminated very fine to fine sand Potomac68 13 490–500 10.0 9.30 93 Silty clay with interlaminated very fine to fine sand Potomac69 13 500–510 10.0 8.55 86 Silty clay with interlaminated very fine to fine sand;
508.15 ft contact; silty clay belowPotomac
70 13 510–520 10.0 10.35 104 Clayey silt; 517 ft contact; slightly silty clay Potomac71 13 520–530 10.0 9.90 99 Slightly clayey silt Potomac72 15 530–540 10.0 9.00 90 Mottled clay Potomac73 15 540–550 10.0 9.40 94 Mottled clay/gray silt Potomac74 15 550–560 10.0 9.30 93 Mottled clay/gray silt Potomac75 15 560–570 10.0 3.70 37 Sand and lignite Potomac76 15 570–580 10.0 8.00 80 Sand, lignite, clay Potomac77 15 580–590 10.0 2.30 23 Silty clay; lignitic very fine sand Potomac78 16 590–598 8.0 6.80 85 Lignitic medium sand; very coarse sand; very fine
sandPotomac
79 16 598–605 7.0 1.90 27 Lignitic sand and interbedded clay Potomac80 16 605–610 5.0 1.80 36 Gray silt Potomac81 16 610–620 10.0 8.40 84 Mottled clay with sand at bottom Potomac82 16 620–630 10.0 8.10 81 Clay over interbedded silt/sand Potomac83 17 630–640 10.0 8.20 82 Silty sand Potomac84 17 640–646.5 6.5 4.70 72 Silty sand Potomac85 17 646.5–651 4.5 6.00 133 Silty clay Potomac86 17 651–660 9.0 1.85 34 Silty sand, silty clay (2 runs, 86 and 86A) Potomac
86A 17 651–661 9.0 1.20 34 Silty sand, silty clay (2 runs, 86 and 86A) Potomac87 18 660–665 5.0 4.55 91 Mottled clay Potomac88 18 665–675 10.0 9.70 97 Mottled clay Potomac89 18 675–680 5.0 4.70 94 Mottled clay Potomac90 18 680–690 10.0 10.00 100 Mottled clay Potomac91 19 690–694 4.0 2.15 54 Mottled clay Potomac92 19 694–700 6.0 6.10 102 Mottled clay Potomac93 19 700–710 10.0 10.25 103 Mottled clay over light gray clayey silt Potomac94 20 710–720 10.0 2.90 29 Mottled clayey silt Potomac95 20 720–725 5.0 2.80 56 Clayey silt Potomac96 20 725–730 5.0 5.50 110 Hard mottled silty sand Potomac97 20 730–740 10.0 9.20 92 Hard mottled silty sand and soft clay/sand Potomac98 22 740–748 8.0 3.90 49 Mottled silt Potomac99 22 748–753.5 5.5 4.80 87 Laminated clay and silt Potomac100 22 753.5–760 6.5 5.15 79 Silt, clay, sand Potomac101 22 760–765 5.0 5.00 100 Silty clay Potomac102 22 765–775 10.0 7.50 75 Mottled clay and silt Potomac103 23 775–780 5.0 0.00 0 ? Potomac104 23 780–785 5.0 5.10 102 Mottled clay Potomac105 23 785–795 10.0 7.70 77 Mottled clay Potomac106 23 795–805 10.0 4.50 45 Very fine sand and silt Potomac107 23 805–810 5.0 5.20 104 Lignitic silt and clay Potomac108 23 810–820 10.0 4.00 40 Silt over clayey sand Potomac
Fort Mott coring totals: 820 638.85 77.9
RunDate
(Oct 2001)
Cored interval
(ft)
Run length
(ft)Recovery
(ft)Recovery
(%) Primary lithology Formation
Table T1 (continued).

P.J. S
UG
AR
MA
N E
T AL.
CH
AP
TE
R 4
, FO
RT M
OT
T SIT
E4
5
Table s.)
Sample Discussion(ft)
137.5 ostic angiosperms make up a small part of the icroflora. The palynological assemblage is
ated by spores of the Sphagnaceae, Pinaceae ryophyta. Advanced Normapolles of the thy are absent. Typical Normapolles of the Amboy Fire Clay are represented by such forms plexipollis sp. C and Complexipollis exigua and
lpopollenites sp.
157.0 ost common angiosperms in this sample are llen of Tricolporoidites sp. A Doyle and Robbins, which is restricted to Zone III. oropollenites sp. B is also restricted to Zone III.
of the spores found in this sample are typically throughout the Potomac Group.
162.8 ost common angiosperm in this sample is the of Tricolporoidites B Doyle and Robbins, 1975, is restricted to Zone III. Tricolporopollenites sp. so more common in Zone III.
435.4 are no stratigraphically restricted morphs in this poorly preserved sample. There
t of fusain and degraded vitrain present. This is on in terrains that have undergone forest fires. y only the most resistant spores survive.
465.3 undance of small, prolate tricolporates and the on appearance of Tricolporpollenites distinctus
ricolporopollenites triangulus, together with the ce of any oblate tricolporates that are only found in Zone III, clearly place this sample e IIC.
T2. Pollen occurrences in the Fort Mott borehole, Leg 174AX. (See table note. Continued on next two page
depthStage Zone Stratigraphic correlation Paleoecology
Palynological recovery
Diagnostic palynomorphs,pollen, and spores Biozone/stage(m)
41.9 Late Turonian V Magothy Formation–South Amboy Fire Clay Member
Nonmarine Good Complexipollis exigua Christopher V Diagntotal mdominand BMagoSouthas ComPoroco
Complexipollis sp. C Doyle and Robbins, 1975
IV-V
Complexipollis sp. v Christopher VNyssapollenites spp. Wolf & Pakiser VPorocolpopollenites sp. Doyle and Robbins, 1975
V
Tricolporopollenites sp. C Doyle and Robbins, 1975
V
47.9 Early Cenomanian
III Uppermost Patapsco: Elkneck Beds of Maryland
Nonmarine Very good Granulatisporites dailyi Zone IIC and III The mthe po1975,TricolpManyfound
Rugubivesiculites reductus II-MaestrichtianRugubivesiculites rugosus IIC-IIITaurocusporites spackmani Brenner, 1962
IIB2-III
Tricolporopollenites sp. B Doyle and Robbins, 1975
III
Tricolporoidites subtilliz IIC-IIITricolporoidites sp. A Doyle and Robbins,1975
IIC-III (Rare in II)
49.6 Early Cenomanian
III Uppermost Patapsco: Elkneck Beds of Maryland
Nonmarine Very good Ajatipollis sp. A Doyle and Robbins, 1975
IIB-III, most common in III
The mpollenwhichA is al
Clavatipollenites hughesi I-IIIGranulatisprites dailyi Common in Zones
IIC & IIITricolporopollenites sp. B Doyle and Robbins, 1975
III
Tricolporoidites sp. B Doyle and Robbins, 1975
III
132.7 Late Albian IIC-?III Upper Patapsco Very poor Araucariacites australis More abundant in II & IIC
Therepalynois a locommUsuall
Cicatricosisporites hallei I-IIIGleicheniidites circinidites I-III
Granulatisporites dailyi I-III (Common to IIC)
Taurocusporites reduncus II-III141.8 Late Albian IIC Upper Patapsco Nonmarine Very good Araucariacites australis (very abundant) II-Cenozoic The ab
command Tabsencommin Zon
Pinuspollenites spp. (very abundant) Broad rangeTricporpollenites distinctus IIC-IIITricolporopollenites triangulus Rare in Upper IIB,
first occurs/common in IIC/III
Tricolpopollenites minutus Brenner II-IIITricolpopollenites micromunis II-III

P.J. S
UG
AR
MA
N E
T AL.
CH
AP
TE
R 4
, FO
RT M
OT
T SIT
E4
6
500.0 152 The assemblage is characterized by an abundance of Araucariacites australis and Pinuspollenites spp. as in the sample above at 465.3 ft.
556.2 169
577.2 175 The appearance of C. patapscoensis at 557.2 and 556.2 ft indicates a Zone II date for both these samples.
599.3 182 In samples 599.3, 641.05, and 806 ft the organic residue shows a marked increase in vitrain and fusain particles. There are no tricolpate or tricolporate pollen, or any pteridophyte spores that are typical of Zone II of the Patapsco Formation. There is also an increase in the pollen of Classopollis, Eucommiidites, Cicatricosisporites and smooth triangular trilete spores of the Cyatheaceae. This type of assemblage is characteristic of the Patuxent-Arundel Sequence in Maryland.
641.1 195 See Discussion for sample 599.3 ft.
Sample deptDiscussion(ft) (m
Table T2
.4 Albian IIC Upper Patapsco Nonmarine Fair Araucariacites australis Very abundant from II-Cenozoic
Brenneropollis peroreticulatus I-IIIPinuspollenites spp. (very abundant) Broad rangeTricolpites albiensis IIC-IIITricolporoidites sp. A Doyle and Robbins, 1975
IIC-III
Tricolporoidites subtilis IIC-III
.5 Albian IIB Upper Patapsco Nonmarine Poor Araucariacites australis (very abundant) II-CenozoicAppendicisporites segmentus IICicatricosisporites hallei (abundant) I-IICicatricosisporites patapscoensis IIBCicatricosisporites potomacensis I-II
.9 Albian IIB Upper Patapsco Nonmarine Poor Araucariacites australis (abundant) Common from II-Cenozoic
Cicatricosisporites hallei (abundant) I-IIEucommiidites troedssoni I-IIClassopollis torosus I-IVCicatricosisporites patapscoensis IIBClavatipollenites hughesi I-III
.7 Aptian I Patuxent-Arundel Nonmarine Fair Classopollis torosus More common in Zone I
Clavatipollenites hughesi More common in Zone I
Very small Cicatricosisporites spp.Cicatricosisporites aralica More common in
Zone ICicatricosisporites australensis More common in
Zone IDeltoidospora hallii (Cyatheaceae) More common in
Zone IPilosisporites trichopapillosus Zone I-II
.4 Aptian I Patuxent-Arundel Nonmarine Fair to poor Classopollis torosus More common in Zone I
Clavatipollenites hughesi More common in Zone I
Alisporites bilateralis I-IICicatricosisporites spp. I-IICingulatisporites eukirchensoides I-IICicatricosisporites australensis More common in
Zone ICicatricosisporites dorogensis Restricted to Zone IDeltoidospora hallii (Cyatheaceae) More common in
Zone I
hStage Zone Stratigraphic correlation Paleoecology
Palynological recovery
Diagnostic palynomorphs,pollen, and spores Biozone/stage)
(continued).

P.J. S
UG
AR
MA
N E
T AL.
CH
AP
TE
R 4
, FO
RT M
OT
T SIT
E4
7
Note: Data in
Classopollis torosus More common in Zone I
Pilosisporites trichopapillosus I-II
806.0 245. Nonmarine Very poor Cicatricosisporites spp. I-II See Discussion for sample 599.3 ft.Cicatricosisporites australensis More common in
Zone IClassopollis torosus More common in
Zone IDeltoidospora hallii (Cyatheaceae) More common in
Zone ITrilobosporites crassus I-II
Sample depthPaleoecology
Palynological recovery
Diagnostic palynomorphs,pollen, and spores Biozone/stage Discussion(ft) (m)
Table T2 (
this table determined by G. Brenner.
7 Aptian I Patuxent-Arundel
Stage Zone Stratigraphic correlation
continued).

P.J. SUGARMAN ET AL.CHAPTER 4, FORT MOTT SITE 48
Table T3. Data used to construct the cumulative percent plots on FiguresF4–F7. (See table notes. Continued on next page.)
Sampledepth
(ft)Clay/silt
(%)Glauconite
(%)*
Finequartz
(%)
Medium/coarser quartz sand
(%)Sphaerosiderite
(%)*Mica(%)*
Other(%)*
3.0 79.43 0 13 8 0 0 07.5 76.79 0 9 14 0 0 0
15.0 5.15 0 9 86 0 0 018.0 14.69 0 13 73 0 0 028.0 85.28 0 15 0 0 0 033.0 82.00 0 17 0 0 1 038.0 27.66 3 58 7 0 4 042.4 39.56 0 55 6 0 0 051.0 44.54 3 48 0 0 4 058.0 43.95 3 49 0 0 4 063.0 50.78 5 28 0 0 16 066.7 57.38 2 31 0 0 9 073.0 65.73 2 28 0 0 5 083.0 83.21 1 13 0 0 3 086.0 84.60 0 11 0 0 4 093.0 87.35 0 6 0 0 7 098.0 96.32 0 2 0 0 2 0
104.0 45.34 39 13 2 0 0 0108.0 48.06 17 16 19 0 0 0113.0 39.83 41 4 15 0 0 0118.0 60.49 10 17 3 0 9 0123.0 36.17 19 36 2 0 6 0132.5 33.01 0 13 54 0 0 0138.0 6.03 0 11 83 0 0 0142.7 7.02 0 76 17 0 0 0153.0 84.14 0 15 0 1 0 0164.0 85.02 0 14 0 0 0 0173.0 96.59 0 2 0 2 0 0183.0 86.82 0 2 0 11 0 0193.0 95.22 0 0 0 5 0 0203.0 67.34 0 11 19 3 0 0213.0 87.76 0 2 0 11 0 0223.0 84.22 0 0 0 15 0 0233.0 79.12 0 2 0 19 0 0243.0 86.47 0 13 0 0 0 0253.0 94.92 0 4 0 1 0 0263.0 97.65 0 0 0 2 0 0273.0 99.63 0 0 0 0 0 0283.0 59.81 0 40 0 0 0 0293.0 10.58 0 80 3 2 4 0303.0 9.41 0 43 44 0 0 3311.0 76.68 0 19 3 0 1 0318.0 58.06 0 37 0 0 5 0323.0 23.90 0 62 1 1 12 1328.0 7.14 0 76 1 0 14 2333.0 8.11 0 31 59 0 1 1343.0 88.56 0 8 0 2 1 0353.0 6.42 0 81 12 0 0 1363.0 14.40 0 19 49 17 0 0368.0 86.89 0 10 0 2 1 0373.0 95.74 0 4 0 0 0 0383.0 90.68 0 6 0 3 0 0393.0 65.08 0 20 0 13 1 0403.0 97.97 0 0 0 2 0 0413.0 90.95 0 1 0 8 0 0423.0 60.03 0 37 1 0 2 0433.0 62.45 0 29 3 0 2 4443.0 67.46 0 23 0 10 0 0453.0 70.76 0 28 0 0 1 0463.0 27.14 0 63 1 0 0 10473.0 53.01 0 43 0 2 0 2483.0 62.16 0 35 1 0 1 1493.0 81.07 0 18 0 0 0 0503.0 90.25 0 5 0 0 0 5508.0 63.90 0 32 3 0 0 1533.0 99.53 0 0 0 0 0 0543.0 79.45 0 6 0 14 1 0

P.J. SUGARMAN ET AL.CHAPTER 4, FORT MOTT SITE 49
Table T3 (continued).
Notes: * = The percent silt and clay in each sample was quantitatively measured by weighing eachsample before and after washing off the clay and silt. The weight of the remaining sand wascompared to the weight of the original sample to calculate percent silt and clay. All other per-centages were arrived at qualitatively by visually estimating the proportion of each constituentin the sand fraction.
553.0 40.05 0 54 0 0 6 0
558.0 85.28 0 13 0 0 1 0573.0 8.60 0 49 42 0 0 0582.0 51.98 0 48 0 0 0 0593.0 16.58 0 68 15 0 0 0605.0 65.80 0 27 0 5 1 0613.0 87.52 0 5 0 8 0 0623.0 91.74 0 8 0 0 0 0633.0 60.11 0 36 0 0 4 0643.0 30.95 0 39 22 0 2 6652.0 73.07 0 26 0 0 1 0663.0 88.98 0 6 1 4 0 0673.0 84.59 0 3 0 12 0 0683.0 83.65 0 3 0 14 0 0694.5 99.84 0 0 0 0 0 0703.0 92.43 0 3 0 4 0 0712.5 74.07 0 12 1 13 0 0722.2 45.20 0 44 8 3 0 0733.0 44.58 0 23 16 17 0 0743.0 85.93 0 9 3 2 0 0751.0 49.66 0 33 8 9 0 0763.0 97.88 0 0 0 2 0 0772.0 33.08 0 42 21 3 0 0783.0 77.67 0 0 0 22 0 0792.0 44.94 0 36 15 4 0 0805.5 67.15 0 9 7 0 0 16813.0 25.94 0 31 43 0 0 0
Sampledepth
(ft)Clay/silt
(%)Glauconite
(%)*
Finequartz
(%)
Medium/coarser quartz sand
(%)Sphaerosiderite
(%)*Mica(%)*
Other(%)*

P.J. SUGARMAN ET AL.CHAPTER 4, FORT MOTT SITE 50
CHAPTER NOTE*
N1. Browning, J.V., Miller, K.G., McLaughlin, P.P., Sugarman, P.J., Kominz, M.A.,Monteverde, D., Feigenson, M.D., and Hernández, J.C., submitted, Miocenesequences and facies, Bethany Beach, Delaware: effects of eustasy, tectonics, andsediment supply. Geol. Soc. Am. Bull.
*Dates reflect file corrections or revisions.