Embed Size (px)
Citation preview

Orlando Area Bicyclist Crash Study: A Role-Based Approach to Crash Countermeasures
A Study of Bicyclist-Motorist Crashes in the Orlando Urban Area in 2003 and 2004

2
Table of Contents List of Tables.............................................................................................................................................4
Data and Methodology .............................................................................................................................5
The Notion of Fault...................................................................................................................................6
Terminology .............................................................................................................................................7
Countermeasures for Bicyclist-Motorist Crashes ......................................................................... 8
Overview...........................................................................................................................................8
Choices, Not Skills.............................................................................................................................8
Fatalities ..........................................................................................................................................10
Children’s Skills and Judgment.........................................................................................................10
Cyclist Choices as Crash Causes.......................................................................................................12
Geographic Distribution ..................................................................................................................12
The Multi-Disciplinary/Multi-Modal Approach: Corridor Plans and Area-wide Plans...............................14
Countermeasures for Bicyclists ................................................................................................. 14
Travel with the Flow of Traffic..........................................................................................................14
Drive on the Roadway .....................................................................................................................15
Lane Positioning ..............................................................................................................................16
Adherence to Signs and Signals........................................................................................................18
Proper Yielding When Entering a Roadway ......................................................................................19
Effective Left Turn Strategy ...............................................................................................................19
Cyclist Conspicuity ..........................................................................................................................20
Emergency Maneuvers .....................................................................................................................21
Bicycle Maintenance........................................................................................................................22
Sobriety ...........................................................................................................................................22
Parking Lot Crashes..........................................................................................................................22
Summary of Bicyclist Countermeasures ...................................................................................................23
Countermeasures for Motorists ................................................................................................. 23
Safe and Legal Passing ....................................................................................................................23
Yield When Entering the Roadway from Driveways..........................................................................24
Yield When Required at Intersections ..............................................................................................24
Sobriety ...........................................................................................................................................27
Summary of Motorist Countermeasures ...................................................................................................27

3
Countermeasures for Engineers and Planners ........................................................................... 28
Bike Lanes and Paved Shoulders ......................................................................................................28
Wide Curb Lanes ............................................................................................................................29
Uni-Directional Sidepaths ...............................................................................................................30
Bi-Directional Sidepaths ..................................................................................................................31
Shared Use Paths in Separate Rights-of-Way .................................................................................... 33
Street Lighting .................................................................................................................................34
Other Concerns ..............................................................................................................................34
Loop Detectors and Signal Timing.............................................................................................34
Continuous Right Turn Lanes and Drop Lanes...........................................................................35
Countermeasures for Law Enforcement .................................................................................... 36
Enforcing Bicyclist Behaviors ...........................................................................................................36
Enforcing Correct Direction of Travel on Roadways ..................................................................36
Enforcing Obeisance of Signs and Signals..................................................................................36
Enforcing Yielding When Entering Roadway .............................................................................36
Enforcing Use of Required Lighting ...........................................................................................36
Enforcing Proper Behavior of Group Rides ................................................................................37
Enforcing Motorist Behaviors ...........................................................................................................37
Enforcing Proper Passing...........................................................................................................37
Enforcing Yielding When Entering the Roadway from Driveways ..............................................38
Enforcing Yielding When Required at Intersections ..................................................................38
Enforcing Yielding When Turning Right or Left..........................................................................38
Enforcing Sobriety.....................................................................................................................38
Conclusions ............................................................................................................................... 39
Citations .................................................................................................................................................41
Acknowledgements.................................................................................................................................42

4
List of Tables Table A — Fatalities per Million Hours of Activity .....................................................................................8
Table B — Crash Types for Bicyclist Fatalities ..........................................................................................10
Table C — Unsafe Choices......................................................................................................................12
Table D — Corridors with High Numbers of Bicyclist-Motorist Crashes ...................................................13
Table E — Corridors with High Concentrations of Crashes Involving Bicyclists Facing Traffic ..................15
Table F — Comparison of Sidewalk and Roadway Crashes ......................................................................15
Table G — Crashes per Million Miles of Exposure by Facility Type..........................................................16
Table H — Crash Type Groups by Bicyclist Position................................................................................17
Table I — Crash types Mitigated by Correct Bicyclist Lane Positioning.....................................................18
Table J — Crash Types Involving Bicyclist Violations of traffic Control devices ........................................18
Table K — Crash Type Groups by Lighting Condition .............................................................................. 21
Table L — Bicyclist-Implemented Countermeasures Compiled.................................................................23
Table M — Motorist Failed to Yield When Entering Roadway from Driveway ..........................................24
Table N — Crash Types Involving Motorists failing to Yield at Intersections .............................................24
Table O — Crash Types: All Motorist-caused Intersection and Driveway Crashes.....................................25
Table P — Crash Types Involving Turning Motorists ................................................................................26
Table Q — Motorist-Implemented Countermeasures Compiled ...............................................................27
Table R — Crash Types Potentially Aggravated by Uni-Directional Sidepaths...........................................30
Table S — Crash Types Potentially Aggravated by bi-Directional Sidepaths..............................................33
Table T — Crashes Before and After Construction of Trails ...................................................................... 34
Table U — Concentrations of Crashes Involving Bicyclists without Legal Lighting....................................37
Charts Comparing Characteristics of Child and Adult Bicyclist Crashes....................................................11
Child Crash Type Groups
Child Crashes by Direction
Child Crashes by Position
Child Crashes by Number of Lanes
Adult Crash Type Groups
Adult Crashes by Direction
Adult Crashes by Position
Adult Crashes by Number of Lanes

5
Data and Methodology This report documents a study of 885 crashes between bicyclists and motorists in Orange, Seminole and
Osceola Counties for the years 2003 and 2004. Long-form crash reports were collected from local governments and the Florida Department of Highway Safety and Motor Vehicles (DHSMV). Database tables were provided from the University of Florida using data from DHSMV. All crashes were analyzed for behavioral types by METROPLAN ORLANDO staff using the Pedestrian and Bicycle Crash Analysis Tool (PBCAT) software from the Federal Highway Administration and the University of North Carolina Highway Safety Research Center. The University of Florida’s Department of Urban and Regional Planning plotted the majority of the crashes in ArcGIS; crash locations which could not be located by the University team were plotted by METROPLAN ORLANDO staff.
The approach for this report is somewhat different from the conventional. Normally crash types and factors are identified and presented, with a list of potential countermeasures that might address the problems. Bicyclist and pedestrian crashes require countermeasures that involve a wide range of roles in the community, and most countermeasures have the potential to affect a number of crash types and conditions. For example, proper lane positioning on the part of the bicyclist can mitigate a number of different crash types: Motorist Overtaking – Misjudged Space; Motorist Right Turn – Same Direction; Motorist Left Turn – Opposite Direction; Motorist Drive-out from Driveway; and Motorist Drive-out at Sign-Controlled Intersection.
This report groups the countermeasures for each role assumed in the community: bicyclist, motorist, traffic engineer, planner, and law enforcement officer. Each countermeasure is assessed for its potential to reduce crashes based on the numbers and types of crashes that have occurred in the area during the study period. In this way each person understands his or her personal responsibility and potential for reducing the number and severity of crashes. Each role contributes a significant percentage of the overall problem, and many of the countermeasures reinforce or depend upon other countermeasures.
A key point: the percentages expressed for mitigation are potential, not absolute.
Measuring the actual mitigation potential for each countermeasure to its respective crash type(s) is well beyond the scope of this study, but the potentials expressed in this report are reasonably based on experience. Of course no countermeasure is 100 percent effective. Some may approach 100 percent effectiveness for one type of crash, but may result in increases of other types (an example is a sidewalk bikeway, which eliminates virtually 100 percent of motorist overtaking crashes, but increases the risk for intersection crashes).
It should also be noted that the percentages expressed in this report are based on a “snapshot” of crashes during a two-year period, and that the relative proportions of these crash types and factors will change over time. They may also differ from proportions found in other urban areas, and will certainly differ from crash characteristics in more rural areas. The relative priorities for countermeasures may change over time, and new countermeasures may be developed in the future, but most of these current countermeasures will continue to have value for the foreseeable future.
Geographically speaking, these crashes tend to be widely dispersed, rarely occurring twice at the same location. These crashes do however, tend to occur more often along major arterial corridors, especially those with heavy commercial activity or near colleges. In a few cases certain crash types and factors form small clusters around city centers.

6
A Note on the Notion of “Fault” The term “fault” in this report refers strictly to the behaviors required by statute. But there are extenuating
circumstances that affect bicyclist behavior, particularly regarding children, and regarding adults traveling along arterial and collector roads.
Children of course, depending on age, cannot be expected to always understand the rules, and have a ten-dency to behave impulsively; they are often determined to complete an action once they have initiated it. They also watch adults for their models on how to behave when bicycling, and many adults model illegal or unsafe cycling behavior.
Many child crashes involve behaviors that can be addressed through effective education. Children are a “captive audience” that can be trained through the school system. Many parents are not qualified to train their children since they themselves do not know some of the key practices and skills.
For adult bicyclists the situation is more complicated. Some of the behavioral countermeasures for bicyclists described in this report run contrary to powerful messages informally conveyed by parents, motorists, and some-times even law enforcement officers.
Few Americans truly understand proper roadway bicycling practices or the true risks of those practices com-pared to commonly accepted behaviors (such as cycling on the sidewalk). Adult bicyclist behavior is colored mostly by a distrust of motorists; overtaking motorists in particular. Adult bicyclists who drive their vehicles prop-erly on the roadway are routinely threatened and harassed for doing so. Such threats come from only a very small percentage of the population, but have an intense effect on many bicyclists, compelling them to utilize “coping strategies” that actually place them at greater risk; some of these coping strategies are illegal.
Some parents direct their children to bike against the flow of traffic “so you can see the cars coming and get out of the way.” This behavior often carries through to adulthood.
Bicyclists are rarely cited for basic violations such as driving against traffic, running red lights and stop signs, and traveling at night without lights.
Until effective bicycling training for children is commonplace, and correct bicycling behavior by adults is fully understood and supported by the community — especially by motorists — attribution of “fault” will remain an incomplete portrayal of the problem.
“Bike safety” has come to be equated in large part with “helmets” and “bike paths.” Reliance on these strate-gies tends to reinforce the mistaken notion they are the most effective. Such an approach leads people to believe that “bike safety” is mostly about “things,” when it is in fact mostly about behavior. This discourages interest in real bicycling education and training.
One goal of this report is to empower bicyclists, and to help them (as well as motorists, traffic engineers and law enforcement officers) to understand the most effective strategies for reducing their risk.

7
Terminology Meanings for the following terms are explained for clarity. As much as possible, Florida statutory language
will be used.
Bicycle -- Every vehicle propelled solely by human power, having two tandem wheels, and including any device generally recognized as a bicycle though equipped with two front or two rear wheels. The term does not include such a vehicle with a seat height of no more than 25 inches from the ground when the seat is adjusted to its highest position or a scooter or similar device. This definition does not include toy vehicles such as scooters, “Big Wheels” or similar pedal-powered toys.
Bicyclist or Cyclist – Used interchangeably; any person riding upon a bicycle. A person walking a bicycle (and not straddling it) is a pedestrian.
Bi-Directional Sidepath – A Shared Use Path adjacent to a roadway, and separated from the roadway by either a curb or unpaved area. Both pedestrians and bicyclists are permitted and expected to travel in either direction on such paths.
Bike Lane or Bicycle Lane – A portion of the roadway intended for the use of bicyclists. Bike lanes are generally five or more feet in width measured from the lane stripe to the face of the curb or edge of the roadway and are designated with pavement markings and signage.
Conspicuity -- The quality of being conspicuous; obviousness.
Crash – the term “accident” is not used in this report; it implies that an event could not have been avoided by one or more parties. The vast majority of collisions between road users are due to an illegal action or error on the part of one or more parties.
Drive, Driver or Driving – Florida statutes define a driver as “Any person who drives or is in actual physical control of a vehicle on a highway.” Bicycles are statutorily defined as vehicles, thus bicyclists are drivers.
Loop Detector – A loop of wire embedded in the pavement at an intersection that is charged with electric current to create an alternating magnetic field. When this field is interrupted by a significant amount of metal, a signal is sent to a device that controls the traffic signal.
Motorist – Distinct from the broader term “driver;” a person in control of a motor vehicle.
Paved Shoulder – A paved portion of the roadway to the right of the right-most edge line. Paved shoulders are not intended for regular travel by motor vehicles, but help in recovery from run-off-the-roadway incidents and provide a space for bicyclists to travel outside the regular path of motorists.
Roadway - That portion of a highway improved, designed, or ordinarily used for vehicular travel. Florida statutes exclude shoulders from the definition of roadway. Bicyclists often use paved shoulders, and FDOT includes them as parts of the roadway for the purposes of roadway design. The roadway does not include unpaved areas, paved sidewalks, or shared use paths.
Street, Road or Highway -- The entire width between the right-of-way lines of every way or place open to the use of the public for purposes of vehicular traffic. These terms include the sidewalks.
Shared Use Path – A paved path intended for use by both pedestrians and bicyclists. These paths may be located in entirely separate rights-of-way, or may be parallel and adjacent to roadways. Such facilities are often referred to as “trails.”
Undesignated or “Silent” Bike Lane or Bicycle Lane – Same as a Bicycle Lane, but without pavement markings or signage indicating it is for the use of bicyclists.
Uni-Directional Sidepath – A path intended for bicyclists separated from the roadway by either a curb or unpaved area. Bicyclists on such facilities are expected to travel only with the flow of traffic. Such facilities are referred to as “cycle tracks” in Europe.
Wide Curb Lane – A right-most through lane (excluding right-turn lanes) of at least fourteen (14) feet in width.

8
Countermeasures for Bicyclist-Motorist Crashes
Overview
Individual crashes often have multiple causes and factors, thus countermeasures will often overlap. For example, a motorist might fail to yield to a bicyclist at a stop sign, but if the crash involved a bicyclist traveling against the flow of traffic while on the sidewalk, the countermeasures would be both improved scanning on the motorist’s part and choosing to travel on the right side of the street on the cyclist’s part. This report explores the potential effectiveness of the behavioral, engineering, planning, and enforcement countermeasures available to bicyclists, motorists, traffic engineers, transportation and land use planners, and law enforcement agencies.
Choices, Not Skills
There is a common belief that bicycling amidst motor vehicle traffic carries an unacceptably high risk, or that doing so requires skills or understanding beyond the capacity of the average person. Neither of these beliefs is true. While alarmists frequently point to Florida’s ranking as the state with the highest rate of bicyclist fatalities, that rate is rarely compared to the risks of other activities, and the absolute risk for cycling is quite low. Risk analysis consultants Failure Analysis Inc. compared the fatality rates for various modes of travel in 1993, and as shown below, cycling presents a lower per-hour fatality risk than motor vehicle travel.
Table A
1993, Failure Analysis Inc. (now Exponent Corp.)
It’s also important to recognize that this risk is generalized to the entire bicycling population. Cyclists who drive properly have much lower risks than the general population because they do not conduct high risk behaviors such as cycling at night without lights, cycling while intoxicated, or generally disobeying the rules of the road. So the competent cyclist’s risk per million hours is far lower than expressed above.
Bicycling safely with motor vehicle traffic does require certain skills, but more importantly it requires adherence to the rules of the road for vehicles and the use of key practices. The following practices are the most commonly implemented and are utilized by all vehicle drivers:
Traveling with the flow of traffic
Stopping for stop signs and red lights
Yielding when entering the roadway
Scanning ahead for threats from cross-streets, driveways and turning vehicles
Scanning behind for and negotiating with overtaking traffic before moving left
Not using a right turn lane for through movements
Yielding when changing lanes
Turning left from the left turn lane or left-most lane
Using headlights and taillights at night
Airline Travel 0.15
School Bus Travel 0.22
Bicycling 0.26
Automobile Travel 0.47
Life Overall 1.53
Motorcycling 8.80
Mode Fatalities per Million

9
There are also practices available to cyclists that can mitigate unsafe choices made by motorists; what we could call bicycling-specific defensive driving practices. Of all public right-of-way cyclist/motorist crashes, 16.7% (129 of 773) were the fault of the motorist. Most of these motorist-caused crashes can be mitigated by cyclists through lane positioning, which will be described in greater detail later.
Skills too are important, though the vast majority of crashes can be avoided through use of skills known by most cyclists. The actual physical skills of cycling are:
Starting
Steering & balance
Braking
Scanning ahead for conflicts
Scanning behind without swerving
Driving with one hand to signal
Of these, only “scanning behind without swerving” is problematic for some cyclists, although it can be learned readily by anyone capable of riding a bicycle, and is routinely taught to children as young as five. There are a few advanced skills taught to cyclists in formal cycling classes, but these emergency maneuvers are rarely used or needed, especially if proper lane positioning is utilized:
Rock Dodge (sudden, controlled swerve to avoid road surface hazards without diverting into the path of potentially overtaking motorists)
Quick Stop (emergency braking technique using weight shift and optimized use of front and rear brakes)
Instant Turn (emergency turning technique using counter-steering)
Those who cycle on the roadway and obey the rules of the road are involved in a very small percentage of all crashes.
Of 657 daytime crashes, only 8.4% (55) involved sober cyclists who were traveling on the roadway and were confirmed as obeying the rules of the road (6.2% of all 885 crashes). Only 15 of these (2.3% of daytime and 1.7% of all crashes) involved overtaking motorists. Two of the 15 resulted in incapacitating injuries.
Of 196 night-time crashes, only 8.2% (16) involved sober cyclists who were traveling on the roadway and were confirmed as obeying the rules of the road. Of these, only three were confirmed as being equipped with lights.

10
Fatalities
The 17 cyclist fatalities during the study period were associated predominantly with darkness and intoxication. Eight of the crashes occurred at night, with none of the cyclists confirmed as having lights; one crash occurred at dusk. In eight of the crashes the cyclist was confirmed as being intoxicated with either alcohol or drugs, and two more were reported as “Had Been Drinking.” One crash involved an intoxicated motorist and a second motorist “Had Been Drinking.”
Only one of the fatalities involved a child under 16 (age 7); 12 of the 17 involved adults aged 40 or over.
Crash types associated with these fatalities are in Table B below. Only two of the crashes involved overtaking motorists, and those also involved intoxicated cyclists, and both were also at night. The bicyclist was at fault in all but one crash, in which a motorist left the roadway and hit the cyclist on the sidewalk.
Table B
1 Bicyclist facing traffic, intoxicated, and without lights 2 Bicyclist without lights 3 Bicyclist on sidewalk 4 Bicyclist intoxicated and without lights 5 Bicyclist entered roadway from unpaved area
Children’s Skills and Judgment
Children can acquire key cycling skills and understand the basic principles of traffic with each successive year, but judgment of course takes time to develop. Parents would best serve their children's’ safety by themselves learning the basic skills and principles of cycling in traffic. A parent so trained can then assess his or her child’s abilities and judgment and determine where and when the child may travel by bike, either escorted or un-escorted. Curriculums that are age-appropriate are available for implementation in schools; parents may wish to organize to ensure their schools implement such programs. The Florida Traffic & Bicycle Safety Education Program (http://www.dcp.ufl.edu/centers/trafficsafetyed/) has developed such curricula and helps communities implement them.
As shown in the charts on Page 11, the general characteristics of child and adult bicycling crashes differ very little, except by the number of lanes of the street on which the crash occurred. Clearly, both adults and children need to acquire and utilize key practices and skills in order to reduce crashes.
Crash Types for Bicyclist Fatalities Roadway Sidewalk
or Sidepath Other All
Bicyclist Left Turn - Opposite Direction 1 1
Bicyclist Right Turn - Same Direction1 1 1
Bicyclist Ride Out - Driveway or Other Mid-Block Location 3 2 15 6
Bicyclist Violation at Signalized Intersection 1 1
Bicyclist Violation at Stop Sign 3 3
Bicyclist Lost Control - Alcohol / Drug Impairment 1 1
Head-On – Motorist2 1 1
Motorist Lost Control - Other / Unknown3 1 1
Motorist Overtaking - Undetected Bicyclist4 1 1
Sign-Controlled Intersection - Other / Unknown 1 1
Total 11 4 2 17

11
1 Lane2%
2 Lanes48%
4 Lanes37%
6+ Lanes13%
1 Lane2%
2 Lanes70%4 Lanes
22%
6+ Lanes6%
Bicyclist Failure to Yield37%
Motorist Failure to Yield24%
Motorist Overtaking5%
Other Crossing Path15%
Parking Lot7%
Other/Unusual/ Unknown
12%
Bicyclist Failure to Yield25%
Motorist Failure to Yield36%
Motorist Overtaking10%
Other Crossing Path15%
Other/Unusual/ Unknown
11%
Parking Lot3%
With Traffic33%
Facing Traffic39%
Not Applicable17%
Unknown11%
With Traffic41%
Facing Traffic44%
Not Applicable10%
Unknown5%
Shared Lane38%
Sidewalk42%
Driveway or Alley3%
Parking Lot10%
Unpaved Area1%
Unknown4%
Bike Lane or Paved Shoulder
2%
Shared Use Path<1%
y
Shared Lane40%
Sidewalk44%
Shared Use Path1%
Driveway or Alley3%
Unknown2%
Parking Lot4%
Unpaved Area1%
Bike Lane or Paved Shoulder
5%
Child Crash Type Groups (Under Age 16 — 275 Crashes) Adult Crash Type Groups (Over Age 15 — 605 Crashes)
Adult Crashes by Direction (605 Crashes)
Adult Crashes by Position (605 Crashes)
Adult Crashes by Number of Lanes (543 Crashes)
Child Crashes by Direction (275 Crashes)
Child Crashes by Position (280 Crashes)
Child Crashes by Number of Lanes (230 Crashes)

12
Cyclist Choices as Crash Causes
At Least 64.1% of All Bicyclist-Motorist Crashes Involved an Unsafe Choice on the Part of the Bicyclist
Unsafe choices include basic violations of traffic laws such as cycling on the roadway against traffic, violating stop signs and red lights, failing to yield when entering the roadway, driving while intoxicated, and not using lights at night. They also include cycling on the sidewalk against the flow of traffic. This last behavior is not illegal, but it increases the cyclist’s crash risk at least threefold over traveling with the flow. Cyclists driving against the flow of traffic place themselves outside the normal scanning patterns of motorists and are particularly susceptible to crashes at intersection and driveway crossings. In many crashes bicyclists have committed more than one of these unsafe choices, so the percentages overlap.
Of 885 cyclist/motorist crashes, 60.6% (536) involved an unsafe choice of movement on the part of the cyclist on a public roadway, sidewalk or path. This is nearly as true for adult cyclists (56%) as for children (62.8%). Adults are more likely than children to be involved in a crash where they are traveling against flow. It may be that motorists are more cautious when they see child cyclists than when they see adults approaching.
Table C
Data from crash reports on bicyclists’ use of proper lights is incomplete. Of all crashes 22.1% (196 of 885) occurred at night. In 154 (78.6%) of these reports, there was no indication as to whether or not the bicyclist was properly equipped. In 39 cases (19.9%) the cyclist was confirmed as lacking a headlight, taillight, or both. We can state that at least 4.4% of all crashes involved a cyclist who chose not to use lights at night. In at least 18 of the 39 no-light incidents (2.0% of all crashes), there were no other improper behaviors committed by the cyclist, so the lack of lighting was the primary cyclist contribution to the crash.
In 22 crashes (2.5%) the bicyclist was intoxicated with alcohol, drugs or both. In another 44 cases (5.0%) the report stated that the cyclist “had been drinking.” In ten of these 66 cases the cyclist also lacked lights at night; two of those were fatalities. In at least 13 of these 66 crashes (1.5% of all) there were no other improper behaviors committed by the cyclist, so intoxication was the primary cyclist contribution to the crash.
Combining the unsafe choices from Table C (60.6%) with the lack of required lights (2.0%) and intoxication (1.5%) results in a total of 64.1% of crashes involving unsafe bicyclist choices.
Geographic Distribution
While these crashes rarely repeat at the same exact locations and intersections, they do tend to cluster along particular corridors, especially multi-lane arterials with heavy commercial activity and lower income neighborhoods. The types of behaviors leading to crashes are not dramatically different between low income and middle or upper income areas; the higher concentrations are instead due to higher levels of bicycle use. The corridors with the highest numbers of crashes are:
All Ages Adults (over age 15; 618 crashes)
Children (under age 16; 282 crashes)
Percent of Age Group (Number)
All “Unsafe Choices” 60.6% (536) 56.0% (346) 62.8% (177)
Violations 39.1% (352) 35.4% (219) 43.3% (122)
Facing Traffic on Sidewalk; No Cyclist Violation
24.2% (218) 24.8% (153) 19.5% (55)
“Unsafe Choices” for All Public ROW Crashes (773)

13
Table D
These 69.6 miles of streets account for 25.3% of bicyclist-motorist crashes, but only 0.9% of the roughly 8,000 centerline miles of non-limited access roads in the metropolitan area.
Street Limits Corridor Factors Number Through
Lanes
Length in
Miles
Number of
Crashes
Crashes per Mile per
Year
Westmoreland Avenue Robinson Street to Anderson Street
Low Income Neighborhood; Commercial Corridor
2 0.6 9 7.5
Alafaya Trail (SR 434)
University Blvd. to Colonial Drive
University of Central Florida 6 2.1 13 3.1
University Boulevard Semoran Blvd. to Goldenrod Road
Full Sail School 6 1.25 12 4.8
Orange Blossom Trail (US 441)
Colonial Drive to Sand Lake Road
Low Income Neighborhoods; Commercial Corridor
6 7.1 35 2.5
Pine Hills Road North Lane to Silver Star Road
Low Income Neighborhoods 4 1.3 6 2.3
State Road 434 Maitland Blvd. to Edgewater Drive
Low Income Neighborhoods 4 2.0 8 2.0
Hiawassee Road Coral Cove Dr. to Balboa Drive 4 2.2 7 1.6
Rio Grande Avenue Gore Street to Holden Avenue
Low Income Neighborhoods 4 2.5 8 1.6
Colonial Drive (SR 50)
Goldenrod Road to Alafaya Trail
Commercial Corridor 4/6 4.8 15 1.6
US Highway 17/92 Semoran Blvd. to SR 434
Commercial Corridor 6 2.8 8 1.4
Semoran Boulevard (SR 436)
Colonial Drive to TG Lee Blvd.
Low Income Neighborhoods; Commercial Corridor
6 6.7 17 1.3
Goldenrod Road (SR 551)
University Blvd. to Narcoosee Rd.
Low Income Neighborhoods 4 8.4 22 1.3
Colonial Drive (SR 50)
Hughey Avenue to Bennett Road
Commercial Corridor 4 3.0 8 1.3
Conway Road (SR 15)
Curry Ford Road to Hoffner Ave.
Commercial Corridor 4 3.0 8 1.3
Colonial Drive (SR 50)
Hiawassee Road to Orange Blossom Trl.
Low Income Neighborhoods; Commercial Corridor
4/6 4.9 12 1.2
State Road 434 Ronald Reagan Blvd. to SR 419
Commercial Corridor 4 3.4 8 1.2
US 192 Brown Chapel Road to Narcoosee Road
Commercial Corridor 4/6 4.0 9 1.1
Kirkman Road (SR 435)
Old Winter Garden Road to Vineland Road
Low Income Neighborhoods; Commercial Corridor
4/6 3.8 8 1.0
Vine Street (US 192)
State Road 535 to Orange Blossom Trail
Commercial Corridor 6 5.7 11 1.0
Total Above 69.6 224 1.6
Corridors With High Numbers of Bicyclist-Motorist Crashes

14
The Multi-Disciplinary/Multi-Modal Approach: Corridor Plans and Area-wide Plans As the highest concentrations of bicyclist crashes tend to be along major arterial corridors, and pedestrian
crashes are similarly concentrated, corridor safety plans that involve traffic engineers, transportation planners, land use planners, law enforcement officers, businesses, and citizens have the best potential to affect positive change. Smaller area plans are of less concern for bicycling due to the generally wide dispersal of those crashes, but pedestrian crashes do show some significant concentrations.
A separate document addresses the Multi-Disciplinary/Multi-Modal Approach.
Countermeasures for Bicyclists
Travel with the Flow of Traffic
Potentially Mitigates 43%
Of 885 crashes, 42.7% (378) involved cyclists driving facing traffic on roadways, sidewalks or paths. Of those, 24% (91) were on a roadway, and 74% (281) were on a sidewalk or shared use path. Traveling against the flow of traffic places cyclists outside the normal scanning pattern of motorists, particularly those making turns from driveways and cross-streets.
In some circumstances, particularly when the destination is on the same side of the roadway a short distance away, cyclists may not wish to cross a roadway in order to travel with the flow. Doing so requires crossing the roadway twice, which may put the cyclist at greater risk than traveling against the flow on the sidewalk. Still, all cyclists should be aware of the seriously increased risk of traveling against the flow.
Geographic Distribution
Crashes involving cyclists traveling facing traffic on the sidewalk tend to be concentrated along commercial multi-lane arterials where motorists are often entering and exiting the roadway from driveways and cross-streets. Since this is the most common type of bicyclist-motorist crash, the concentrations of these crashes correlate well to the overall concentrations.

15
Table E
Concentrations of crashes involving wrong-way cyclists on the roadway are far less common. Semoran
Boulevard (SR 436) between Colonial Drive and Curry Ford Road, and Alafaya Trail (SR 434) between University Boulevard and Colonial Drive are the only two notable corridors. Eight crashes involving wrong-way on-roadway cyclists occurred on the west side of downtown Orlando. A concentration of four such crashes was found at near the intersection of Hoffner Avenue and Semoran Boulevard.
Drive on the Roadway
This is likely the most contentious issue in bicycling safety and accommodation. The data in this study alone cannot answer the question as to whether a cyclist traveling with the flow of traffic is safer on the sidewalk or the roadway, since exposure levels are unknown. One must also take into consideration whether or not the cyclist was violating a traffic law or traveling at night, which is inherently riskier for any mode.
Table F
Table F shows that even when cyclist violations and poor lighting conditions are filtered out, roadway
cyclists still account for a larger proportion than sidewalk cyclists. However, the relative numbers of roadway and sidewalk cyclists is not known. This matter will be addressed in a supplemental study.
Wachtel and Lewsiton (ITE Journal, 1994) found that cyclists aged 18 and over going with the flow were 30% more likely to experience an intersection crash on a sidewalk than on a roadway; for cyclists under 18 it was a 20% greater risk. Moritz (Transportation Research Board, 1998) found that experienced cyclists had much higher crash rates when traveling on sidewalks than on roadways or shared use paths in separate rights-of-ways (see Table G). This data did not indicate what percentage of the sidewalk crashes involved cyclists going against the flow, but if we apply the 27% figure from our local data to Moritz’s rate, it drops the sidewalk rate to 344 crashes per million miles, still 13.8 times higher than for Major Streets without Bicycle Facilities and 21.5 times higher than Bike Lanes. Moritz’s exposure rates include all crashes, including those not involving motor vehicles; however, he did split crashes into “Minor” and “Serious,” and the proportions of sidewalk and roadway crashes did not differ significantly between the two groups.
Street Limits Length
in Miles
Number of
Crashes
Crashes per Mile per Year
University Boulevard Semoran Blvd. to Goldenrod Road 1.25 5 2.0
Alafaya Trail (SR 434) University Blvd. to Colonial Drive 2.1 7 1.7
Orange Blossom Trail (US 441) Colonial Drive to Sand Lake Road 7.1 21 1.5
Conway Road (SR 15) Curry Ford Road to Hoffner Avenue 3.0 5 0.8
Goldenrod Road (SR 551) University Blvd. to Narcoosee Road 8.4 10 0.6
Colonial Drive (SR 50) Hiawassee Road to Orange Blossom Trail 4.9 6 0.6
Corridors With High Concentrations of Crashes Involving Bicyclists Facing Traffic
All With Flow
With Flow + Daytime
With Flow + No Violation
With Flow + Daytime + No Violation
Percent (Number)
Sidewalk with Flow 27.6% (91) 32.0% (72) 31.0% (54) 35.5% (43)
Roadway with Flow 72.4% (239) 68.0% (153) 69.0% (120) 64.5% (78)
All with Flow 100% (330) 100% (225) 100% (174) 100% (121)
Comparison of Sidewalk and Roadway Crashes

16
Table G
1998, Moritz, TRB
Table H shows how law-abiding, daytime, with-the-flow sidewalk and roadway cyclists come into conflict with motorists. As would be expected, Motorist Overtaking crashes are more likely for roadway cyclists compared to sidewalk cyclists, but most other crash types are more likely for sidewalk cyclists. The next countermeasure -- lane positioning -- can mitigate not only the Motorist Overtaking crashes, but many of the intersection conflicts as well. By its very nature, lane positioning cannot be implemented by sidewalk cyclists.
Left turns often present more conflicts for with-the-flow sidewalk cyclists than for with-the-flow roadway cyclists. These conflicts are likely represented in some of the mid-block cyclist failure to yield crashes. Five crashes were characterized as cyclists making left turns from the right-side sidewalk.
Convincing bicyclists who are intimidated by the thought of cycling on roadways cannot be accomplished through reason alone; it requires real-world training and experience. For this reason it may be more useful to measure the effectiveness of certain countermeasures separately for roadway and sidewalk cyclists.
Lane Positioning
Potentially Mitigates 12% of Roadway Bicyclist Crashes
Up to 12.1% of crashes involving roadway cyclists (379 total) might be mitigated through proper lane positioning. Bicyclists are often given to understand they must drive “as close as possible to the right side of the roadway.” This is a misinterpretation of the law, which states cyclists must drive…
“…as close as practicable to the right-hand curb or edge of the roadway except…[w]hen reasonably necessary to avoid any condition, including, but not limited to, a fixed or moving object, parked or moving vehicle, bicycle, pedestrian, animal, surface hazard, or substandard-width lane, that makes it unsafe to continue along the right-hand curb or edge. For the purposes of this subsection, a "substandard-width lane" is a lane that is too narrow for a bicycle and another vehicle to travel safely side by side within the lane.”
Florida Statute 316.2065
Cycling too close to the curb or edge invites motorists to pass when there is insufficient width to do so safely. Cycling farther into the lane encourages a motorist to make a conscious and proper pass. Proper lane positioning also increases the chance that a cyclist will be noticed by a motorist on a converging path, and provides the cyclist with more maneuvering room with which to avoid such motorist errors.
The following crash types can be mitigated to some extent through proper lane positioning combined with driving with the flow of traffic:
Facility Type Crashes per Million Miles of Exposure
Bike Lanes 16
Signed Bike Routes 20
Major Streets without Bicycle Facilities 25
Minor Street without Bicycle Facilities 37
Shared Use Paths 55
Sidewalks 637
Motorist Overtaking — Misjudged Space
Motorist Right Turn — Same Direction

17
Bike Lane or Paved Shoulder
Shared Lane
All Roadway (Bike Lane, Paved Shoulder & Shared Lane Combined)
Sidewalk Total
(Roadway and Sidewalk)
Percent of Column (Number)
Backing Vehicle 0.0% 1.5% (1) 1.3% (1) 2.3% (1) 1.7% (2)
Bicyclist Failed to Clear - Trapped 0.0% 3.0% (2) 2.6% 0.0% 1.7% (2)
Bicyclist Ride Out - Sign-Controlled Intersection 0.0% 1.5% (1) 1.3% (1) 0.0% 0.8% (1)
Bicyclist Ride Through – Stop Sign 0.0% 1.5% (1) 1.3% (1) 0.0% 0.8% (1)
Bicyclist Right Turn - Same Direction 0.0% 1.5% (1) 1.3% (1) 0.0% 0.8% (1)
Bicyclist Turning Error - Right Turn 0.0% 1.5% (1) 1.3% (1) 0.0% 0.8% (1)
Crossing Paths - Intersection - Other / Unknown 8.3% (1) 6.1% (4) 6.4% (5) 7.0% (3) 6.6% (8)
Crossing Paths - Uncontrolled Intersection 0.0% 1.5% (1) 1.3% (1) 0.0% 0.8% (1)
Motorist Drive Out - Commercial Driveway 16.7% (2) 4.5% (3) 6.4% (5) 9.3% (4) 7.4% (9)
Motorist Drive Out - Midblock – Unknown 0.0% 0.0% 0.0% 2.3% (1) 0.8% (1)
Motorist Drive Out - Residential Driveway 8.3% (1) 0.0% 1.3% (1) 2.3% (1) 1.7% (2)
Motorist Drive Out - Signalized Intersection 0.0% 0.0% 0.0% 2.3% (1) 0.8% (1)
Motorist Drive Out - Sign-Controlled Intersection 8.3% (1) 4.5% (3) 5.1% (4) 20.9% (9) 10.7% (13)
Motorist Drive Through - Signalized Intersection 0.0% 3.0% (2) 2.6% (2) 0.0% 1.7% (2)
Motorist Drive Through – Stop Sign 8.3% (1) 0.0% 1.3% (1) 0.0% 0.8% (1)
Motorist Left Turn - Opposite Direction 8.3% (1) 9.1% (6) 9.0% (7) 4.7% (2) 7.4% (9)
Motorist Left Turn - Same Direction 0.0% 4.5% (3) 3.8% (3) 0.0% 2.5% (3)
Motorist Lost Control - Other / Unknown 0.0% 1.5% (1) 1.3% (1) 2.3% 1.7% (2)
Motorist Overtaking - Misjudged Space 8.3% (1) 28.8% (19) 25.6% (20) 0.0% 16.5% (20)
Motorist Overtaking - Other / Unknown 8.3% (1) 4.5% (3) 5.1% (4) 2.3% (1) 4.1% (5)
Motorist Right Turn - Same Direction 16.7% (2) 9.1% (6) 10.3% (8) 30.2% (13) 17.4% (21)
Motorist Turn / Merge - Other / Unknown 8.3% (1) 0.0% 1.3% (1) 0.0% 0.8% (1)
Motorist Turning Error - Left Turn 0.0% 3.0% (2) 2.6% (2) 0.0% 1.7% (2)
Motorist Turning Error – Other 0.0% 1.5% (1) 1.3% (1) 2.3% (1) 1.7% (2)
Motorist Turning Error - Right Turn 0.0% 0.0% 0.0% 2.3% (1) 0.8% (1)
Parallel Paths - Other / Unknown 0.0% 1.5% (1) 1.3% (1) 0.0% 0.8% (1)
Signalized Intersection - Other / Unknown 0.0% 0.0% 0.0% 9.3% (4) 3.3% (4)
Sign-Controlled Intersection - Other / Unknown 0.0% 4.5% (3) 3.8% (3) 0.0% 2.5% (3)
Unusual Circumstances 0.0% 1.5% (1) 1.3% (1) 0.0% 0.8% (1)
Grand Total 100% (12) 100% (66) 100% (78) 100% (43) 100% (121)
Crash Type Groups by Bicyclist Position (Traveling With the Flow of Traffic Only)
Table H

18
Table I
This countermeasure will increase in overall importance as
sidewalk cyclists choose to use the roadway.
Geographic Distribution
Crashes that can be mitigated with this countermeasure tend to be concentrated around the older sections of the City of Orlando (18 of 78), but otherwise show no geographic concentrations or patterns.
Adherence to Signs and Signals
Potentially Mitigates 15% to 18%
At least 14.5% (128) of all crashes involved cyclists who violated a stop sign, yield sign, or a traffic signal. In an additional 35 cases (4.0%) it is possible that the cyclist violated a sign or signal.
Table J
Crash Types Mitigated by Correct Bicyclist Lane Positioning
Percent of All Roadway Cyclist
Crashes (379) Motorist Overtaking - Misjudged Space 4.7% (18) Motorist Right Turn - Same Direction 2.1% (8) Motorist Left Turn - Opposite Direction 1.8% (7) Motorist Drive Out - Commercial Driveway / Alley 1.3% (5)
Motorist Drive Out - Sign-Controlled Intersection 1.0% (4)
Motorist Overtaking – Other / Unknown 0.5% (2) Backing Vehicle 0.3% (1) Motorist Drive Out - Residential Driveway 0.3% (1)
Total 12.1% (46)
Crash Types Involving Bicyclist Violations of Traffic Control Devices
Percent of All Crashes Percent of 885 (Number)
Bicyclist Ride Out - Signalized Intersection 1.1% (10)
Bicyclist Ride Out - Sign-Controlled Intersection 2.0% (18)
Bicyclist Ride Through - Signalized Intersection 4.4% (39)
Bicyclist Ride Through - Sign-Controlled Intersection 4.4% (39)
Signalized Intersection - Other / Unknown 1.4% (12)
Sign-Controlled Intersection - Other / Unknown 1.1% (10)
Total – Cyclist At Fault 14.5% (128)
At Stop or Yield Sign – Cyclist Possibly at Fault 2.9% (26)
At Signal -- Cyclist Possibly at Fault 1.0% (9)
All Sign-Controlled – Bicyclist at Fault or Possibly at Fault
10.5% (93)
All Signal-Controlled – Bicyclist at Fault or Possibly at Fault
7.9% (70)
Total – Cyclist At Fault or Possibly at Fault 18.4% (163)
Motorist Left Turn — Opposite Direction
Motorist Drive Out — From Signal, Sign or Driveway

19
Proper Yielding When Entering a Roadway
Potentially Mitigates 8%
At least 8.2% (73) of all crashes involved cyclists who failed to yield when entering a roadway from a driveway, sidewalk or other non-roadway location. This crash type accounted for 6 of the 17 fatalities; more than any other type. Such behavior is generally associated with children, but this data shows even representation between adults and children; 49% (36) for children under age 16, and 51% (37) adults. For children this crash happens predominantly at residential driveways (24 out of 36 cases); for adults it is predominantly in commercial corridors (30 out of 37 cases) and on streets with four or more lanes (23 out of 37 cases). 28.7% (21 of 73) occurred at night; 17 of those being adults. Eight of these crashes also involved cyclists who were intoxicated or had been drinking.
Proper yielding depends on three key behaviors, two of which are skills: stopping at the edge of the roadway (key for children), gap assessment (a skill particularly critical at night and on high-speed roads) and a skill known as “power pedal.” “Power Pedal” is correct positioning of the pedals to enable the cyclist to quickly mount and accelerate the bicycle. Cyclists who have difficulty with this skill may be at higher risk for such crashes.
Effective Left Turn Strategy
Potentially Mitigates 3%
Of all crashes, 26 (2.9%) involved cyclists who attempted left turns from the roadway. Eighteen of these were struck by overtaking motorists. This also represents 10.7% of the 243 crashes involving only roadway cyclists traveling with the flow. Eight of the 26 crashes occurred at night, and three of those involved cyclists without lights. Eight of the 26 involved cyclists under age 16. Four involved cyclists who were intoxicated or had been drinking.
Safe left turns and lane changes requires three skills: scanning over the shoulder without making the bicycle swerve, assessing the speed of overtaking and opposing traffic, and riding one-handed in order to signal. All three of these skills can be easily learned by the average cyclist. Cyclists can also equip themselves with rear-view mirrors to assist with rearward scanning. Effective lanes changing must be done as a sequence: scanning, assessing speed and distance, signaling if necessary and prudent, and negotiating with the motorist.
Eighteen of the 26 crashes occurred on two-lane streets, and the other eight on four-lane streets. Only three of the 18 overtaking motorist crashes occurred on four-lane streets. Five of the eight opposing left turn crashes occurred on four-lane streets.
Some cyclists can be observed making left turns by switching over to the left side of the roadway and driving facing traffic. This puts the cyclist at risk for the types of crashes commonly experienced by wrong-way cyclists; some of these wrong-way crashes may be due to such improper left turn attempts. Another problematic strategy is to travel through the intersection like a pedestrian, either by driving the bicycle through the crosswalks or by walking the bicycle. In either case the bicyclist’s maneuverability is compromised compared to a regular pedestrian. Pedestrians can maneuver much better than bicyclists, with the ability to quickly reverse direction or move laterally. Being in the crosswalk subjects the cyclist to more potential conflicts from turning
Bicyclist Left Turn — Motorist Same Direction
Bicyclist Swerve — Overtaking Motorist
Bicyclist Attempting Left Turn from Left Side of

20
motorists. Twenty-six crashes involved sidewalk cyclists driving with the flow and struck by left- or right-turning motorists; ten of those at signalized intersections.
Some left turn crashes may involve motorists passing while the bicyclist is signaling a left turn or in locations where passing is illegal. The author of this study routinely experiences such conflicts.
Cyclist Conspicuity
Potentially Mitigates 28%
Of all crashes 22.1% (196) occurred at night and 5.1% (45) during dawn or dusk. Florida bicyclists are required to be equipped with a steady white headlight, a red rear reflector, and red taillight. In the majority of reports for night-time crashes (154, 78.6%), there was no indication as to whether or not the bicyclist was properly equipped. In only three crashes was the cyclist confirmed as having lights; in 39 cases (19.9%) the cyclist was confirmed as lacking a headlight, taillight, or both. Thirty-six (14.9%) of these low-light crashes also involved cyclists who were intoxicated or had been drinking (compared to 4.4% for daytime crashes). Eight of the 16 fatalities during the study period occurred in darkness and one at dusk. Rain may have played a visibility role in another 13 crashes (1.5%).
The most effective countermeasure for the low-light conditions found at dawn and dusk and during rainy periods is brightly colored clothing; white, yellow, or the fluorescent “neon” colors used by many cyclists. Bright, solid colors are more effective than complex designs. The type of clothing worn by crash victims is rarely reported as there is no legal requirement to wear conspicuous clothing. These bright colors are of little benefit when it is fully dark.
Combining the dark, dawn, dusk, and rain crashes and subtracting the three cases involving confirmed cyclist lighting, results in a total of 251 crashes (28.2%) in which improved cyclist conspicuity might have mitigated the crash.
Low-lighting conditions are significantly over-represented for Motorist Overtaking crashes and for crashes involving left turns by either party.
Table K illustrates the types of crashes associated with different lighting conditions.

21
Table K
Emergency Maneuvers
Proper lane positioning can mitigate the vast majority of many motorist-caused crashes, including same-direction right turns, opposing left turns, and drive-outs from driveways or cross-streets. However, in some of these circumstances the cyclist may need to take quick evasive action – stopping quickly or turning sharply -- to avoid a crash. In other circumstances cyclists may need to execute a “rock dodge“ to avoid a surface hazard without swerving into the path of an overtaking motorist. It cannot be determined with any level of certainty what percentage of crashes could have been avoided with such maneuvers, but we can determine the total number of crashes from this study period in which they might come into play. These maneuvers work better for roadway cyclists than sidewalk cyclists. Cyclists on sidewalks who come into conflict with turning and conflicting motorists often have less time to react and less room in which to turn to avoid a collision.
These maneuvers are the only countermeasures in this section that present a significant skill challenge for the average cyclist.
Crash Type Groups by Lighting Conditions All Dark Dawn
& Dusk Daylight Unknown
All Crashes
Bicyclist Failed to Yield - Midblock 11.1% 13.3% 8.2% 0.0% 9.0%
Bicyclist Failed to Yield - Signalized Intersection 5.3% 2.2% 7.6% 0.0% 6.8%
Bicyclist Failed to Yield - Sign-Controlled Intersec-tion
5.3% 11.1% 7.6% 0.0% 7.2%
Bicyclist Left Turn / Merge 5.8% 6.7% 3.1% 0.0% 3.8%
Bicyclist Overtaking Motorist 1.6% 0.0% 0.3% 0.0% 0.6%
Bicyclist Right Turn / Merge 1.1% 0.0% 2.2% 0.0% 1.8%
Crossing Paths - Other Circumstances 10.6% 11.1% 16.0% 0.0% 14.6%
Head-On 4.8% 0.0% 2.0% 0.0% 2.5%
Loss of Control / Turning Error 4.8% 4.4% 3.9% 0.0% 4.1%
Motorist Failed to Yield – Midblock 5.8% 4.4% 11.7% 0.0% 10.1%
Motorist Failed to Yield - Signalized Intersection 4.8% 0.0% 3.1% 0.0% 3.3%
Motorist Failed to Yield - Sign-Controlled Intersec-tion
6.3% 4.4% 12.3% 50.0% 10.7%
Motorist Left Turn / Merge 4.8% 6.7% 2.8% 0.0% 3.4%
Motorist Overtaking Bicyclist 15.3% 15.6% 5.7% 0.0% 8.2%
Motorist Right Turn / Merge 3.7% 2.2% 4.9% 0.0% 4.5%
Motorist Turn / Merge 0.0% 0.0% 0.2% 0.0% 0.1%
Non-Roadway 5.3% 8.9% 3.7% 0.0% 4.3%
Other / Unknown - Insufficient Details 2.6% 0.0% 2.3% 0.0% 0.6%
Other / Unusual Circumstances 1.1% 8.9% 1.4% 50.0% 1.8%
Parallel Paths - Other Circumstances 0.0% 0.0% 1.2% 0.0% 0.9%
Grand Total 100.0% 100.0% 100.0% 100.0% 100.0%

22
Of 243 crashes involving roadway cyclists going with the flow, 4.1% (10) involved motorists overtaking and turning right (a “right hook”), 4.5% (11) involved a motorist making an opposing left turn, and 6.2% (15) involved a motorist driving out from a driveway or cross-street. Eight crashes involved a bicyclist reported to have swerved in front of an overtaking motorist (3.3%).
Of 91 crashes involving sidewalk cyclists going with the flow, 20.9% (19) involved motorist “right hooks”, 7.7% (7) involved a motorist making an opposing left turn, and 17.6% (16) involved a motorist driving out from a driveway or cross-street.
It must be noted that the types of crashes that may be mitigated with emergency maneuvers represent a much higher percentage of crashes experienced by sidewalk cyclists, yet these maneuvers are less likely to be known by sidewalk cyclists, and less likely to be effective in those situations. A cyclist driving properly on the roadway is better able to avoid these crashes through lane positioning, thereby reducing the need for these emergency maneuvers, and is better positioned to implement such maneuvers successfully should they become necessary.
Determining a percentage of crashes that these maneuvers will mitigate is not possible. Circumstances such as intersection geometry and the speeds of the two vehicles are critical to the effectiveness of these countermeasures.
Bicycle Maintenance
Potentially Mitigates 2% to 9%
Fourteen crashes involved cyclists with faulty or inactive brakes. In 61 other cases, the report indicated “Other” for “Vehicle Defect,” usually with no details explaining the defect in the narrative. It is possible that “Other” may refer to a lack of lights in some cases. In three cases “worn tires” were reported, but these all occurred on dry pavement, where tire tread is of little consequence.
Sobriety
In 22 crashes (2.5%) the bicyclist was intoxicated with alcohol, drugs or both. In another 44 cases (5.0%) the report stated that the cyclist “had been drinking.” In ten of these 66 cases the cyclist also lacked lights at night; two of those were fatalities. In at least 13 of these 66 crashes (1.5% of all) there were no other improper behaviors committed by the cyclist, so intoxication was the primary cyclist contribution to the crash.
Parking Lot Crashes
Thirty-two crashes (3.6%) involved bicyclists in parking lots; 18 involving children under age 16. Assigning countermeasures to parking lot crashes in problematic due to the irregular movements often made in such locations. Children are particularly susceptible to parking lot crashes due to their height and unpredictability.

23
Summary of Bicyclist Countermeasures Since countermeasures address multiple types of crashes and crash factors, fault is often shared between the
cyclist and the motorist in a crash, cyclists commit more than one error in some crashes, and some crash types have multiple countermeasures, it is not possible to provide a total percentage of crashes that might be mitigated to some extent by the bicyclist. Table L shows the potential for bicyclists to mitigate crashes, both by obeying the rules of the road and by utilizing strategies that mitigate motorist mistakes.
Table L
Countermeasures for Motorists
Safe and Legal Passing
Potentially Mitigates 7% to 8%
Of 885 crashes, 59 (6.7%) involved overtaking motorists. These 59 represent 24.5% of the 241 crashes involving cyclists driving on the roadway with the flow of traffic. Of the 59, 33 occurred during daytime, dusk or dawn. Of these 33, 23 misjudged the space available while passing. Florida law requires motorists to give at least three feet of space when passing a bicyclist. For the remaining 10 crashes there was insufficient information to determine why the motorist struck the bicyclist, but in none of the daytime overtaking crashes was there evidence that the motorist failed to detect the bicyclist.
While unsafe passing results in relatively few crashes, the fear of such crashes is the primary concern keeping people from cycling on roadways. Many cyclists prefer to travel on sidewalks due to this fear, putting them at increased risk from the additional conflicts present on sidewalks. Thus, some percentage of sidewalk crashes must be attributed to unsafe passing on the part of motorists. Some cyclists also drive against traffic on the roadway due to this fear.
In another 10 crashes (1.1%) bicyclists making left turns on two-lane roadways were struck by overtaking motorists. It is often impossible to determine fault in these crashes unless one party admits error or an independent witness is present. In some cases the bicyclist may have turned unexpectedly; in others the motorist may have illegally passed a cyclist who was clearly signaling his or her intentions.
Bicyclist-Implemented Countermeasures
Roadway Bicyclists
Sidewalk Bicyclists
All Bicyclists
Travel with the Flow of Traffic 22% 71% 41%
Lane Positioning Up to 12% Not Applicable
Adherence to Signs and Signals 14% 15% 15 to 18%
Correct Yielding When Entering a Roadway Up to 9%
Effective Left Turn Strategy Up to 3% Not Applicable
Cyclist Conspicuity Up to 35% Up to 20% Up to 28%
Bicycle Maintenance 2 to 7% 1 to 9% 2 to 9%
Sobriety 2% 2% 2%
Motorist Overtaking — Misjudged Space
Bicyclist Left Turn — Same Direction

24
Distribution by Roadway Lane Width
Of the 13 daytime motorist overtaking crashes with no cyclist fault and in which lane width is known, 10 occurred on roadways with lanes 11 or 12 feet wide, one occurred on a roadway with a 14-foot lane, one on a street with a bike lane, and one on a street with a bike lane next to on-street parking. For an additional 13 crashes the lane width is unknown.
Yield When Entering the Roadway from Driveways
Potentially Mitigates 20%
Of 885 crashes, 175 (19.8%) involved motorists who failed to yield when entering the roadway from a commercial or residential driveway. Bicyclists traveling on sidewalks have the same rights and responsibilities as pedestrians, and motorists must yield to cyclists on the
sidewalk when entering the roadway from a driveway. Motorists should pay special attention to the possibility that a cyclist might be approaching from the right.
Table M
1 The bicyclist on the roadway has the duty to travel with the flow of traffic; motorists should not be expected to yield to vehicles on the wrong side of the roadway.
Yield When Required at Intersections
Potentially Mitigates 19%
Of 885 crashes, 169 (19.1%) involved crashes at stop signs, yield signs or traffic signals in which the motorist was found at fault. In four of these cases the cyclist was also at fault for driving against traffic on the roadway. Ninety-seven of these crashes involved motorists who made right turns on red, failed to yield at signals, drove through signals without stopping, failed to yield to cross traffic at stop or yield signs, or drove through stop signs.
Table N
Roadway Sidewalk or Path
Percent of All Crashes (Number)
Bicyclist With the Flow 1.7% (15) 1.8% (16)
Bicyclist Facing Traffic Not Applicable1 16.3% (144)
Motorist Failed to Yield When Entering Roadway from Driveway
Roadway Sidewalk or
Path Total
Percent (Number)
Motorist Drive Out - Right-Turn-on-Red 20.0% (4) 14.3% (11) 15.5% (15)
Motorist Drive Out - Signalized Intersection 0.0% 5.2% (4) 4.1% (4)
Motorist Drive Out - Sign-Controlled Intersection 45.0% (9) 68.8% (53) 63.9% (62)
Motorist Drive Through - Signalized Intersection 15.0% (3) 5.2% (4) 7.2% (7)
Motorist Drive Through - Sign-Controlled Intersection 5.0% (1) 5.2% (4) 5.2% (5)
Signalized Intersection - Other / Unknown 0.0% 1.3% (1) 1.0% (1)
Sign-Controlled Intersection - Other / Unknown 15.0% (3) 0.0% 3.1% (3)
Total 100% (20) 100% (77) 100% (97)
Crash Types Involving Motorists Failing to Yield at Intersections
Motorist Drive Out — From Sign (or Signal)

25
Yielding When Turning Right or Left
Crash Types: All Motorist-Caused Intersec-tion and Driveway Crashes
Roadway Bicyclist Roadway
Total
Sidewalk or Path Bicyclist Sidewalk
Total Total
Facing Traffic
Unk With
Traffic Facing Traffic
With Traffic
Motorist Drive Out - Right-Turn-on-Red
50.0% (2)
50.0% (1)
3.4% (1)
11.4% (4)
14.3% (11)
0.0% 11.8%
(11) 11.7%
(15)
Motorist Drive Out - Signalized Intersection 0.0% 0.0% 0.0% 0.0%
3.9% (3)
6.3% (1)
4.3% (4)
3.1% (4)
Motorist Drive Out – Stop or Yield Sign
25.0% (1)
0.0% 27.6%
(8) 25.7%
(9) 58.4%
(45) 50.0%
(8) 57.0%
(53) 48.4%
(62)
Motorist Drive Through - Signal-ized Intersection
0.0% 0.0% 10.3% (3)
8.6% (3)
5.2% (4)
0.0% 4.3%
(4) 5.5%
(7)
Motorist Drive Through - Stop Sign
0.0% 0.0% 3.4%
(1) 2.9%
(1) 5.2%
(4) 0.0%
4.3% (4)
3.9% (5)
Motorist Left Turn - Opposite Di-rection
0.0% 0.0% 10.3%
(3) 8.6%
(3) 0.0% 0.0% 0.0%
2.3% (3)
Motorist Lost Control - Other / Unknown
0.0% 0.0% 3.4%
(1) 2.9%
(1) 1.3%
(1) 6.3%
(1) 2.2%
(2) 2.3%
(3)
Motorist Overtaking - Misjudged Space
25.0% (1)
0.0% 6.9%
(2) 8.6%
(3) 0.0% 0.0% 0.0%
2.3% (3)
Motorist Overtaking - Other / Un-known
0.0% 0.0% 6.9%
(2) 5.7%
(2) 0.0% 0.0% 0.0%
1.6% (2)
Motorist Right Turn - Opposite Direction
0.0% 0.0% 0.0% 0.0% 6.5%
(5) 0.0%
5.4% (5)
3.9% (5)
Motorist Right Turn - Same Direc-tion
0.0% 0.0% 6.9%
(2) 5.7%
(2) 0.0%
31.3% (5)
5.4% (5)
5.5% (7)
Motorist Turning Error - Left Turn 0.0% 0.0% 13.8%
(4) 11.4%
(4) 0.0% 0.0% 0.0%
3.1% (4)
Motorist Turning Error - Other 0.0% 0.0% 0.0% 0.0% 2.6%
(2) 0.0%
2.2% (2)
1.6% (2)
Motorist Turning Error - Right Turn
0.0% 0.0% 0.0% 0.0% 0.0% 6.3%
(1) 1.1%
(1) 0.8%
(1)
Parallel Paths - Other / Unknown 0.0% 0.0% 0.0% 0.0% 1.3%
(1) 0.0%
1.1% (1)
0.8% (1)
Signalized Intersection - Other / Unknown
0.0% 0.0% 0.0% 0.0% 1.3%
(1) 0.0%
1.1% (1)
0.8% (1)
Sign-Controlled Intersection - Other / Unknown
0.0% 50.0%
(1) 6.9%
(2) 8.6%
(3) 0.0% 0.0% 0.0% 2.3%
(3)
Totals – Percent of 128 3.1%
(4) 1.6%
(2) 22.7%
(29) 27.3%
(35) 60.2%
(77) 12.5%
(16) 72.7%
(93) 100% (128)
Percent of Column Total (Number)
Table 1O

26
Potentially Mitigates 5%
Of 885 crashes, 44 (5.0%) involved motorists who failed to yield to bicyclists when turning left or right. Motorist right turns are the primary concern for sidewalk cyclists.
Table P
Crash Types Involving Turning Motorists
Roadway Sidewalk Sidewalk
Total
Roadway and
Sidewalk With
Traffic Facing Traffic
With Traffic
Motorist Left Turn – Opposite Direction 45.0% (9) 0.0% 20.0%
(3) 12.5%
(3) 27.3%
(12)
Motorist Left Turn - Same Direction 10.0%
(2) 33.3%
(3) 0.0%
12.5% (3)
11.4% (5)
All Motorist Left Turns 55% (11)
33.3% (3)
20.0% (3)
25% (6)
38.6% (17)
Motorist Right Turn - Opposite Direction 0.0% 66.7% (6)
0.0% 25.0% (6)
13.6% (6)
Motorist Right Turn - Same Direction 45.0% (9) 0.0% 80.0%
(12) 50.0%
(12) 47.7%
(21)
All Motorist Right Turns 45.0% (9)
66.7% (6)
80.0% (12)
75% (18)
61.4% (27)
Total – Percent of 44 45.5%
(20) 20.5%
(9) 34.1%
(15) 54.5%
(24) 100% (44)
Percent of Column Total (Number)
Motorist Right Turn — Bicyclist on Roadway or Sidewalk; Same Direction
Motorist Left Turn — Bicyclist on Roadway or Sidewalk; Opposite Direction
Motorist Left Turn — Bicyclist on Sidewalk; Same Direction
Motorist Right Turn — Bicyclist on Sidewalk; Opposite Direction

27
Sobriety
Potentially Mitigates 3% to 19%
While only 10 motorists involved (1.1%) were confirmed as illegally intoxicated, and another 13 (1.5%) were described as “had been drinking,” 144 motorists (16.3%) were coded as “unknown” as they were hit-and-run crashes. Certainly some percentage of these hit-and-run drivers were intoxicated to some extent. In 11 of the cases of illegal motorist intoxication, the bicyclist was found solely at fault for the crash. Of the hit-and-run crashes, 57 involved fault on the cyclist’s part. Thus, in 1.2% of all crashes, intoxication was the sole contributing factor on the part of the motorist, and may have been so in as many as an additional 6.4%.
Summary of Motorist Countermeasures
Motorist countermeasures are more straightforward to compile than bicyclist countermeasures. By their nature (size, speed, limited maneuverability), motorists have fewer types of errors they can commit compared to bicyclists, who are permitted to use sidewalks as well as roadways, and are far more likely to drive facing traffic. Table Q shows the potential for motorists to mitigate crashes.
Table Q
Motorist-Implemented Countermeasures Percent of Crashes
Safe and Legal Passing 6.7 to 7.8%
Yield When Entering the Roadway from Driveways 19.8%
Yield When Entering Intersections from Cross Streets 19.1%
Yielding When Turning Right or Left 5.0%
Sobriety 1.2 to 7.6%
Total 51.8 to 59.3%

28
Countermeasures for Engineers and Planners Bicycling facilities in and of themselves are rather limited in their ability to directly mitigate crashes, as
shown by data above on motorist and bicyclist behavior. Bicycling facilities should instead be seen as elements of “complete streets” and comprehensive transportation and land use planning. For example, bicycle lanes alone may not convince some cyclists to leave the sidewalks when the roadway is a high-speed, six-lane arterial, but when building placement, design speed and other key elements are coordinated to create a slower speed corridor, bicyclists will feel more comfortable on the roadway. An example of this is Alafaya Trail (SR 434) between University Boulevard and Colonial Drive, where undesignated bike lanes are in place on a six-lane roadway and ten out the thirteen crashes involved cyclists on sidewalks (and two more involved wrong-way cyclists in the bike lanes).
Bicycling facilities can also aggravate certain types of crashes, either through improper design or in combination with poor behavior on the parts of cyclists and motorists. Engineers and planners should strive to design and provide facilities that compliment the other countermeasures in this report. Put simply: “Good design invites right behavior” (Lagerway 2006) In some circumstances designated bicycling facilities actually discourage or prohibit some bicyclist-oriented countermeasures. Worse, in other circumstances such facilities can encourage unsafe choices, such as traveling against the flow of traffic. For these reasons, this section of the report studies not only the crash types that can be mitigated by these facilities, but also those that can be aggravated by them.
Facilities cannot be judged by crash types for which can have no effect. Thus, crashes involving blatant violations such as running stop signs or red lights, or failing to yield when entering the roadway, are not considered.
Bike Lanes and Paved Shoulders
Potentially Mitigates 7 to 15% of Roadway Cyclist Crashes and an Undetermined Percentage of Sidewalk Crashes
Twenty-eight crashes (3.2% of all and 7.4% of roadway cyclist crashes) involved overtaking motorists and no unsafe movement on the part of the bicyclist. Such overtaking motorist crashes are the only ones directly mitigated by bike lanes and paved shoulders. Since some bicyclists travel on sidewalks when they consider on-road conditions to be too intimidating, some sidewalk crashes would also be reduced indirectly through the provision of bike lanes; particularly Motorist Drive Out - Sign-Controlled Intersection and Motorist Right Turn - Same Direction, which are much more common among sidewalk cyclists compared to roadway cyclists.
Some wrong-way roadway cyclists may also be encouraged to travel in the proper direction where bike lanes are provided, since standard pavement markings include a directional arrow. There were 69 crashes (7.8%) involving wrong-way roadway cyclists that could have been avoided if the cyclist had been traveling with the flow.
Potentially Aggravates 8% of Roadway Cyclist Crashes
Two types of crashes may be aggravated by bike lanes or paved shoulders if bicyclists are not properly trained: Motorist Right Turn - Same Direction and Bicyclist Left Turn - Same Direction. The first type is the fault of the motorist; the second of the bicyclist. Thirty such crashes occurred to roadway cyclists, but only two of those occurred to cyclists on bike lanes or paved shoulders out of over 300 miles of such facilities over the two year period. While the potential exists for these facilities to aggravate these crash types, evidence is scant that such conflicts are actually increased. There was only one report involving a “right hook” on a bike lane in this study, and no bicyclist left turns from the bike lane. Of the seven 7 crashes involving cyclists traveling with the
Bicycle Lane on Edgewater Drive, Orlando

29
flow in bike lanes, four involved motorists failing to yield when entering the roadway, one a “right hook,” one an undetermined turn or merge movement on the part of the motorist, and one an overtaking motorist.
A common concern among experienced roadway bicyclists is the placement of designated bicycle lanes adjacent to parallel on-street parking. When such bike lanes are too narrow, they encourage cyclists to drive too close to parked cars, putting cyclists at risk from opening car doors. Such crashes have very high potential for serious injury, either through the impact with the door itself, or by diverting the cyclist into the adjacent general use lane where he or she is at high risk to be hit or run over by an overtaking motorist. Fortunately, no such “dooring” crashes were reported in this study. There were only about three miles of roadway in the metropolitan area with such a configuration during the study period, and the bike lanes on those streets have ample width to allow cyclists to stay out of the “door zone.” The Edgewater bike lane (page 28) is an example of proper width adjacent to parallel parking.
Benefits from Bike Lanes and Paved Shoulders for Other Road Users (Ronkin)
Other safety benefits have been identified from bicycle lanes and paved shoulders beyond those for bicyclists themselves:
Provide space for motorists to make evasive maneuvers and accommodate driver error
Add a recovery area to regain control of a vehicle, as well as lateral clearance to roadside objects such as guardrail, signs and poles
Provide room for motorists to move right to allow emergency vehicles to pass
Provide space for disabled vehicles to stop or drive slowly
Provide increased sight distance for through vehicles and for vehicles entering the roadway
Reduce passing conflicts between motorists and bicyclists
Provide pedestrians with a place to walk along rural roads without paved sidewalks
Provide for storm water discharge farther from the general use lanes, reducing hydroplaning, splash and spray to following vehicles, pedestrians and bicyclists
Provide more intersection and safe stopping sight distance
Provide greater effective turning radius for trucks and space for off-tracking of truck's rear wheels in curved sections
Wide Curb Lanes
Potentially Mitigates 6% of Roadway Cyclist Crashes
Since bike lanes and paved shoulders include white separator lines, motorists are guided to stay in their lanes and can avoid hitting bicyclists traveling at night without lights even when they are not seen. Wide curb lanes do not provide such a benefit, so only daytime overtaking motorist crashes will be used to assess this countermeasure. Wide curb lanes are also unlikely to influence wrong-way bicyclists to go with the flow or to influence sidewalk cyclists to travel in the roadway. Twenty-one crashes (2.4% of all and 5.5% of roadway cyclist crashes) involved overtaking motorists and no unsafe movement on the part of the bicyclist.
Wide Curb Lane

30
Uni-Directional Sidepaths
Potentially Mitigates 7%
Uni-directional sidepaths are paved paths designed specifically for use by bicyclists that are separated from the roadway with a curb, raised barrier, or unpaved space. Pedestrians are provided a separate path in such schemes. There are very rare in the United States, where they are generally referred to as “bike paths.” They are referred to as “cycle-tracks” in Europe and are commonly used in The Netherlands, Denmark, Germany, Sweden, and Norway. Bicyclists are expected to travel only with the flow of traffic on such facilities. The sole local example is on Apopka-Vineland Road in Orange County. The standard minimum width for such facilities is six feet (American Association of State Highway and Transportation Officials; AASHTO). However, AASHTO also notes that “one way paths often will be used as two-way facilities unless effective measures are taken to assure one-way operation. Without such enforcement, it should be assumed that shared use paths will be used as two-way facilities by both pedestrians and bicyclists and designed accordingly” (AASHTO 1999) The countermeasure performance expressed above and below reflects proper, one-way use, but a more realistic performance would approach that of a bi-directional path.
Fifty-seven crashes (6.4% of all) involved overtaking motorists and no improper movement on the part of the bicyclist. An additional seven crashes (0.8%) – head-on and bicyclist overtaking – would also be mitigated.
Potentially Aggravates 17%
As previously discussed, cycling on a sidewalk adjacent to the roadway, even with the flow of traffic, puts cyclists into greater conflict with motorists at intersections and driveways. These conflicts would be much the same for uni-directional sidepath bikeways. A University of Sweden study (Rauh 1990) found that cyclists traveling straight and with the flow on such facilities had a 3.4 times higher crash risk compared to with-the-flow roadway cyclists, due to increased risk from opposing left turns, overtaking right turns, and drive-outs from driveways and cross-streets. Cyclists turning left from such facilities had a 3.3 times higher risk than compared to left turns by roadway cyclists. A Danish study found a 32 percent increase in crashes on streets where cycletracks were installed with no increase in usage (Bach, Rosbach & Jørgensen 1985). Crash types that would be aggravated by uni-directional sidepaths are illustrated in Table R.
Table R
In Europe there are mitigating factors for the inherently higher risk for crossing path crashes on these
facilities; more stringent laws and much greater numbers of bicyclists. Motorists in some countries are presumed at fault when colliding with a cyclist or pedestrian. The numbers of bicyclists in cities with such facilities are
Crash Types Potentially Aggravated by Uni-Directional Sidepaths
Percent of All Crashes (Number)
Motorist Drive Out from Driveway or Stop Sign 3.5% (31)
Motorist Right Turn - Same Direction 3.3% (29)
Bicyclist Left Turn - Same Direction 2.9% (26)
Bicyclist Mid-Block Ride Out 2.5% (22)
Motorist Left Turn - Opposite Direction 2.1% (19)
Other Crossing Path Crashes 2.6% (23)
Total 16.9% (150)
Unidirectional Bicycle Path on Apopka-Vineland Road, Orange County
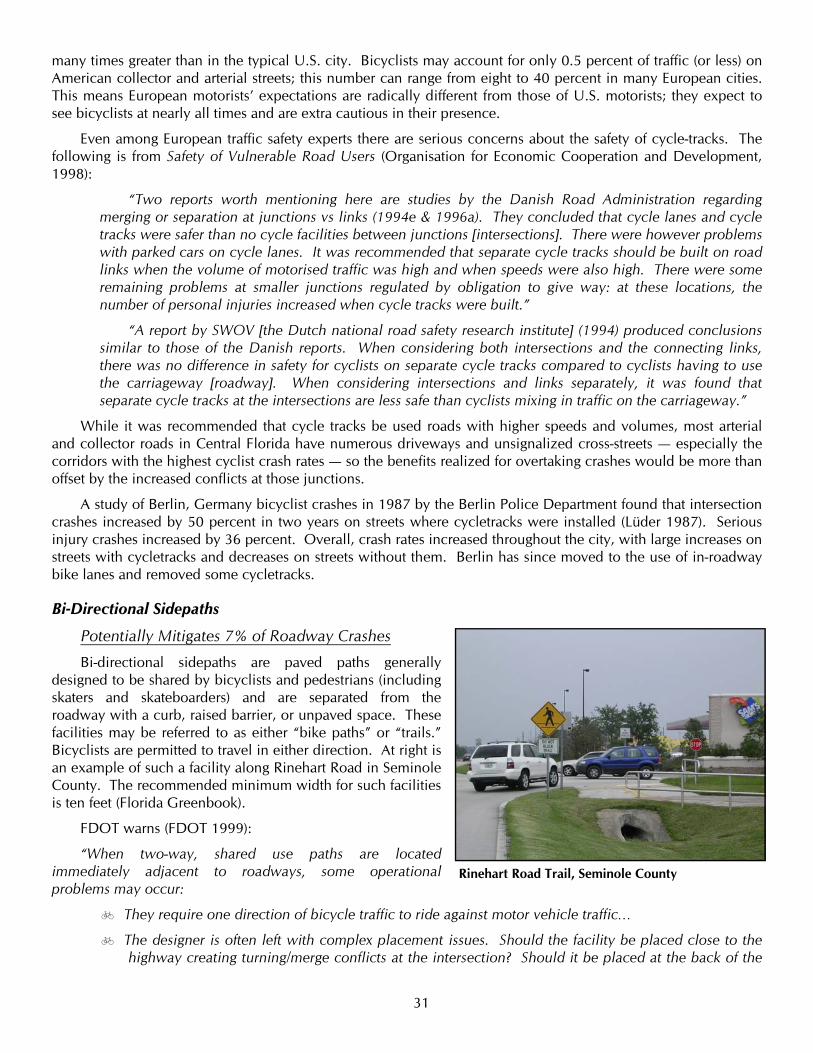
31
many times greater than in the typical U.S. city. Bicyclists may account for only 0.5 percent of traffic (or less) on American collector and arterial streets; this number can range from eight to 40 percent in many European cities. This means European motorists’ expectations are radically different from those of U.S. motorists; they expect to see bicyclists at nearly all times and are extra cautious in their presence.
Even among European traffic safety experts there are serious concerns about the safety of cycle-tracks. The following is from Safety of Vulnerable Road Users (Organisation for Economic Cooperation and Development, 1998):
“Two reports worth mentioning here are studies by the Danish Road Administration regarding merging or separation at junctions vs links (1994e & 1996a). They concluded that cycle lanes and cycle tracks were safer than no cycle facilities between junctions [intersections]. There were however problems with parked cars on cycle lanes. It was recommended that separate cycle tracks should be built on road links when the volume of motorised traffic was high and when speeds were also high. There were some remaining problems at smaller junctions regulated by obligation to give way: at these locations, the number of personal injuries increased when cycle tracks were built.”
“A report by SWOV [the Dutch national road safety research institute] (1994) produced conclusions similar to those of the Danish reports. When considering both intersections and the connecting links, there was no difference in safety for cyclists on separate cycle tracks compared to cyclists having to use the carriageway [roadway]. When considering intersections and links separately, it was found that separate cycle tracks at the intersections are less safe than cyclists mixing in traffic on the carriageway.”
While it was recommended that cycle tracks be used roads with higher speeds and volumes, most arterial and collector roads in Central Florida have numerous driveways and unsignalized cross-streets — especially the corridors with the highest cyclist crash rates — so the benefits realized for overtaking crashes would be more than offset by the increased conflicts at those junctions.
A study of Berlin, Germany bicyclist crashes in 1987 by the Berlin Police Department found that intersection crashes increased by 50 percent in two years on streets where cycletracks were installed (Lüder 1987). Serious injury crashes increased by 36 percent. Overall, crash rates increased throughout the city, with large increases on streets with cycletracks and decreases on streets without them. Berlin has since moved to the use of in-roadway bike lanes and removed some cycletracks.
Bi-Directional Sidepaths
Potentially Mitigates 7% of Roadway Crashes
Bi-directional sidepaths are paved paths generally designed to be shared by bicyclists and pedestrians (including skaters and skateboarders) and are separated from the roadway with a curb, raised barrier, or unpaved space. These facilities may be referred to as either “bike paths” or “trails.” Bicyclists are permitted to travel in either direction. At right is an example of such a facility along Rinehart Road in Seminole County. The recommended minimum width for such facilities is ten feet (Florida Greenbook).
FDOT warns (FDOT 1999):
“When two-way, shared use paths are located immediately adjacent to roadways, some operational problems may occur:
They require one direction of bicycle traffic to ride against motor vehicle traffic…
The designer is often left with complex placement issues. Should the facility be placed close to the highway creating turning/merge conflicts at the intersection? Should it be placed at the back of the
Rinehart Road Trail, Seminole County

32
right-of-way, increasing detection problems at each driveway and intersection? Shrubs, other vegetation and fencing can hide the bicyclist from the motorist.
When the path ends, bicyclists going against traffic will tend to continue to travel on the wrong side of the street. Likewise, bicyclists approaching a path often travel on the wrong side of the street to get to the path. Wrong-way travel by bicyclists is a major cause of bicycle/automobile crashes and should be discouraged at every opportunity.
At intersections, motorists entering or crossing the roadway often will not notice bicyclists coming from the right, as they are not expecting or looking for contra-flow vehicles. Even bicyclists coming from the left (the expected direction) often go unnoticed, especially when sight distances are poor.
Bicyclists using the roadway are often subjected to harassment by motorists who feel that, in all cases, bicyclists should be on the trail instead. Many bicyclists will use the roadway instead of the shared use path because they have found the roadway to be safer, less congested, more convenient, or better maintained.
Bicyclists using shared use paths generally are required to stop or yield at all cross streets and driveways.* Whereas, bicyclists using the roadway usually have priority over cross traffic, because they have the same right of way as motorists.
Stopped cross street motor vehicle traffic or vehicles exiting side streets or driveways may block the path crossing.
Many bicyclists' destinations may be on the opposite side of the street from where the bicycle path is located.
At intersections, motorists are not often looking for bicyclists (who are traveling at higher speeds than pedestrians) entering the crosswalk area, particularly when motorists are making a turn.
For the above reasons, bicycle lanes may be the best way to accommodate bicycle traffic along a highway corridor. …”
As with uni-directional paths, overtaking motorist, head-on, and bicyclist overtaking crashes (7.2%) are the only type this facility will mitigate.
* The same priority should be assigned for sidepaths as for the parallel roadway.
Potentially Aggravates Up to 67% of Crashes
Conflicting movements that would be aggravated by providing bi-directional sidepaths include those of uni-directional paths, plus many of the facing traffic crashes common on sidewalks. Of the 764 crashes involving cyclists on shared lanes, bike lanes and sidewalks, 36.5% (279) involved cyclists traveling facing traffic on the sidewalk, 11.9% (91) involved cyclists traveling facing traffic on the roadway (behavior likely to be encouraged with cyclists approaching or leaving the termini of a sidepath), and 5.4% (41) involved motorist turning movements conflicting with roadway cyclists going with the flow (see Table S); a total of 53.8%. Other crash types that would potentially be aggravated by the installation of such paths are: Bicyclist Mid-Block Ride-Outs (10.2%), and Bicyclist Left Turn — Same Direction (3.4%). This very high number (67%) is a worst-case scenario, in which there are high numbers of driveways and cross streets, where no additional roadway accommodation is provided (bike lane, wide curb lane, or paved shoulder) and where sight lines are no better than for sidewalks (shared use paths have more stringent sight triangle requirements than sidewalks). These risks can be mitigated by only building such sidepaths along roads with very limited numbers of driveways and intersections. That is not the situation along the high crash corridors identified earlier in this report (see Tables D & E, pages 13 and 15).

33
Table S
Shared Use Paths in Separate Rights-of-Way
Shared use paths in their own rights-of-way (commonly referred to as “trails”), completely independent of roadways except for where they cross them, are thought to reduce crashes by providing alternate routes for bicyclists, keeping them off of busy arterials and collectors. For example, the Little Econ Greenway might be expected to reduce the number of crashes along the parallel Colonial Drive, about a half-mile to the south. Such facilities however, can also increase bicycle usage in the area, as bicyclists travel to and from the trail. The numbers of reported motorist/bicyclist crashes on the trails themselves is quite low; there were eight such crashes during the study period, mostly involving cyclist violations of traffic controls.
But there is no evidence that such trails reduce the overall number of crashes in nearby areas. Crashes plotted for the 2003/2004 study were compared to those plotted for an earlier study for 1993/1994. Between the earlier and later periods, five major trail corridors were constructed in the metro area. One-mile and half-mile buffers were created for those trails and the numbers of crashes counted for the two periods. The total number of long-form crash reports for the metro area dropped from 1,229 in 1993/94 to 958 for 2003/04; a 22% decrease. (Data from the Florida Department of Highway Safety and Motor Vehicles shows a corresponding 1,176 and 820 crashes for those years, a 30 percent decrease.) If trails have a positive impact on area-wide safety, their nearby areas should experience a reduction greater than 22 percent. Table T shows that the relative number of crashes in trail corridors actually increased in some cases after the trails were constructed; the numbers of crashes per buffer area is expressed as a percentage of the total crashes that occurred in the metro area for that period. All trails combined showed a slight relative increase. So while there is no evidence that trails have a detrimental effect on area-wide safety, and law-abiding trail users would certainly have much lower risk of a crash involving a
motor vehicle, such facilities seem to have little effect as an area-wide crash countermeasure.
Motorist-Caused Crash Types Potentially Aggravated by Cyclists Shifting from Roadways to Bi-Directional Sidepaths (of 239 crashes involving cyclists driving with the flow)
Percent of All Crashes (Number)
Motorist Drive Out from Driveway or Stop Sign 7.5% (18)
Motorist Right Turn - Same Direction 4.6% (11)
Motorist Left Turn - Opposite Direction 4.6% (11)
Motorist Drive Out - Right-Turn-on-Red 0.4% (1)
Total 16.7% (41)
Seminole-Wekiva Trail in Lake Mary

34
Table T
* Area-wide there was at least a 22% reduction in long-form crash reports from the 1993/94 period to the 2003/04 period.
Street Lighting
Potentially Mitigates 9%
While bicyclists are required to be equipped with front and rear lights when traveling at night, the provision of street lights will still provide some benefit in reducing crashes. Street lighting also benefits pedestrians and motorists, as well as improving personal safety. Eighty crashes (9% of all) occurred on streets without lighting. Of the 80 no-lighting crashes, 22 involved cyclists recorded as not equipped with front or rear lights. There is also concern that existing lighting may be insufficient; that crashes may be more likely in the gaps between lights.
Geographic Distribution
Two corridors have concentrations of night-time bicyclist crashes without street lighting: Goldenrod Road (SR 551) from Colonial Drive to Curry Ford Road with four crashes, and East Colonial Drive (SR 50) from Goldenrod Road to Rouse Road with five crashes. The cyclists in these nine cases did not have lights. Pedestrian crashes are even more likely to be affected by improved lighting; the two modes are combined for the purposes of this countermeasure in the Pedestrian Study.
Other Concerns
Loop Detectors and Signal Timing
Many signalized intersections are controlled with imbedded loop detectors that only provide a green signal when “tripped.” These loops function as metal detectors, and can generally detect bicycles if properly configured. However, bicyclists are often unaware of the function and nature of these loops, and will violate red lights that will not change for them since their bicycles have not been detected. While it is true that the bicyclist is ultimately responsible for crossing the intersection safely (the bicyclist may consider the signal as non-functioning and treat it as a stop sign), such unresponsive signals may contribute to red light running in some circumstances. Eleven crashes involved bicyclists who violated traffic signals after stopping. Another 41 crashes involved cyclists who did not stop at the red signal.
One Mile Buffer Half-Mile Buffer
1993-94 2003-04 Percentage Decrease/ Increase in Number*
1993-94 2003-04 Percentage Decrease/ Increase in Number* Path Corridor
Percent of Metro Area Crashes (Number)
Percent of Metro Area Crashes (Number)
Seminole-Wekiva-Rinehart
3.3% (40) 2.7% (26) -35.0% 1.8% (22) 1.8% (17) -22.7%
Cross Seminole North 1.3% (16) 1.1% (11) -31.3% 0.8% (10) 0.5% (5) -50.0%
West Orange 3.8% (47) 4.2% (40) -14.9% 2.3% (28) 3.0% (29) +3.6%
Cady Way-Little Econ 7.3% (90) 9.6% (92) +2.2% 3.6% (44) 4.5% (43) -2.3%
Neptune Road- St. Cloud Lakefront
3.8% (47) 2.5% (24) -48.9% 0.2% (3) 0.5% (5) +66.7%
All Paths 19.5% (240) 20.1% (193) -19.6% 8.7% (107) 10.3% (99) -7.5%
Crashes Before and After Construction of Trails
Loop detector with bicycle marking
35
Traffic engineers can help bicyclists by first ensuring that the loops will indeed detect bicycles, then by marking the pavement with an MUTCD-approved (Manual on Uniform Traffic Control Devices) symbol that communicates to the cyclist where the bicycle should be placed to gain the green signal.
In six crashes the bicyclist was still in the intersection when the crossing traffic received a green light. Traffic engineers should ensure that combined green, yellow and red clearance times are sufficient for bicyclists to cross large intersections. Such crashes occurred at Old Winter Garden at Kirkman, John Young Parkway at Colonial Drive, Silver Star Road at John Young Parkway, Dean Road at Colonial Drive, and Rising Sun Blvd. at Red Bug Lake Road.
Continuous Right Turn Lanes and Drop Lanes
Extremely long designated right-turn-only lanes put bicyclists in the awkward situation of having to drive in the second lane, to the left of the right-turn-only lane, or to drive in the right turn lane even though they are going straight. A cyclist traveling straight and next to the curb in a designated right-turn-only lane, would be at fault in a crash with a right-turning motorist. Although they are intended for the use of drivers turning off the roadway at intersections and driveways, between intersections such lanes are occasionally used by motorists to pass on the right. Along roadways with such lanes, bicyclists will usually prefer to use the sidewalk, and the reason for such long turn lanes is the high number of driveways and cross streets, adding to the risk for sidewalk cyclists. Traffic engineers should consider breaking up such turn lanes with curb extensions, or designating the right-most lane as a combination straight/right-turn lane.
Drop lanes are lanes that change from through lanes to designated right-turn-only lanes as they approach intersections. Such lanes require straight-through bicyclists to change lanes. It is important that bicycle lanes provided in conjunction with such turn lanes be properly striped and configured. Straight-through bike lanes to the right of right-turn-only lanes force bicyclists into conflicts with right-turning motorists and are prohibited by the Manual on Uniform Traffic Control Devices.

36
Countermeasures for Law Enforcement
Enforcing Proper Bicyclist Behavior
Potentially Mitigates 30% to 48%
While there are a number of illegal behaviors that bicyclists commit that lead to crashes, only a few can be practically enforced for the sake of proactive crash reduction: wrong-way driving on the roadway, violation of stop sign and traffic signals, and lack of lights at night. Cyclist failure to yield when entering the roadway is a major crash cause, but proactive enforcement requires that the officer witness a violation that does not result in a crash. There is overlap of moving violations and non-moving violations (lack of proper lighting). Combined enforceable moving violations by bicyclists represent 37.5% of cyclist/motorist crashes. Cyclist lighting is discussed below.
Enforcing Correct Direction of Travel on Roadways
Potentially Mitigates 11%
Of 773 motorist/bicyclist crashes on roadways, sidewalks and paths, 81 (10.5%) involved cyclists traveling the wrong way on the roadway. These 81 represent 20.8% of the crashes involving cyclists on roadways (389). Of the 81, 64 (8.3%) did not involve another violation such as running a stop sign or signal. (Three wrong-way crashes involved bicyclists on paved shoulders. Since Florida law does not recognize a paved shoulder as part of the roadway, bicyclists traveling facing traffic are not committing violations.)
Geographic Distribution
Concentrations of crashes involving wrong-way cyclists on the roadway tend to be highly dispersed. Semoran Boulevard (SR 436) between Colonial Drive and Curry Ford Road, and Alafaya Trail (SR 434) between University Boulevard and Colonial Drive are the only two notable corridors. Eight crashes involving wrong-way on-roadway cyclists occurred on the west side of downtown Orlando. A concentration of four such crashes was found at near the intersection of Hoffner Avenue and Semoran Boulevard.
Enforcing Obeisance of Signs and Signals
Potentially Mitigates 14%
Bicyclists who violated stop signs accounted for 58 (7.5%) crashes. Nineteen of these involved cyclists who stopped but failed to yield; the other 39 involved cyclists who ran the stop sign. Bicyclists who violated traffic signals accounted for 49 (6.3%) crashes. Ten of these involved cyclists who stopped but failed to yield; the other 39 involved cyclists who ran the stop signal without stopping.
Geographic Distribution
Crashes involving these violations are concentrated in three areas: six on the west side of downtown Orlando; seven in St. Cloud along US 192; and six on the west side of Sanford.
Enforcing Yielding When Entering Roadway
Potentially Mitigates 13%
Bicyclists who failed to yield when entering a roadway accounted for 76 (8.6%) crashes. This number split evenly between children and adults. This behavior is difficult to enforce in non-crash situations, as the officer must observe the violation.
Enforcing Use of Required Lighting
Potentially Mitigates 5% to 11%
Bicyclists operating during hours of darkness are required to be equipped with a steady white headlight, a red taillight, and a red rear reflector. Data from crash reports is incomplete on this matter. Of 196 crashes that occurred during darkness, only 48 reports indicated whether or not the cyclist was equipped with lights. Three indicated the cyclist had both headlight and taillight (0.3% of all crashes; 1.5% of all night-time crashes), 45

37
indicated the cyclist was lacking a headlight, taillight, or both (5.0%; 23.0%). For 148 crashes the cyclist lighting is unknown (16.4%; 75.5%). In 53 cases (5.9%; 27%) where the cyclist lighting was unreported, the motorist committed a moving violation. These violations may have been due to the motorist’s inability to see the cyclist; 16 of the 53 occurred on roads without street lights. In total, 98 (10.9% of all crashes; 50% of all night-time crashes) involved a cyclist lacking proper lights or who may have contributed to the crash through their lack of lighting.
Geographic Distribution
Crashes involving cyclists without lights are concentrated along three corridors.
Table U
There is also a cluster of five night-time crashes in the area bounded by Semoran Boulevard, Aloma Avenue, University Boulevard and Goldenrod Road.
Enforcing Proper Behavior of Group Rides
Mitigates 0%
Group rides often elicit concern among residents and law enforcement, especially when groups run stop signs en masse or drive more than two abreast. While illegal behavior on the part of large groups of bicyclists certainly has the potential to lead to serious crashes, the safety impact of such behavior is insignificant compared to the behaviors of individual bicyclists. During this two-year study period there were seven reported crashes in which two bicyclists were involved and one in which three were involved. There were none involving more than three bicyclists. The crash involving the three cyclists was the fault of the motorist; in all but one case with two cyclists the motorist was found at fault.
Enforcing Motorist Behaviors Because of the relatively low numbers of bicyclists using our roadways and sidewalks, the observation of a
motorist committing a violation against a cyclist is likely to be a rare event. In many cases the violations are the same types as involved in motorist/motorist crashes. Officers should look for the following types of behaviors.
Enforcing Proper Passing
Potentially Mitigates At Least 3%
Motorists who pass too closely not only put bicyclists at risk for sideswipe crashes, they also intimidate cyclists into leaving the roadway for the sidewalk, where they are at greater risk from turning and crossing movements. Thirty crashes (3.4% of all) involved motorists overtaking bicyclists during daytime hours.
Street Limits Length in
Miles Number
of Crashes Crashes With No Street Lighting
All Crashes per Mile per Year
Colonial Drive (SR 50)
Goldenrod Road to Alafaya Trail
4.8 8 5 0.8
Goldenrod Road (SR 551)
University Blvd. to Narcoosee Road
8.4 10 4 0.6
Orange Blossom Trail (US 441)
Colonial Drive to Sand Lake Road
7.1 6 1 0.4
Concentrations of Crashes Involving Bicyclists Without Legal Lighting

38
Enforcing Yielding When Entering the Roadway from Driveways
Potentially Mitigates 20%
Of 885 crashes, 175 (19.8%) involved motorists who failed to yield when entering the roadway from a commercial or residential driveway. Bicyclists traveling on sidewalks have the same rights and responsibilities as pedestrians. As such, motorists must yield to cyclists on the sidewalk when entering the roadway from a driveway. Motorists should pay special attention to the possibility that a cyclist might be approaching from the right. (See Table M in section on Motorist Countermeasures, page 23.)
Enforcing Yielding When Required at Intersections
Potentially Mitigates 19%
Crashes at stop signs, yield signs or traffic signals in which the motorist was found at fault accounted for 169 (19.1%) of all crashes. In four of these cases the cyclist was also at fault for driving against traffic on the roadway. Ninety-seven of these crashes involved motorists who made right turns on red, failed to yield at signals, drove through signals without stopping, failed to yield to cross traffic at stop or yield signs, or drove through stop signs. (See Tables N and O in section on Motorist Countermeasures, pages 23 and 24.)
Enforcing Yielding When Turning Right or Left
Potentially Mitigates 5%
Of 885 crashes, 44 (5.0%) involved motorists who failed to yield to bicyclists when turning left or right. Motorist right turns are the primary concern for sidewalk cyclists.
Enforcing Sobriety
Potentially Mitigates 3% to 19%
While only 10 motorists involved (1.1%) were confirmed as illegally intoxicated, and another 13 (1.5%) were described as “had been drinking,” 144 motorists (16.3%) were coded as “unknown” as they were hit-and-run crashes. Certainly some percentage of these hit-and-run drivers were intoxicated to some extent. In 11 of the cases of illegal motorist intoxication, the bicyclist was found at fault for the crash. Of the hit-and-run crashes, 57 involved fault on the cyclist’s part. Thus, in 1.2% of all crashes, intoxication was the sole contributing factor on the part of the motorist, and may have been so in as many as an additional 6.4%.

39
Conclusions Crashes are rarely accidents; most are due to one or more of the parties committing a behavior that caused or
contributed to the collision. Of course humans are imperfect, but improving behavior through education, training, enforcement, and providing streets and paths that support correct behavior and minimize conflicts will clearly have a significant positive effect.
The data in this study indicates that the various roles involved in bicycling safety should take the following actions:
Child bicyclists should be taught to…
Travel with the flow of traffic, whether on the roadway or sidewalk.
Be conspicuous by equipping their bicycles with front and rear lights and wearing brightly colored clothing.
Obey stop signs and traffic signals.
Stop, scan, and yield before entering the roadway, and to use the “power pedal” position when starting.
Scan over the shoulder for following traffic without making the bicycle swerve.
Adult bicyclists should focus on …
Traveling with the flow of traffic, whether on the roadway or sidewalk.
Being conspicuous by equipping their bicycles with front and rear lights and wearing brightly colored clothing.
Obeying stop signs and traffic signals.
Stopping, scanning, and yielding before entering the roadway, and to using the “power pedal” position when starting.
Scan over the shoulder for following traffic without making the bicycle swerve.
Learning proper lane positioning when traveling on the roadway (cyclists should consider taking a course or obtaining a guide such as Florida Bicycling Street Smarts, available from METROPLAN Orlando or Florida Bicycle Association).
Motorists should focus on …
Scanning and yielding when entering the roadway from driveways, especially looking right because many bicyclists travel against the flow, either on the sidewalk or the roadway.
Scanning and obeying stop signs and traffic signals as required at intersections. As at driveways, motorists should also scan to the right.
Passing bicyclists safely and courteously
Scanning for and yielding to bicyclists when turning from major roadways into driveways and side-streets.

40
Transportation planners and traffic engineers should …
Include bike lanes on arterial and collector roadways, and ensure that designs of such facilities do not force or encourage cyclists to put themselves in conflict with turning motorists, hide cyclists from the view of potentially conflicting motorists, or force cyclists to travel in the “door zone.”
Ensure that traffic signal control loops detect bicycles and mark such loops to inform bicyclists where to stop to get the green light.
Ensure that traffic signal green phases are sufficient to allow bicyclists to cross wide intersections.
Provide street lighting.
Minimize the use of continuous right turn lanes, drop lanes and excessive right turn storage lanes.
Law enforcement officers should focus on citing or warning bicyclists who …
Drive against traffic on the roadway.
Run red lights and stop signs
Travel at night without front or rear lights
Law enforcement officers should — in addition to their current enforcement of speeding, intoxication and other common violations — focus on citing motorists who …
Fail to yield to bicyclists when entering the roadway or as required at intersections
Pass bicyclists too closely

41
Citations Page 15 Alan Wachtel and Diana Lewiston, Risk Factors for Bicycle-Motor Vehicle Collisions at Intersec-
tions, ITE Journal, 1994, reproduced at http://www.bicyclinglife.com/Library/riskfactors.htm
Page 15 William Moritz, Ph.D., Adult Bicyclists in the United States — Characteristics and Riding Experi-ence in 1996, Transportation Research Board, 1998, reproduced at http://www.bicyclinglife.com/Library/Moritz2.htm
Page 28 Peter Lagerwey, City of Seattle Bicycle & Pedestrian Coordinator, ProBike/ProWalk Conference, Madison, WI, 2006
Page 29 Michael Ronkin, Reasons for Highway Shoulders, Oregon Department of Transportation, http://www.walkable.org/download/shoulder.doc
Page 30 American Association of State Highway and Transportation Officials, Guide for the Development of Bicycle Facilities, 1999
Page 30 Wolfgang Rauh, Velo Secur (“Issues of Bicycling Safety”), Salzburg, translation by John S. Allen at http://www.bikexprt.com/bikepol/facil/sidepath/adfc173.htm
Page 30 Ole Bach, Ole Rosbach, Else Jørgensen, Cyclestier i byer - den sikkerhedsmæssige effekt (Bicyclists in cities -- the effect of safety measures), Hg. Vejdirektoratet, Næstved/Dänemark, 1985, cited by Allen at http://www.bikexprt.com/bikepol/facil/sidepath/unsafe.htm
Page 31 Organisation for Economic Cooperation and Development, Safety of Vulnerable Road Users, 1998, http://www.oecd.org/LongAbstract/0,2546,en_2649_34351_2103481_119666_1_1_1,00.html
Page 31 Jürgen Lüder, Traffic Crashes Involving Bicyclists, 1987, http://www.john-s-allen.com/research/berlin_1987/Berlinsuppeng.pdf
Page 31 Florida Department of Transportation, Florida Greenbook, http://www.dot.state.fl.us/rddesign/FloridaGreenbook/FGB.htm
Page 31 Florida Department of Transportation, Florida Bicycle Facilities Planning and Design Handbook, 1999, http://www.dot.state.fl.us/safety/ped_bike/ped_bike_standards.htm

42
Acknowledgements I would like to thank the following people for their work in bring the data together for this study:
Ruth Steiner, Ph.D. and Ilir Bejleri, Ph.D. and their Urban Planning students at the University of Florida for providing processed databases from the Florida Department of Highway Safety and Motor Vehicles, conducting the lion’s share of the GIS crash plotting, and teaching me how to use their crash mapping software.
Robin Butler at Seminole County Traffic Engineering, Bibi Jesram at Orange County Traffic Engineering, and Don Lepic at Osceola County Traffic Engineering, and Robert Faris at the City of Orlando for providing many of the crash report hard copies.
METROPLAN ORLANDO staff Nina Hidalgo, Fred Mays, Kiesha Johnson, and Tung-Lung Cheng for helping to collect crash report hardcopies, organize the reports, and assist with crash analysis.
Dwight Kingsbury at the Florida Department of Transportation provided a very helpful review of the final draft.
The Pedestrian and Bicyclist Crash Analysis Tool (PBCAT) used for this study can be downloaded from the Pedestrian and Bicycle Information Center at http://www.bicyclinginfo.org/bc/pbcat.cfm.
Cover photograph by James Newman (flickr.com). Photo on page 29 by Dan Burden. All other photos by Mighk Wilson. Crash illustrations are from the Pedestrian and Bicycle Information Center.
Mighk Wilson Bicycle & Pedestrian Coordinator METROPLAN ORLANDO 315 East Robinson Street Suite 355 Orlando, FL 32801-1949 407-481-5672 ext. 318 [email protected] www.metroplanorlando.com