Embed Size (px)
Citation preview
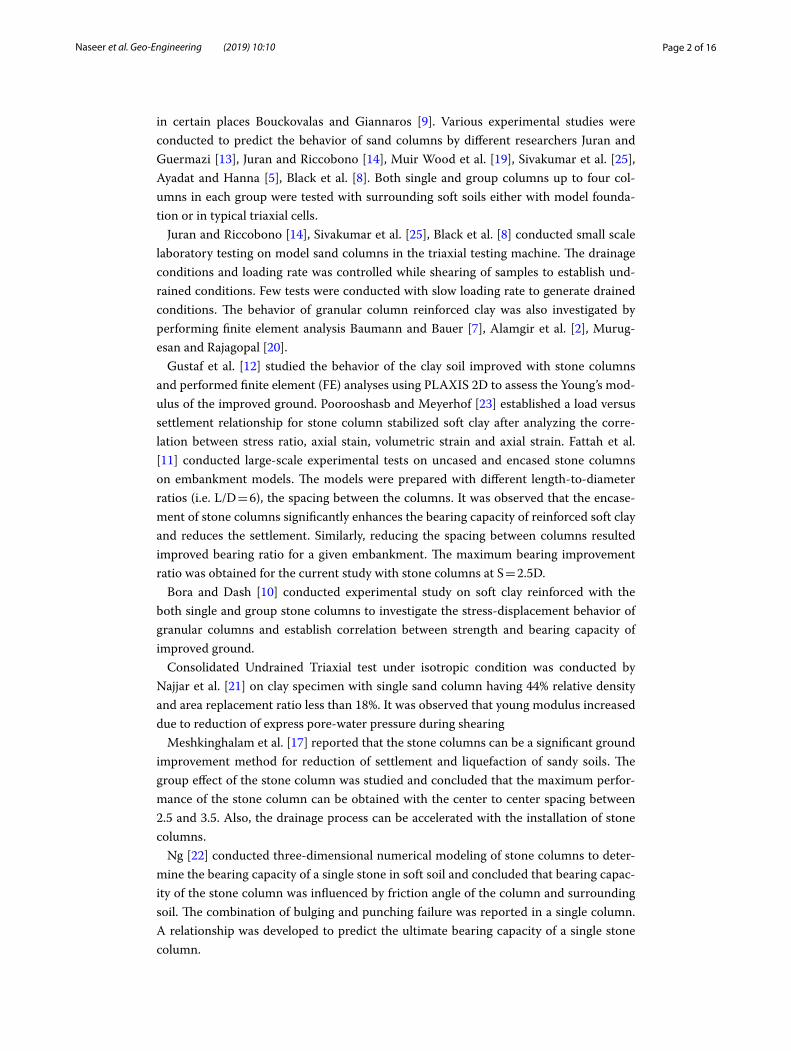
Laboratory and numerical based analysis of floating sand columns in clayey soilS. Naseer1* , M. Sarfraz Faiz1, S. Iqbal2 and S. M. Jamil1
IntroductionThe sand compaction piles (SCP) is a frequently used method for speedy improvement of soft clayey soils, especially in underwater conditions, such as that which exists in the land reclamation project. In regions where land is readily available, SCPs are likely to be a much more cost-effective option for ground improvement than chemical methods such as jet grouting and cement mixing. Several studies have been conducted by differ-ent researchers to investigate the behavior of stone columns using various analysis tech-niques, e.g. two-dimensional (2D) plane strain Tan et al. [26] or axisymmetric Ambily and Gandhi [3] and three-dimensional (3D) modelling Kadhim and Fouad [15], Killeen and McCabe [16]. In most of the cases, either the Mohr–Coulomb (MC) or HS models have been used to represent the behavior of both the granular column material and the treated soil (e.g. Killeen and McCabe [16]). Sexton and McCabe [24] were among the first to use a model incorporating viscous effects with an application to stone columns.
Aboshi et al. [1] outlined the development of the SCP method as follows: The first method of driving in the casing was by hammering in 1957. This method is still in use
Abstract
The inclusion of sand columns results in enhancing the bearing capacity of clayey soil, increase the rate of consolidation, presentation of liquefaction in loose sandy soils and provide lateral resistance against the horizontal movement. This research aims at investigating the effects of floating columns in clayey soil with silty deposits by devel-oping small scale laboratory models. The effects of sand columns on soils of different shear strengths, slenderness ratio (L/D) of columns were investigated. Group effect was also investigated by varying spacing between the columns. Experimental results were compared with the numerical analysis results. A 15-noded triangular mesh was gener-ated using a finite element tool PLAXIS 2D. Finite element analysis was performed using Mohr’s Coulomb’s criterion considering undrained analysis for soft clayey soil and drained analysis for sand columns. It was concluded that the sand columns can significantly increase the ultimate loading capacity of soft soils. Results show that criti-cal length for floating column ranges from 4 to 5.5 times the diameter of the column, beyond which bulging occurs and loading capacity decreased. The effect of group was also investigated and observed that with high spacing between the sand columns, the group efficiency decreased. The axial capacity of sand columns decreases while increasing spacing between the columns.
Keywords: Sand columns, Bearing capacity, Shear strength, Floating columns
Open Access
© The Author(s) 2019. This article is distributed under the terms of the Creative Commons Attribution 4.0 International License (http://creat iveco mmons .org/licen ses/by/4.0/), which permits unrestricted use, distribution, and reproduction in any medium, provided you give appropriate credit to the original author(s) and the source, provide a link to the Creative Commons license, and indicate if changes were made.
ORIGINAL RESEARCH
Naseer et al. Geo-Engineering (2019) 10:10 https://doi.org/10.1186/s40703-019-0106-6
*Correspondence: [email protected] 1 Department of Geotechnical Engineering, National University of Sciences and Technology (NUST), Islamabad, PakistanFull list of author information is available at the end of the article
Page 2 of 16Naseer et al. Geo-Engineering (2019) 10:10
in certain places Bouckovalas and Giannaros [9]. Various experimental studies were conducted to predict the behavior of sand columns by different researchers Juran and Guermazi [13], Juran and Riccobono [14], Muir Wood et al. [19], Sivakumar et al. [25], Ayadat and Hanna [5], Black et al. [8]. Both single and group columns up to four col-umns in each group were tested with surrounding soft soils either with model founda-tion or in typical triaxial cells.
Juran and Riccobono [14], Sivakumar et al. [25], Black et al. [8] conducted small scale laboratory testing on model sand columns in the triaxial testing machine. The drainage conditions and loading rate was controlled while shearing of samples to establish und-rained conditions. Few tests were conducted with slow loading rate to generate drained conditions. The behavior of granular column reinforced clay was also investigated by performing finite element analysis Baumann and Bauer [7], Alamgir et al. [2], Murug-esan and Rajagopal [20].
Gustaf et al. [12] studied the behavior of the clay soil improved with stone columns and performed finite element (FE) analyses using PLAXIS 2D to assess the Young’s mod-ulus of the improved ground. Poorooshasb and Meyerhof [23] established a load versus settlement relationship for stone column stabilized soft clay after analyzing the corre-lation between stress ratio, axial stain, volumetric strain and axial strain. Fattah et al. [11] conducted large-scale experimental tests on uncased and encased stone columns on embankment models. The models were prepared with different length-to-diameter ratios (i.e. L/D = 6), the spacing between the columns. It was observed that the encase-ment of stone columns significantly enhances the bearing capacity of reinforced soft clay and reduces the settlement. Similarly, reducing the spacing between columns resulted improved bearing ratio for a given embankment. The maximum bearing improvement ratio was obtained for the current study with stone columns at S = 2.5D.
Bora and Dash [10] conducted experimental study on soft clay reinforced with the both single and group stone columns to investigate the stress-displacement behavior of granular columns and establish correlation between strength and bearing capacity of improved ground.
Consolidated Undrained Triaxial test under isotropic condition was conducted by Najjar et al. [21] on clay specimen with single sand column having 44% relative density and area replacement ratio less than 18%. It was observed that young modulus increased due to reduction of express pore-water pressure during shearing
Meshkinghalam et al. [17] reported that the stone columns can be a significant ground improvement method for reduction of settlement and liquefaction of sandy soils. The group effect of the stone column was studied and concluded that the maximum perfor-mance of the stone column can be obtained with the center to center spacing between 2.5 and 3.5. Also, the drainage process can be accelerated with the installation of stone columns.
Ng [22] conducted three-dimensional numerical modeling of stone columns to deter-mine the bearing capacity of a single stone in soft soil and concluded that bearing capac-ity of the stone column was influenced by friction angle of the column and surrounding soil. The combination of bulging and punching failure was reported in a single column. A relationship was developed to predict the ultimate bearing capacity of a single stone column.
Page 3 of 16Naseer et al. Geo-Engineering (2019) 10:10
The current paper describes the small-scale modeling of sand column treated soft soil in the laboratory by varying different parameters such as shear strength of soft soil, length to diameter (L/D) ratio of the sand column, and spacing to diameter (S/D) ratio, in case of group columns. The experimental results are thereafter compared with finite element analysis results which were obtained using finite element tool PLAXIS 2D. The purpose of the study was to verify the behavior of sand columns in soft soil and assess the changes in the ultimate load carrying capacity of the composite ground. Various methods have been adopted to overcome the challenge among which inclusion of granu-lar columns/stone columns is found be an effective technique for increasing the drain-age properties of clayey soils and ultimately reducing settlement and enhancing the load carrying capacity of the composite ground. Most of the studies were conducted on stone columns with material size more than 4 mm, which gave a significant improvement in bearing capacity of the composite ground. In this study, backfill material that was used for the column’s construction is fine and have a size of less than 4 mm (i.e. course sand). However, very little research and theories are available in the literature for sand replace-ment column to treat the clayey soil. Also, this work of this paper provides a practical guide for practicing geotechnical design engineers to establish an optimum and cost-effective sand columns inclusion scheme to achieve the required target of soil improve-ment and better assess the improvement factors.
Experimental setupTest program
A series of model tests of treated soil with sand column was performed in the labora-tory to study the efficiency of these columns in improving the load carrying capacity of the soil. The steel molds used for experimentation had the following dimensions; height = 360 mm, internal diameter = 300 mm, wall thickness = 6 mm and were locally assembled. Load tests were carried out in two steps; first on untreated soil and in the second stage on treated soil in a Compression Testing Machine.
Properties of materials
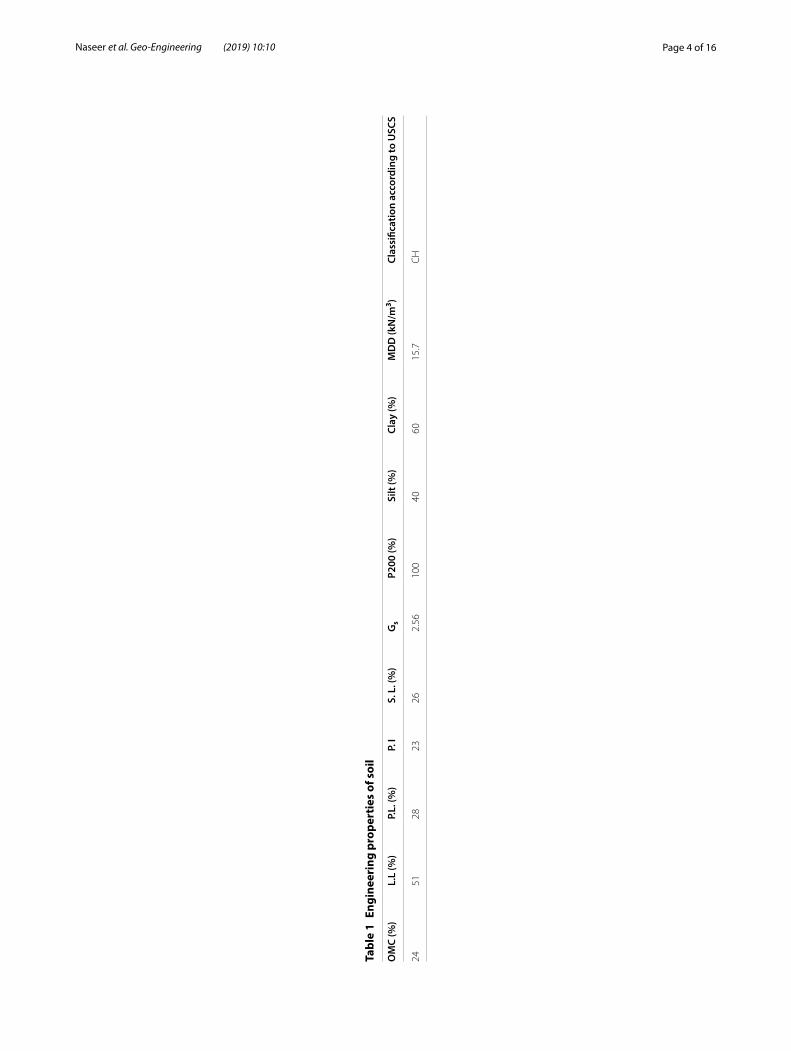
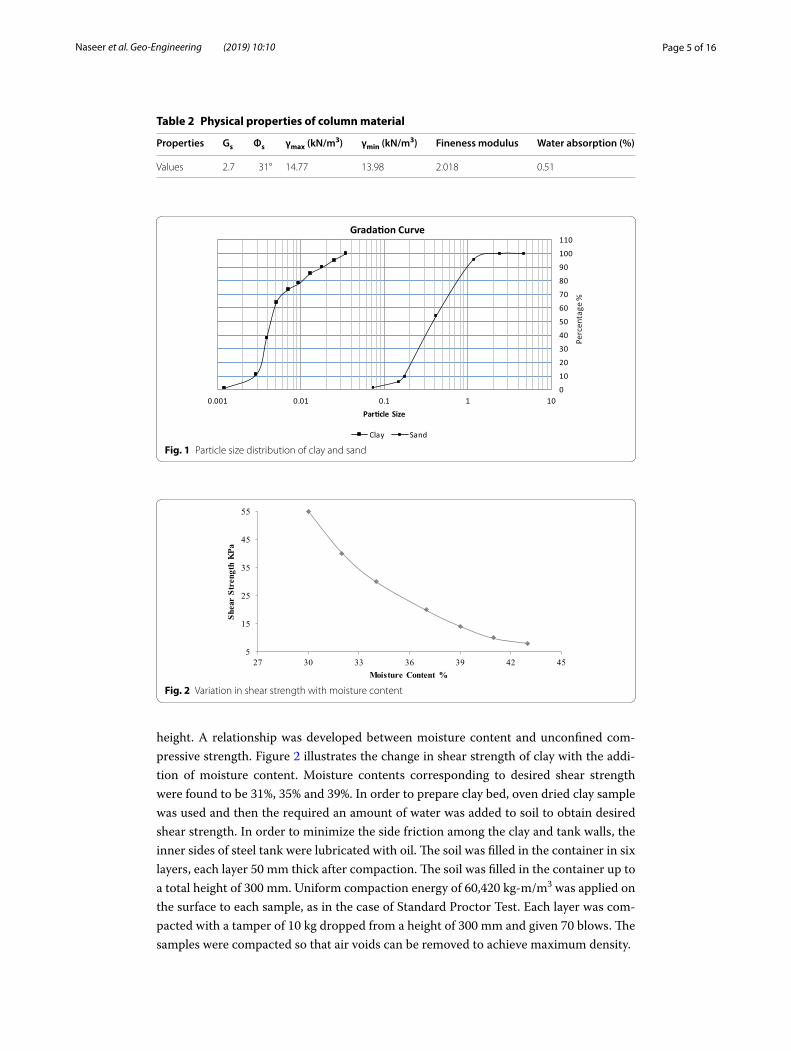
The materials used in this study were clay and sand. The clayey soil was collected from Jahangira district Sawabi, province of KPK, Pakistan. The soil was then pulverized in the laboratory to conduct different tests to obtain various engineering properties like moisture content, grain size distribution, Atterberg’s limits, unconfined compressive strength, and Proctor compaction tests. The results are summarized in Table 1. Locally available sand was used as backfill material in sand columns. The sand was thoroughly washed and oven dried, sieve analysis was performed and the angle of internal friction was found using direct shear test. The maximum and minimum dry density was found out to be 14.77 kN/m3 and 13.98 kN/m3. The physical properties of sand are summarized in Table 2. The gradation curve for virgin clay and column material is illustrated in Fig. 1.
Preparation of clay bed
All the compression tests were performed on soft clay samples at various undrained shear strengths of 54 kPa, 32 kPa, and 14 kPa. Before the preparation of clay bed, uncon-fined compression tests were conducted on a sample of 40 mm diameter and 80 mm
Page 4 of 16Naseer et al. Geo-Engineering (2019) 10:10
Tabl
e 1
Engi
neer
ing
prop
erti
es o
f soi
l
OM
C (%
)L.
L (%
)P.
L. (%
)P.
IS.
L. (
%)
Gs
P200
(%)
Silt
(%)
Clay
(%)
MD
D (k
N/m
3 )Cl
assi
ficat
ion
acco
rdin
g to
USC
S
2451
2823
262.
5610
040
6015
.7C
H
Page 5 of 16Naseer et al. Geo-Engineering (2019) 10:10
height. A relationship was developed between moisture content and unconfined com-pressive strength. Figure 2 illustrates the change in shear strength of clay with the addi-tion of moisture content. Moisture contents corresponding to desired shear strength were found to be 31%, 35% and 39%. In order to prepare clay bed, oven dried clay sample was used and then the required an amount of water was added to soil to obtain desired shear strength. In order to minimize the side friction among the clay and tank walls, the inner sides of steel tank were lubricated with oil. The soil was filled in the container in six layers, each layer 50 mm thick after compaction. The soil was filled in the container up to a total height of 300 mm. Uniform compaction energy of 60,420 kg-m/m3 was applied on the surface to each sample, as in the case of Standard Proctor Test. Each layer was com-pacted with a tamper of 10 kg dropped from a height of 300 mm and given 70 blows. The samples were compacted so that air voids can be removed to achieve maximum density.
Table 2 Physical properties of column material
Properties Gs Φs γmax (kN/m3) γmin (kN/m3) Fineness modulus Water absorption (%)
Values 2.7 31° 14.77 13.98 2.018 0.51
0
10
20
30
40
50
60
70
80
90
100
110
0.001 0.01 0.1 1 10Par�cle Size
Grada�on Curve
Clay Sand
Perc
enta
ge%
Fig. 1 Particle size distribution of clay and sand
5
15
25
35
45
55
27 30 33 36 39 42 45
Shea
r St
reng
th K
Pa
Moisture Content %
Fig. 2 Variation in shear strength with moisture content
Page 6 of 16Naseer et al. Geo-Engineering (2019) 10:10
Construction of sand columns
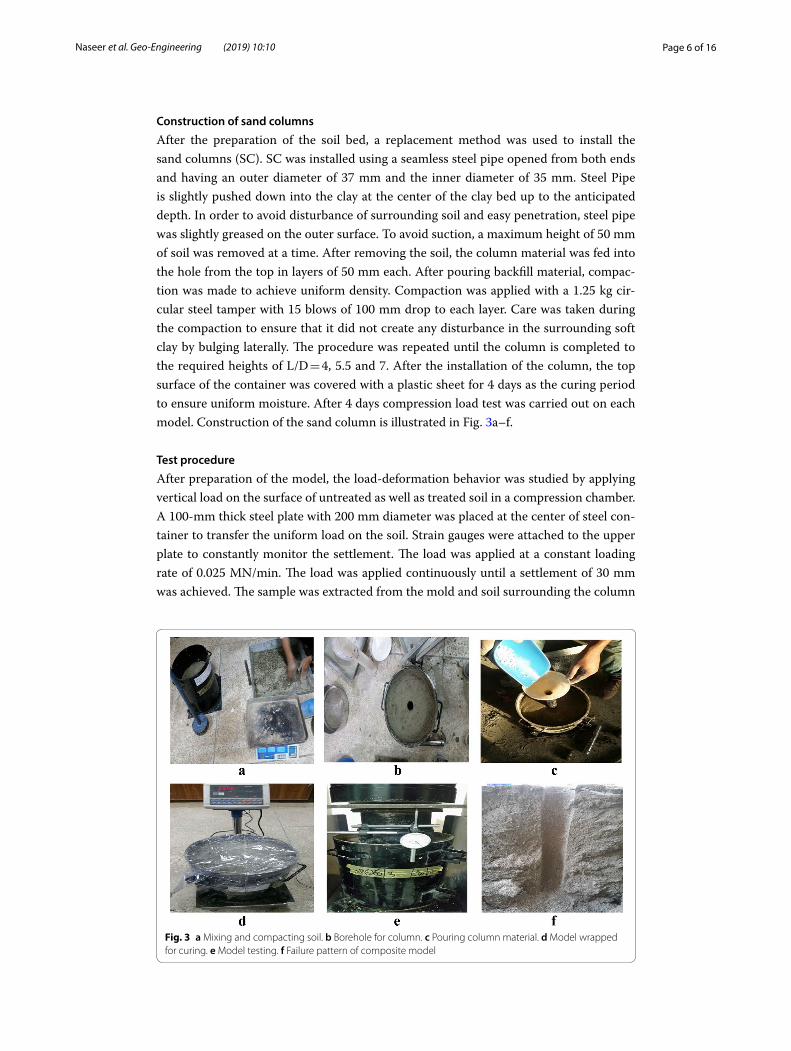
After the preparation of the soil bed, a replacement method was used to install the sand columns (SC). SC was installed using a seamless steel pipe opened from both ends and having an outer diameter of 37 mm and the inner diameter of 35 mm. Steel Pipe is slightly pushed down into the clay at the center of the clay bed up to the anticipated depth. In order to avoid disturbance of surrounding soil and easy penetration, steel pipe was slightly greased on the outer surface. To avoid suction, a maximum height of 50 mm of soil was removed at a time. After removing the soil, the column material was fed into the hole from the top in layers of 50 mm each. After pouring backfill material, compac-tion was made to achieve uniform density. Compaction was applied with a 1.25 kg cir-cular steel tamper with 15 blows of 100 mm drop to each layer. Care was taken during the compaction to ensure that it did not create any disturbance in the surrounding soft clay by bulging laterally. The procedure was repeated until the column is completed to the required heights of L/D = 4, 5.5 and 7. After the installation of the column, the top surface of the container was covered with a plastic sheet for 4 days as the curing period to ensure uniform moisture. After 4 days compression load test was carried out on each model. Construction of the sand column is illustrated in Fig. 3a–f.
Test procedure
After preparation of the model, the load-deformation behavior was studied by applying vertical load on the surface of untreated as well as treated soil in a compression chamber. A 100-mm thick steel plate with 200 mm diameter was placed at the center of steel con-tainer to transfer the uniform load on the soil. Strain gauges were attached to the upper plate to constantly monitor the settlement. The load was applied at a constant loading rate of 0.025 MN/min. The load was applied continuously until a settlement of 30 mm was achieved. The sample was extracted from the mold and soil surrounding the column
Fig. 3 a Mixing and compacting soil. b Borehole for column. c Pouring column material. d Model wrapped for curing. e Model testing. f Failure pattern of composite model
Page 7 of 16Naseer et al. Geo-Engineering (2019) 10:10
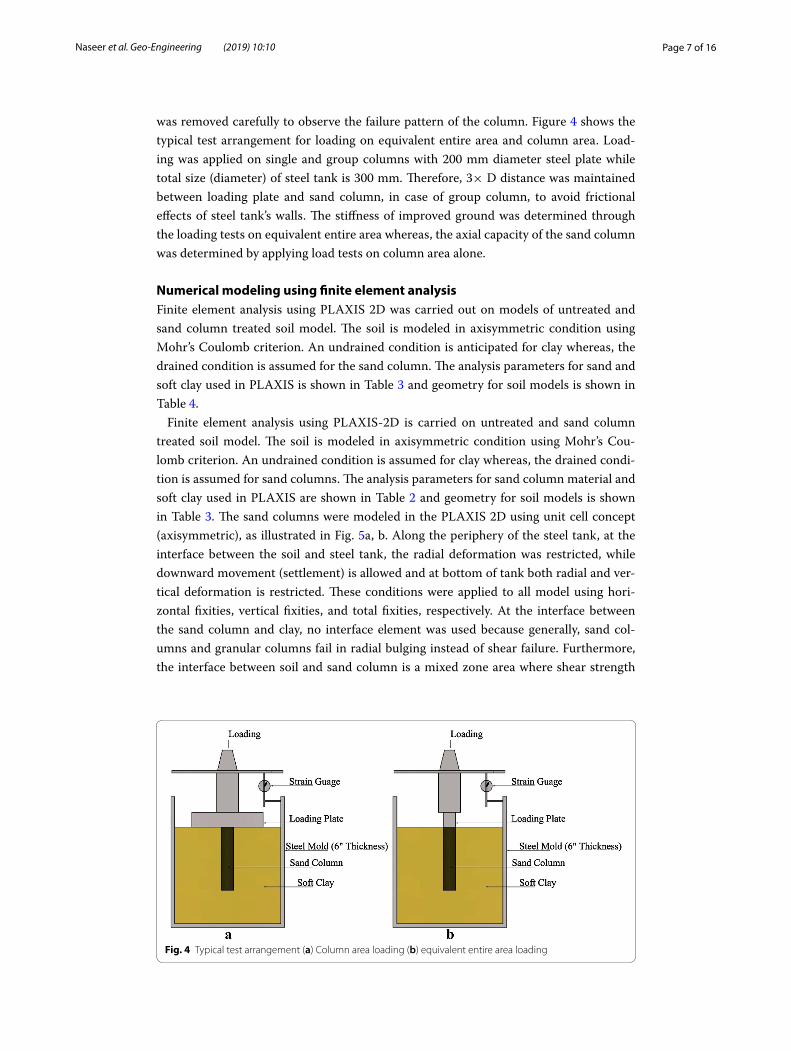
was removed carefully to observe the failure pattern of the column. Figure 4 shows the typical test arrangement for loading on equivalent entire area and column area. Load-ing was applied on single and group columns with 200 mm diameter steel plate while total size (diameter) of steel tank is 300 mm. Therefore, 3× D distance was maintained between loading plate and sand column, in case of group column, to avoid frictional effects of steel tank’s walls. The stiffness of improved ground was determined through the loading tests on equivalent entire area whereas, the axial capacity of the sand column was determined by applying load tests on column area alone.
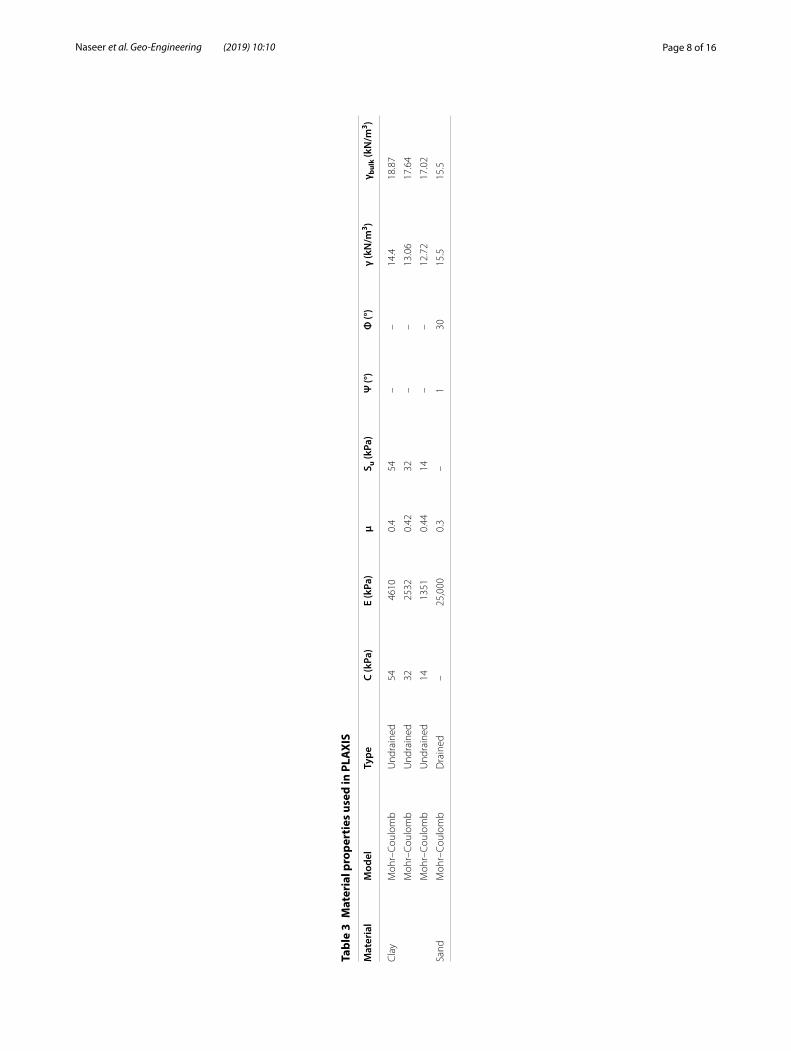
Numerical modeling using finite element analysisFinite element analysis using PLAXIS 2D was carried out on models of untreated and sand column treated soil model. The soil is modeled in axisymmetric condition using Mohr’s Coulomb criterion. An undrained condition is anticipated for clay whereas, the drained condition is assumed for the sand column. The analysis parameters for sand and soft clay used in PLAXIS is shown in Table 3 and geometry for soil models is shown in Table 4.
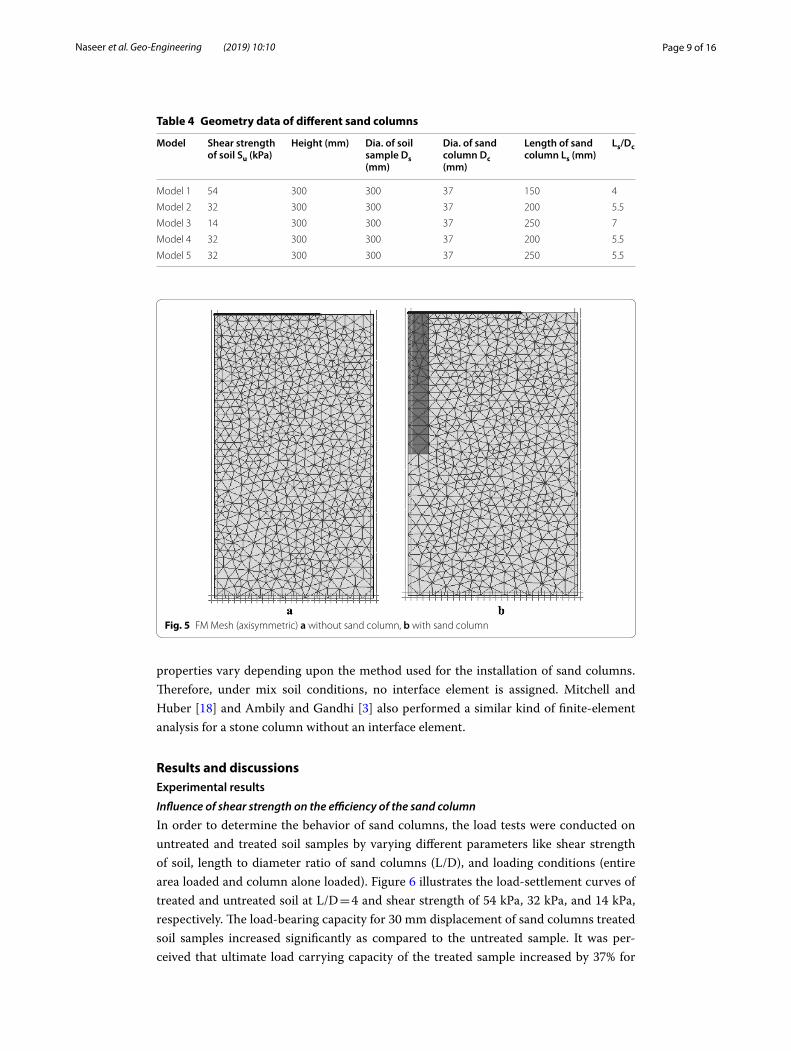
Finite element analysis using PLAXIS-2D is carried on untreated and sand column treated soil model. The soil is modeled in axisymmetric condition using Mohr’s Cou-lomb criterion. An undrained condition is assumed for clay whereas, the drained condi-tion is assumed for sand columns. The analysis parameters for sand column material and soft clay used in PLAXIS are shown in Table 2 and geometry for soil models is shown in Table 3. The sand columns were modeled in the PLAXIS 2D using unit cell concept (axisymmetric), as illustrated in Fig. 5a, b. Along the periphery of the steel tank, at the interface between the soil and steel tank, the radial deformation was restricted, while downward movement (settlement) is allowed and at bottom of tank both radial and ver-tical deformation is restricted. These conditions were applied to all model using hori-zontal fixities, vertical fixities, and total fixities, respectively. At the interface between the sand column and clay, no interface element was used because generally, sand col-umns and granular columns fail in radial bulging instead of shear failure. Furthermore, the interface between soil and sand column is a mixed zone area where shear strength
Fig. 4 Typical test arrangement (a) Column area loading (b) equivalent entire area loading
Page 8 of 16Naseer et al. Geo-Engineering (2019) 10:10
Tabl
e 3
Mat
eria
l pro
pert
ies
used
in P
LAXI
S
Mat
eria
lM
odel
Type
C (k
Pa)
E (k
Pa)
µS u
(kPa
)Ψ
(°)
Φ (°
)γ
(kN
/m3 )
γ bulk
(kN
/m3 )
Cla
yM
ohr–
Coul
omb
Und
rain
ed54
4610
0.4
54–
–14
.418
.87
Moh
r–Co
ulom
bU
ndra
ined
3225
320.
4232
––
13.0
617
.64
Moh
r–Co
ulom
bU
ndra
ined
1413
510.
4414
––
12.7
217
.02
Sand
Moh
r–Co
ulom
bD
rain
ed–
25,0
000.
3–
130
15.5
15.5
Page 9 of 16Naseer et al. Geo-Engineering (2019) 10:10
properties vary depending upon the method used for the installation of sand columns. Therefore, under mix soil conditions, no interface element is assigned. Mitchell and Huber [18] and Ambily and Gandhi [3] also performed a similar kind of finite-element analysis for a stone column without an interface element.
Results and discussionsExperimental results
Influence of shear strength on the efficiency of the sand column
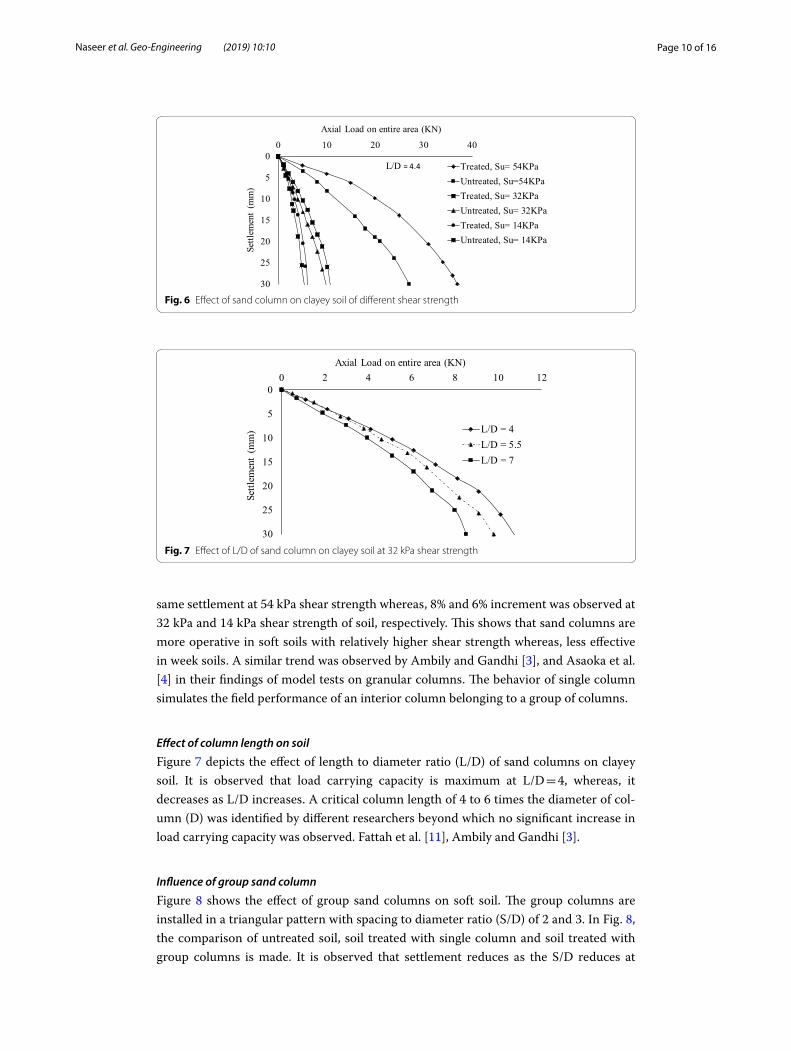
In order to determine the behavior of sand columns, the load tests were conducted on untreated and treated soil samples by varying different parameters like shear strength of soil, length to diameter ratio of sand columns (L/D), and loading conditions (entire area loaded and column alone loaded). Figure 6 illustrates the load-settlement curves of treated and untreated soil at L/D = 4 and shear strength of 54 kPa, 32 kPa, and 14 kPa, respectively. The load-bearing capacity for 30 mm displacement of sand columns treated soil samples increased significantly as compared to the untreated sample. It was per-ceived that ultimate load carrying capacity of the treated sample increased by 37% for
Table 4 Geometry data of different sand columns
Model Shear strength of soil Su (kPa)
Height (mm) Dia. of soil sample Ds (mm)
Dia. of sand column Dc (mm)
Length of sand column Ls (mm)
Ls/Dc
Model 1 54 300 300 37 150 4
Model 2 32 300 300 37 200 5.5
Model 3 14 300 300 37 250 7
Model 4 32 300 300 37 200 5.5
Model 5 32 300 300 37 250 5.5
Fig. 5 FM Mesh (axisymmetric) a without sand column, b with sand column
Page 10 of 16Naseer et al. Geo-Engineering (2019) 10:10
same settlement at 54 kPa shear strength whereas, 8% and 6% increment was observed at 32 kPa and 14 kPa shear strength of soil, respectively. This shows that sand columns are more operative in soft soils with relatively higher shear strength whereas, less effective in week soils. A similar trend was observed by Ambily and Gandhi [3], and Asaoka et al. [4] in their findings of model tests on granular columns. The behavior of single column simulates the field performance of an interior column belonging to a group of columns.
Effect of column length on soil
Figure 7 depicts the effect of length to diameter ratio (L/D) of sand columns on clayey soil. It is observed that load carrying capacity is maximum at L/D = 4, whereas, it decreases as L/D increases. A critical column length of 4 to 6 times the diameter of col-umn (D) was identified by different researchers beyond which no significant increase in load carrying capacity was observed. Fattah et al. [11], Ambily and Gandhi [3].
Influence of group sand column
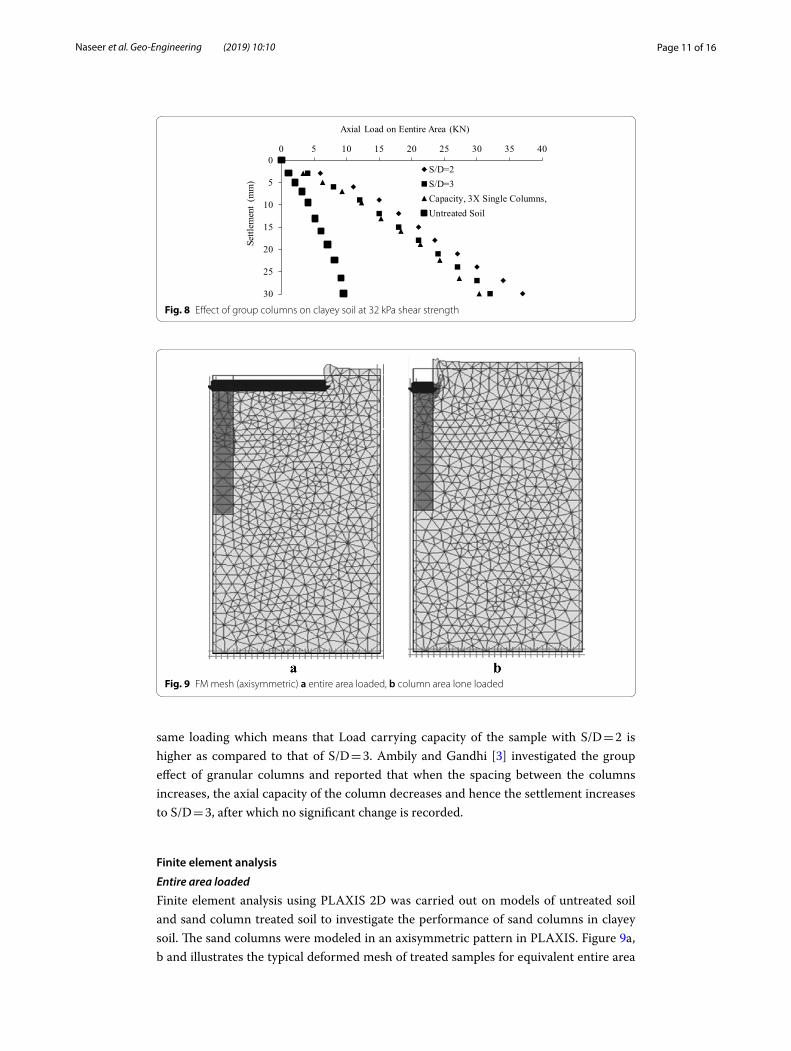
Figure 8 shows the effect of group sand columns on soft soil. The group columns are installed in a triangular pattern with spacing to diameter ratio (S/D) of 2 and 3. In Fig. 8, the comparison of untreated soil, soil treated with single column and soil treated with group columns is made. It is observed that settlement reduces as the S/D reduces at
0
5
10
15
20
25
30
0 10 20 30 40
Settl
emen
t (m
m)
Axial Load on entire area (KN)
Treated, Su= 54KPaUntreated, Su=54KPaTreated, Su= 32KPaUntreated, Su= 32KPaTreated, Su= 14KPaUntreated, Su= 14KPa
L/D = 4.4
Fig. 6 Effect of sand column on clayey soil of different shear strength
0
5
10
15
20
25
30
0 2 4 6 8 10 12
Settl
emen
t (m
m)
Axial Load on entire area (KN)
L/D = 4L/D = 5.5L/D = 7
Fig. 7 Effect of L/D of sand column on clayey soil at 32 kPa shear strength
Page 11 of 16Naseer et al. Geo-Engineering (2019) 10:10
same loading which means that Load carrying capacity of the sample with S/D = 2 is higher as compared to that of S/D = 3. Ambily and Gandhi [3] investigated the group effect of granular columns and reported that when the spacing between the columns increases, the axial capacity of the column decreases and hence the settlement increases to S/D = 3, after which no significant change is recorded.
Finite element analysis
Entire area loaded
Finite element analysis using PLAXIS 2D was carried out on models of untreated soil and sand column treated soil to investigate the performance of sand columns in clayey soil. The sand columns were modeled in an axisymmetric pattern in PLAXIS. Figure 9a, b and illustrates the typical deformed mesh of treated samples for equivalent entire area
0
5
10
15
20
25
30
0 5 10 15 20 25 30 35 40
Settl
emen
t (m
m)
Axial Load on Eentire Area (KN)
S/D=2S/D=3Capacity, 3X Single Columns,Untreated Soil
Fig. 8 Effect of group columns on clayey soil at 32 kPa shear strength
Fig. 9 FM mesh (axisymmetric) a entire area loaded, b column area lone loaded
Page 12 of 16Naseer et al. Geo-Engineering (2019) 10:10
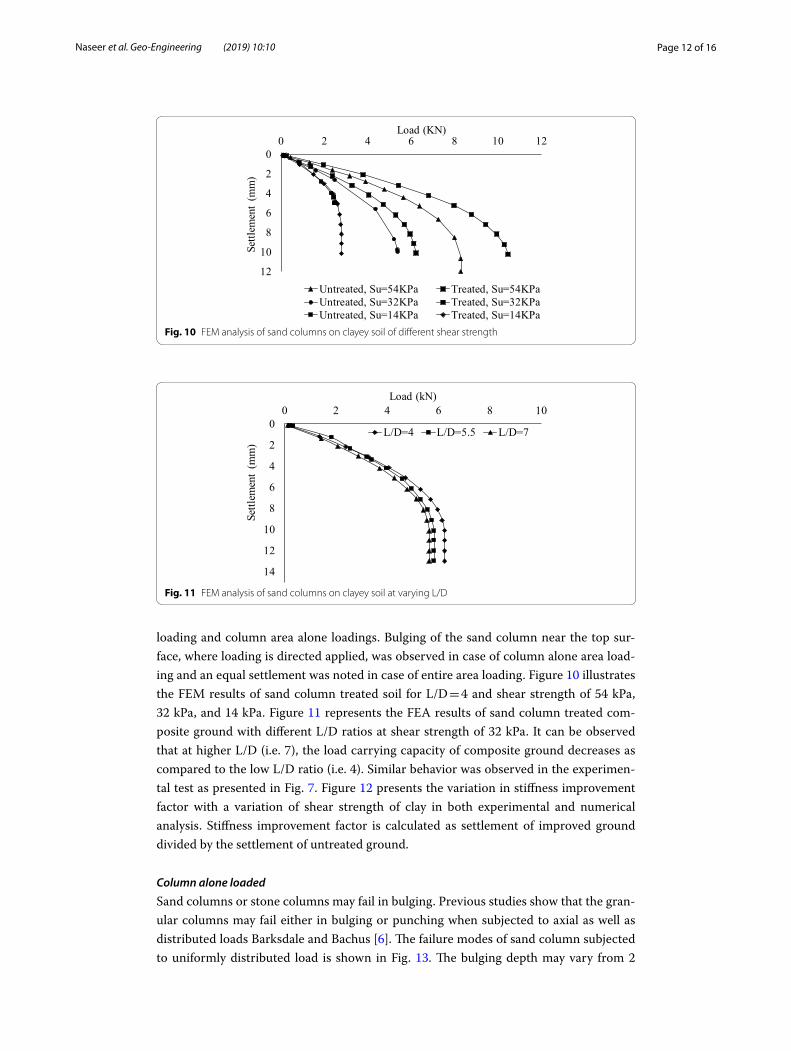
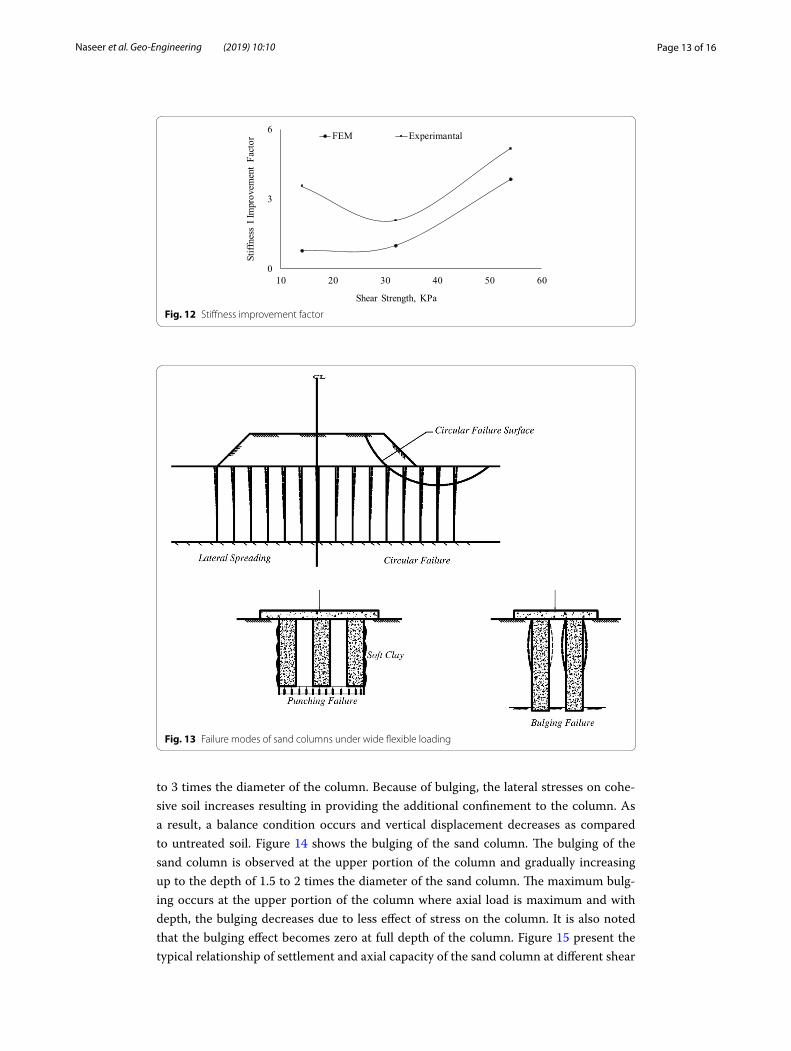
loading and column area alone loadings. Bulging of the sand column near the top sur-face, where loading is directed applied, was observed in case of column alone area load-ing and an equal settlement was noted in case of entire area loading. Figure 10 illustrates the FEM results of sand column treated soil for L/D = 4 and shear strength of 54 kPa, 32 kPa, and 14 kPa. Figure 11 represents the FEA results of sand column treated com-posite ground with different L/D ratios at shear strength of 32 kPa. It can be observed that at higher L/D (i.e. 7), the load carrying capacity of composite ground decreases as compared to the low L/D ratio (i.e. 4). Similar behavior was observed in the experimen-tal test as presented in Fig. 7. Figure 12 presents the variation in stiffness improvement factor with a variation of shear strength of clay in both experimental and numerical analysis. Stiffness improvement factor is calculated as settlement of improved ground divided by the settlement of untreated ground.
Column alone loaded
Sand columns or stone columns may fail in bulging. Previous studies show that the gran-ular columns may fail either in bulging or punching when subjected to axial as well as distributed loads Barksdale and Bachus [6]. The failure modes of sand column subjected to uniformly distributed load is shown in Fig. 13. The bulging depth may vary from 2
0
2
4
6
8
10
12
0 2 4 6 8 10 12
Settl
emen
t (m
m)
Load (KN)
Untreated, Su=54KPa Treated, Su=54KPaUntreated, Su=32KPa Treated, Su=32KPaUntreated, Su=14KPa Treated, Su=14KPa
Fig. 10 FEM analysis of sand columns on clayey soil of different shear strength
0
2
4
6
8
10
12
14
0 2 4 6 8 10
Settl
emen
t (m
m)
Load (kN)
L/D=4 L/D=5.5 L/D=7
Fig. 11 FEM analysis of sand columns on clayey soil at varying L/D
Page 13 of 16Naseer et al. Geo-Engineering (2019) 10:10
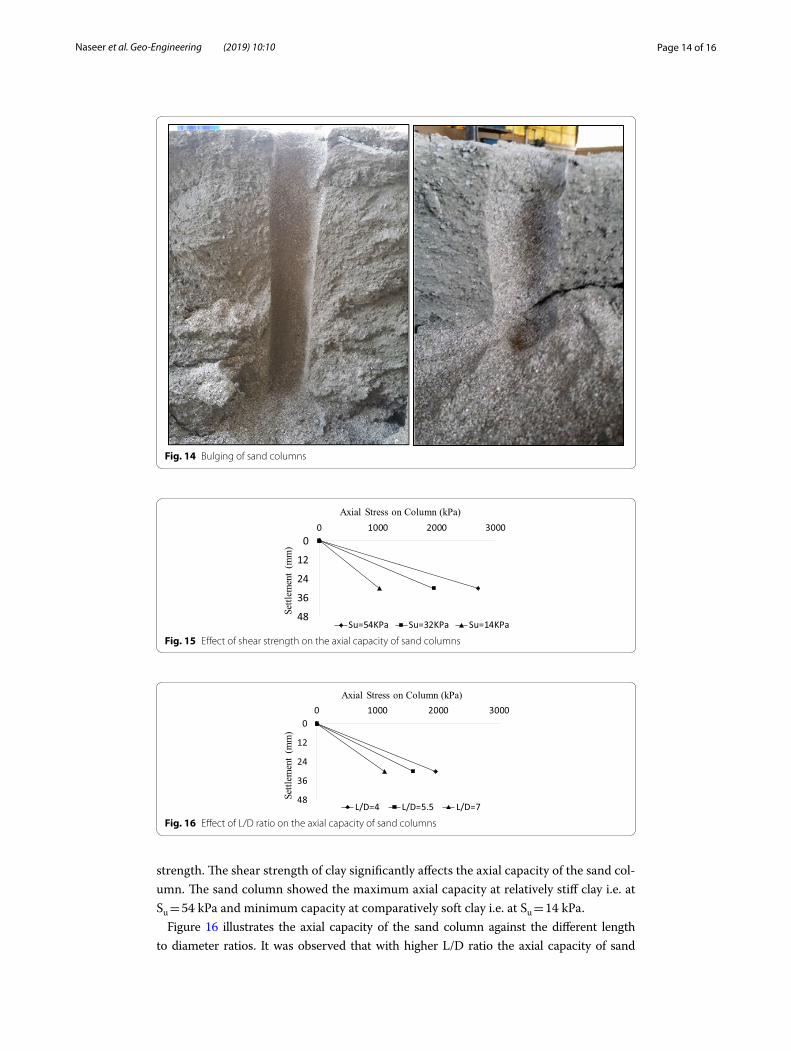
to 3 times the diameter of the column. Because of bulging, the lateral stresses on cohe-sive soil increases resulting in providing the additional confinement to the column. As a result, a balance condition occurs and vertical displacement decreases as compared to untreated soil. Figure 14 shows the bulging of the sand column. The bulging of the sand column is observed at the upper portion of the column and gradually increasing up to the depth of 1.5 to 2 times the diameter of the sand column. The maximum bulg-ing occurs at the upper portion of the column where axial load is maximum and with depth, the bulging decreases due to less effect of stress on the column. It is also noted that the bulging effect becomes zero at full depth of the column. Figure 15 present the typical relationship of settlement and axial capacity of the sand column at different shear
0
3
6
10 20 30 40 50 60
Stiff
ness
I Im
prov
emen
t Fa
ctor
Shear Strength, KPa
FEM Experimantal
Fig. 12 Stiffness improvement factor
Fig. 13 Failure modes of sand columns under wide flexible loading
Page 14 of 16Naseer et al. Geo-Engineering (2019) 10:10
strength. The shear strength of clay significantly affects the axial capacity of the sand col-umn. The sand column showed the maximum axial capacity at relatively stiff clay i.e. at Su = 54 kPa and minimum capacity at comparatively soft clay i.e. at Su = 14 kPa.
Figure 16 illustrates the axial capacity of the sand column against the different length to diameter ratios. It was observed that with higher L/D ratio the axial capacity of sand
Fig. 14 Bulging of sand columns
0
12
24
36
48
0 1000 2000 3000
Settl
emen
t (m
m)
Axial Stress on Column (kPa)
Su=54KPa Su=32KPa Su=14KPa
Fig. 15 Effect of shear strength on the axial capacity of sand columns
0
12
24
36
48
0 1000 2000 3000
Settl
emen
t (m
m)
Axial Stress on Column (kPa)
L/D=4 L/D=5.5 L/D=7
Fig. 16 Effect of L/D ratio on the axial capacity of sand columns
Page 15 of 16Naseer et al. Geo-Engineering (2019) 10:10
column decreases due to the increase in slenderness of sand columns. The similar behavior was observed during the entire area loading on treated samples.
ConclusionsNatural on situ- soils are sometimes not favorable for the construction of engineered struc-tures; therefore, soils need to be improved/reinforced. Sand column or Sand Compaction Piles method is a ground improvement technique which is widely used in worldwide. A detailed experimental and finite element-based study is conducted in order to investigate the effect of sand columns in clayey soils. After conducting the detailed experimental and numerical analysis, the succeeding conclusions are outlined as follows;
1. The shear strength of clayey soils plays a significant role in influencing the Sand col-umns or sand compaction piles. The behavior of sand columns in clayey soil with different shear strength (i.e. Su = 54 kPa, 32 kPa, and 14 kPa) is investigated in this study. It was observed that sand column is more effective in relatively higher shear strength as compared to week soil. Whereas the little increment in ultimate loading capacity of the composite ground is noted in shear strength of 32 kPa and no signifi-cant improvement is observed at Su = 14 kPa.
2. The consequence of length to diameter ratio is also investigated. The maximum strength increment is achieved at L/D = 4. While increasing the L/D ratio, the load-ing capacity decreases due to the bulging of the sand column in the composite ground. Therefore, the critical length for partially penetrating column was perceived to be 4 times the diameter of the sand column.
3. The influence of sand group columns is also determined; group efficiency is calcu-lated by varying the spacing among the columns. As the spacing among the columns increases the ultimate load carrying capacity decreases. The group effect reduces as spacing increases.
4. The single sand column tests with equivalent area loaded are well comparable with the group column tests. The single sand column will simulate the practical behavior for an interior sand column when large numbers of columns are subjected to uni-form loading.
5. The bulging of sand columns is observed in the top region of the column where axial stress is maximum and bulging depth remain constant till the 1.5 times the diameter of the sand column when column alone is loaded. However, in case of the entire area loaded, no bulging occurs in sand column. The bearing capacity failure is observed while the entire area is loaded.
Authors’ contributionsSN: The entire study was conducted by him. MSF: carried out the literature studes in addition to the finite element analysis using the PLAXIS. SI: He is an expert from a geotechnical firm who guide and supervise the numerical modeling using PLAXIS and helped in drafting the manuscript. SM: He is the major supervisor of the entire study. All authors read and approved the final manuscript.
Competing interestsThe authors declare that they have no competing interests.
Page 16 of 16Naseer et al. Geo-Engineering (2019) 10:10
Author details1 Department of Geotechnical Engineering, National University of Sciences and Technology (NUST), Islamabad, Pakistan. 2 Ammico Contracting Co. W.L.L., Doha, Qatar.
Received: 22 November 2018 Accepted: 2 October 2019
References 1. Aboshi H, Mizuno Y, Kuwabara M (1991) The present state of sand compaction pile in Japan. Deep Foundation
Improvements: design, construction, and testing. ASTM International, West Conshohocken. https ://doi.org/10.1520/STP25 049S
2. Alamgir M, Miura N, Poorooshasb H, Madhav M (1996) Deformation analysis of soft ground reinforced by columnar inclusions. Comput Geotech 18(4):267–290. https ://doi.org/10.1016/0266-352X(95)00034 -8
3. Ambily A, Gandhi SR (2007) Behavior of stone columns based on experimental and FEM analysis. J Geotech Geoen-viron Eng 133(4):405–415. https ://doi.org/10.1061/(ASCE)1090-0241(2007)133:4(405)
4. Asaoka A, Kodaka T, Nozu M (1994) Undrained shear strength of clay improved with sand compaction piles. Soils Found 34(4):23–32. https ://doi.org/10.3208/sandf 1972.34.4_23
5. Ayadat T, Hanna AM (2005) Encapsulated stone columns as a soil improvement technique for collapsible soil. Proc Inst Civil Eng-Ground Improv 9(4):137–147
6. Barksdale RD, Bachus RC (1983) Design and construction of stone columns. Federal Highway Administration 7. Baumann V, Bauer G (1974) The performance of foundations on various soils stabilized by the vibro-compaction
method. Can Geotech J 11(4):509–530. https ://doi.org/10.1139/t74-056 8. Black J, Sivakumar V, Madhav M, McCabe B (2006) An improved experimental test set-up to study the performance
of granular columns. Geotech Test J 29(3):193–199. https ://doi.org/10.1520/GTJ14 195 9. Bouckovalas G, Giannaros C (2000) An experimental study on model stone columns. Soils Found 40(6):11–22. https
://doi.org/10.3208/sandf .40.6_11 10. Dash SK, Bora MC (2013) Influence of geosynthetic encasement on the performance of stone columns floating in
soft clay. Can Geotech J 50(7):754–765 11. Fattah MY, Al-Neami MA, Al-Suhaily AS (2017) Estimation of bearing capacity of a floating group of stone columns.
Eng Sci Technol Int J 20(3):1166–1172. https ://doi.org/10.1016/j.jestc h.2017.03.005 12. Gustaf Z, Bouassida M, Debats J (2007) Improved soft clay characteristics due to stone column installation. Comput
Geotech 34(2):104–111. https ://doi.org/10.1016/j.compg eo.2006.09.008 13. Juran I, Guermazi A (1988) Settlement response of soft soils reinforced by compacted sand columns. J Geotech Eng
114(8):930–943. https ://doi.org/10.1061/(ASCE)0733-9410(1988)114:8(930) 14. Juran I, Riccobono O (1991) Reinforcing soft soils with artificially cemented compacted-sand columns. J Geotech
Eng 117(7):1042–1060. https ://doi.org/10.1061/(ASCE)0733-9410(1991)117:7(1042) 15. Kadhim ST, Fouad ZB (2018) Stability analysis of roadway embankments supported by stone columns with the pres-
ence of water table under short-term and long-term conditions. In: MATEC web of conferences. Vol. 162, p 01013. EDP Sciences. https ://doi.org/10.1051/matec conf/20181 62010 13
16. Killeen MM, McCabe BA (2014) Settlement performance of pad footings on soft clay supported by stone columns: a numerical study. Soils Found 54(4):760–776. https ://doi.org/10.1016/j.sandf .2014.06.011
17. Meshkinghalam H, Hajialilue-Bonab M, Azar AK (2017) Numerical investigation of stone columns system for lique-faction and settlement diminution potential. Int J Geo-Eng 8(1):11. https ://doi.org/10.1186/s4070 3-017-0047-x
18. Mitchell JK, Huber TR (1985) Performance of a stone column foundation. J Geotech Eng 111(2):205–223. https ://doi.org/10.1061/(ASCE)0733-9410(1985)111:2(205)
19. Muir Wood D, Hu W, Nash D (2000) Group effects in stone column foundations: model tests. Geotechnique 50(6):689–698. https ://doi.org/10.1680/geot.2000.50.6.689
20. Murugesan S, Rajagopal K (2006) Geosynthetic-encased stone columns: a numerical evaluation. Geotext Geomembr 24(6):349–358. https ://doi.org/10.1016/j.geote xmem.2006.05.001
21. Najjar SS, Sadek S, Maakaroun T (2010) Effect of sand columns on the undrained load response of soft clays. J Geo-tech Geoenviron Eng 136(9):1263–1277. https ://doi.org/10.1061/(ASCE)GT.1943-5606.00003 28
22. Ng K (2018) Numerical study on bearing capacity of the single stone column. Int J Geo-Eng 9(1):9. https ://doi.org/10.1186/s4070 3-018-0077-z
23. Poorooshasb H, Meyerhof G (1997) Analysis of the behavior of stone columns and lime columns. Comput Geotech 20(1):47–70. https ://doi.org/10.1016/S0266 -352X(96)00013 -4
24. Sexton B, McCabe B (2013) Numerical modeling of the improvements to primary and creep settlements offered by granular columns. Acta Geotech 8(4):447–464. https ://doi.org/10.1007/s1144 0-012-0205-4
25. Sivakumar V, McKelvey D, Graham J, Hughes D (2004) Triaxial tests on model sand columns in clay. Can Geotech J 41(2):299–312. https ://doi.org/10.1139/t03-097
26. Tan SA, Tjahyono S, Oo KK (2008) Simplified plane-strain modeling of the stone-column reinforced ground. J Geo-tech Geoenviron Eng 134(2):185–194. https ://doi.org/10.1061/(ASCE)1090-0241(2008)134:2(185)
Publisher’s NoteSpringer Nature remains neutral with regard to jurisdictional claims in published maps and institutional affiliations.