Embed Size (px)
Citation preview

www.jgeosci.org
Journal of Geosciences, 65 (2020), 15–25 DOI: 10.3190/jgeosci.297
Original paper
Crystal structure of the uranyl–molybdate mineral calcurmolite Ca[(UO2)3(MoO4)2(OH)4](H2O)~5.0: insights from a precession electron-diffraction tomography study
Gwladys STECIUK1*, Radek ŠKODA2, Jan ROHLÍČEK1, Jakub PLÁŠIL1
1 Institute of Physics, Academy of Sciences of the Czech Republic v.v.i, Na Slovance 2, 182 21 Prague 8, Czech Republic; [email protected] Department of Geological Sciences, Masaryk University, Kotlářská 2, 611 37 Brno, Czech Republic* Corresponding author
Calcurmolite is a rare supergene U mineral formed during the alteration–hydration weathering of uraninite and hypo-gene Mo minerals; its structure has remained unsolved owing to a lack of crystal material suitable for conventional structure analysis. Here, single-crystal precession electron-diffraction tomography shows the calcurmolite (Rabejac, France) structure to be modulated; it is triclinic, crystallizing in the super-space group P1(α00)0, with a = 3.938 Å, b = 11.26 Å, c = 14.195 Å, α = 84.4°, β = 112.5°, γ = 133.95° and has a modulation vector q = 0.4 a*. Due to the poor quality of diffraction data, only a kinematical refinement was undertaken, although final results were reasonable: Robs/Rall = 0.3825/0.3834 for 3953/17442 observed/all reflections. The structure of calcurmolite is based upon the infinite uranyl–molybdate sheets with baumoite topology (U : Mo ratio = 1.5) and an interlayer of 6-coordinated Ca2+ cations with interstitial H2O (ligands are apical uranyl O atoms and molecular H2O). Adjacent sheets are linked via Ca–O, as well as H-bonds. The structure formula, based on assumed occupancies in the supercell 5a × b × c, is Ca[(UO2)3 (MoO4)2(OH)4](H2O)~5.0 (for Z = 4).
Keywords: calcurmolite, uranyl–molybdate, crystal structure, modulation, baumoite topology, precession electron diffractionReceived: 18 November 2019; accepted: 5 March 2020; handling editor: F. LaufekThe online version of this article (doi: 10.3190/jgeosci.297) contains supplementary electronic material
powder X-ray diffraction for samples from Kazakhstan and Armenia. They demonstrated that calcurmolite forms fine intergrowths with uranophane and uranocircite, which makes its detailed study difficult. On the basis of IR spectra, Sidorenko et al. (2005) concluded that, simi-lar to umohoite, iriginite and mourite, calcurmolite does not contain (MoO4)2– tetrahedral oxyanions, but Mo6+ appears in octahedral coordination. This conclusion was confirmed by Frost et al. (2008) by Raman spectroscopy studies of calcurmolite. Calcurmolite minerals of differ-ent origins were already reported as poorly crystallized phases by Deliens (1992) and Dal Bo (2018). Up to now, reliable structure data were lacking for this mineral and the chemical formula represented only an uncertain estimate.
Here we report the crystal structure of calcurmolite for the first time based on a precession electron-diffraction tomography study carried out on a calcurmolite sample from the Lodève Basin in France. This method is a good alternative to single-crystal X-ray diffraction for samples like calcurmolite made of small crystals (c. 1–5 μm). Moreover, despite the generally poor crystallization abil-ity of the mineral, small parts of crystals giving satisfying diffraction signal were found at the nanoscale allowing a structural determination.
1. Introduction
Uranyl–molybdates are uncommon alteration products that result from the weathering of uraninite UO2+x, as-sociated with some hypogene molybdenum-containing minerals, such as molybdenite MoS2, or its Fe-rich va-riety, called ‘femolite’ (Mo,Fe)S2. The latter femolite is less stable under oxidizing conditions (Krivovichev and Plášil 2013). Currently, only nine uranyl–molybdates are known from oxidized parts of uranium deposits world-wide; nevertheless, their crystal chemistry is particularly interesting as it diverges from other known U6+-contain-ing compounds (Burns 2005). The family of synthetic molybdates is considerably broad (e.g. Krivovichev and Burns 2000a, b, 2001a, b, 2002a, b, c, d; Krivovichev et al. 2002); it may be speculated that some of these will be discovered in nature.
Originally, calcurmolite was described by Rudnitskaya (1959) as a new mineral from the Kadjaran ore field, the Kafan region, Armenia, under the name ‘kadjaranite’. Later on, it was found by Fedorov (1963) and Skvortsova et al. (1969) in Kazakhstan at U–Mo deposits, and then reported by Deliens (1992) from Rabejac, France. Sido-renko et al. (2005) presented new chemical data from electron microprobe, infrared (IR) spectroscopy and

Gwladys Steciuk, Radek Škoda, Jan Rohlíček, Jakub Plášil
16
2. Occurrence
The specimen of calcurmolite investigated here originates from the Rabejac deposit in the Lodève Basin, located in the southern part of Massif Central, France. More detailed information about the locality, and its mineral-ogy and geology, can be found in Dal Bo (2018). Calc-urmolite is present as bright yellow nodules resembling mimosa flowers constituted by a radial aggregation of tiny prismatic crystals with a section of 1–5 µm (Fig. 1). In the studied sample, calcurmolite is associated with reddish-brown umohoite and pale yellow uranophane-β. The sample matrix consists of a fine-grained sandstone with the uranyl minerals mentioned above being scattered on the surface.
3. Chemical composition
The chemical composition of calcurmolite was de-termined using a Cameca SX 100 electron micro-probe operated in WDS mode. An operating voltage of 15 kV, beam current of 10 nA and a 10 μm beam diameter and the following X-ray lines and standards were used: Kα lines: Na (albite), K (orthoclase), Ca (andradite), Al (gahnite), V (vanadinite), Fe (alman-dine); Lα lines: Mo (metallic Mo), As (lammerite); Mα lines: Pb (vanadinite); Mβ lines: U (UO2). Other elements were sought but not detected. Peak count-ing times were 10–20 s and the counting time for the background was 50 % of that of the peak. Matrix effects were accounted for using the PAP correction routine (Pouchou and Pichoir 1985). Because of the paucity of pure material required for direct H2O de-
termination, molecular H2O was calculated based on stoichiometric constrains. Chemical microanalysis re-vealed the rather homogeneous nature of the specimen. The empirical formula, calculated as the mean of 13 representative points (Tab. 1), is (K0.005Na0.005)Σ0.01Ca0.16 [(UO2)0.6O1.6Mo0.395(OH)0.80](H2O)~1.0 based on 0.6 U apfu; stoichiometry derived from the modulated structure with Z = 4. In the 5a × b × c supercell, the composition becomes (K0.025Na0.025)Σ0.05Ca0.8[(UO2)3O8Mo1.975(OH)4](H2O)~5.0 for Z = 4. The ideal chemical formula in the supercell is Ca[(UO2)3(MoO4)2(OH)4](H2O)~5.
4. Structure determination
4.1. Powder X-ray diffraction (PXRD)
For the collection of powder X-ray diffraction data, the sample was ground and placed to the 0.3 mm borosilicate-glass capillary. Powder diffraction data were collected in Debye–Scherrer transmission at
Fig. 1 Calcurmolite specimen. Yellow calcurmolite with orange to reddish--orange umohoite on alteration crust from Rabejac, France. Horizontal width of the picture is 3 mm (photo S. Wolfs-ried).
Tab. 1 Chemical composition of calcurmolite from WDS (in wt. % oxides)
Mean (n = 13) Range SDCaO 3.49 3.37–3.63 0.08Na2O 0.04 0.00–0.12 0.05K2O 0.13 0.00–0.26 0.09MoO3 22.17 21.10–23.11 0.57UO3 67.18 64.48–68.13 0.90H2O (calc.) 9.94*Total 102.50* calculated from the structureSD – standard deviation

Crystal structure of calcurmolite
17
150 K on a Empyrean of PANalytical (λ (CuKα) = 1.54184 Å) powder diffractometer, equipped with the focusing mirror, capillary holder and PIXcel3D detec-tor. The most characteristic calcurmolite peaks are found for interplanar distances of 9.115, 8.03, 7.746, 4.01, and 3.876 Å (Fig. 2). The powder X-ray diffrac-tion pattern shows a lot of similarities with previous study of calcurmolite from Rabejac (Deliens 1992) and from Kazakhstan and Armenia (Sidorenko et al. 2005), but cannot be considered as being identical. The strongest similarities are found with the second sample from Kazakhstan (Sidorenko et al. 2005) where all the characteristic peaks mentioned above are present with comparable relative intensities. This observation is surprising as the composition of calcurmolite from Rabejac in this study is closer to other sample of the same origin (Deliens 1992) than calcurmolite from Kazakhstan (Sidorenko et al. 2005).
The X-ray powder pattern did not provide any fur-ther, useful structural information due to the poorly crystalline nature of calcurmolite as well as the pres-ence of significant quantities of uranophane-β. Though, the powder X-ray diffraction data were used to refine the unit cell parameters determined by electron dif-fraction (see later) and to validate that the crystals measured at the nanoscale were representative of the mineral.
4.2. Precession electron-diffraction tomography (PEDT)
As the low crystallinity and the size of calcurmolite crystals prevented single-crystal X-ray structure stud-ies (all performed attempts failed), structure data were obtained from electron-diffraction and collected with a FEI Tecnai 20 transmission-electron microscope (TEM, acceleration voltage of 200 kV, LaB6) using a Gatan cryo-transfer holder. For TEM investigations, a small portion of calcurmolite crystals was mildly crushed without solvent and deposited on a Cu-grid with a thin film of holey amorphous carbon. The grid was plunged into liquid nitrogen and then transferred to the TEM. Precession electron-diffraction tomography (PEDT) data sets of non-oriented patterns were collected at 100 K on several crystals (eight data sets) with the preces-sion device Nanomegas Digistar and a side-mounted CCD camera Olympus Veleta with 14-bit dynamic range (Fig. 3a). The precession angle was set to 1° and a tilt step to 1° as well. A condenser aperture of 10 mm and a low illumination setting (spot size 8) were used to reduce the electron dose.
The PEDT data sets were analysed using programs PETS2.0 (Palatinus et al. 2019) and Jana2006 (Petříček et al. 2014). Albeit the crystals were poorly crystalized, at the nanoscale, a few better-crystallized areas of crystals
►
10.0 15.0 20.0 25.0 30.0 35.02th
5000
10000
15000
0.0
Intensity
Delta(I)
►
calcurmolite►►uranophane-β
0101
0100
0101
1103
1111
0040
[
0202
d≈9.
115
Åd≈
8.03
5Å
d≈7.
746
Å
d≈4.
011
Åd≈
3876
Å
Fig. 2 Le Bail fit of the powder X-ray diffraction data of calcurmolite (P1(α00)0) indicating the presence of uranophane-β. The black and green sticks indicate the main and the first-order satellite reflections of calcurmolite, respectively. Rp = 0.0158, wRp= 0.0209 and Goodness of fit, GOF = 0.0139. The most characteristic interplanar distances reported in the literature are indicated above the diagram.

Gwladys Steciuk, Radek Škoda, Jan Rohlíček, Jakub Plášil
18
were discovered making structural analysis possible by combining the two best data sets (Tab. 2). Only two of the eight measured data sets were used in the structural analysis because of limitations present in PEDT data. First, despite that the ordering along a* is well visible on h0lm, as soon as the crystal was rotated during the PEDT experiments, diffuse scattering appeared along the stacking direction b* (Figs 3b and 4b) and the resolution was significantly lowered. Moreover, because of the preferred orientation of needle-like crystals on the flat grid (Fig. 3a), the data completeness is limited to 76 % for a sin θ/λ = 0.7 Å–1 resolution. Combining more data sets (four were of acceptable quality) did not improve the data completeness and drastically increased the Rint value.
The reciprocal space was first indexed using the su-perspace formalism in a standard triclinic unit cell: a = 3.938 Å, b = 8.15 Å, c = 13.14 Å, α = 104.7°, β = 96.4°,
γ ≈ 90°, V = 409.7 Å3 and a modulation vector q = 0.4 a* + 0.8 b* + 0.4c* with satellite reflections up to 2nd order (Fig. 4a). In Fig. 4a the reciprocal space is projected into one unit cell to show that, despite the presence of diffuse features and the signal coming from other orientations, most of the reflections are indexed. However, because the completeness is low and the structure needs to be manu-ally interpreted layer by layer, a non-standard choice was preferred with the following parameters: a = 3.938 Å, b = 11.26 Å, c = 14.195 Å, α = 84.4°, β = 112.5°, γ = 133.95° and a modulation vector q = 0.4 a* with satel-lite reflections up to 2nd order (V = 409.72 Å3) (Fig. 4a). With these settings the layers can be represented in the supercell 5a × b × c in (a, c) planes, the modulation oc-curs along a* and the layers are stacked following the b-axis. Based on few peaks from PXRD patterns, Dal Bo (2018), Deliens (1992) and Sidorenko et al. (2005) sug-
Fig. 3a – Needle-like calcurmolite crystals. The red circles represent the area selected for the PEDT experiments. b – For one data set the resolu-tion rings are represented at high rotation angles of the goniometer (–51 and +56 deg) and for the preferential orientation (0 degree rotation). The resolution of g = 1.4 Å–1 corresponds to the maximum diffraction vector used by default in the data reduction.

Crystal structure of calcurmolite
19
gen sites (Oa1, Oa2, Ob1 and Ob2) functions as well as the O3 and O4 atoms located within the U–Mo plane are defined without modulation due to lack of information from the data. The additional oxygen sites O5a, O5b, O5c and O5d of the U–Mo plane are described using crenel functions. The position of the atomic sites de-scribed with crenel functions as a function of t is shown in Fig. 6 in the final superspace group P1(α00)0. The ratio Mo/(U + Mo) = 2/5 corresponding directly to the α component of the modulation vector shows that the origin of the modulation is explained by the ordering of uranium and molybdenum along a*. The refinement of the initial model was performed in the SSG P1(α00)0 using the kinematical approximation against PEDT data in order to reveal the topology of the Ca–O layer. In the case of calcurmolite, the poor quality of the data as well as the large number of refined parameters prevented the use of the dynamical refinement (Palatinus et al. 2015a, b). Indeed, the presence of disorder reduces the dynam-ics effects and hence makes refinement using the kine-matical approximation relevant. Distance restrictions were applied to maintain the polyhedra of the U–Mo layer. The calcium-based layer was revealed from the difference–Fourier map, with two Ca sites in the 6- and 7-coordination, and four anion sites (occupied by mo-lecular water) (Fig. 7). The occupancies of the Ca sites
gested that calcurmolite could be indexed in a monoclinic or pseudo-orthorhombic unit cell. From PEDT single-crystal data, only triclinic unit cells are found. The intensity integration was performed using the new options available in PETS2.0 using the non-standard settings. The experimental intensity pro-file (rocking curve) is fitted us-ing several parameters including the rocking curve width (RC width = 0.017 Å–1) and the ap-parent mosaicity (mosaicity = 0.25°) (for detailed information, see Palatinus et al. 2019). The values of the apparent mosaicity and RC width are very high for calcurmolite data because of the presence of the disorder features along b* and the high mosa-icity of the crystals (for well crystallized crystals measured with the same microscope: RC width ≤ 0.003 Å–1 and mosaicity ≤ 0.05°).
The structure was solved us-ing the charge-flipping algorithm (Palatinus and Chapuis 2007) in the superspace group (SSG) P–1(α00)0 and later refined in the SSG P1(α00)0. Because of all the limitations presented previously, the structure solu-tion did not arise directly from the charge-flipping algorithm; the initial result, a 3D electrostatic poten-tial map (e-map) represented as isosurfaces, had to be interpreted manually (Fig. 5). The e-map shows a structure resulting from the alternation of two different layers: the first having strong electrostatic potentials attributed to a uranium–molybdenum layer: the second containing calcium and H2O that is not resolved enough to be interpreted directly from the e-map (Fig. 5a). In the U–Mo layer (Fig. 5b), by lowering the isosurfaces level of the potential map to 1σ[ΔV(r)], the visible oxygen positions define two possible coordination polyhedra around the cations: an octahedral coordina-tion and a pentagonal bipyramid coordination. These are characteristic of Mo6+(Mo5+) and U6+ environments, respectively (Fig. 5b). Following these observations, in the modulated description (SSG P–1(α00)0), Mo and U share the same two cationic sites and their ordering is described using a discontinuous crenel-like modulation function with Δ (U1,2) = 0.6 and Δ (Mo1,2) = 0.4, the width of the crenels (crenel-like; Petříček et al. 2016) associated with one harmonic function. The apical oxy-
Tab. 2 Summary of data collection conditions and refinement parameters for calcurmolite
Structural formula in the modulated cell Ca0.2[(UO2)0.6O1.6Mo0.4(OH)0.8](H2O)~1.0
Structural formula in the supercell* Ca1[(UO2)3O8Mo2(OH)4](H2O)~5.0
Unit-cell parameters (PEDT)At 100 K
a = 3.938 Å, b = 11.26 Å, c = 14.195 Å, α = 84.4°, β = 112.5°, γ = 133.95°, q = 0.4 a*
Unit-cell parameters (PXRD)At 150 K
a = 3.927(2) Å, b = 11.500(4) Å, c = 14.175(2) Å, α = 85.20(2)°, β = 111.70(2)°, γ = 134.05(2)°, q = 0.4 a*
V (100K) 409.7(2) Å3
Z 4Density [g.cm–3] (from PEDT) 4.2124Space group P1(α00)0Temperature 100 KTransmission electron microscope FEI Tecnai 02Radiation (wavelength) electrons, (0.0251 Å)Resolution 0.1–0.7 Å–1
Limiting Miller indices –6 < h < 6, –15 < k < 15, –19 < l <19, –2 < m < 2
No. of independent reflections (obs/all) – kinematic
all : 3953/17442main : 1343/3501order 1 : 1736/6943order 2 : 874/6998
Coverage for sinθ/λ = 0.7 Å–1 76.06 %Rint (obs/all) – kinematic 0.2374/0.3901Redundancy 1.715
R, wR (obs) (kinematical)
all : 0.3825/0.3834main : 0.3313/0.3445order 1 : 0.3887/0.4136order 2 : 0.5441/0.6170
N refined parameters 100*5a × b × c supercell

Gwladys Steciuk, Radek Škoda, Jan Rohlíček, Jakub Plášil
20
Fig. 4a – Projection of the reciprocal space into one modulated unit cell and two orders of satellite reflections for the standard settings and the settings used in this work. b – Two reciprocal space sections showing the ordering along the a axis on h0lm and the low resolution together with the disorder along the stacking direction b* visible on hk0m.
Fig. 5a – Isosurfaces of the 3D electrostatic potential map (e-map) extended along the stacking direction. Isosurface levels are 2σ[ΔV(r)]. b – [010]* e-map projection of the layer (1σ[ΔV(r)]) containing uranium, molybdenum and oxygen with its interpretation. The layer model is represented in the supercell 5a × c. c – Coordination polyhedra of U6+ and Mo6+.
Crystal structure of calcurmolite
21
were set according to the result of the chemical analysis in order to maintain the U : Mo : Ca ratio of 3 : 2 : 1. No modulation was applied to the atoms of the Ca–O layer as the refinement of this layer is not sensitive from our data. From the first refinement an insight of the cal-cium–water layer topology was revealed from the differ-ence–Fourier map but it cannot be refined or described with accuracy. The final refinement leads to Robs/Rall = 0.3825/0.3834 for 3953/17442 observed/all reflections (see Tab. 2). These values can be considered reasonable for the kinematical refinement of a modulated structure from electron-diffraction data (Boullay et al. 2013; Palatinus et al. 2015b; Steciuk et al. 2016). The refined structure is displayed on the Fig. 8. The results of the refinement are given in the Tab. 2 and the cation–oxy-gen distances, as a function of t, are presented in Fig. 9. The average bond valences for uranium are BV(U1_1) = 6.146(5), BV(U1_2) = 6.404(8), BV(U2_1) = 6.196(7) and BV(U2_2) = 6.011(6) vu.
5. Description of the structure
The structure of calcurmolite contains four symmetri-cally-distinct U sites, four Mo sites, two Ca sites and 24 O sites. In the structure of calcurmolite, all U is found to be hexavalent, occurring in pentagonal bipyramidal coordination with two strong U≡O bonds, (i.e. forming uranyl ion (UO2)2+) and five weaker bonds distributed in the equatorial plane (Figs 5b and 8; Tab. 3). The four symmetrically-distinct Mo sites are [6]-coordinated in the form of irregular, distorted octahedra (Fig. 5b and 8). The Mo1_1 and Mo1_2 (and Mo2_1 with Mo2_2) polyhedra share a common edge to form Mo2φ10 dimers. The calcur-molite structure is based upon uranyl–molybdate sheets. The fundamental building blocks of those sheets are two trimers (I and II) of edge-sharing polyhedral composed
respectively by two U1_1 and one U1_2 polyhedra (tri-mer I) and two U2_1 and one U2_2 polyhedra (trimer II) (Fig. 8). They form the six-membered clusters by sharing a common edge with other trimer (Fig. 8). These clusters are connected through the O5c (O5c_1 and O5c_2) equa-torial atom of the U bipyramid to form irregular chains propagated along [–101]. These chains of polyhedra are connected through Mo2φ10 dimers in a stair-case way. Sheets found in the structure of calcurmolite are of the same topology as observed in the structure of baumoite (Elliot et al. 2019).
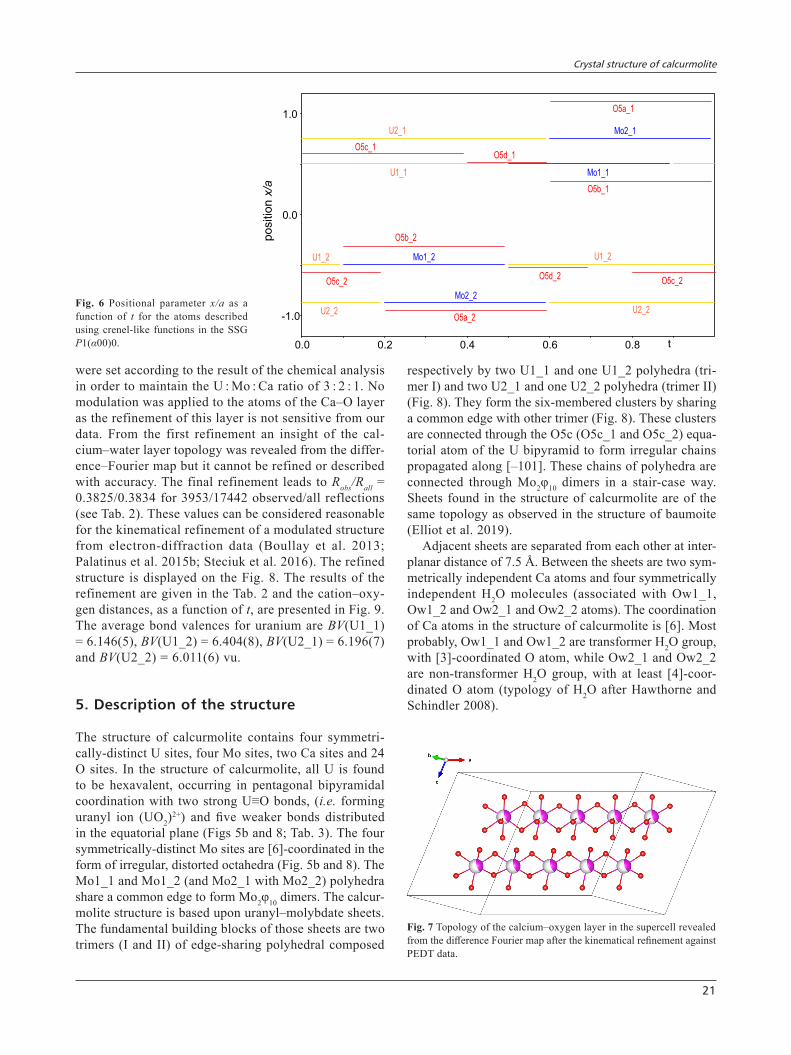
Adjacent sheets are separated from each other at inter-planar distance of 7.5 Å. Between the sheets are two sym-metrically independent Ca atoms and four symmetrically independent H2O molecules (associated with Ow1_1, Ow1_2 and Ow2_1 and Ow2_2 atoms). The coordination of Ca atoms in the structure of calcurmolite is [6]. Most probably, Ow1_1 and Ow1_2 are transformer H2O group, with [3]-coordinated O atom, while Ow2_1 and Ow2_2 are non-transformer H2O group, with at least [4]-coor-dinated O atom (typology of H2O after Hawthorne and Schindler 2008).
Fig. 6 Positional parameter x/a as a function of t for the atoms described using crenel-like functions in the SSG P1(α00)0.
Fig. 7 Topology of the calcium–oxygen layer in the supercell revealed from the difference Fourier map after the kinematical refinement against PEDT data.

Gwladys Steciuk, Radek Škoda, Jan Rohlíček, Jakub Plášil
22
The structure formula based on assumed occupancies is Ca0.2[(UO2)0.6(MoO4)0.4(OH)0.8](H2O)~1.0, Z = 4 in the modulated unit cell. In the supercell 5a × b × c giving a complete overview of the topology, the formula be-comes Ca[(UO2)3(MoO4)2(OH)4](H2O)~5.0. In his paper, Deliens (1992) defines calcurmolite more like a group of minerals having in common the presence of calcium, molybdenum, uranium and water. This assumption is explained by the discrepancies of the observed physical properties and variation in the powder X-ray diffraction patterns. The same diversity is found in the chemical formula reported by different studies (Rudnitskaya 1959; Fedorov 1963; Skvortsova et al. 1969; Deliens 1992; Sidorenko et al. 2005 and Dal Bo 2018). In the present work, the chemical formula is similar to the one reported by Dal Bo (2018) for calcurmolite from Rabejac Ca(UO2)3(MoO4)2(OH)4(H2O)8. The difference in the water content can be due to the inaccuracy of the measurement in our study. Nevertheless, a variation in the amount of water or calcium seems highly possible considering the topology of the calcium–water layer and the disorder, especially along the stacking direc-
tion, observed in the diffraction data. It can probably occur without disturbing the topology of the uranium molybdenum layer and might be an explanation for the differences in the powder X-ray patterns reported in the literature.
6. Conclusions
The structure of calcurmolite can be considered com-plex regarding the topology and due to presence of commensurate/incommensurate modulations. The qual-ity of the current data set does not allow differentiation between commensurate or incommensurate modulation but gives an insight of the structure for the first time. Although, the necessity of using the crenel-like (dis-continuous) modulation functions indicates that the structure is close to be incommensurately modulated. Calcurmolite is similar to the Ba uranyl–molybdate baumoite, which was shown to be incommensurately modulated, having the same structural sheets, with U : Mo ratio equal to 3 : 2.
Fig. 8 Topology of the U–Mo layer and representation of the complete structure in the supercell 5a × b × c.

Crystal structure of calcurmolite
23
Acknowledgements. Stephan Wolfsried is thanked for the microphotography of the calcurmolite specimen. This manuscript benefited from the construction reviews of two referees including Aaron Lussier as well as from the comments of the handling editor František Laufek. This research was supported by the project No. LO1603 under the Ministry of Education, Youth and Sports National sustainability program I of Czech Republic to JP and GS, and OPVV project (CZ.02.1.01/0.0/0.0/16_026/0008459) to RS. This work was also supported by Operational Pro-gramme Research, Development and Education financed
by European Structural and Investment Funds and the Czech Ministry of Education, Youth and Sports (Project No. SOLID21 CZ.02.1.01/0.0/0.0/16_019/0000760), using instruments of the ASTRA laboratory established within the Operation program Prague Competitiveness – project CZ.2.16/3.1.00/24510.
Electronic supplementary material. Supplementary origi-nal crystallographic information file (cif) for calcurmolite is available online at the Journal web site (http://dx.doi.org/10.3190/jgeosci.297).
Tab. 3 Positional parameters for calcurmolite (SSG P1(α00)0)atom harm. x/a y/b z/c Uiso [Å2] Delta/Occ. Delta x40
U1_1 0.5062 0.9549 0.3733 0.0164(4) 0.6 0.4Mo1_1 – – – 0.0164(4) 0.4 0.9
s,1 0 0 –0.0158(5)c,1 0 0 0.0171(5)
U1_2 –0.4966(16) –0.9602(5) –0.3912(3) 0.0164(4) 0.6 0.5989(6)Mo1_2 – – – 0.0164(4) 0.4 0.0989(9)
s,1 0 0 –0.0087(4)c,1 0 0 0.0059(5)
U2_1 0.7517(19) 0.9404(6) 0.0800(4) 0.0164(4) 0.6 0.5982(8)Mo2_1 – – – 0.0164(4) 0.4 1.0982(11)
s,1 0 0 –0.0209(5)c,1 0 0 –0.0296(5)
U2_2 –0.8693(17) –0.9754(6) –0.1270(3) 0.0164(4) 0.6 0.5498(11)Mo2_2 – – – 0.0164(4) 0.4 –0.280(2)
s,1 0 0 0.0078(4)c,1 0 0 0.0022(5)
O5a_1 1.123(3) 0.9597(5) 0.2324(5) 0.075(3) 0.4 1.2467(16)O5a_2 –0.948(4) –0.93(1) –0.2544(5) 0.075(3) 0.4 0.018(2)O5b_1 0.330(3) 0.9182(5) 0.2265(5) 0.075(3) 0.4 0.9296(12)O5b_2 –0.317(3) –0.9383(5) –0.2609(6) 0.075(3) 0.4 0.1708(15)O5c_1 0.602(3) 0.8865(5) 0.2231(6) 0.075(3) 0.4 0.4383(15)O5c_2 –0.573(3) –0.9107(5) –0.2438(6) 0.075(3) 0.4 0.7681(17)O5d_1 0.515(3) 0.9107(5) 0.2291(6) 0.075(3) 0.2 0.7037(13)O5d_2 –0.527(3) –0.9321(5) –0.2616(6) 0.075(3) 0.2 0.3868(16)
Occ.O1a_1 0.006(2) 0.2122(6) 0.374(2) 0.075(3) 1O1a_2 –0.032 (1) –0.2034(6) –0.422(2) 0.075(3) 1O1b_1 –0.002(1) 0.7229(7) 0.369(2) 0.075(3) 1O1b_2 0.026(1) –0.7229(6) –0.369(2) 0.075(3) 1O2a_1 0.266(1) 1.1917(7) 0.123(2) 0.075(3) 1O2a_2 –0.402(1) –1.2084(7) –0.198(2) 0.075(3) 1O2b_1 0.291(3) 0.6972(6) 0.056(2) 0.075(3) 1O2b_2 –0.343(1) –0.7486(6) –0.044(2) 0.075(3) 1O3_1 0.2167(13) 0.0220(3) 0.4328(5) 0.075(3) 1O3_2 –0.1301(18) 0.0119(3) –0.4443(5) 0.075(3) 1O4_1 0.1171(17) 0.8914(3) 0.0179(5) 0.075(3) 1O4_2 –0.293(2) –1.0016(3) –0.0730(4) 0.075(3) 1Ca1_1 0.313(8) 0.351(2) 0.2608(14) 0.104(1) 0.4Ca1_2 –0.354(7) –0.409(2) –0.3018(15) 0.104(1) 0.4Ow1_1 –0.608(10) 0.480(3) 0.1181(19) 0.104(1) 1Ow1_2 0.551(16) –0.505(4) –0.1415(18) 0.104(1) 1Ow2_1 0.192(9) 0.463(3) 0.3852(18) 0.104(1) 1Ow2_2 –0.136(8) –0.479(3) –0.4143(16) 0.104(1) 1

Gwladys Steciuk, Radek Škoda, Jan Rohlíček, Jakub Plášil
24
References
Boullay P, Palatinus L, Barrier N (2013) Precession Electron Diffraction Tomography for solving complex modulated structures: the case of Bi5Nb3O15. Inorg Chem 52: 6127−6135
Burns PC (2005) U6+ minerals and inorganic compounds: insights into an expanded structural hierarchy of crystal structures. Canad Mineral 43: 1839–1894
Dal Bo F, Hatert F, Philippo S (2018) Supergene uranyl mineralization of the Rabejac Deposit, Lodève, France. Minerals 8: 414
Deliens M (1992) Etude comparative des calcurmolites de Rabejac (Lodève, Herault, France) et de l’Union Soviet-ique. Ann Soc Geol Belg 115: 91–97
Elliot P, Plášil J, Petříček V, Čejka J, Bindi L (2019) Twinning and incommensurate modulation in baumoite,
Ba0.5[(UO2)3O8Mo2(OH)3](H2O)~3, the first natural Ba uranyl molybdate. Mineral Mag 83: 507–514
Fedorov OV (1963) Second find of calcium uranium mo-lybdate in the USSR. Zap Vsesojuz mineral Obshch 92: 464–465 (in Russian)
Frost RL, Čejka J, Dickfos MJ (2008) Raman and infrared spectroscopic study of the molybdate-containing uranyl mineral calcurmolite. J Raman Spectrosc 39: 779–785
Hawthorne FC, Schindler M (2008) Understanding the weakly bonded constituents in oxysalt minerals. Z Kristallogr 223: 41–68
Krivovichev SV, Burns PC (2000a) Crystal chemistry of uranyl molybdates. I. The structure and formula of umohoite. Canad Mineral 38: 717–726
Krivovichev SV, Burns PC (2000b) Crystal chemistry of uranyl molybdates. II. The structure and formula of iriginite. Canad Mineral 38: 847–851
Fig. 9 The cations–oxygen distances (in Å) in the structure of calcurmolite.

Crystal structure of calcurmolite
25
Krivovichev SV, Burns PC (2001a) Crystal chemistry of uranyl molybdates. III. New structural themes in the structures of Na6[(UO2)2O(MoO4)4], Na6[(UO2)(MoO4)4] and K6[(UO2)2O(MoO4)4]. Canad Mineral 39: 197–206
Krivovichev SV, Burns PC (2001b) Crystal chemis-try of uranyl molybdates. IV. Crystal structures of M2[(UO2)6(MoO4)7(H2O)2], M = Cs, NH4. Canad Mineral 39: 207–214
Krivovichev SV, Burns PC (2002a) Crystal chemistry of ru-bidium uranyl molybdates: crystal structures of Rb6(UO2)(MoO4)4, Rb6(UO2)2O(MoO4)4, Rb2(UO2)(MoO4)2, Rb2(UO2)2(MoO4)3 and Rb2(UO2)6(MoO4)7(H2O)2. J Solid State Chem 168: 245–258
Krivovichev SV, Burns PC (2002b) Crystal chemistry of uranyl molybdates. VI. New uranyl molybdate units in structures of Cs4[(UO2)3Mo3O14] and Cs6[(UO2)(MoO4)4]. Canad Mineral 40: 201–209
Krivovichev SV, Burns PC (2002c) Crystal chemistry of uranyl molybdates. VII. Iriginite-type polyhedral sheet in the structure of (UO2)Mo2O7(H2O)2. Canad Mineral 40: 1571–1577
Krivovichev SV, Burns PC (2002d) Synthesis and crys-tal structure of Ag6[(UO2)3O(MoO4)5]: a novel sheet of triuranyl clusters and MoO4 tetrahedra. Inorg Chem 41: 4108–4110
Krivovichev SV, Plášil J (2013) Mineralogy and crystal-lography of uranium. In: Burns PC, Sigmon GE (eds) Uranium: From Cradle to Grave. Mineralogical Associa-tion of Canada Short Courses 43: pp 15–119
Krivovichev SV, Finch R, Burns PC (2002) Crystal chemistry of uranyl molybdates V. Topologically differ-ent uranyl molybdate sheets in structures of Na2[(UO2)(MoO4)2] and K2[(UO2)(MoO4)2](H2O). Canad Mineral 40: 193–200
Palatinus L, Chapuis G (2007) SUPERFLIP – a computer program for the solution of crystal structures by charge flipping in arbitrary dimensions. J Appl Crystallogr 40: 786–790
Palatinus L, Petříček V, Corrêa CA (2015a) Structure refinement using precession electron diffraction tomo-graphy and dynamical diffraction: theory and implemen-tation. Acta Crystallogr A71: 235–244
Palatinus L, Corrêa CA, Steciuk G, Jacob D, Roussel P, Boullay P, Klementová M, Gemmi M, Kopeček J, Domeneghetti MCh, Cámara F, Petříček V (2015b) Structure refinement using precession electron diffraction tomography and dynamical diffraction: tests on experi-mental data. Acta Crystallogr B71: 740–751
Palatinus L, Brázda P, Jelínek M, Hrdá J, Steciuk G, Klementová M (2019) Specifics of the data processing of precession electron diffraction tomography data and their implementation in the program PETS2.0. Acta Crystallogr B75: 512–522
Petříček V, Dušek M, Palatinus L (2014) Crystallo-graphic computing system JANA2006: general features. Z Kristallogr 229: 345–352
Petříček V, Eigner V, Dušek M, Čejchan A (2016) Dis-continuous modulation functions and their application for analysis of modulated structures with the computing system JANA2006. Z Kristallogr 231: 301–312
Pouchou JL, Pichoir F (1985) “PAP” (φρZ) procedure for improved quantitative microanalysis. In: Armstrong JT (ed) Microbeam Analysis. San Francisco Press, San Francisco, pp 104–106
Rudnitskaya LS (1959) Calcium molybdate of uranium. Yadernoe Gor I Reak Met 3: 160–161
Sidorenko GA, Chistyakova NI, Chukanov NV, Nau-mova IS, Rassulov VA (2005) Calcurmolite: new data on chemical composition and constitution of the mineral. New Dat Min M 40: 29–36
Skvortsova KV, Kopchenova EV, Sidorenko GA, Kuznetsova NN, Dara AD, Rybakova LI (1969) Cal-cium–sodium uranomolybdates. Zap Vsesojuz mineral Obshch 98: 679–688 (in Russian)
Steciuk G, Boullay P, Pautrat A, Barrier N, Caignaert V, Palatinus L (2016) Unusual relaxor ferroelectric behavior in stairlike aurivillius phases. Inorg Chem 55: 8881–8891