Embed Size (px)
Citation preview
ORIGINAL ARTICLE
Sublethal salinity stress contributes to habitat limitation inan endangered estuarine fishLisa M. Komoroske,1,2,3 Ken M. Jeffries,1,2 Richard E. Connon,2 Jason Dexter,1
Matthias Hasenbein,1,2 Christine Verhille1 and Nann A. Fangue1
1 Department of Wildlife, Fish & Conservation Biology, University of California at Davis, Davis, CA, USA
2 Department of Anatomy, Physiology & Cell Biology, School of Veterinary Medicine, University of California at Davis, Davis, CA, USA
3 National Research Council under contract to Southwest Fisheries Science Center, National Marine Fisheries Service, National Oceanic and
Atmospheric Administration, La Jolla, CA, USA
Keywords
anadromous fish, climate change, delta smelt,
environmental stress, Hypomesus
transpacificus, osmoregulation, transcriptome.
Correspondence
Nann A. Fangue, Department of Wildlife, Fish
& Conservation Biology, One Shields Avenue,
University of California, Davis, CA 95616,
USA.
Tel.: +1 530 752 6586;
fax: +1 530 752 4154;
e-mail: [email protected]
Received: 11 October 2015
Accepted: 11 April 2016
doi:10.1111/eva.12385
Abstract
As global change alters multiple environmental conditions, predicting species’
responses can be challenging without understanding how each environmental
factor influences organismal performance. Approaches quantifying mechanistic
relationships can greatly complement correlative field data, strengthening our
abilities to forecast global change impacts. Substantial salinity increases are pro-
jected in the San Francisco Estuary, California, due to anthropogenic water diver-
sion and climatic changes, where the critically endangered delta smelt
(Hypomesus transpacificus) largely occurs in a low-salinity zone (LSZ), despite
their ability to tolerate a much broader salinity range. In this study, we combined
molecular and organismal measures to quantify the physiological mechanisms
and sublethal responses involved in coping with salinity changes. Delta smelt uti-
lize a suite of conserved molecular mechanisms to rapidly adjust their osmoregu-
latory physiology in response to salinity changes in estuarine environments.
However, these responses can be energetically expensive, and delta smelt body
condition was reduced at high salinities. Thus, acclimating to salinities outside
the LSZ could impose energetic costs that constrain delta smelt’s ability to exploit
these habitats. By integrating data across biological levels, we provide key insight
into the mechanistic relationships contributing to phenotypic plasticity and dis-
tribution limitations and advance the understanding of the molecular osmoregu-
latory responses in nonmodel estuarine fishes.
Introduction
Current and forecasted shifts in environmental conditions
due to human activities are changing the sources, strengths
and directions of selective pressures for organisms globally
(Rice and Emery 2003). Species responses can vary greatly,
including in situ adaptation and acclimatization (Palumbi
et al. 2014), extirpation or extinction (Parmesan and Yohe
2003), and range and phenology shifts (Menzel et al. 2006;
Pinsky et al. 2013). This myriad of responses is due in part
to the fact that the conditions under which a species per-
sists (sensu Hutchinson 1957) and exhibits optimal perfor-
mance (P€ortner and Farrell 2008; Kassahn et al. 2009)
may be strongly dominated by a single parameter, or a
combination of environmental and ecological factors
(e.g., physiological tolerances, predation pressure, resource
availability; Brown 1984; Guisan and Thuiller 2005; Hel-
muth et al. 2005). Thus, as anthropogenically driven global
change concurrently alters multiple environmental and
ecological conditions, predicting species’ responses can be
challenging without mechanistic understanding of how
individual factors and their interactions affect species of
interest. Integrative approaches that evaluate mechanistic
responses can greatly complement correlative field data to
quantify these relationships, strengthening our abilities to
forecast species and ecological effects of global change.
In aquatic ecosystems, the effects of salinity in the
context of global change have received less attention
relative to other environmental factors such as temperature
or carbonate chemistry. This has been in part due to
© 2016 The Authors. Evolutionary Applications published by John Wiley & Sons Ltd. This is an open access article under the terms of the Creative
Commons Attribution License, which permits use, distribution and reproduction in any medium, provided
the original work is properly cited.
963
Evolutionary Applications ISSN 1752-4571
inconsistency in the magnitude, direction, and variability
of projected salinity changes due to both regional and glo-
bal factors (IPCC 2013). While melting polar ice caps are
decreasing mean salinities in the pelagic ocean (van Wijk
and Rintoul 2014), sea-level rise and drought conditions
can raise salinities in coastal areas via flooding and seawater
invasion of aquifers coupled with reduced freshwater
inputs. Additionally, the increasing frequency and severity
of extreme events (e.g., tsunamis or hurricanes) and
storminess (Bromirski et al. 2003; Min et al. 2011) have
the potential to drive large-scale, rapid salinity fluctuations
in estuarine habitats (Najjar et al. 2009, 2010; Cloern et al.
2011). To add further complexity, many of these drivers
co-occur with other anthropogenic activities that affect
salinity. For example, in the San Francisco Estuary ecosys-
tem (SFE; California, USA), in addition to strong natural
tidal influences, salinity gradients are affected by both
direct (e.g., freshwater diversion and flow regulation; Lund
et al. 2010) and indirect anthropogenic activities (e.g., cli-
mate change induced heightened saltwater intrusion from
sea-level rise and reduced snowpack leading to diminished
freshwater flows; Cloern et al. 2011; Cloern and Jassby
2012). Despite these complexities, salinity is a key abiotic
factor limiting aquatic organisms (Nicol 1967), and there-
fore, it is critical to examine species’ responses to salinity
changes to understand biological impacts under different
global change scenarios.
Salinity poses challenges for aquatic organisms in large
part because intra- and intercellular solute and water bal-
ance can strongly impact biochemical processes and physi-
ological functions (Hochachka and Somero 2002). Unlike
many invertebrates and some primitive fishes that conform
to external salinities, teleost fishes osmoregulate to main-
tain an internal osmolality of approximately 300 mosmol
kg�1 (K€ultz 2015). This equates to isosomotic at roughly
9 ppt and strongly contrasts with external conditions in
freshwater (<0.5 ppt) and marine (~33–40 ppt) environ-
ments (IAL and IUBS 1958). Sustaining this relatively con-
stant internal state of ionic and osmotic equilibrium
facilitates proper cell function, normal biological processes,
and overall homeostasis, but requires adaptations to coun-
teract passive salt loss and water gain in freshwater habitats
or the converse in marine environments (Evans 2008a,b;
Bradley 2009). For example, gills play a major role in trans-
porting monovalent ions into or out of the body via mito-
chondrial rich cells (MRCs) and associated transport
enzymes (e.g., Na+/K+-ATPases), cotransporters (e.g., Na+/
K+/Cl� cotransporters, aquaporins), and other cellular
structures (McCormick et al. 2003; Evans et al. 2005; Mar-
shall and Grosell 2005; Hwang and Lee 2007).
Given the starkly opposing requirements for hyper- ver-
sus hyposmoregulation, it is perhaps unsurprising that the
majority of fishes possess physiological adaptations to
effectively osmoregulate in either static freshwater or
saltwater conditions, but have limited capacity to tolerate
salinity changes (termed stenohaline). However, some spe-
cies, such as estuarine fishes that have evolved in dynamic
ecosystems where salinity and other abiotic parameters
greatly fluctuate, exhibit abilities to cope with large envi-
ronmental salinity changes (termed euryhalinity; Marshall
2013; McCormick et al. 2013; Schultz and McCormick
2013). These organisms may utilize osmosensors to signal
and induce large-scale molecular cascades and cellular
remodeling to adjust or even completely switch physiologi-
cal strategies from hyper- to hyposmoregulation to restore
homeostasis under widely fluctuating environmental salini-
ties (Sardella et al. 2004; Fiol and K€ultz 2007; Evans and
Somero 2008; Evans 2010; Whitehead et al. 2011; K€ultz
2013). Although such capabilities might, on the surface,
suggest that salinity regime shifts due to global change will
not negatively impact euryhaline fishes already adapted to
dynamic salinity conditions, activation of the requisite
osmotic compensatory responses can exert high sublethal
costs (Kidder et al. 2006; Whitehead et al. 2012). Cellular
remodeling associated with salinity transitions in euryha-
line teleosts can include large-scale protein synthesis,
changes in activities of key enzymes such as Na+/K+-
ATPases, and growth or elimination of specialized cells
(e.g., pavement cells, ionocytes, and seawater- or freshwa-
ter-type MRCs; Evans et al. 2005; Marshall 2013). These
alterations are energetically expensive and in turn can affect
metabolic rates and energy balance, which play key roles in
organisms’ survival, function, stress adaptation, and toler-
ance (Calow and Forbes 1998; Sokolova et al. 2012). Such
osmoregulatory processes have been estimated to consume
20–68% of total energy costs in some teleosts (Morgan and
Iwama 1991; Boeuf and Payan 2001), leading to substantial
selective pressure to physiologically and behaviorally opti-
mize osmoregulatory energetic expenditure (Calow 1989).
Thus, optimal performance can occur at relatively narrow
ranges within a larger physiological tolerance window, and
fish may behaviorally avoid salinities outside this optimum
range (Edeline et al. 2005; Dowd et al. 2010). Such mecha-
nisms could contribute to observed patterns in situ in
which a species’ occurrence is strongly bound within a
small fraction of their tolerance range [defined here as
physiologically euryhaline, but ecologically stenohaline,
sensu Hutchinson’s fundamental versus realized niche
(1957); Fig. 1]. However, the physiological mechanisms
and sublethal costs of such osmoregulatory responses from
a molecular perspective are largely unresolved for fish that
exhibit these patterns. Other estuarine, euryhaline fishes
have been shown to use cytokine- and kinase-signaling
pathways to trigger complex transcriptional adjustments in
response to changing salinities, including aquaporins to
regulate cell volume, polyamine synthesis to stabilize
964 © 2016 The Authors. Evolutionary Applications published by John Wiley & Sons Ltd 9 (2016) 963–981
Salinity stress contributes to habitat limitation Komoroske et al.
protein interactions, ATPases to transport ions, claudins
that may regulate paracellular permeability and ion selec-
tivity, and a diversity of genes involved in energy metabo-
lism and oxidative phosphorylation (Scott et al. 2005,
2008; Evans and Somero 2008; Whitehead et al. 2011; Mar-
shall 2013). However, divergent salinity responses can exist
even among populations (Scott and Schulte 2005; White-
head et al. 2012), and most well-studied species generally
utilize habitats in situ across broad salinity ranges (i.e., are
both physiologically and ecologically euryhaline; Marshall
2013). Additionally, there is strong evidence that euryhalin-
ity as a phenotypic trait has evolved independently multiple
times in different teleost lineages, and many proteins
involved in euryhalinity actually exist in stenohaline fish
but serve other biological functions (Schultz and
McCormick 2013; K€ultz 2015). Thus, it is unknown if the
same molecular responses are conserved, muted, or absent
in fish that can tolerate high salinities but do not exploit
such habitats.
Understanding the biological consequences of current
and projected salinity increases in highly managed systems
like the SFE is particularly important because alternate
management actions can strongly influence abiotic condi-
tions and affect biodiversity and community structure.
Human-driven landscape-scale modifications in the SFE
have already reduced habitat diversity and led to major
declines of once numerous native species (Sommer et al.
2007; Moyle et al. 2010), exemplified by precipitous decli-
nes of multiple pelagic fish populations since the early
2000s (referred to as the pelagic organism decline, POD;
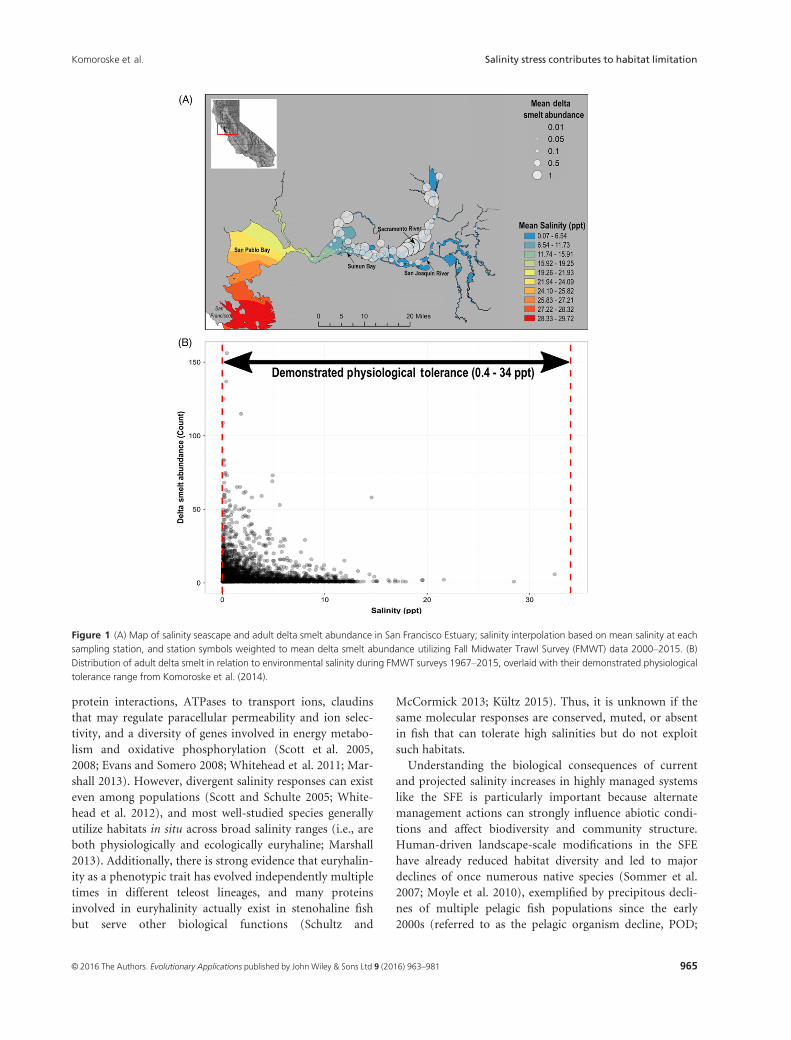
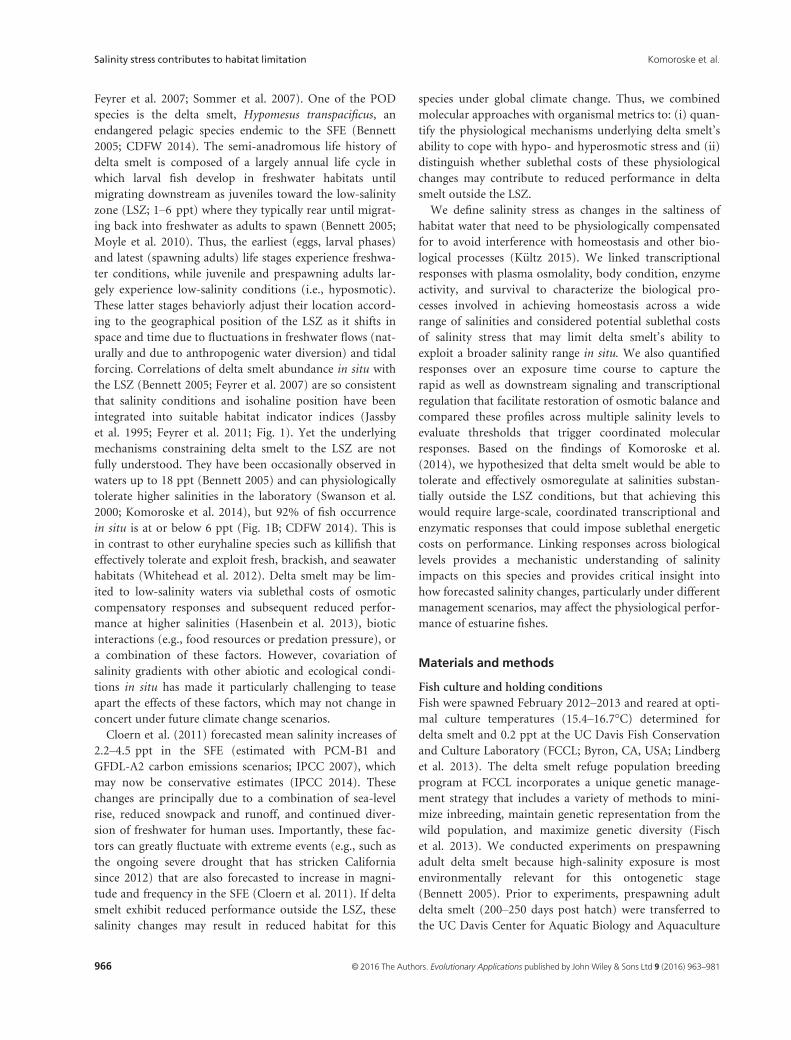
Figure 1 (A) Map of salinity seascape and adult delta smelt abundance in San Francisco Estuary; salinity interpolation based on mean salinity at each
sampling station, and station symbols weighted to mean delta smelt abundance utilizing Fall Midwater Trawl Survey (FMWT) data 2000–2015. (B)
Distribution of adult delta smelt in relation to environmental salinity during FMWT surveys 1967–2015, overlaid with their demonstrated physiological
tolerance range from Komoroske et al. (2014).
© 2016 The Authors. Evolutionary Applications published by John Wiley & Sons Ltd 9 (2016) 963–981 965
Komoroske et al. Salinity stress contributes to habitat limitation
Feyrer et al. 2007; Sommer et al. 2007). One of the POD
species is the delta smelt, Hypomesus transpacificus, an
endangered pelagic species endemic to the SFE (Bennett
2005; CDFW 2014). The semi-anadromous life history of
delta smelt is composed of a largely annual life cycle in
which larval fish develop in freshwater habitats until
migrating downstream as juveniles toward the low-salinity
zone (LSZ; 1–6 ppt) where they typically rear until migrat-
ing back into freshwater as adults to spawn (Bennett 2005;
Moyle et al. 2010). Thus, the earliest (eggs, larval phases)
and latest (spawning adults) life stages experience freshwa-
ter conditions, while juvenile and prespawning adults lar-
gely experience low-salinity conditions (i.e., hyposmotic).
These latter stages behaviorly adjust their location accord-
ing to the geographical position of the LSZ as it shifts in
space and time due to fluctuations in freshwater flows (nat-
urally and due to anthropogenic water diversion) and tidal
forcing. Correlations of delta smelt abundance in situ with
the LSZ (Bennett 2005; Feyrer et al. 2007) are so consistent
that salinity conditions and isohaline position have been
integrated into suitable habitat indicator indices (Jassby
et al. 1995; Feyrer et al. 2011; Fig. 1). Yet the underlying
mechanisms constraining delta smelt to the LSZ are not
fully understood. They have been occasionally observed in
waters up to 18 ppt (Bennett 2005) and can physiologically
tolerate higher salinities in the laboratory (Swanson et al.
2000; Komoroske et al. 2014), but 92% of fish occurrence
in situ is at or below 6 ppt (Fig. 1B; CDFW 2014). This is
in contrast to other euryhaline species such as killifish that
effectively tolerate and exploit fresh, brackish, and seawater
habitats (Whitehead et al. 2012). Delta smelt may be lim-
ited to low-salinity waters via sublethal costs of osmotic
compensatory responses and subsequent reduced perfor-
mance at higher salinities (Hasenbein et al. 2013), biotic
interactions (e.g., food resources or predation pressure), or
a combination of these factors. However, covariation of
salinity gradients with other abiotic and ecological condi-
tions in situ has made it particularly challenging to tease
apart the effects of these factors, which may not change in
concert under future climate change scenarios.
Cloern et al. (2011) forecasted mean salinity increases of
2.2–4.5 ppt in the SFE (estimated with PCM-B1 and
GFDL-A2 carbon emissions scenarios; IPCC 2007), which
may now be conservative estimates (IPCC 2014). These
changes are principally due to a combination of sea-level
rise, reduced snowpack and runoff, and continued diver-
sion of freshwater for human uses. Importantly, these fac-
tors can greatly fluctuate with extreme events (e.g., such as
the ongoing severe drought that has stricken California
since 2012) that are also forecasted to increase in magni-
tude and frequency in the SFE (Cloern et al. 2011). If delta
smelt exhibit reduced performance outside the LSZ, these
salinity changes may result in reduced habitat for this
species under global climate change. Thus, we combined
molecular approaches with organismal metrics to: (i) quan-
tify the physiological mechanisms underlying delta smelt’s
ability to cope with hypo- and hyperosmotic stress and (ii)
distinguish whether sublethal costs of these physiological
changes may contribute to reduced performance in delta
smelt outside the LSZ.
We define salinity stress as changes in the saltiness of
habitat water that need to be physiologically compensated
for to avoid interference with homeostasis and other bio-
logical processes (K€ultz 2015). We linked transcriptional
responses with plasma osmolality, body condition, enzyme
activity, and survival to characterize the biological pro-
cesses involved in achieving homeostasis across a wide
range of salinities and considered potential sublethal costs
of salinity stress that may limit delta smelt’s ability to
exploit a broader salinity range in situ. We also quantified
responses over an exposure time course to capture the
rapid as well as downstream signaling and transcriptional
regulation that facilitate restoration of osmotic balance and
compared these profiles across multiple salinity levels to
evaluate thresholds that trigger coordinated molecular
responses. Based on the findings of Komoroske et al.
(2014), we hypothesized that delta smelt would be able to
tolerate and effectively osmoregulate at salinities substan-
tially outside the LSZ conditions, but that achieving this
would require large-scale, coordinated transcriptional and
enzymatic responses that could impose sublethal energetic
costs on performance. Linking responses across biological
levels provides a mechanistic understanding of salinity
impacts on this species and provides critical insight into
how forecasted salinity changes, particularly under different
management scenarios, may affect the physiological perfor-
mance of estuarine fishes.
Materials and methods
Fish culture and holding conditions
Fish were spawned February 2012–2013 and reared at opti-
mal culture temperatures (15.4–16.7°C) determined for
delta smelt and 0.2 ppt at the UC Davis Fish Conservation
and Culture Laboratory (FCCL; Byron, CA, USA; Lindberg
et al. 2013). The delta smelt refuge population breeding
program at FCCL incorporates a unique genetic manage-
ment strategy that includes a variety of methods to mini-
mize inbreeding, maintain genetic representation from the
wild population, and maximize genetic diversity (Fisch
et al. 2013). We conducted experiments on prespawning
adult delta smelt because high-salinity exposure is most
environmentally relevant for this ontogenetic stage
(Bennett 2005). Prior to experiments, prespawning adult
delta smelt (200–250 days post hatch) were transferred to
the UC Davis Center for Aquatic Biology and Aquaculture
966 © 2016 The Authors. Evolutionary Applications published by John Wiley & Sons Ltd 9 (2016) 963–981
Salinity stress contributes to habitat limitation Komoroske et al.
and held for at least two weeks under a natural photope-
riod in 340-L tanks at 15.5–16.5°C, 2.3 ppt (using artificial
sea salt: Instant Ocean, Spectrum Brands, Inc., Blacksburg,
VA, USA) based on mean salinity of delta smelt presence in
the field (mean salinity = 2.32 ppt, FMWT data 2000–2015; Fig. 1), and fed an ad libitum 2:1 mixture of Inve-
NRD commercial feed (Inve Aquaculture, Salt Lake City,
UT, USA) and Hikari plankton (Pentair Aquatic Ecosys-
tems, Apopka, FL, USA). Water quality was monitored
daily with a YSI 556 water-quality instrument (YSI Incor-
porated, Yellow Springs, OH, USA) for pH (8.6 � 0.38)
and dissolved oxygen (90–100% saturation). We used bio-
logical filtration, via a custom wet–dry filter that trickled
water over Bio-Balls in an oxygen-rich chamber, and aug-
mented water quality by exchanging 50% water per week.
Ammonia and nitrite were monitored daily using a colori-
metric test kit (API, Calfont, PA, USA). All handling, care
and experimental procedures used were reviewed and
approved by the UC Davis Institutional Animal Care and
Use Committee (IACUC Protocol # 16591).
Salinity exposure experiments
We conducted two acute salinity exposure experiments dif-
fering in exposure duration to collect samples for transcrip-
tomics, enzyme activity, osmolality, body condition, and
survival. These two sets of experiments served to capture
transcriptomic responses that can occur rapidly within
minutes to hours (Evans and Somero 2008; Whitehead
et al. 2012), as well as the consequent enzymatic changes
and aggregate whole organismal alterations that can emerge
over timescales of days to weeks (Marshall 2013). We chose
to examine gills for transcriptomic and enzyme activity
responses because this tissue is a primary interface between
the fish’s internal and external environment, playing a
major role in maintaining homeostasis by transporting
ions, oxygen, and water across filament membranes (Evans
et al. 2005). We quantified gill Na+/K+ ATPase activity
(NKA) because this enzyme is a key effector for regaining
osmotic balance in other fishes (McCormick et al. 2003),
and plasma osmolality as a measure of changes in internal
solute balance and osmoregulation (Sardella et al. 2004).
Experiment 1—Acute exposure and short-term duration
In the first experiment, we examined effects of acute, short-
term salinity exposures on transcriptomic responses and
survival under environmentally relevant salinity treatments
(0.4, 2.3, 6.0, 12.0, and 18.0 ppt; Bennett 2005). We trans-
ferred 10 randomly selected fish from acclimation tanks
into each of the 18.9-L experimental black round contain-
ers (i.e., 5 salinity treatments and 4 time points, with addi-
tional replicates for handling controls: 24 containers 9 10
fish = 240 fish total; the 2.3-ppt treatment served as
handling control at each time point), fitted with an air-
stone, drip lines connected to stock water and mesh-cov-
ered drains to maintain 90–100% dissolved oxygen
saturation and create flow-through conditions. We chose
this experimental design because delta smelt are schooling,
pelagic fish that experience high stress and mortality if cul-
tured, acclimated, or exposed individually or in small
groups (Hasenbein et al. 2016), recognizing the trade-off
of possible small tank effects in this component of the
study. Containers were placed into a water bath to main-
tain temperature at 15.4°C (�0.42 SD). After an overnight
acclimation mimicking holding conditions (flow-through
water at 2.3 ppt), we checked water quality, fish activity,
and subsampled randomly selected fish for ‘pre-experi-
ment’ baseline transcriptome-wide assessments. We then
increased salinities at constant rates for each treatment over
6 h (approximating a tidal influx time period) to reach tar-
get salinities (0.4, 2.3, 6.0, 12.0 and 18.0 ppt). Water was
delivered via peristaltic pumps from head tanks with stock
salinity solutions using artificial sea salt (Instant Ocean).
We recorded water quality hourly during the ramping
phase, followed by monitoring at each designated sampling
time point (pre-exposure, 0, 18, and 42 h). At each sam-
pling time point, fish were sacrificed with an overdose of
MS-222 (Tricaine methanesulfonate, Finquel, Argent
Chemical Laboratories, Redmond, WA, USA), at a dosage
of 50 mg L�1 buffered to a neutral pH with sodium bicar-
bonate (NaHCO3), weighed (wet mass � 0.1 g), and mea-
sured (fork length � 0.5 mm) to assess covariation of fish
size and treatments, and gill tissue was immediately
dissected and flash frozen by submersion in liquid nitrogen.
We chose to focus on gill tissue because in teleost fishes it
plays important roles in oxygen uptake, osmotic and ionic
regulation, nitrogenous waste excretion, and other critical
organismal functions (reviewed in Evans et al. 2005). Sam-
ples were stored at �80°C prior to RNA extraction.
Experiment 2—Acute exposure and longer-term duration
In the second experiment, we examined impacts of acute
salinity exposures held over longer-term durations (two
weeks) on enzyme activity, osmolality, and survival (see
detailed methods in Komoroske et al. 2014). In brief, after
an initial acclimation period, fish remained in 340-L recir-
culating holding tanks for each salinity treatment (3 repli-
cate tanks 9 3 salinities = 9 total). We utilized fish from
the same generation as in the acute, short-term salinity
exposures (Experiment 1). Fish from each holding tank
were sampled from all replicate and treatment tanks to
serve as pre-experiment baselines, and then salinities were
increased following the previously detailed protocol with
modified target treatments. Three target salinities were
chosen (2.3-control, 18.5, and 34.0 ppt), based on chronic
salinity maximum experiment results (Komoroske et al.
© 2016 The Authors. Evolutionary Applications published by John Wiley & Sons Ltd 9 (2016) 963–981 967
Komoroske et al. Salinity stress contributes to habitat limitation
2014), and exposures were conducted after observing low
mortality across all treatments in acute Experiment 1.
Twenty fish were sampled for each treatment at each desig-
nated time point (4–6 fish from each replicate tank): pre-
experiment baseline, 0 h, 6 h, 18 h, 4 day (90 h), 7 day
(162 h) and 14 day (330 h) following protocols detailed in
the first experiment, except blood was also obtained from
the caudal vessel via caudal severance. Blood was collected
in microhematocrit tubes and immediately centrifuged at
10 000 g for five minutes to separate the plasma. This was
followed by estimating hematocrit and collection of plasma
into 0.5-mL tubes that were flash frozen and subsequently
stored at �80°C until processed. We monitored tanks
hourly for mortalities and water-quality parameters during
the gradual salinity increase phase, and at each designated
time point and then daily for the three-week duration of
the experiment.
RNA extraction, amplification, and labeling
Total RNA was extracted from gill tissue using Qiagen
RNeasy Kits (Qiagen, Inc., Valencia, CA, USA) according
to manufacturer’s instructions. RNA concentrations (ng
lL�1) and purity (A260/A280 and A260/A230 ratios) were
determined using a NanoDrop ND1000 Spectrophotome-
ter (NanoDrop Technologies, Inc., Wilmington, DE, USA),
and integrity was verified through electrophoresis. Two
hundred nanograms of total RNA was then amplified and
labeled with Cy3 fluorescent dye using the One-Color Low
Input Quick Amp Labeling kit (Agilent Technologies Inc.,
Santa Clara, CA, USA) according to the manufacturer’s
protocol. Briefly, complementary DNA (cDNA) was made
from control RNA-spiked samples followed by comple-
mentary RNA (cRNA) synthesis, amplification and Cy3
labeling, and purification. We quantified cRNA concentra-
tion and dye incorporation using a NanoDrop ND1000
Spectrophotometer. All samples yielded at least 1.65 lgcRNA and specific activity 6 pmol Cy3 lg cRNA�1. To
minimize technical artifacts, all reactions were performed
simultaneously and individuals from each treatment were
randomized in 96-well plates and subsequently on microar-
ray slides. Dye-labeled samples were stored in amber tubes
at �80°C until microarray hybridization.
Microarray analysis
We used a delta smelt oligonucleotide microarray (Agilent
Technologies Inc.) designed to assess responses to a num-
ber of stressors (Jeffries et al. 2015; Komoroske et al.
2015). We performed a total of 72 single-color microarray
hybridizations on 4–6 replicates (gill tissue from individual
fish) for the pre-experiment baseline and salinity challenge
9 exposure time treatment groups using the custom delta
smelt GE microarrays and Agilent Gene Expression
Hybridization Kits (Agilent Technologies Inc.). We hybri-
dized amplified cRNA of gill tissue according to Agilent’s
One-Color Microarray-Based Gene Expression Analysis
(Low Input Quick Amp Labeling) Protocol. Briefly, prior
to hybridization, 1.65 lg of dye-labeled cRNA sample was
combined with 2.2 lL of 259 fragmentation buffer in
amber tubes, 11 lL of 109 Gene Expression Blocking
Agent and nuclease-free water to bring the final volume to
55 lL. The fragmentation mix was incubated at 60°C for
30 min, cooled on ice for 1 min, and was stopped by add-
ing 55 lL of 29 Hi-RPM hybridization buffer. Samples
were centrifuged for 1 min, placed on ice, and 100 lL of
the mix was loaded onto gasket slides, and the microarray
slides were placed on top of the gasket slide. Each slide and
gasket slide combination was secured in a single Agilent
SureHyb chambers and incubated for 17 h at 65°C, fol-lowed by a wash with Gene Expression Wash Buffer 1 at
room temperature and Gene Expression Wash Buffer 2 at
37°C according to manufacturer’s instructions. All reac-
tions, hybridizations, and washes were completed in the
dark. After washing, slides were scanned within 5 h using
an Axon GenePix 4000B Scanner and the analysis software
GenePix Pro (Molecular Devices, LLC, Sunnyvale, CA,
USA). The images were quantified using Feature Extraction
v11.5.1.1 (Agilent Technologies Inc.).
We performed normalization, statistical analyses, and
graphical representations of microarray data in Genespring
(v12.6; Agilent Technologies Inc.) and R (v2.15.2; R-Core-
Team 2012) and associated packages such as gplot (Warnes
et al. 2014). Microarray probes with fluorescent values
<100 (approximately 2.5 times the background intensity of
an individual array for our dataset), as well as probes that
were detected on <50% of the total arrays (suggesting an
unreliable probe), were filtered out prior to normalization.
Data for the entire array set were quantile normalized and
log-transformed prior to statistical analysis. We assessed
expression differences of features between the salinity chal-
lenge x exposure time treatment groups using general linear
models (GLMs) at q ≤ 0.05 (the false discovery rate analog
of the corrected P-value). On the microarray, there are two
different overlapping probes for each gene sequence that
were treated individually in the analyses, validating that
duplicate probes representing each gene displayed signifi-
cant differences among treatments and allowing us to iden-
tify the strongest patterns of biological significance in the
data. We reported the number of significant probes for
each predictor variable or interaction and averaged the val-
ues by gene per sample for graphical representation.
For Experiment 1 (acute exposure, short-term duration),
there was no covariation of fish size or weight with salinity
treatments or sampling time points, so these metrics were
not included in statistical analyses of transcriptomic data.
968 © 2016 The Authors. Evolutionary Applications published by John Wiley & Sons Ltd 9 (2016) 963–981
Salinity stress contributes to habitat limitation Komoroske et al.
We evaluated multivariate trajectories of gene expression
signatures and broad-scale patterns indicative of physiolog-
ical responses to salinity over time via nonmetric multidi-
mensional scaling (nMDS; unconstrained ordination) in
the R package vegan (Oksanen et al. 2013) on probes of
primary interest, that is, differential expression for salinity
and salinity x exposure time (probes significant at q ≤ 0.01
included, averaged by isotig; Bray–Curtis distances, two
dimensions, 50 maximum random starts). We also evalu-
ated affected biological processes, which were identified as
processes represented by significant genes using the Gene
Ontology (GO) categories associated with significant genes
using PANTHER (Protein ANnotation THrough Evolu-
tionary Relationship; Mi et al. 2013). Functional analyses
on these significant genes were performed using Blast2Go
(Conesa et al. 2005). We included gene IDs for probes with
q ≤ 0.1 for the main effect of challenge salinity and the
interaction of challenge salinity 9 time in analyses and set
this gene list against a background list of all annotated
genes present on the microarray to evaluate over-represen-
tation of GO categories (analyses automatically removed
replicate gene IDs from duplicate probes). Functional
groups were considered significantly enriched using Fish-
er’s exact tests at FDR ≤ 0.05. Secondly, we individually
confirmed and identified the molecular functions and bio-
logical processes of the genes of primary interest via http://
uniprot.org and supporting literature. The latter served to
gain a more in-depth understanding of the underlying
components of the broad biological process categories
identified by functional analyses.
Finally, we evaluated transcriptional changes in relation to
key genes and physiological responses to salinity stress previ-
ously identified in the literature (Evans and Somero 2008;
Whitehead et al. 2012) to distinguish similarities and differ-
ences between delta smelt and other euryhaline fishes. To do
this, we used UniProt’s Function description as well as GO
molecular function and GO biological process information to
assign each gene of primary interest (i.e., using a conserva-
tive approach including genes with q ≤ 0.01 for salinity or
salinity x exposure time, duplicate probes for each gene aver-
aged) to one or more principal categories of (i) osmosensing
and signaling, (ii) ion and cell volume regulation, (iii) cellu-
lar transport and phosphorylation, (iv) cell proliferation and
normal cellular cycle processes, and (v) metabolism and res-
piration. During assignment, we also considered creation of
novel categories to identify unique physiological mecha-
nisms employed by delta smelt. However, we did not find
robust evidence (i.e., congruent significant patterns across
multiple genes) to provide strong enough support for the
inclusion of novel classifications in our results. We con-
ducted a posteriori analyses on assigned genes using Tukey’s
honestly significant difference tests (corrected P ≤ 0.05)
based on significance of main effects or their interaction in
main GLMs for each gene. We focus reporting of these
results on significant differences between handling controls
and overall salinity treatments (i.e., main effect of salinity
≤0.05, and salinity 9 time point interaction ≥0.05), or salin-ity treatments at specific time points, when appropriate (i.e.,
salinity 9 time point interaction ≤0.05).
Organismal, osmolality, body condition and enzyme
activity measures
During both experiments, we monitored survival hourly
during the salinity increase phase and at each designated
sampling time point, as well as daily in Experiment 2 (acute
exposure, longer-term duration). In Experiment 2, length
and weight measurements were also used to calculate a
body condition index (BCI; defined as weight/length3) as
an indicator of overall physiological state (Bolger and Con-
nolly 1989) and compared among salinity treatments over
time. We quantified organismal-level effects of salinity and
exposure time via (i) BCI using a linear mixed model
(LMM; replicate tank as a random effect) in R packages
lme4 and lmerTest (Bates et al. 2015; Kuznetsova et al.
2015), as well as metrics described in Komoroske et al.
(2014), (ii) survival using a generalized linear mixed model
(GLMM), and (iii) salinity tolerance via a GLM.
Due to the small size of delta smelt, only 2–10 lL of
plasma was obtained per individual. To avoid confounding
issues of pooling samples, a small sample holder (AC-063)
was used in conjunction with a vapor pressure osmometer
(Vapro 5600; Wescor Inc., Logan, UT, USA) to analyze and
quantify plasma osmolality. When possible, 2.5-lL plasma
samples were processed in duplicate to assess consistency,
and replicates were averaged prior to analysis. Total plasma
osmolality is expressed as mmol kg�1 (referring to kg of
sample). The activity of gill Na+/K+-ATPase activity (NKA)
was measured utilizing McCormick’s (1993) microplate
method, adapted for small fish (i.e., whole gill used due to
small tissue sizes). Whole gill was homogenized in 500 lLof homogenizing buffer (250 mM sucrose, 10 mM Na2EDTA, 50 mM imidiazole, 0.5% Na deoxycholic acid) and
centrifuged for one minute at 5000 g at 4°C (Eppendorf,
Hamburg, Germany). To determine NKA, 10 lL of homo-
genate was loaded onto a 96-well microplate and 200 lL of
assay solution (in the presence or absence of ouabain) was
added to each well. A kinetic reading (340 nm for 10 min
at 25°C) was performed (Synergy HT microplate reader;
Biotek, Winooski, VT, USA), and NKA activities were
determined as the ouabain-inhibited fraction of total ATP
hydrolysis and the conversion of NADH to NAD+. Activi-
ties were standardized by measurement of total protein
(bicinchoninic acid; BCA Protein Assay Kit; Pierce, Rock-
ford, IL, USA) according methods described by Smith et al.
(1985), and NKA activities were expressed as lmol of ADP
© 2016 The Authors. Evolutionary Applications published by John Wiley & Sons Ltd 9 (2016) 963–981 969
Komoroske et al. Salinity stress contributes to habitat limitation
x mg protein�1 9 h�1. We applied LLMs to assess effects of
salinity and exposure time on plasma osmolality and NKA
activity, including replicate tank as a random effect.
Results
Salinity effects on organismal, osmolality, body condition,
and enzyme activity measures
In Experiment 1 (acute exposure, short-term duration:
gradual salinity increases to targets of 0.4, 2.3, 6, 12, and 18
ppt), mortality was only observed at 0.4 ppt (0, 10, and
10% at 0, 18, and 42 h, respectively) and 18 ppt (0, 0, and
10% at 0, 18, and 42 h, respectively). In Experiment 2
(acute exposure, longer-term duration), significant mortal-
ity was observed only in the highest salinity treatment (34.0
ppt), with mortality occurring principally between 18 and
90 h (survival = 81.5% at 90 h; Komoroske et al. 2014).
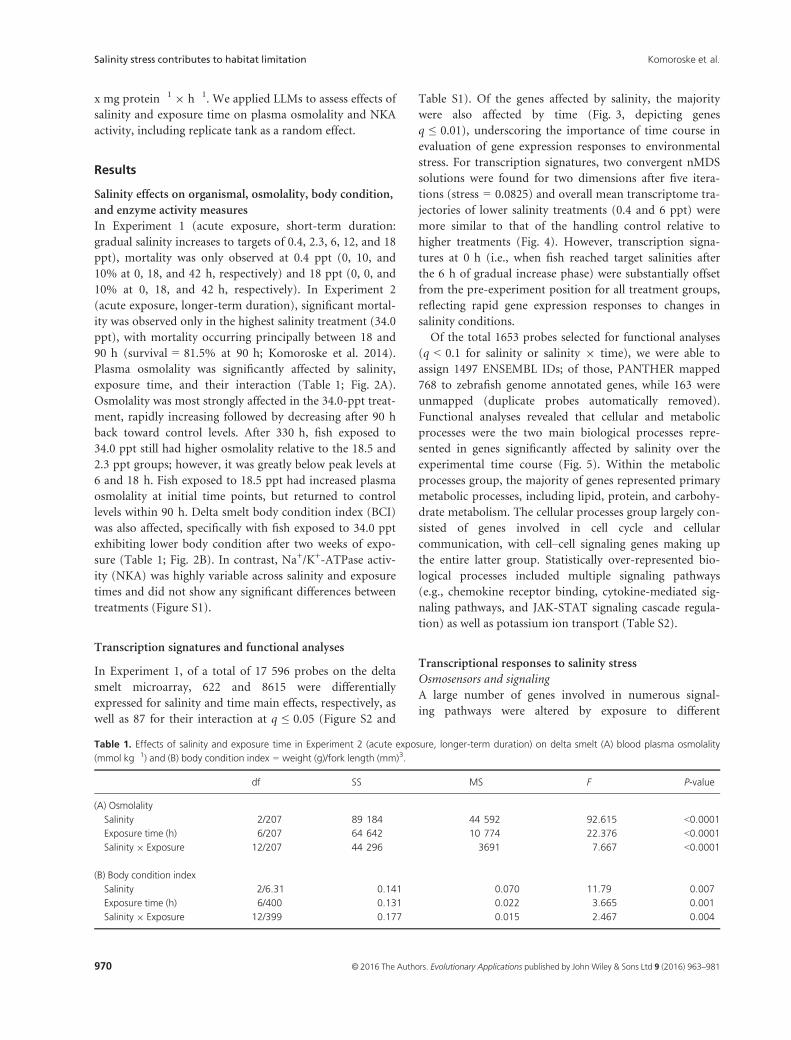
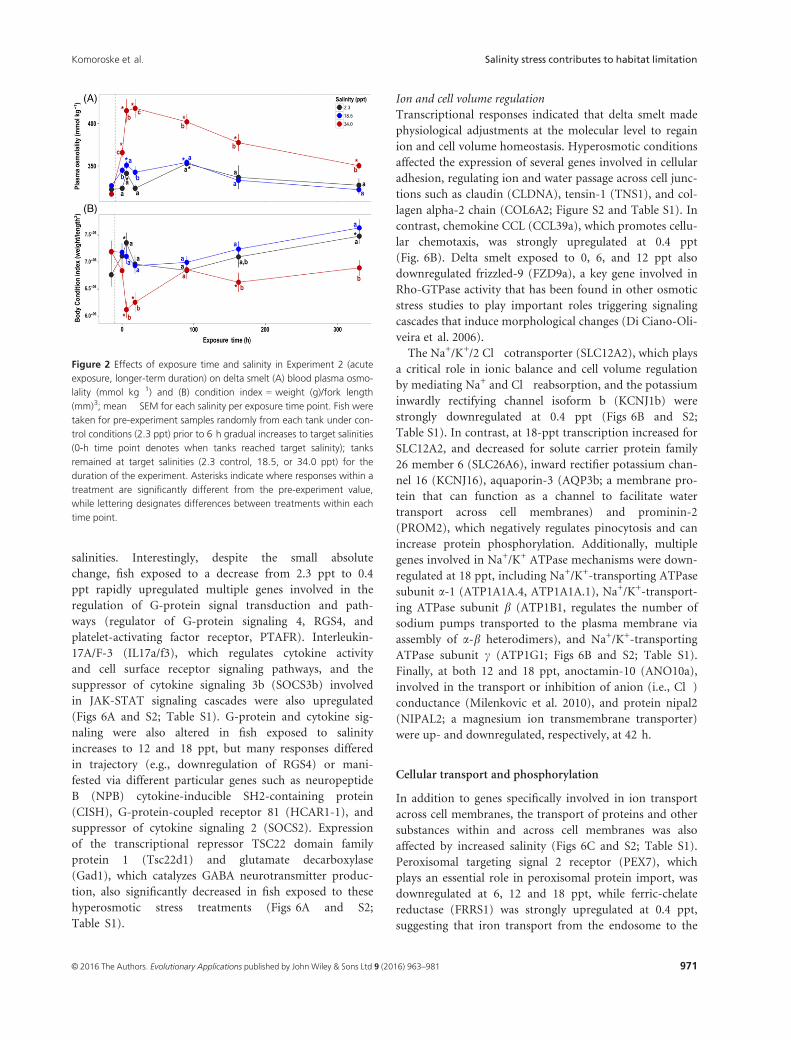
Plasma osmolality was significantly affected by salinity,
exposure time, and their interaction (Table 1; Fig. 2A).
Osmolality was most strongly affected in the 34.0-ppt treat-
ment, rapidly increasing followed by decreasing after 90 h
back toward control levels. After 330 h, fish exposed to
34.0 ppt still had higher osmolality relative to the 18.5 and
2.3 ppt groups; however, it was greatly below peak levels at
6 and 18 h. Fish exposed to 18.5 ppt had increased plasma
osmolality at initial time points, but returned to control
levels within 90 h. Delta smelt body condition index (BCI)
was also affected, specifically with fish exposed to 34.0 ppt
exhibiting lower body condition after two weeks of expo-
sure (Table 1; Fig. 2B). In contrast, Na+/K+-ATPase activ-
ity (NKA) was highly variable across salinity and exposure
times and did not show any significant differences between
treatments (Figure S1).
Transcription signatures and functional analyses
In Experiment 1, of a total of 17 596 probes on the delta
smelt microarray, 622 and 8615 were differentially
expressed for salinity and time main effects, respectively, as
well as 87 for their interaction at q ≤ 0.05 (Figure S2 and
Table S1). Of the genes affected by salinity, the majority
were also affected by time (Fig. 3, depicting genes
q ≤ 0.01), underscoring the importance of time course in
evaluation of gene expression responses to environmental
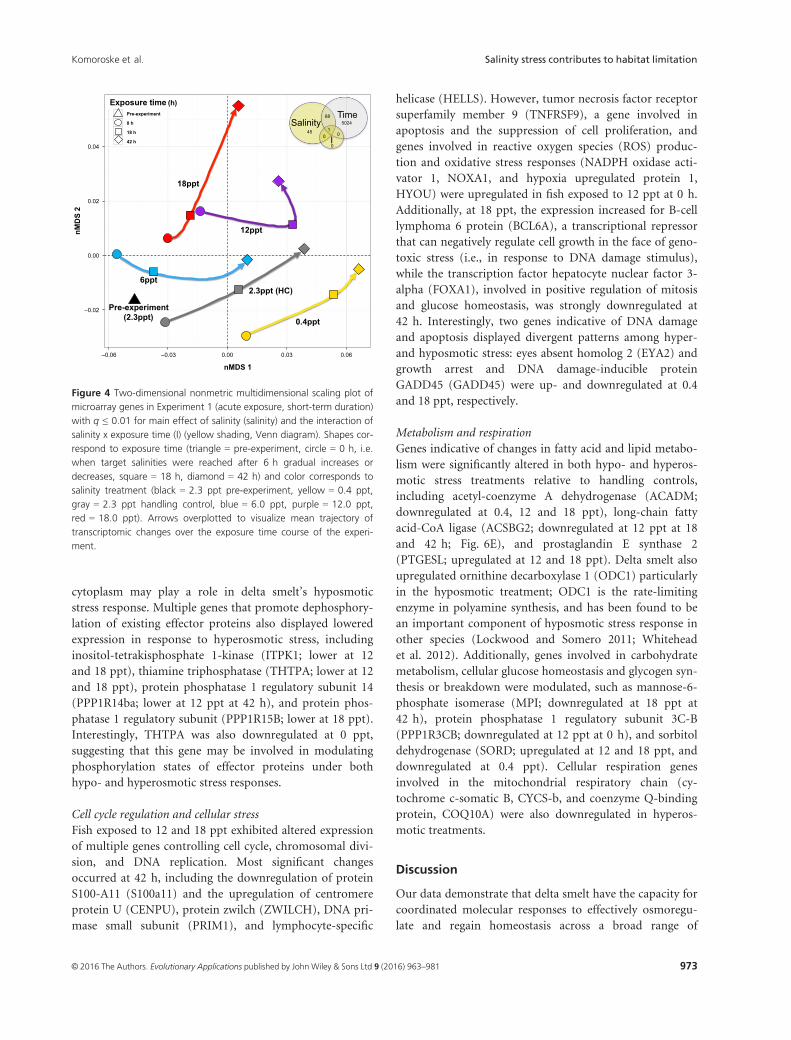
stress. For transcription signatures, two convergent nMDS
solutions were found for two dimensions after five itera-
tions (stress = 0.0825) and overall mean transcriptome tra-
jectories of lower salinity treatments (0.4 and 6 ppt) were
more similar to that of the handling control relative to
higher treatments (Fig. 4). However, transcription signa-
tures at 0 h (i.e., when fish reached target salinities after
the 6 h of gradual increase phase) were substantially offset
from the pre-experiment position for all treatment groups,
reflecting rapid gene expression responses to changes in
salinity conditions.
Of the total 1653 probes selected for functional analyses
(q < 0.1 for salinity or salinity 9 time), we were able to
assign 1497 ENSEMBL IDs; of those, PANTHER mapped
768 to zebrafish genome annotated genes, while 163 were
unmapped (duplicate probes automatically removed).
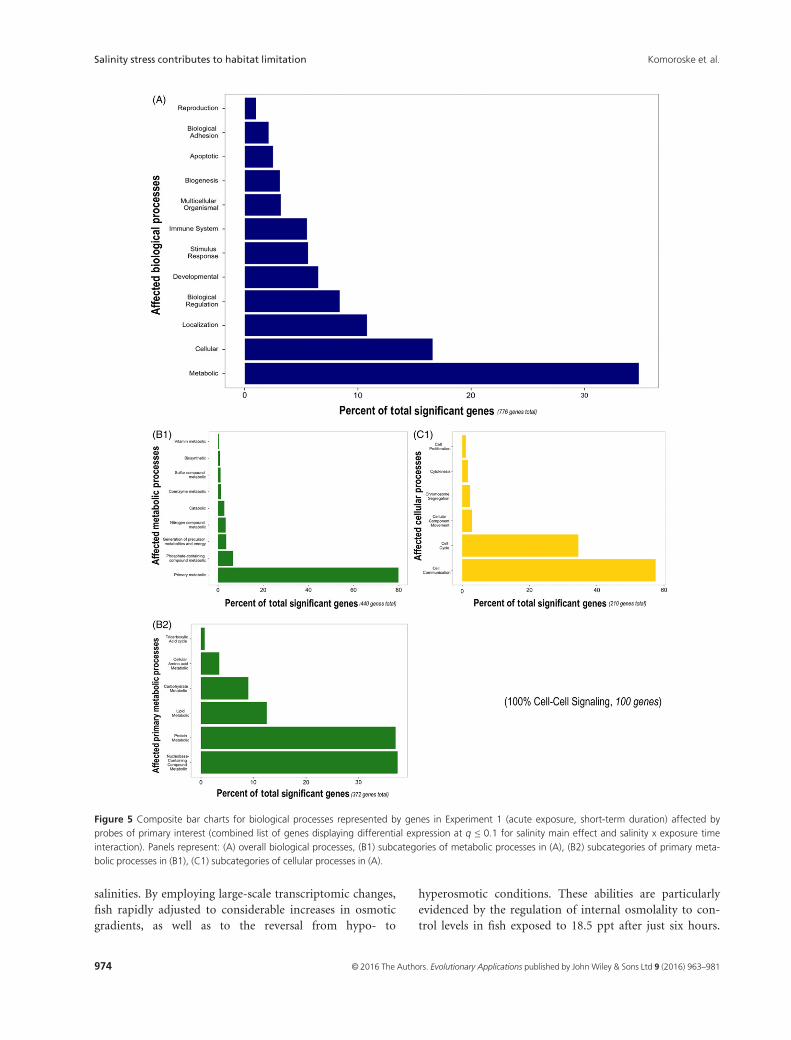
Functional analyses revealed that cellular and metabolic
processes were the two main biological processes repre-
sented in genes significantly affected by salinity over the
experimental time course (Fig. 5). Within the metabolic
processes group, the majority of genes represented primary
metabolic processes, including lipid, protein, and carbohy-
drate metabolism. The cellular processes group largely con-
sisted of genes involved in cell cycle and cellular
communication, with cell–cell signaling genes making up
the entire latter group. Statistically over-represented bio-
logical processes included multiple signaling pathways
(e.g., chemokine receptor binding, cytokine-mediated sig-
naling pathways, and JAK-STAT signaling cascade regula-
tion) as well as potassium ion transport (Table S2).
Transcriptional responses to salinity stress
Osmosensors and signaling
A large number of genes involved in numerous signal-
ing pathways were altered by exposure to different
Table 1. Effects of salinity and exposure time in Experiment 2 (acute exposure, longer-term duration) on delta smelt (A) blood plasma osmolality
(mmol kg�1) and (B) body condition index = weight (g)/fork length (mm)3.
df SS MS F P-value
(A) Osmolality
Salinity 2/207 89 184 44 592 92.615 <0.0001
Exposure time (h) 6/207 64 642 10 774 22.376 <0.0001
Salinity 9 Exposure 12/207 44 296 3691 7.667 <0.0001
(B) Body condition index
Salinity 2/6.31 0.141 0.070 11.79 0.007
Exposure time (h) 6/400 0.131 0.022 3.665 0.001
Salinity 9 Exposure 12/399 0.177 0.015 2.467 0.004
970 © 2016 The Authors. Evolutionary Applications published by John Wiley & Sons Ltd 9 (2016) 963–981
Salinity stress contributes to habitat limitation Komoroske et al.
salinities. Interestingly, despite the small absolute
change, fish exposed to a decrease from 2.3 ppt to 0.4
ppt rapidly upregulated multiple genes involved in the
regulation of G-protein signal transduction and path-
ways (regulator of G-protein signaling 4, RGS4, and
platelet-activating factor receptor, PTAFR). Interleukin-
17A/F-3 (IL17a/f3), which regulates cytokine activity
and cell surface receptor signaling pathways, and the
suppressor of cytokine signaling 3b (SOCS3b) involved
in JAK-STAT signaling cascades were also upregulated
(Figs 6A and S2; Table S1). G-protein and cytokine sig-
naling were also altered in fish exposed to salinity
increases to 12 and 18 ppt, but many responses differed
in trajectory (e.g., downregulation of RGS4) or mani-
fested via different particular genes such as neuropeptide
B (NPB) cytokine-inducible SH2-containing protein
(CISH), G-protein-coupled receptor 81 (HCAR1-1), and
suppressor of cytokine signaling 2 (SOCS2). Expression
of the transcriptional repressor TSC22 domain family
protein 1 (Tsc22d1) and glutamate decarboxylase
(Gad1), which catalyzes GABA neurotransmitter produc-
tion, also significantly decreased in fish exposed to these
hyperosmotic stress treatments (Figs 6A and S2;
Table S1).
Ion and cell volume regulation
Transcriptional responses indicated that delta smelt made
physiological adjustments at the molecular level to regain
ion and cell volume homeostasis. Hyperosmotic conditions
affected the expression of several genes involved in cellular
adhesion, regulating ion and water passage across cell junc-
tions such as claudin (CLDNA), tensin-1 (TNS1), and col-
lagen alpha-2 chain (COL6A2; Figure S2 and Table S1). In
contrast, chemokine CCL (CCL39a), which promotes cellu-
lar chemotaxis, was strongly upregulated at 0.4 ppt
(Fig. 6B). Delta smelt exposed to 0, 6, and 12 ppt also
downregulated frizzled-9 (FZD9a), a key gene involved in
Rho-GTPase activity that has been found in other osmotic
stress studies to play important roles triggering signaling
cascades that induce morphological changes (Di Ciano-Oli-
veira et al. 2006).
The Na+/K+/2 Cl� cotransporter (SLC12A2), which plays
a critical role in ionic balance and cell volume regulation
by mediating Na+ and Cl� reabsorption, and the potassium
inwardly rectifying channel isoform b (KCNJ1b) were
strongly downregulated at 0.4 ppt (Figs 6B and S2;
Table S1). In contrast, at 18-ppt transcription increased for
SLC12A2, and decreased for solute carrier protein family
26 member 6 (SLC26A6), inward rectifier potassium chan-
nel 16 (KCNJ16), aquaporin-3 (AQP3b; a membrane pro-
tein that can function as a channel to facilitate water
transport across cell membranes) and prominin-2
(PROM2), which negatively regulates pinocytosis and can
increase protein phosphorylation. Additionally, multiple
genes involved in Na+/K+ ATPase mechanisms were down-
regulated at 18 ppt, including Na+/K+-transporting ATPase
subunit a-1 (ATP1A1A.4, ATP1A1A.1), Na+/K+-transport-
ing ATPase subunit b (ATP1B1, regulates the number of
sodium pumps transported to the plasma membrane via
assembly of a-b heterodimers), and Na+/K+-transporting
ATPase subunit c (ATP1G1; Figs 6B and S2; Table S1).
Finally, at both 12 and 18 ppt, anoctamin-10 (ANO10a),
involved in the transport or inhibition of anion (i.e., Cl�)conductance (Milenkovic et al. 2010), and protein nipal2
(NIPAL2; a magnesium ion transmembrane transporter)
were up- and downregulated, respectively, at 42 h.
Cellular transport and phosphorylation
In addition to genes specifically involved in ion transport
across cell membranes, the transport of proteins and other
substances within and across cell membranes was also
affected by increased salinity (Figs 6C and S2; Table S1).
Peroxisomal targeting signal 2 receptor (PEX7), which
plays an essential role in peroxisomal protein import, was
downregulated at 6, 12 and 18 ppt, while ferric-chelate
reductase (FRRS1) was strongly upregulated at 0.4 ppt,
suggesting that iron transport from the endosome to the
Figure 2 Effects of exposure time and salinity in Experiment 2 (acute
exposure, longer-term duration) on delta smelt (A) blood plasma osmo-
lality (mmol kg�1) and (B) condition index = weight (g)/fork length
(mm)3; mean � SEM for each salinity per exposure time point. Fish were
taken for pre-experiment samples randomly from each tank under con-
trol conditions (2.3 ppt) prior to 6 h gradual increases to target salinities
(0-h time point denotes when tanks reached target salinity); tanks
remained at target salinities (2.3 control, 18.5, or 34.0 ppt) for the
duration of the experiment. Asterisks indicate where responses within a
treatment are significantly different from the pre-experiment value,
while lettering designates differences between treatments within each
time point.
© 2016 The Authors. Evolutionary Applications published by John Wiley & Sons Ltd 9 (2016) 963–981 971
Komoroske et al. Salinity stress contributes to habitat limitation
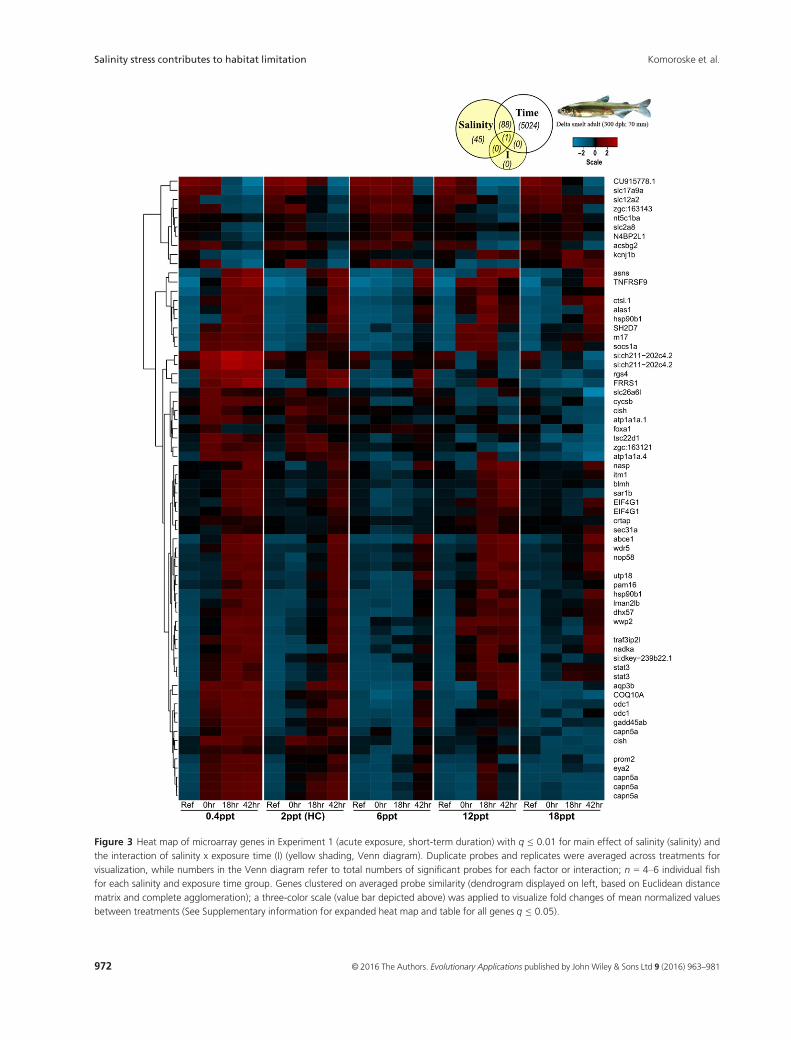
Figure 3 Heat map of microarray genes in Experiment 1 (acute exposure, short-term duration) with q ≤ 0.01 for main effect of salinity (salinity) and
the interaction of salinity x exposure time (I) (yellow shading, Venn diagram). Duplicate probes and replicates were averaged across treatments for
visualization, while numbers in the Venn diagram refer to total numbers of significant probes for each factor or interaction; n = 4–6 individual fish
for each salinity and exposure time group. Genes clustered on averaged probe similarity (dendrogram displayed on left, based on Euclidean distance
matrix and complete agglomeration); a three-color scale (value bar depicted above) was applied to visualize fold changes of mean normalized values
between treatments (See Supplementary information for expanded heat map and table for all genes q ≤ 0.05).
972 © 2016 The Authors. Evolutionary Applications published by John Wiley & Sons Ltd 9 (2016) 963–981
Salinity stress contributes to habitat limitation Komoroske et al.
cytoplasm may play a role in delta smelt’s hyposmotic
stress response. Multiple genes that promote dephosphory-
lation of existing effector proteins also displayed lowered
expression in response to hyperosmotic stress, including
inositol-tetrakisphosphate 1-kinase (ITPK1; lower at 12
and 18 ppt), thiamine triphosphatase (THTPA; lower at 12
and 18 ppt), protein phosphatase 1 regulatory subunit 14
(PPP1R14ba; lower at 12 ppt at 42 h), and protein phos-
phatase 1 regulatory subunit (PPP1R15B; lower at 18 ppt).
Interestingly, THTPA was also downregulated at 0 ppt,
suggesting that this gene may be involved in modulating
phosphorylation states of effector proteins under both
hypo- and hyperosmotic stress responses.
Cell cycle regulation and cellular stress
Fish exposed to 12 and 18 ppt exhibited altered expression
of multiple genes controlling cell cycle, chromosomal divi-
sion, and DNA replication. Most significant changes
occurred at 42 h, including the downregulation of protein
S100-A11 (S100a11) and the upregulation of centromere
protein U (CENPU), protein zwilch (ZWILCH), DNA pri-
mase small subunit (PRIM1), and lymphocyte-specific
helicase (HELLS). However, tumor necrosis factor receptor
superfamily member 9 (TNFRSF9), a gene involved in
apoptosis and the suppression of cell proliferation, and
genes involved in reactive oxygen species (ROS) produc-
tion and oxidative stress responses (NADPH oxidase acti-
vator 1, NOXA1, and hypoxia upregulated protein 1,
HYOU) were upregulated in fish exposed to 12 ppt at 0 h.
Additionally, at 18 ppt, the expression increased for B-cell
lymphoma 6 protein (BCL6A), a transcriptional repressor
that can negatively regulate cell growth in the face of geno-
toxic stress (i.e., in response to DNA damage stimulus),
while the transcription factor hepatocyte nuclear factor 3-
alpha (FOXA1), involved in positive regulation of mitosis
and glucose homeostasis, was strongly downregulated at
42 h. Interestingly, two genes indicative of DNA damage
and apoptosis displayed divergent patterns among hyper-
and hyposmotic stress: eyes absent homolog 2 (EYA2) and
growth arrest and DNA damage-inducible protein
GADD45 (GADD45) were up- and downregulated at 0.4
and 18 ppt, respectively.
Metabolism and respiration
Genes indicative of changes in fatty acid and lipid metabo-
lism were significantly altered in both hypo- and hyperos-
motic stress treatments relative to handling controls,
including acetyl-coenzyme A dehydrogenase (ACADM;
downregulated at 0.4, 12 and 18 ppt), long-chain fatty
acid-CoA ligase (ACSBG2; downregulated at 12 ppt at 18
and 42 h; Fig. 6E), and prostaglandin E synthase 2
(PTGESL; upregulated at 12 and 18 ppt). Delta smelt also
upregulated ornithine decarboxylase 1 (ODC1) particularly
in the hyposmotic treatment; ODC1 is the rate-limiting
enzyme in polyamine synthesis, and has been found to be
an important component of hyposmotic stress response in
other species (Lockwood and Somero 2011; Whitehead
et al. 2012). Additionally, genes involved in carbohydrate
metabolism, cellular glucose homeostasis and glycogen syn-
thesis or breakdown were modulated, such as mannose-6-
phosphate isomerase (MPI; downregulated at 18 ppt at
42 h), protein phosphatase 1 regulatory subunit 3C-B
(PPP1R3CB; downregulated at 12 ppt at 0 h), and sorbitol
dehydrogenase (SORD; upregulated at 12 and 18 ppt, and
downregulated at 0.4 ppt). Cellular respiration genes
involved in the mitochondrial respiratory chain (cy-
tochrome c-somatic B, CYCS-b, and coenzyme Q-binding
protein, COQ10A) were also downregulated in hyperos-
motic treatments.
Discussion
Our data demonstrate that delta smelt have the capacity for
coordinated molecular responses to effectively osmoregu-
late and regain homeostasis across a broad range of
–0.02
0.00
0.02
0.04
–0.06 –0.03 0.00 0.03 0.06
nMDS 1
nMD
S 2
0.4ppt
2.3ppt (HC)
Pre-experiment (2.3ppt)
6ppt
12ppt
18ppt
Salinity Time
5024
I
88
45 1 0 0
0
Exposure time (h) Pre-experiment
0 h
18 h
42 h
Figure 4 Two-dimensional nonmetric multidimensional scaling plot of
microarray genes in Experiment 1 (acute exposure, short-term duration)
with q ≤ 0.01 for main effect of salinity (salinity) and the interaction of
salinity x exposure time (I) (yellow shading, Venn diagram). Shapes cor-
respond to exposure time (triangle = pre-experiment, circle = 0 h, i.e.
when target salinities were reached after 6 h gradual increases or
decreases, square = 18 h, diamond = 42 h) and color corresponds to
salinity treatment (black = 2.3 ppt pre-experiment, yellow = 0.4 ppt,
gray = 2.3 ppt handling control, blue = 6.0 ppt, purple = 12.0 ppt,
red = 18.0 ppt). Arrows overplotted to visualize mean trajectory of
transcriptomic changes over the exposure time course of the experi-
ment.
© 2016 The Authors. Evolutionary Applications published by John Wiley & Sons Ltd 9 (2016) 963–981 973
Komoroske et al. Salinity stress contributes to habitat limitation
salinities. By employing large-scale transcriptomic changes,
fish rapidly adjusted to considerable increases in osmotic
gradients, as well as to the reversal from hypo- to
hyperosmotic conditions. These abilities are particularly
evidenced by the regulation of internal osmolality to con-
trol levels in fish exposed to 18.5 ppt after just six hours.
Figure 5 Composite bar charts for biological processes represented by genes in Experiment 1 (acute exposure, short-term duration) affected by
probes of primary interest (combined list of genes displaying differential expression at q ≤ 0.1 for salinity main effect and salinity x exposure time
interaction). Panels represent: (A) overall biological processes, (B1) subcategories of metabolic processes in (A), (B2) subcategories of primary meta-
bolic processes in (B1), (C1) subcategories of cellular processes in (A).
974 © 2016 The Authors. Evolutionary Applications published by John Wiley & Sons Ltd 9 (2016) 963–981
Salinity stress contributes to habitat limitation Komoroske et al.
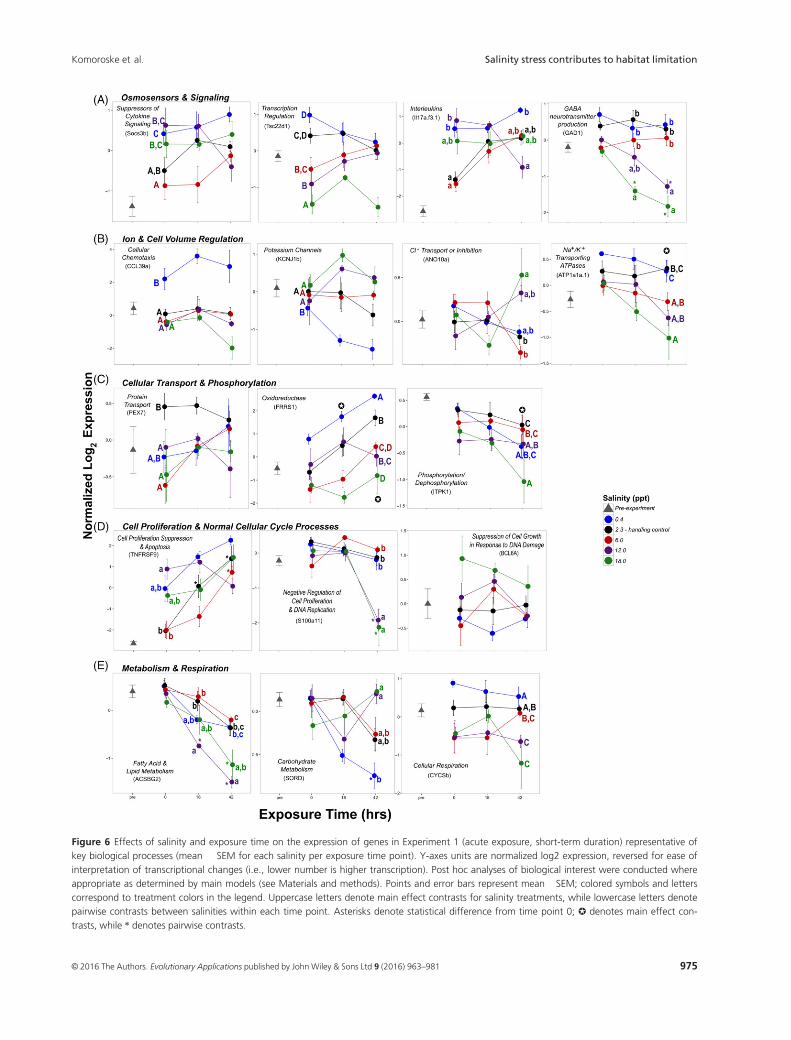
Figure 6 Effects of salinity and exposure time on the expression of genes in Experiment 1 (acute exposure, short-term duration) representative of
key biological processes (mean � SEM for each salinity per exposure time point). Y-axes units are normalized log2 expression, reversed for ease of
interpretation of transcriptional changes (i.e., lower number is higher transcription). Post hoc analyses of biological interest were conducted where
appropriate as determined by main models (see Materials and methods). Points and error bars represent mean �SEM; colored symbols and letters
correspond to treatment colors in the legend. Uppercase letters denote main effect contrasts for salinity treatments, while lowercase letters denote
pairwise contrasts between salinities within each time point. Asterisks denote statistical difference from time point 0; ✪ denotes main effect con-
trasts, while * denotes pairwise contrasts.
© 2016 The Authors. Evolutionary Applications published by John Wiley & Sons Ltd 9 (2016) 963–981 975
Komoroske et al. Salinity stress contributes to habitat limitation
However, at the highest salinity (34.0 ppt), fish displayed
reduced body condition even with unlimited food
resources, and functional analyses identified that lipid, pro-
tein, and carbohydrate metabolism played major roles in
delta smelt’s compensatory responses to salinity stress out-
side the low-salinity zone (LSZ) conditions. These findings
align with theoretical models and empirical evidence in
other species showing that osmoregulatory processes are
energetically expensive (Morgan and Iwama 1991; Boeuf
and Payan 2001; K€ultz 2015), and that such environmental
stress can impose sublethal costs due to the additional
energy needed to recover and maintain homeostasis (Calow
and Forbes 1998; Sokolova et al. 2012). Although delta
smelt are physiologically euryhaline (i.e., are able to tolerate
0.4 – 34.0 ppt), the cumulative costs associated with physi-
ological adjustments required to achieve homeostasis
across a large, fluctuating salinity gradient may be higher
than the continual maintenance cost for homeostasis
within LSZ salinities. The evolution of such a homeostatic
set point that differs from isosmotic conditions has been
observed in other fishes (Papakostas et al. 2012) and could
be reinforced by factors not directly related to osmoregula-
tion, but that covary with salinity and offer fitness benefits
(i.e., food availability or predator avoidance). This combi-
nation could further constrain the abilities of delta smelt to
effectively exploit habitat outside the LSZ, corresponding
with strong in situ correlations of this species with both
environmental and ecological parameters (Fig. 1; Bennett
2005; Feyrer et al. 2007). Thus, forecasted mean salinity
increases of 2.2–4.5 ppt in the San Francisco Estuary (SFE)
are not likely to induce mortality, but these environmental
changes will probably further constrict habitat that pro-
vides optimal conditions for performance and reproductive
output in delta smelt. Identifying the physiological mecha-
nisms that organisms use to cope with an individual stres-
sor, and how those responses may impose sublethal costs,
is an important step toward understanding of how multiple
global change factors influence species’ fitness and, ulti-
mately, persistence.
A large number of genes involved in many molecular
pathways were altered by salinity over the exposure time
course in delta smelt, supporting our hypothesis and previ-
ous work demonstrating that regaining homeostasis in the
face of osmotic stress requires complex and coordinated
physiological responses beginning at the transcriptional
level (Evans and Somero 2008; Whitehead et al. 2012).
Transcriptional signatures and their trajectories over time
were more similar among 0.4, 2.3 (handling controls) and
6 ppt, relative to 12 and particularly 18 ppt. These patterns
align with the concept that changes in the magnitude of
osmotic gradients require physiological adjustments within
an organism’s hyposmotic regulatory strategy, while the
reversal of the osmotic gradient to hyperosmotic
conditions entails switching physiological strategies that
potentially utilize different underlying mechanisms. Inter-
estingly, some genes responded similarly in delta smelt
under both hypo- and hyperosmotic challenges, indicating
they perhaps play common roles in both responses, while
others clearly differentially responded to the divergent con-
ditions.
Fish exposed to salinity challenges outside LSZ condi-
tions (i.e., 0.4-below LSZ, 12 and 18 ppt above LSZ) exhib-
ited the greatest transcriptional changes. Many of the
responsive genes were associated with similar physiological
mechanisms identified in other estuarine fishes (i.e., cell
signaling, re-establishment of ionic and osmotic balance,
suppression of normal cell cycle regulation, and altered
metabolic processes) and were in accordance with shifting
resource allocation underlying euryhalinity (reviewed in
Evans 2010). Many of the specific gene identities involved
in these processes were similar to other euryhaline fishes
examined to date. This is perhaps suggestive of the use of
some conserved as well as convergent molecular pathways
in euryhalinity (K€ultz 2015), but the current availability of
well annotated genomes for only a few fish species in func-
tional genomic databases limits robust comparative analy-
ses. However, recent advances in teleost genomic resources
(Rondeau et al. 2014) hold exciting promise to facilitate
future studies comparing these mechanisms across closely
related and divergent euryhaline species.
Body condition and survival of delta smelt exposed to
18.5 ppt were not significantly affected, and blood plasma
osmolality returned to control levels after 6 h. These results
reveal that rapid physiological adjustments allowed fish to
quickly regain homeostasis at this salinity, which was sur-
prising given the well-known sensitivity of delta smelt to
environmental stress (Bennett 2005; Hasenbein et al. 2013;
Komoroske et al. 2015). Yet both the body condition and
survival of fish exposed to 34.0 ppt were significantly
reduced, indicating that the costs of coping with strong
hyperosmotic stress negatively impacts fitness. Importantly,
we observed these negative impacts under experimental
conditions with unlimited food resources. The ability of
delta smelt to rapidly regain homeostasis at 18.5 ppt may
have been dependent on access to ample energy reserves,
which may not always be the case in situ. It has been pro-
posed that a driving force of selection in the evolution of
euryhalinity is access to energy-rich estuarine environments
(K€ultz 2015). For estuarine fishes like delta smelt, inhabit-
ing such fluctuating salinity environments is likely a per-
petual balancing act between adequately dispensing enough
resources to prevent osmotic stress-related damage and
compromise cellular function, without unnecessarily
diverting cellular resources away from growth and repro-
duction (Evans 2010). However, there is increasing evi-
dence of resource limitation in SFE ecosystems due to both
976 © 2016 The Authors. Evolutionary Applications published by John Wiley & Sons Ltd 9 (2016) 963–981
Salinity stress contributes to habitat limitation Komoroske et al.
natural variation and food web shifts induced by invasive
species (Cloern and Jassby 2012). Thus, if delta smelt face
food limitation in situ, it is very possible that the energetic
costs of mounting osmoregulatory responses may nega-
tively impact performance and survival at more moderate
levels of hyperosmotic stress. Additionally, effects may be
more pronounced for other delta smelt life stages such as
early juveniles that require relatively high energetic invest-
ment for rapid growth. Further research investigating the
dynamics of osmoregulatory responses and food limitation
would provide critical insight into the effects of the interac-
tions of these important factors.
Contrary to our hypothesis, we did not observe changes
in enzymatic activity associated with osmotic stress; Na+/
K+-ATPase activity (NKA) was not affected by salinity or
exposure time. This was surprising, particularly in light of
clear evidence of regulation of internal osmolality in delta
smelt. In teleosts, a hallmark effector of osmoregulation in
the gills is the modulation of NKA along with related
cotransporters to effectively maintain osmotic and ionic
balance (Evans et al. 2005; Hwang and Lin 2013). Studies
in a variety of fishes have documented increased NKA
activity with osmotic stress (Marshall 2013) and NKA ‘iso-
form switching’, in which one isoform is upregulated at
low salinities while another is downregulated and vice versa
at increased salinities (Richards et al. 2003; Bystriansky
et al. 2006; Urbina et al. 2013). Additionally, delta smelt
downregulated gene expression of multiple NKA subunits
at high salinities, but we did not detect any reciprocal
increases in the transcription of alternate isoforms. Several
Na+/K+/2 Cl� cotransporters (NKCC’s) and other solute
carrier proteins and inward rectifier potassium channels
displayed opposing transcriptional patterns at low versus at
high salinities. Expressional changes and osmoregulatory
function of these cellular components in gills, and particu-
larly ionocytes, have been found in other studies in both
freshwater and estuarine fishes (Marshall 2003; Wood
2011; Dymowska et al. 2012). Taken together, these data
suggest that delta smelt may be able to effectively regain
homeostasis at increased salinities without the upregulation
of NKA transcription or activity, but perhaps via adjust-
ments of other pathway components or mechanisms
(Evans and Somero 2008). As an estuarine fish, delta smelt
may have evolved alternate strategies to cope with rapid
salinity fluctuations, potentially employing physiological
mechanisms that offer faster responses to changing condi-
tions (e.g., phosphorylation, maintaining higher constitu-
tive protein levels; K€ultz 2013). We did observe altered
gene expression of kinases and phosphatases that are
involved in post-translational modification of proteins
through phosphorylation and dephosphorylation to
heighten or repress their activities, respectively. Phosphory-
lation of NKCCs in response to salinity stress has been
observed in other species of euryhaline fishes (Flatman
2002; Flemmer et al. 2010), as well as other cellular compo-
nents involved in both osmosensing signaling pathways
and effector proteins (Evans and Somero 2008; K€ultz
2015). These rapid mechanisms may be especially impor-
tant for osmoregulators inhabiting estuarine environments
such as delta smelt. As the application of high-throughput
molecular studies across a greater diversity of fishes contin-
ues to expand, it will provide further insight into the evolu-
tionary and ecological contexts under which species
employ differential physiological strategies such as cellular
remodeling, transcriptional, and post-translational mecha-
nisms to cope with salinity stress.
Due to anthropogenic freshwater diversion in the SFE
that results in higher salinity habitats, management empha-
sis is frequently focused on effects of hyperosmotic stress.
However, our data also highlight the large-scale transcrip-
tomic changes delta smelt initiated to cope with freshwater
osmoregulatory challenges, such as those endured during
upstream spawning migration to freshwater. Despite the
small absolute salinity change from LSZ conditions, fresh-
water reduces ion availability to very low levels, and fresh-
water fishes typically have high-affinity ion-uptake pumps
to effectively cope with these environmental conditions.
However, estuarine fishes do not necessarily possess these
adaptations, and may need to make other physiological
adjustments to maintain homeostasis (Marshall 2013). This
is supported by delta smelt’s upregulation of genes for
enzymes and cotransporters related to solute transport at
0.4 ppt, as well as those involved in preventing pinocytosis.
Similar transcriptional responses as well as intolerance to
freshwater acclimation have been observed in killifish spe-
cies that typically otherwise exhibit euryhaline capabilities
(Whitehead et al. 2011; Patterson et al. 2012). While the
specific costs of physiological adjustments to cope with
freshwater in delta smelt are not yet clear, spawning is an
energetically demanding activity in the absence of addi-
tional costs of migration or coping with environmental
stress, re-emphasizing the need for adequate energetic
resources for successful reproduction and persistence in
this largely annual species.
Identifying underlying physiological mechanisms and
costs of environmental stress can help identify how and
when we might expect organisms to suffer sublethal
impacts or increased susceptibility to other stressors
(Helmuth et al. 2005). In addition to behavioral and eco-
logical studies quantifying biotic interactions, this informa-
tion may be especially important when governing entities
have an assortment of management ‘levers’ they can adjust
to affect conservation or restoration efforts (e.g., reservoir
releases or reducing water diversions to regulate river
flows). For example, if the absence of delta smelt in high-
salinity waters was due solely to their inability to tolerate
© 2016 The Authors. Evolutionary Applications published by John Wiley & Sons Ltd 9 (2016) 963–981 977
Komoroske et al. Salinity stress contributes to habitat limitation
these conditions, a natural management focus would be to
maintain suitable habitat within the tolerable salinity range.
However, given that delta smelt actually possess the physio-
logical ‘machinery’ to cope with conditions outside this
range, but cofactors such as energetic costs may play critical
roles limiting their performance, it may be beneficial to also
focus efforts on other ecological factors (e.g., food resource
supply and community structure). Shifts in phytoplankton
and zooplankton communities in conjunction with increas-
ing invasive species richness and abundance has greatly
altered food web dynamics in the SFE (Cloern and Jassby
2012), emphasizing the importance of ecological interac-
tions in understanding global change impacts on SFE
native species (Haller et al. 2014; Lee et al. 2015). While
inclusion of multiple stressors and ecological complexities
is challenging, the absence of considering them may lead to
ineffective management actions (e.g., population decline
despite maintenance of the LSZ zone, due to inadequate
food supply or adaptation of marine predators allowing
them to expand into LSZ waters). Our work isolating the
physiological mechanisms underpinning delta smelt’s
shorter-term salinity stress responses lays the foundation
for future studies investigating multiple stressors such as
environmental stress and resource limitation, as well as
longer-term exposure effects.
Acknowledgements
We thank FCCL staff, in particular J. Lindberg, L. Ellison,
and G. Tigan for extensive assistance facilitating experi-
ments and providing experimental fish, as well as invalu-
able knowledge on delta smelt culture and handling. We
are grateful to D. Cocherell, R. Kaufman, P. Lutes, and E.
Hallen for providing experimental facilities and fish hus-
bandry expertise, B. Decourten, S. Hasenbein, B. Cheng, J.
Truong, I. Huang, R. McPherson, and R. Chiong for their
assistance with experiments and laboratory analyses and T.
Moore, and M. Jennings for their aid with G.I.S. mapping.
This work was supported by the University of California
Agricultural Experiment Station [grant number 2098-H to
N.A.F.], the United States Department of Interior, Bureau
of Reclamation [grant number R12AP20018 to R.E.C. and
N.A.F.], the California State and Federal Contractors Water
Agency [grant number 15-13 to R.E.C.], and the California
Delta Stewardship Council [contract number 201015533 to
R.E.C. and N.A.F.]. Funding was provided to L.M.K. by the
National Science Foundation Graduate-12 Fellowship Pro-
gram [under DGE grant number 0841297 to S. L. Williams
and B. Ludaescher] and to both L.M.K. and K.M.J. by Cali-
fornia Sea Grant Delta Science Doctoral and Post-Doctoral
Fellowships, respectively. Partial student funding was pro-
vided to M.H. by the Bavarian Elite Programme Universit€at
Bayern e.V. scholarship for graduate and postgraduate
students. The authors acknowledge the support of the
TUM Graduate School’s Faculty Graduate Center Weihen-
stephan at Technische Universit€at M€unchen, Germany.
Conflict of interest
The authors declare no conflict of interest.
Data archiving statement
Microarray data have been deposited in the Gene Expres-
sion Omnibus (http://www.ncbi.nlm.nih. gov/geo/) with
the Accession no. GSE72772.
Literature cited
Bates, D., M. Maechler, B. Bolker, and S. Walker 2015. Fitting linear
mixed-effects models using lme4. Journal of Statistical Software 67:1–48.
Bennett, W. 2005. Critical assessment of Delta Smelt in the San Francisco
Estuary, California. San Francisco Estuary and Watershed Science
3:1–72.
Boeuf, G., and P. Payan 2001. How should salinity influence fish growth?
Comparative Biochemistry and Physiology Part C: Toxicology and
Pharmacology 130:411–423.
Bolger, T., and P. L. Connolly 1989. The selection of suitable indices for
the measurement and analysis of fish condition. Journal of Fish Biol-
ogy 34:171–182.
Bradley, T. 2009. Animal Osmoregulation. Oxford University Press, New
York.
Bromirski, P. D., R. E. Flick, and D. R. Cayan 2003. Storminess variabil-
ity along the California coast: 1858–2000. Journal of Climate 16:982–
993.
Brown, J. H. 1984. On the relationship between abundance and
distribution of species. American Naturalist 124:255–279.
Bystriansky, J. S., J. G. Richards, P. M. Schulte, and J. S. Ballantyne 2006.
Reciprocal expression of gill Na+/K+ ATPase alpha-subunit isoforms
alpha 1a and alpha 1b during seawater acclimation of three salmonid
fishes that vary in their salinity tolerance. Journal of Experimental
Biology 209:1848–1858.
Calow, P. 1989. Proximate and ultimate responses to stress in biological
systems. Biological Journal of the Linnean Society 37:173–181.
Calow, P., and V. E. Forbes 1998. How do physiological responses to
stress translate into ecological and evolutionary processes? Compara-
tive Biochemistry and Physiology - Part A: Molecular and Integrative
Physiology 120:11–16.
CDFW 2014. State and federally listed endangered and threatened ani-
mals of California. State of California, The Natural Resources Agency,
California Department of Fish and Wildlife.
Cloern, J. E., and A. D. Jassby. 2012. Drivers of change decades of study
in San Francisco Bay. Reviews of Geophysics 50:RG4001.
Cloern, J. E., N. Knowles, L. Brown, D. Cayan, M. Dettinger, T. Morgan,
D. Schoellhamer et al. 2011. Projected evolution of California’s San
Francisco Bay-Delta-River system in a century of climate change.
PLoS ONE 6:e24465.
Conesa, A., S. Gotz, J. Garcia-Gomez, J. Terol, M. Talon, and M. Robles
2005. Blast2GO: a universal tool for annotation, visualization and
analysis in functional genomics research. Bioinformatics
21:3674–3676.
978 © 2016 The Authors. Evolutionary Applications published by John Wiley & Sons Ltd 9 (2016) 963–981
Salinity stress contributes to habitat limitation Komoroske et al.
Di Ciano-Oliveira, C., C. P. Thirone, K. Szaszi, and A. Kapus 2006.
Osmotic stress and the cytoskeleton: the R(h)ole of Rho-GTPases.
Acta Physiologica 187:257–272.
Dowd, W. W., B. N. Harris, J. J. Cech, and D. K€ultz 2010. Pro-
teomic and physiological responses of leopard sharks (Triakis
semifasciata) to salinity change. Journal of Experimental Biology
213:210–224.
Dymowska, A. K., P. P. Hwang, and G. G. Goss 2012. Structure and
function of ionocytes in the freshwater fish gill. Respiratory Physiol-
ogy and Neurobiology 184:282–292.
Edeline, E., S. Dufour, and P. Elie 2005. Role of glass eel salinity prefer-
ence in the control of habitat selection and growth plasticity in Angu-
illa anguilla. Marine Ecology Progress Series 304:191–199.
Evans, D. H. 2008a. Teleost fish osmoregulation: what have we learned
since August Krogh, Homer Smith, and Ancel Keys. American Journal
of Physiology - Regulatory, Integrative and Comparative Physiology
295:R704–R713.
Evans, D. H. 2008b. Osmotic and Ionic Regulation: Cells and Animals.
CRC Press, Boca Raton.
Evans, T. 2010. Co-ordination of osmotic stress responses through
osmosensing and signal transduction events in fishes. Journal of Fish
Biology 76:1903–1925.
Evans, T., and G. Somero 2008. A microarray-based transcriptomic
time-course of hyper and hyposmotic stress signaling events in the
euryhaline fish Gillichthys mirabilis: osmosensors to effectors. Journal
of Experimental Biology 211:3636–3649.
Evans, D. H., P. M. Piermarini, and K. P. Choe 2005. The multifunc-
tional fish gill: dominant site of gas exchange, osmoregulation, acid-
base regulation, and excretion of nitrogenous waste. Physiological
Reviews 85:97–177.
Feyrer, F., M. L. Nobriga, and T. R. Sommer 2007. Multidecal trends for
three declining fish species: habitat patterns and mechanisms in the
San Francisco Estuary, California, USA. Canadian Journal of Fisheries
and Aquatic Sciences 64:723–734.
Feyrer, F., K. Newman, M. L. Nobriga, and T. R. Sommer 2011.
Modeling the effects of future outflow on the abiotic habitat of an
imperiled estuarine fish. Estuaries and Coasts 34:120–128.
Fiol, D., and D. K€ultz 2007. Osmotic stress sensing and signaling in
fishes. Federation of European Biochemical Societies Journal
274:5790–5798.
Fisch, K., J. Ivy, R. Burton, and B. May. 2013. Evaluating the perfor-
mance of captive breeding techniques for conservation hatcheries: a
case study of the delta smelt captive breeding program. Journal of
Heredity 104:92–104.
Flatman, P. W. 2002. Regulation of Na-K-2Cl cotransport by phosphory-
lation and protein-protein interactions. Biochimica et Biophysica Acta
1566:140–151.
Flemmer, A. F., M. Y. Monette, M. Djurisic, B. Dowd, R. Darman, I.
Gimenez, and B. Forbush 2010. Phosphorylation state of the Na+-K+-
Cl-cotransporter (NKCC1) in the gills of Atlantic killifish (Fundulus
heteroclitus) during acclimation to water of varying salinity. Journal of
Experimental Biology 213:1558–1566.
Guisan, A., and W. Thuiller 2005. Predicting species distribution: offer-
ing more than simple habitat models. Ecology Letters 8:993–1009.
Haller, L., S. Hung, S. Lee, J. Fadel, J. Lee, M. McEnroe, and N. A. Fan-
gue 2014. Effect of nutritional status on the osmoregulation of green
sturgeon (Acipenser medirostris). Physiological and Biochemical Zool-
ogy 88:22–42.
Hasenbein, M., L. M. Komoroske, R. E. Connon, J. Geist, and N. A. Fan-
gue 2013. Turbidity and salinity affect feeding performance and
physiological stress in the endangered delta smelt. Integrative and
Comparative Biology 53:620–634.
Hasenbein, M., N. A. Fangue, J. P. Geist, L. M. Komoroske, and R. E.
Connon 2016. Physiological stress biomarkers reveal stocking density
effects in late larval Delta Smelt (Hypomesus transpacificus). Aquacul-
ture 450:108–115.
Helmuth, B., J. Kingsolver, and E. Carrington 2005. Biophysics, physio-
logical ecology, and climate change: does mechanism matter? Annual
Review of Physiology 67:177–201.
Hochachka, P., and G. Somero 2002. Biochemical Adaptation: Mecha-
nism and Process in Physiological Evolution. Oxford University Press,
New York.
Hutchinson, G. E. 1957. Population studies- animal ecology and demog-
raphy- concluding remarks. Cold Spring Harbor Symposia on Quanti-
tative Biology 22:415–427.
Hwang, P. P., and T. H. Lee 2007. New insights into fish ion regulation
and mitochondrion-rich cells. Comparative Biochemistry and Physi-
ology - Part A: Molecular and Integrative Physiology 148:479–497.
Hwang, P. P., and L. Lin 2013. Gill ionic transport, acid–base regulation,
and nitrogen excretion. In D. Evans, J. Claiborne, and S. Currie, eds.
The Physiology of Fishes, pp. 205–234. CRC Press, Boca Raton.
IAL and IUBS 1958. The venice system for the classification of mar-
ine waters according to salinity. Limnology and Oceanography
3:346–347.
IPCC 2007. Climate Change 2007 - Impacts, Adaptation and Vulnerabil-
ity. Contribution of Working Group II to the Fourth Assessment
Report of the IPCC. Cambridge University Press, Cambridge.
IPCC 2013. Climate Change 2013- The physical science basis. In T.
Stocker, D. Qin, G. Plattner, M. Tignor, S. Allen, J. Boschung, A.
Nauels, Y. Xia, V. Bex, and P. Midgley, eds. Contribution of Working
Group I to the Fifth Assessment Report of the Intergovernmental
Panel on Climate Change, pp. 1–1535. Cambridge University Press,
New York.
IPCC 2014.Climate Change 2014 - Impacts, Adaptation and Vulnerabil-
ity, Part A: Global and Sectoral Aspects. Working Group II Contribu-
tion to the Fifth Assessment Report of the Intergovernmental
Panel on Climate Change. Cambridge University Press, Cambridge.
Jassby, A. D., W. J. Kimmerer, S. G. Monismith, C. Armor, J. E. Cloern,
T. M. Powell, J. R. Schubel et al. 1995. Isohaline position as a habitat
indicator for estuarine populations. Ecological Applications 5:272–
289.
Jeffries, K. M., L. M. Komoroske, J. Truong, I. Werner, S. Hasenbein, M.
Hasenbein, N. A. Fangue et al. 2015. The transcriptome-wide effects
of exposure to a pyrethroid pesticide on the critically endangered delta
smelt (Hypomesus transpacificus). Endangered Species Research 28:43–
60.
Kassahn, K., R. Crozier, H. P€ortner, and M. Caley 2009. Animal perfor-
mance and stress: responses and tolerance limits at different levels of
biological organization. Biological Reviews 84:277–292.
Kidder, G., C. Petersen, and R. Preston 2006. Energetics of osmoregula-
tion: I. oxygen consumption by Fundulus heteroclitus. Journal of
Experimental Zoology Part A 305:309–317.
Komoroske, L. M., R. E. Connon, J. Lindberg, B. S. Cheng, G. Castillo,
M. Hasenbein, and N. A. Fangue. 2014. Ontogeny influences sensitiv-
ity to climate change in an endangered fish. Conservation Physiology
2:cou008.
Komoroske, L. M., R. E. Connon, K. M. Jeffries, and N. A. Fangue 2015.
Linking transcriptional responses to organismal tolerance reveals
mechanisms of thermal sensitivity in a mesothermal endangered fish.
Molecular Ecology 24:4960–4981.
© 2016 The Authors. Evolutionary Applications published by John Wiley & Sons Ltd 9 (2016) 963–981 979
Komoroske et al. Salinity stress contributes to habitat limitation
K€ultz, D. 2013. Osmosensing. In S. McCormick, A. P. Farrell, and C.
Brauner, eds. Euryhaline Fishes, pp. 1373–1380. Elsevier, Waltham.
K€ultz, D. 2015. Physiological mechanisms used by fish to cope with
salinity stress. Journal of Experimental Biology 218:1907–1914.
Kuznetsova, A., P. B. Brockhoff, and R. H. B. Christensen 2015. lmerT-
est: Tests in Linear Mixed Effects Models. R package 2.0-29. https://
CRAN.R-project.org/package=lmerTest.
Lee, S., J. G. Fadel, L. Y. Haller, C. E. Verhille, N. A. Fangue, and S.
S. O. Hung 2015. Effects of feed restriction on salinity tolerance in
White Sturgeon (Acipenser transmontanus). Comparative Biochem-
istry and Physiology - Part A: Molecular and Integrative Physiology
188:156–167.
Lindberg, J., G. Tigan, L. Ellison, T. Rettinghouse, M. Nagel, and K. Fisch
2013. Aquaculture methods for a genetically managed population of
endangered Delta Smelt. North American Journal of Aquaculture
75:186–196.
Lockwood, B. L., and G. N. Somero 2011. Transcriptomic responses to
salinity stress in invasive and native blue mussels (genus Mytilus).
Molecular Ecology 20:517–529.
Lund, J., E. Hanak, W. Fleenor, W. Bennett, R. Howitt, J. Mount, and P.
Moyle 2010. Comparing Futures for the Sacramento-San Joaquin
Delta. University of California Press, Berkeley, CA.
Marshall, W. S. 2003. Rapid regulation of NaCl secretion by estuarine
teleost fish: coping strategies for short-duration freshwater exposures.
Biochimica Et Biophysica Acta-Biomembranes 1618:95–105.
Marshall, W. 2013. Osmoregulation in estuarine and intertidal fishes. In
S. McCormick, A. P. Farrell, and C. Brauner, eds. Euryhaline Fishes,
pp. 395–434. Elsevier, Waltham.
Marshall, W., and M. Grosell 2005. Ion transport, osmoregulation and
acid-base balance. In D. Evans, and J. Claiborne, eds. The Physiology
of Fishes, pp. 177–230. CRC Press, Boca Raton.
McCormick, S. 1993. Methods for non-lethal gill biopsy and measure-
ment of Na+/K+ ATPase activity. Canadian Journal of Fisheries and
Aquatic Sciences 50:656–658.
McCormick, S. D., K. Sundell, B. T. Bjornsson, C. L. Brown, and J. Hiroi
2003. Influence of salinity on the localization of Na+/K+ ATPase, Na+/
K+/2Cl(-)cotransporter (NKCC) and CFTR anion channel in chloride
cells of the Hawaiian goby (Stenogobius hawaiiensis). Journal of Exper-
imental Biology 206:4575–4583.
McCormick, S. D., A. P. Farrell, and C. Brauner 2013. Euryhaline Fishes.
Elsevier, Waltham.
Menzel, A., T. H. Sparks, N. Estrella, E. Koch, A. Aasa, R. Ahas, K. Alm-
Kubler et al. 2006. European phenological response to climate change
matches the warming pattern. Global Change Biology 12:1969–1976.
Mi, H., A. Muruganujan, J. Casagrande, and P. Thomas 2013. Large-
scale gene function analysis with the PANTHER classification system.
Nature Protocols 8:1551–1566.
Milenkovic, V., M. Brockmann, H. St€ohr, B. Weber, and O. Strauss
2010. Evolution and functional divergence of the anoctamin family of
membrane proteins. BMC Evolutionary Biology 10:319.
Min, S. K., X. B. Zhang, F. W. Zwiers, and G. C. Hegerl 2011. Human
contribution to more-intense precipitation extremes. Nature 470:378–
381.
Morgan, J. D., and G. K. Iwama 1991. Effects of salinity on growth,
metabolism and ion regulation in juvenile rainbow trout and steel-
head trout (Oncorhyncus mykiss) and fall Chinook salmon (Oncorhyn-
cus tshawytscha). Aquatic Sciences 48:2083–2094.
Moyle, P., W. Bennett, W. Fleenor, and J. Lund 2010. Habitat variability
and complexity in the upper San Francisco Estuary. San Francisco
Estuary and Watershed Science 8:1–24.
Najjar, R. G., L. Patterson, and S. Graham 2009. Climate simulations of
major estuarine watersheds in the Mid-Atlantic region of the US. Cli-
matic Change 95:139–168.
Najjar, R. G., C. R. Pyke, M. B. Adams, D. Breitburg, C. Hershner,
M. Kemp, R. Howarth et al. 2010. Potential climate-change
impacts on the Chesapeake Bay. Estuarine, Coastal and Shelf
Science 86:1–20.
Nicol, J. 1967. The Biology of Marine Animals. John Wiley and Sons,
San Francisco.
Oksanen, J., F. Blanchet, R. Kindt, P. Legendre, P. Minchin, R. O’Hara,
G. Simpson et al. 2013. Package ‘vegan’ Vol. 2.0-10 (R software pack-
age).
Palumbi, S., D. Barshis, N. Traylor-Knowles, and R. Bay 2014. Mecha-
nisms of reef coral resistance to future climate change. Science
344:895–898.
Papakostas, S., A. N. Vasem€agi, J. P. V€ah€a, M. Himberg, L. Peil, and C.
R. Primmer 2012. A proteomics approach reveals divergent molecular
responses to salinity in populations of European whitefish (Coregonus
lavaretus). Molecular Ecology 21:3516–3530.
Parmesan, C., and G. Yohe 2003. A globally coherent fingerprint of cli-
mate change impacts across natural systems. Nature 421:37–42.
Patterson, J., C. Bodinier, and C. Green 2012. Effects of low salinity
media on growth, condition, and gill ion transporter expression in
juvenile Gulf killifish, Fundulus grandis. Comparative Biochemistry
and Physiology - Part A: Molecular and Integrative Physiology
161:415–421.
Pinsky, M. L., B. Worm, M. J. Fogarty, J. L. Sarmiento, and S. A. Levin
2013. Marine taxa track local climate velocities. Science 341:1239–
1242.
P€ortner, H. O., and A. P. Farrell 2008. Ecology: physiology and climate
change. Science 322:690–692.
R-CoreTeam 2012. R: A language and environment for statistical com-
puting. R Foundation for Statistical Computing, Vienna, Austria.
Rice, K. J., and N. C. Emery 2003. Managing microevolution: restoration
in the face of global change. Frontiers in Ecology and the Environment
1:469–478.
Richards, J., J. Semple, J. Bystriansky, and P. Schulte 2003. Na+/K+
ATPase a-isoform switching in gills of rainbow trout (Oncorhynchus
mykiss) during salinity transfer. Journal of Experimental Biology
206:4475–4486.
Rondeau, E. B., D. R. Minkley, J. S. Leong, A. M. Messmer, J. R. Jantzen,
K. R. von Schalburg, C. Lemon et al. 2014. The genome and linkage
map of the Northern Pike (Esox lucius): conserved synteny revealed
between the Salmonid sister group and the Neoteleostei. PLoS ONE 9:
e102089.
Sardella, B., V. Matey, J. Cooper, R. Gonzalez, and C. Brauner 2004.
Physiological, biochemical and morphological indicators of osmoreg-
ulatory stress in ‘California’ Mozambique tilapia (Oreochromis
mossambicus x O. urolepsis hornorum) exposed to hypersaline water.
Journal of Experimental Biology 207:1399–1413.
Schultz, E., and S. D. McCormick 2013. Euryhalinity in an evolutionary
context. In S. McCormick, A. P. Farrell, and C. Brauner, eds. Euryha-
line Fishes, pp. 477–533. Elsevier, Waltham.
Scott, G. R., and P. M. Schulte 2005. Intraspecific variation in gene
expression after seawater transfer in gills of the euryhaline killifish
Fundulus heteroclitus. Comparative Biochemistry and Physiology A -
Molecular and Integrative Physiology 141:176–182.
Scott, G. R., J. B. Claiborne, S. L. Edwards, P. M. Schulte, and C.
M. Wood 2005. Gene expression after freshwater transfer in gills
and opercular epithelia of killifish: insight into divergent
980 © 2016 The Authors. Evolutionary Applications published by John Wiley & Sons Ltd 9 (2016) 963–981
Salinity stress contributes to habitat limitation Komoroske et al.
mechanisms of ion transport. Journal of Experimental Biology
208:2719–2729.
Scott, G. R., D. W. Baker, P. M. Schulte, and C. M. Wood 2008. Physio-
logical and molecular mechanisms of osmoregulatory plasticity in kil-
lifish after seawater transfer. Journal of Experimental Biology
211:2450–2459.
Smith, P., R. Krohn, G. Hermanson, A. Mallia, F. Gartner, M. Proven-
zano, E. Fujimoto et al. 1985. Measurement of protein using bicin-
choninic acid. Analytical Biochemistry 150:76–85.
Sokolova, I. M., M. Frederich, R. Bagwe, G. Lannig, and A. A. Sukhotin
2012. Energy homeostasis as an integrative tool for assessing limits of
environmental stress tolerance in aquatic invertebrates. Marine Envi-
ronmental Research 79:1–15.
Sommer, T., C. Armor, R. Baxter, R. Breuer, L. Brown, M. Chotkowski,
S. Culberson et al. 2007. The collapse of pelagic fishes in the upper
San Francisco Estuary. Fisheries 32:270–277.
Swanson, C., T. Reid, P. S. Young, and J. J. Cech 2000. Comparative
environmental tolerances of threatened delta smelt (Hypomesus
transpacificus) and introduced wakasagi (H. nipponensis) in an altered
California estuary. Oecologia 123:384–390.
Urbina, M. A., P. M. Schulte, J. S. Bystriansky, and C. N. Glover 2013.
Differential expression of Na+, K+ ATPase alpha-1 isoforms during
seawater acclimation in the amphidromous galaxiid fish Galaxias
maculatus. Journal of Comparative Physiology B: Biochemical, Sys-
tems, and Environmental Physiology 183:345–357.
Warnes, G., B. Bolker, L. Bonebakker, R. Gentleman, W. Huber, A. Liaw,
T. Lumley et al. 2014. Gplots: Various R programming tools for plot-
ting data (R software package).
Whitehead, A., J. L. Roach, S. J. Zhang, and F. Galvez 2011. Genomic
mechanisms of evolved physiological plasticity in killifish distributed
along an environmental salinity gradient. Proceedings of the National
Academy of Sciences 108:6193–6198.
Whitehead, A., J. L. Roach, S. J. Zhang, and F. Galvez 2012. Salinity- and
population-dependent genome regulatory response during osmotic
acclimation in the killifish (Fundulus heteroclitus) gill. Journal of
Experimental Biology 215:1293–1305.
van Wijk, E. M., and S. R. Rintoul 2014. Freshening drives contraction
of Antarctic bottom water in the Australian Antarctic Basin. Geophys-
ical Research Letters 41:1657–1664.
Wood, C. M. 2011. Rapid regulation of Na+ and Cl� flux rates in killifish
after acute salinity challenge. Journal of Experimental Marine Biology
and Ecology 409:62–69.
Supporting Information
Additional Supporting Information may be found online in the support-
ing information tab for this article:
Figure S1. Effects of exposure time and salinity in Experiment 2
(acute exposure, longer-term duration) on delta smelt gill Na+/K+
ATPase enzyme activity (mean � SEM for each salinity per exposure
time point).
Figure S2. Heat map of microarray genes in Experiment 1 (acute
exposure, short-term duration) with q ≤ 0.05 for main effect of salinity
and the interaction of salinity x exposure time.
Table S1. Genes represented by microarray probes of primary interest
(differential expressionat q < 0.05 for salinity challenge main effect and
salinity challenge x recovery time interaction).
Table S2. Over-represented biological processes of genes significantly
affected by main effect of salinity or salinity x exposure time interaction
as determined by Blast2Go functional analyses (note: no biological pro-
cesses were significantly under-represented).
© 2016 The Authors. Evolutionary Applications published by John Wiley & Sons Ltd 9 (2016) 963–981 981
Komoroske et al. Salinity stress contributes to habitat limitation