Embed Size (px)
Citation preview
56
Orica Annual Report 2015
NOTES TO THE FINANCIAL STATEMENTSFor the year ended 30 September
About this report
This is the financial report of Orica Limited (‘the Company’ or ‘Orica’) and of its controlled entities (collectively ‘the Group’) for the year ended 30 September 2015.
It is a general purpose financial report which has been prepared by a for-profit entity in accordance with the requirements of applicable Australian Accounting Standards and the Corporations Act 2001 and complies with International Financial Reporting Standards (IFRS) adopted by the International Accounting Standards Board.
It has been prepared on a historical cost basis, except for derivative financial instruments and investments in financial assets which have been measured at fair value. It is presented in Australian dollars which is Orica’s functional and presentation currency.
The amounts shown have been rounded off, except where otherwise stated, to the nearest tenth of a million dollars, the Company being in a class specified in the ASIC Class Order 98/100 dated 10 July 1998.
Management has undertaken a thorough review to identify opportunities to make this report less complex and more useful for readers. This has included splitting note disclosures into sections to allow readers of this report to better understand how the Group has performed and how this report links back to Orica’s strategy and principle risks outlined in the Operating and Financial Review.
Orica’s Directors have included information in this report that they deem to be material and relevant to the understanding of the financial statements. Disclosure may be considered material and relevant if the dollar amount is significant due to size or nature, or the information is important to understand the:
� Group’s current year results;
� impact of significant changes in Orica’s business; or
� aspects of the Group’s operations that is important to future performance.
Disclosure of information that is not material may undermine the usefulness of the financial report by obscuring important information.
In order to develop this financial report, management is required to make a number of judgements and apply estimates of the future as part of the application process of the Group’s accounting policies. Judgements and estimates, which are material to this report, are highlighted in the following notes:
Note 5 Working capital
Note 6 Provisions
Note 7 Property, Plant and Equipment
Note 8 Intangible assets
Note 9 Impairment testing of assets
Note 11 Taxation
Note 20 Superannuation commitments
Note 22 Contingent liabilities
Section A. Financial performance 57
1. Segment report 57
2. Earnings per share (EPS) 61
Section B. Capital management 63
3. Net debt 63
4. Contributed Equity and Reserves 65
Section C. Operating assets and liabilities 67
5. Working Capital 67
6. Provisions 68
7. Property, plant and equipment 71
8. Intangible assets 72
9. Impairment testing of assets 73
Section D. Managing Financial Risks 75
10. Financial risk management 75
Section E. Taxation 80
11. Taxation 80
Section F. Global footprint 84
12. Investments in controlled entities 84
13. Non-controlling interests in controlled entities 84
14. Investments accounted for using the equity method and joint operations 85
15. Businesses and non-controlling interests acquired 86
16. Discontinued operations and businesses disposed 87
17. Parent Company disclosure – Orica Limited 90
18. Deed of cross guarantee 90
Section G. Reward and recognition 92
19. Employee share plans and Remuneration 92
20. Superannuation commitments 96
Section H. Other 100
21. Commitments 100
22. Contingent liabilities 100
23. Auditors’ remuneration 101
24. Events subsequent to balance date 102
25. Investments in controlled entities 102
26. New accounting policies 106
57
Orica Annual Report 2015
57
Orica Annual Report 2015
NOTES TO THE FINANCIAL STATEMENTS – FINANCIAL PERFORMANCEFor the year ended 30 September
Section A. Financial performanceA key element of the Group’s current strategy, outlined in the Review of Operations and Financial Performance, is “to create sustainable shareholder value”. This section highlights the results and performance of the Group for the year ended 30 September 2015.
1. Segment report
(a) Identification and description of segments
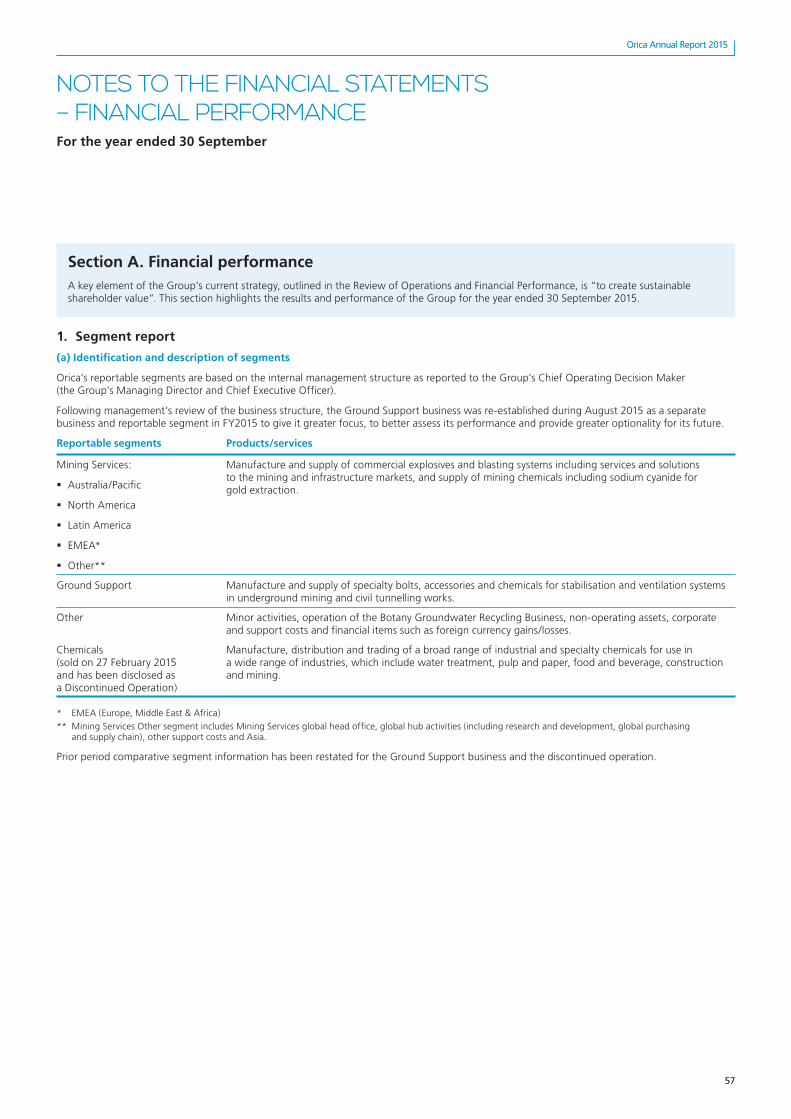
Orica’s reportable segments are based on the internal management structure as reported to the Group’s Chief Operating Decision Maker (the Group’s Managing Director and Chief Executive Officer).
Following management’s review of the business structure, the Ground Support business was re-established during August 2015 as a separate business and reportable segment in FY2015 to give it greater focus, to better assess its performance and provide greater optionality for its future.
Reportable segments Products/services
Mining Services:
� Australia/Pacific
� North America
� Latin America
� EMEA*
� Other**
Manufacture and supply of commercial explosives and blasting systems including services and solutions to the mining and infrastructure markets, and supply of mining chemicals including sodium cyanide for gold extraction.
Ground Support Manufacture and supply of specialty bolts, accessories and chemicals for stabilisation and ventilation systems in underground mining and civil tunnelling works.
Other Minor activities, operation of the Botany Groundwater Recycling Business, non-operating assets, corporate and support costs and financial items such as foreign currency gains/losses.
Chemicals (sold on 27 February 2015 and has been disclosed as a Discontinued Operation)
Manufacture, distribution and trading of a broad range of industrial and specialty chemicals for use in a wide range of industries, which include water treatment, pulp and paper, food and beverage, construction and mining.
* EMEA (Europe, Middle East & Africa)
** Mining Services Other segment includes Mining Services global head office, global hub activities (including research and development, global purchasing and supply chain), other support costs and Asia.
Prior period comparative segment information has been restated for the Ground Support business and the discontinued operation.
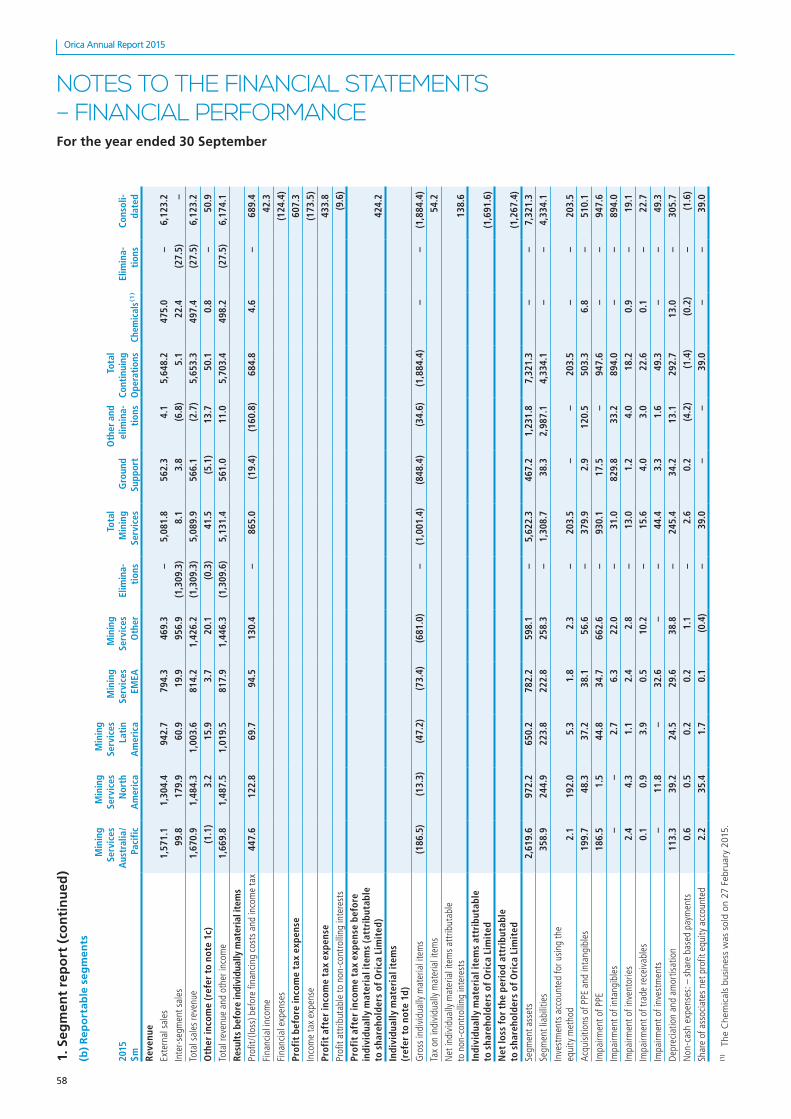
1. S
egm
ent
rep
ort
(co
nti
nu
ed)
(b)
Rep
ort
able
seg
men
ts
2015
$m
Min
ing
Serv
ices
A
ustr
alia
/Pa
cific
Min
ing
Serv
ices
N
orth
A
mer
ica
Min
ing
Serv
ices
La
tin
Am
eric
a
Min
ing
Serv
ices
EM
EA
Min
ing
Serv
ices
O
ther
Elim
ina
tion
s
Tota
l M
inin
g Se
rvic
esG
roun
d Su
ppor
t
Oth
er a
nd
elim
ina
tion
s
Tota
l Co
ntin
uing
O
pera
tions
Chem
ical
s(1)
Elim
ina
tion
sCo
nsol
ida
ted
Reve
nue
Exte
rnal
sal
es
1,57
1.1
1,30
4.4
942.
779
4.3
469.
3–
5,08
1.8
562.
34.
15,
648.
247
5.0
–6,
123.
2In
ter-s
egm
ent s
ales
99
.817
9.9
60.9
19.9
956.
9(1
,309
.3)
8.1
3.8
(6.8
)5.
122
.4(2
7.5)
–To
tal s
ales
reve
nue
1,67
0.9
1,48
4.3
1,00
3.6
814.
21,
426.
2(1
,309
.3)
5,08
9.9
566.
1(2
.7)
5,65
3.3
497.
4(2
7.5)
6,12
3.2
Oth
er in
com
e (r
efer
to
note
1c)
(1
.1)
3.2
15.9
3.7
20.1
(0.3
)41
.5(5
.1)
13.7
50.1
0.8
–50
.9To
tal r
even
ue a
nd o
ther
inco
me
1,66
9.8
1,48
7.5
1,01
9.5
817.
91,
446.
3(1
,309
.6)
5,13
1.4
561.
011
.05,
703.
449
8.2
(27.
5)6,
174.
1Re
sult
s be
fore
indi
vidu
ally
mat
eria
l ite
ms
Prof
it/(lo
ss) b
efor
e fin
anci
ng c
osts
and
inco
me
tax
447.
612
2.8
69.7
94.5
130.
4–
865.
0(1
9.4)
(160
.8)
684.
84.
6–
689.
4Fi
nanc
ial i
ncom
e 42
.3Fi
nanc
ial e
xpen
ses
(124
.4)
Prof
it b
efor
e in
com
e ta
x ex
pens
e60
7.3
Inco
me
tax
expe
nse
(173
.5)
Prof
it a
fter
inco
me
tax
expe
nse
433.
8Pr
ofit
attr
ibut
able
to n
on-c
ontr
ollin
g in
tere
sts
(9.6
)Pr
ofit
aft
er in
com
e ta
x ex
pens
e be
fore
in
divi
dual
ly m
ater
ial i
tem
s (a
ttri
buta
ble
to s
hare
hold
ers
of O
rica
Lim
ited
)42
4.2
Indi
vidu
ally
mat
eria
l ite
ms
(r
efer
to
note
1d)
Gro
ss in
divi
dual
ly m
ater
ial i
tem
s (1
86.5
)(1
3.3)
(47.
2)(7
3.4)
(681
.0)
–(1
,001
.4)
(848
.4)
(34.
6)(1
,884
.4)
––
(1,8
84.4
)Ta
x on
indi
vidu
ally
mat
eria
l ite
ms
54.2
Net
indi
vidu
ally
mat
eria
l ite
ms
attr
ibut
able
to
non
-con
trol
ling
inte
rest
s 13
8.6
Indi
vidu
ally
mat
eria
l ite
ms
attr
ibut
able
to
sha
reho
lder
s of
Ori
ca L
imit
ed
(1,6
91.6
)N
et lo
ss f
or t
he p
erio
d at
trib
utab
le
to s
hare
hold
ers
of O
rica
Lim
ited
(1
,267
.4)
Segm
ent a
sset
s 2,
619.
697
2.2
650.
278
2.2
598.
1–
5,62
2.3
467.
21,
231.
87,
321.
3–
–7,
321.
3Se
gmen
t lia
bilit
ies
358.
924
4.9
223.
822
2.8
258.
3–
1,30
8.7
38.3
2,98
7.1
4,33
4.1
––
4,33
4.1
Inve
stm
ents
acc
ount
ed fo
r usin
g th
e eq
uity
met
hod
2.1
192.
05.
31.
82.
3–
203.
5–
–20
3.5
––
203.
5Ac
quisi
tions
of P
PE a
nd in
tang
ible
s 19
9.7
48.3
37.2
38.1
56.6
–37
9.9
2.9
120.
550
3.3
6.8
–51
0.1
Impa
irmen
t of P
PE
186.
51.
544
.834
.766
2.6
–93
0.1
17.5
–94
7.6
––
947.
6Im
pairm
ent o
f int
angi
bles
–
–2.
76.
322
.0–
31.0
829.
833
.289
4.0
––
894.
0Im
pairm
ent o
f inv
ento
ries
2.4
4.3
1.1
2.4
2.8
–13
.01.
24.
018
.20.
9–
19.1
Impa
irmen
t of t
rade
rece
ivab
les
0.1
0.9
3.9
0.5
10.2
–15
.64.
03.
022
.60.
1–
22.7
Impa
irmen
t of i
nves
tmen
ts
–11
.8–
32.6
––
44.4
3.3
1.6
49.3
––
49.3
Depr
ecia
tion
and
amor
tisat
ion
113.
339
.224
.529
.638
.8–
245.
434
.213
.129
2.7
13.0
–30
5.7
Non
-cas
h ex
pens
es: –
sha
re b
ased
pay
men
ts
0.6
0.5
0.2
0.2
1.1
–2.
60.
2(4
.2)
(1.4
)(0
.2)
–(1
.6)
Shar
e of
ass
ocia
tes
net p
rofit
equ
ity a
ccou
nted
2.
235
.41.
70.
1(0
.4)
–39
.0–
–39
.0–
–39
.0
(1)
The
Ch
emic
als
bu
sin
ess
was
so
ld o
n 27
Feb
ruar
y 20
15.
58
Orica Annual Report 2015
58
Orica Annual Report 2015
NOTES TO THE FINANCIAL STATEMENTS – FINANCIAL PERFORMANCEFor the year ended 30 September
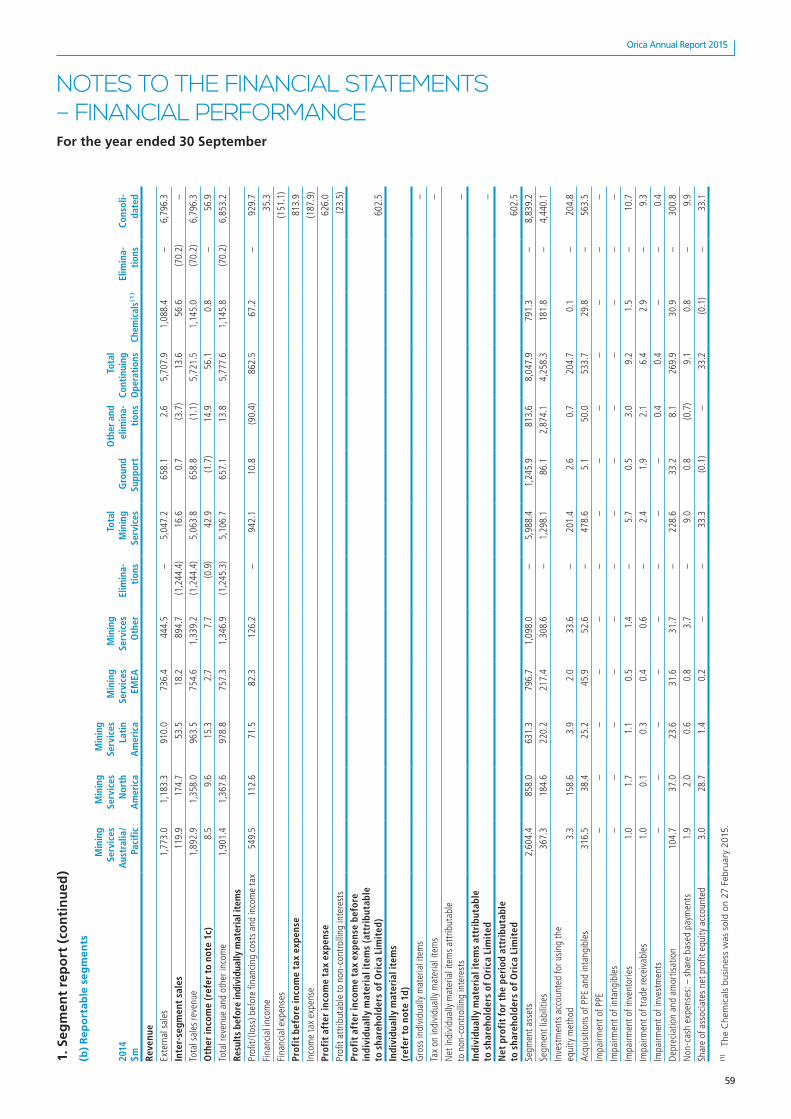
1. S
egm
ent
rep
ort
(co
nti
nu
ed)
(b)
Rep
ort
able
seg
men
ts
2014
$m
Min
ing
Serv
ices
A
ustr
alia
/Pa
cific
Min
ing
Serv
ices
N
orth
A
mer
ica
Min
ing
Serv
ices
La
tin
Am
eric
a
Min
ing
Serv
ices
EM
EA
Min
ing
Serv
ices
O
ther
Elim
ina
tion
s
Tota
l M
inin
g Se
rvic
esG
roun
d Su
ppor
t
Oth
er a
nd
elim
ina
tion
s
Tota
l Co
ntin
uing
O
pera
tions
Chem
ical
s(1)
Elim
ina
tion
sCo
nsol
ida
ted
Reve
nue
Exte
rnal
sal
es
1,77
3.0
1,18
3.3
910
.0
736.
4 4
44.5
–
5,04
7.2
658
.1 2
.6
5,70
7.9
1,08
8.4
–
6,79
6.3
Inte
rse
gmen
t sa
les
119.
9 17
4.7
53.5
18
.2
894.
7 (1
,244
.4)
16.6
0.7
(3.7
)13
.6
56.
6(7
0.2)
–
Tota
l sal
es re
venu
e 1,
892.
9 1
,358
.0 9
63.5
754
.6 1
,339
.2
(1,2
44.4
) 5,
063.
8 65
8.8
(1.1
) 5,
721.
5 1,
145.
0 (7
0.2)
6,
796.
3
Oth
er in
com
e (r
efer
to
note
1c)
8.
5 9.
6 15
.3
2.7
7.7
(0.9
) 42
.9
(1.7
) 14
.9
56.1
0.
8 –
56.9
Tota
l rev
enue
and
oth
er in
com
e 1,
901.
4 1,
367.
6 97
8.8
757.
3 1,
346.
9 (1
,245
.3)
5,10
6.7
657.
1 13
.8
5,77
7.6
1,14
5.8
(70.
2)
6,85
3.2
Resu
lts
befo
re in
divi
dual
ly m
ater
ial i
tem
sPr
ofit/
(loss
) bef
ore
finan
cing
cos
ts a
nd in
com
e ta
x54
9.5
112.
6 71
.5
82.3
12
6.2
– 94
2.1
10.8
(9
0.4)
86
2.5
67.2
–
929.
7
Fina
ncia
l inc
ome
35.3
Fina
ncia
l exp
ense
s (1
51.1
)
Prof
it b
efor
e in
com
e ta
x ex
pens
e 81
3.9
Inco
me
tax
expe
nse
(187
.9)
Prof
it a
fter
inco
me
tax
expe
nse
626.
0
Prof
it at
trib
utab
le to
non
-con
trol
ling
inte
rest
s (2
3.5)
Prof
it a
fter
inco
me
tax
expe
nse
befo
re
indi
vidu
ally
mat
eria
l ite
ms
(att
ribu
tabl
e to
sha
reho
lder
s of
Ori
ca L
imit
ed)
602.
5
Indi
vidu
ally
mat
eria
l ite
ms
(r
efer
to
note
1d)
Gro
ss in
divi
dual
ly m
ater
ial i
tem
s –
Tax
on in
divi
dual
ly m
ater
ial i
tem
s –
Net
indi
vidu
ally
mat
eria
l ite
ms
attr
ibut
able
to
non
-con
trol
ling
inte
rest
s–
Indi
vidu
ally
mat
eria
l ite
ms
attr
ibut
able
to
sha
reho
lder
s of
Ori
ca L
imit
ed–
Net
pro
fit
for
the
peri
od a
ttri
buta
ble
to s
hare
hold
ers
of O
rica
Lim
ited
60
2.5
Segm
ent a
sset
s 2,
604.
4 85
8.0
631.
3 79
6.7
1,09
8.0
– 5,
988.
4 1
,245
.9
813.
6 8,
047.
9 79
1.3
– 8,
839.
2
Segm
ent l
iabi
litie
s 36
7.3
184.
6 22
0.2
217.
4 30
8.6
– 1,
298.
1 86
.1
2,87
4.1
4,25
8.3
181.
8 –
4,44
0.1
Inve
stm
ents
acc
ount
ed fo
r usin
g th
e eq
uity
met
hod
3.3
158.
6 3.
9 2.
0 33
.6
– 20
1.4
2.6
0.7
204.
7 0.
1 –
204.
8
Acqu
isitio
ns o
f PPE
and
inta
ngib
les
316.
5 38
.4
25.2
45
.9
52.6
–
478.
6 5.
1 50
.0
533.
7 29
.8
– 56
3.5
Impa
irmen
t of P
PE –
–
– –
– –
– –
– –
– –
–
Impa
irmen
t of i
ntan
gibl
es
– –
– –
– –
– –
– –
– –
–
Impa
irmen
t of i
nven
torie
s 1.
0 1.
7 1.
1 0.
5 1.
4 –
5.7
0.5
3.0
9.2
1.5
– 10
.7
Impa
irmen
t of t
rade
rece
ivab
les
1.0
0.1
0.3
0.4
0.6
– 2.
4 1.
9 2.
1 6.
4 2.
9 –
9.3
Impa
irmen
t of i
nves
tmen
ts –
–
– –
– –
– –
0.4
0.4
– –
0.4
Depr
ecia
tion
and
amor
tisat
ion
104.
7 37
.0
23.6
31
.6
31.7
–
228.
6 33
.2
8.1
269.
9 30
.9
– 30
0.8
Non
-cas
h ex
pens
es: –
sha
re b
ased
pay
men
ts
1.9
2.0
0.6
0.8
3.7
– 9.
0 0.
8 (0
.7)
9.1
0.8
– 9.
9
Shar
e of
ass
ocia
tes
net p
rofit
equ
ity a
ccou
nted
3.
0 28
.7
1.4
0.2
– –
33.3
(0
.1)
– 33
.2
(0.1
) –
33.1
(1)
The
Ch
emic
als
bu
sin
ess
was
so
ld o
n 27
Feb
ruar
y 20
15.
59
Orica Annual Report 2015
59
Orica Annual Report 2015
NOTES TO THE FINANCIAL STATEMENTS – FINANCIAL PERFORMANCEFor the year ended 30 September
60
Orica Annual Report 2015
60
Orica Annual Report 2015
NOTES TO THE FINANCIAL STATEMENTS – FINANCIAL PERFORMANCEFor the year ended 30 September
1. Segment report (continued)
Consolidated
2015 $m
2014 $m
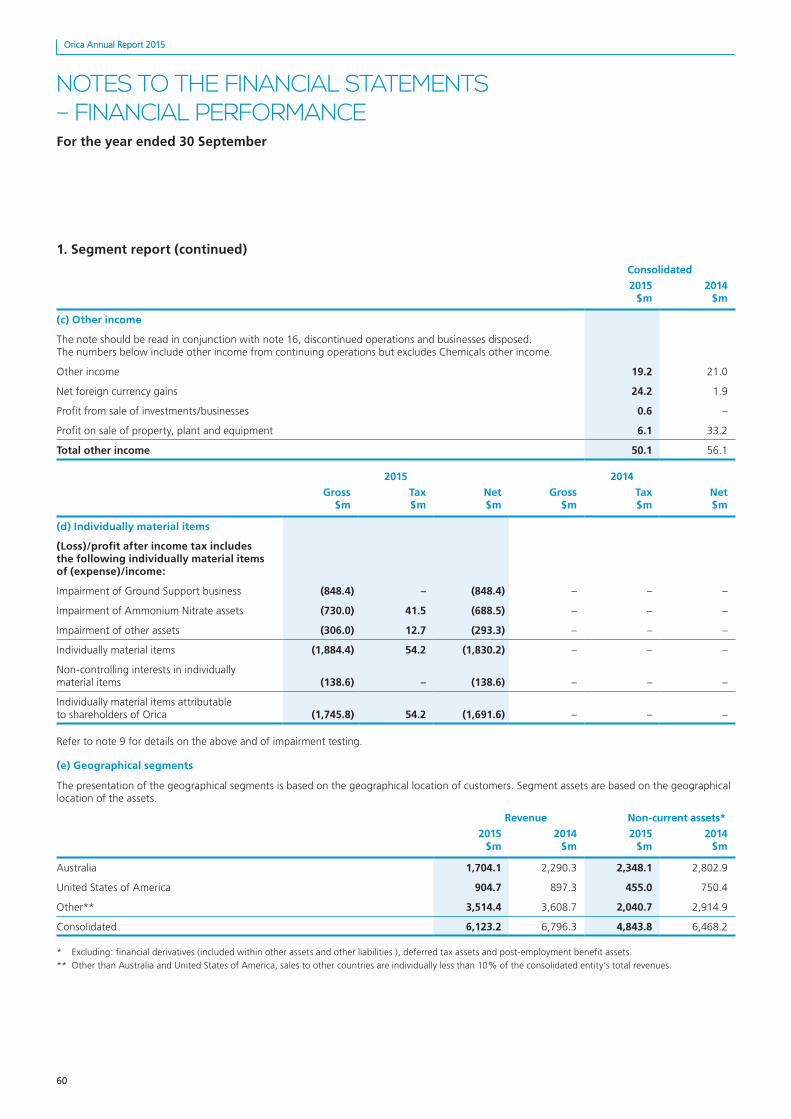
(c) Other income
The note should be read in conjunction with note 16, discontinued operations and businesses disposed. The numbers below include other income from continuing operations but excludes Chemicals other income.
Other income 19.2 21.0
Net foreign currency gains 24.2 1.9
Profit from sale of investments/businesses 0.6 –
Profit on sale of property, plant and equipment 6.1 33.2
Total other income 50.1 56.1
2015 2014
Gross $m
Tax $m
Net $m
Gross $m
Tax $m
Net $m
(d) Individually material items
(Loss)/profit after income tax includes the following individually material items of (expense)/income:
Impairment of Ground Support business (848.4) – (848.4) – – –
Impairment of Ammonium Nitrate assets (730.0) 41.5 (688.5) – – –
Impairment of other assets (306.0) 12.7 (293.3) – – –
Individually material items (1,884.4) 54.2 (1,830.2) – – –
Non-controlling interests in individually material items (138.6) – (138.6) – – –
Individually material items attributable to shareholders of Orica (1,745.8) 54.2 (1,691.6) – – –
Refer to note 9 for details on the above and of impairment testing.
(e) Geographical segments
The presentation of the geographical segments is based on the geographical location of customers. Segment assets are based on the geographical location of the assets.
Revenue Non-current assets*
2015 $m
2014 $m
2015 $m
2014 $m
Australia 1,704.1 2,290.3 2,348.1 2,802.9
United States of America 904.7 897.3 455.0 750.4
Other** 3,514.4 3,608.7 2,040.7 2,914.9
Consolidated 6,123.2 6,796.3 4,843.8 6,468.2
* Excluding: financial derivatives (included within other assets and other liabilities ), deferred tax assets and post-employment benefit assets.
** Other than Australia and United States of America, sales to other countries are individually less than 10% of the consolidated entity’s total revenues.
61
Orica Annual Report 2015
61
Orica Annual Report 2015
NOTES TO THE FINANCIAL STATEMENTS – FINANCIAL PERFORMANCEFor the year ended 30 September
1. Segment report (continued)
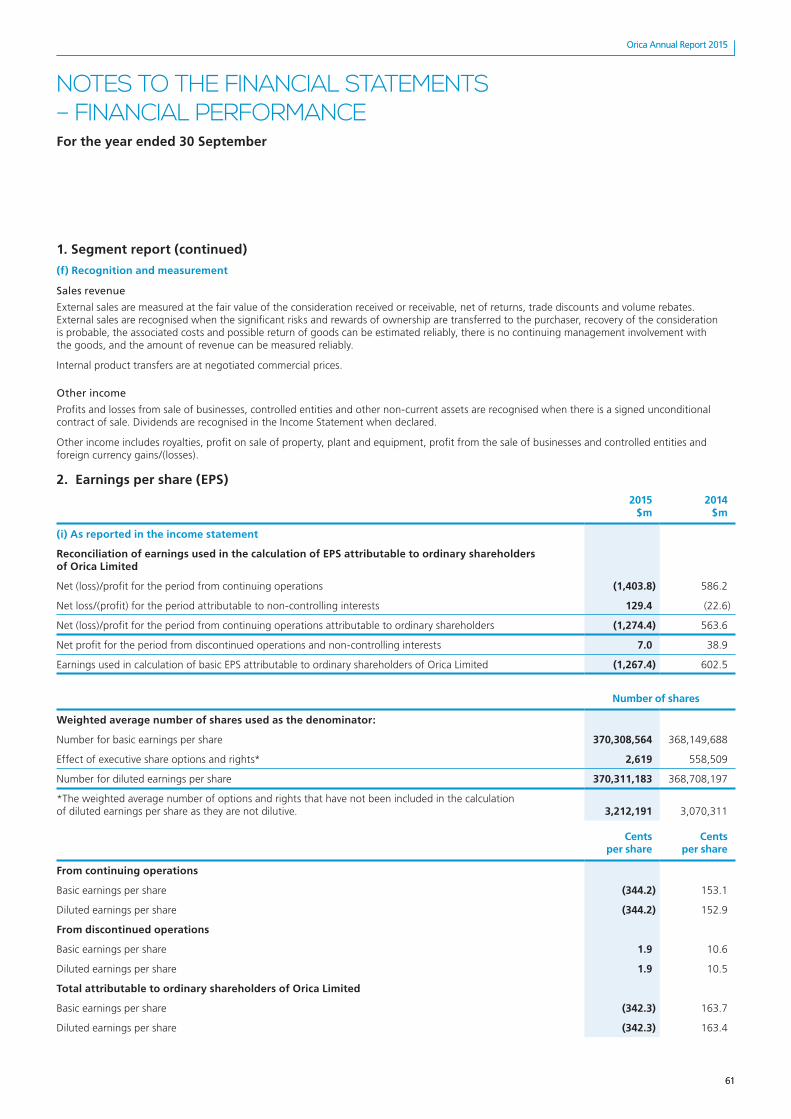
(f) Recognition and measurement
Sales revenue
External sales are measured at the fair value of the consideration received or receivable, net of returns, trade discounts and volume rebates. External sales are recognised when the significant risks and rewards of ownership are transferred to the purchaser, recovery of the consideration is probable, the associated costs and possible return of goods can be estimated reliably, there is no continuing management involvement with the goods, and the amount of revenue can be measured reliably.
Internal product transfers are at negotiated commercial prices.
Other income
Profits and losses from sale of businesses, controlled entities and other non-current assets are recognised when there is a signed unconditional contract of sale. Dividends are recognised in the Income Statement when declared.
Other income includes royalties, profit on sale of property, plant and equipment, profit from the sale of businesses and controlled entities and foreign currency gains/(losses).
2. Earnings per share (EPS)
2015 $m
2014 $m
(i) As reported in the income statement
Reconciliation of earnings used in the calculation of EPS attributable to ordinary shareholders of Orica Limited
Net (loss)/profit for the period from continuing operations (1,403.8) 586.2
Net loss/(profit) for the period attributable to non-controlling interests 129.4 (22.6)
Net (loss)/profit for the period from continuing operations attributable to ordinary shareholders (1,274.4) 563.6
Net profit for the period from discontinued operations and non-controlling interests 7.0 38.9
Earnings used in calculation of basic EPS attributable to ordinary shareholders of Orica Limited (1,267.4) 602.5
Number of shares
Weighted average number of shares used as the denominator:
Number for basic earnings per share 370,308,564 368,149,688
Effect of executive share options and rights* 2,619 558,509
Number for diluted earnings per share 370,311,183 368,708,197
*The weighted average number of options and rights that have not been included in the calculation of diluted earnings per share as they are not dilutive. 3,212,191 3,070,311
Cents per share
Cents per share
From continuing operations
Basic earnings per share (344.2) 153.1
Diluted earnings per share (344.2) 152.9
From discontinued operations
Basic earnings per share 1.9 10.6
Diluted earnings per share 1.9 10.5
Total attributable to ordinary shareholders of Orica Limited
Basic earnings per share (342.3) 163.7
Diluted earnings per share (342.3) 163.4
62
Orica Annual Report 2015
62
Orica Annual Report 2015
NOTES TO THE FINANCIAL STATEMENTS – FINANCIAL PERFORMANCEFor the year ended 30 September
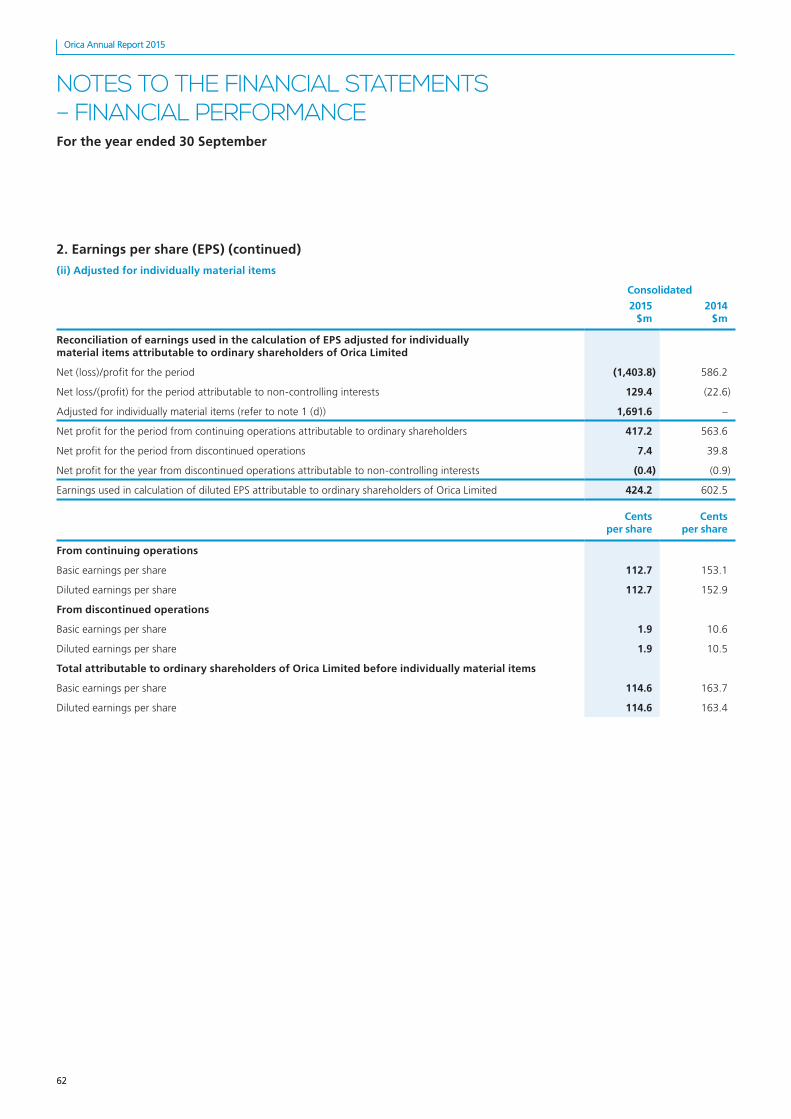
2. Earnings per share (EPS) (continued)
(ii) Adjusted for individually material items
Consolidated
2015 $m
2014 $m
Reconciliation of earnings used in the calculation of EPS adjusted for individually material items attributable to ordinary shareholders of Orica Limited
Net (loss)/profit for the period (1,403.8) 586.2
Net loss/(profit) for the period attributable to non-controlling interests 129.4 (22.6)
Adjusted for individually material items (refer to note 1 (d)) 1,691.6 –
Net profit for the period from continuing operations attributable to ordinary shareholders 417.2 563.6
Net profit for the period from discontinued operations 7.4 39.8
Net profit for the year from discontinued operations attributable to non-controlling interests (0.4) (0.9)
Earnings used in calculation of diluted EPS attributable to ordinary shareholders of Orica Limited 424.2 602.5
Cents per share
Cents per share
From continuing operations
Basic earnings per share 112.7 153.1
Diluted earnings per share 112.7 152.9
From discontinued operations
Basic earnings per share 1.9 10.6
Diluted earnings per share 1.9 10.5
Total attributable to ordinary shareholders of Orica Limited before individually material items
Basic earnings per share 114.6 163.7
Diluted earnings per share 114.6 163.4

63
Orica Annual Report 2015
63
Orica Annual Report 2015
NOTES TO THE FINANCIAL STATEMENTS – CAPITAL MANAGEMENTFor the year ended 30 September
Section B. Capital managementOrica’s objectives when managing capital (net debt and total equity) are to safeguard the Group’s ability to continue as a going concern and to ensure that the capital structure enhances, protects and balances financial flexibility against minimising the cost of capital. This section outlines the principal capital management initiatives that have been undertaken.
3. Net debt
In order to maintain the appropriate capital structure, the Group may adjust the amount of dividends paid to shareholders, utilise a dividend reinvestment plan, return capital to shareholders such as a share buy-back or issue new equity, in addition to incurring an appropriate mix of borrowings. Currently, Orica’s dividend policy is to pay a progressive dividend.
Orica monitors capital on the basis of the accounting gearing ratio. In addition, Orica monitors various other credit metrics, principally an interest cover ratio (EBIT excluding individually material items, divided by net financing costs adjusted for capitalised borrowing cost) and funds from operations (FFO) divided by a total debt measure.
The Group’s current target level for gearing is 35% to 45% and for interest cover is 5 times or greater. These, together with an appropriate FFO/total debt measure, are targeted to maintain a strong investment grade credit profile, which should facilitate access to borrowings from a diverse range of sources. Ratios may move outside of these target ranges for relatively short periods of time after major acquisitions or other significant transactions.
The gearing level and interest cover are also monitored to ensure an adequate buffer against covenant levels under various facilities.
The gearing ratio is calculated as follows: Consolidated2015
$m2014
$m
Interest bearing liabilities (refer to note 3a) 2,300.0 2,499.9
less cash and cash equivalents (refer to note 3b) (273.9) (263.2)
Net debt 2,026.1 2,236.7
Total equity 2,987.2 4,399.1
Net debt and total equity 5,013.3 6,635.8
Gearing ratio (%) 40.4% 33.7%
The interest ratio is calculated as follows:
EBIT (excluding individually material items) 689.4 929.7
Net financing costs 82.1 115.8
Capitalised borrowing costs 36.7 27.6
118.8 143.4
Interest cover ratio (times) 5.8 6.5
Consolidated Consolidated Consolidated2015
$m2014
$m 2015
$m2014
$m2015
$m2014
$mCurrent Non-current Total
(a) Interest bearing liabilities
Unsecured
private placement(1) 121.3 267.1 1,916.0 1,680.6 2,037.3 1,947.7
export finance facility(2) 16.8 13.4 66.8 67.2 83.6 80.6
other loans 17.6 260.9 156.3 205.4 173.9 466.3
Lease liabilities 1.5 1.3 3.7 4.0 5.2 5.3
157.2 542.7 2,142.8 1,957.2 2,300.0 2,499.9
(1) Orica Limited provides guarantees on these facilities refer to note 17 for further details.(2) $9.7m (2014 $20.1m) of property, plant and equipment is pledged as security for finance leases. In the event of default by Orica, the rights to the leased assets
transfer to the lessor.
During the current and prior year, there were no defaults or breaches of covenants on any loans.
64
Orica Annual Report 2015
64
Orica Annual Report 2015
NOTES TO THE FINANCIAL STATEMENTS – CAPITAL MANAGEMENTFor the year ended 30 September
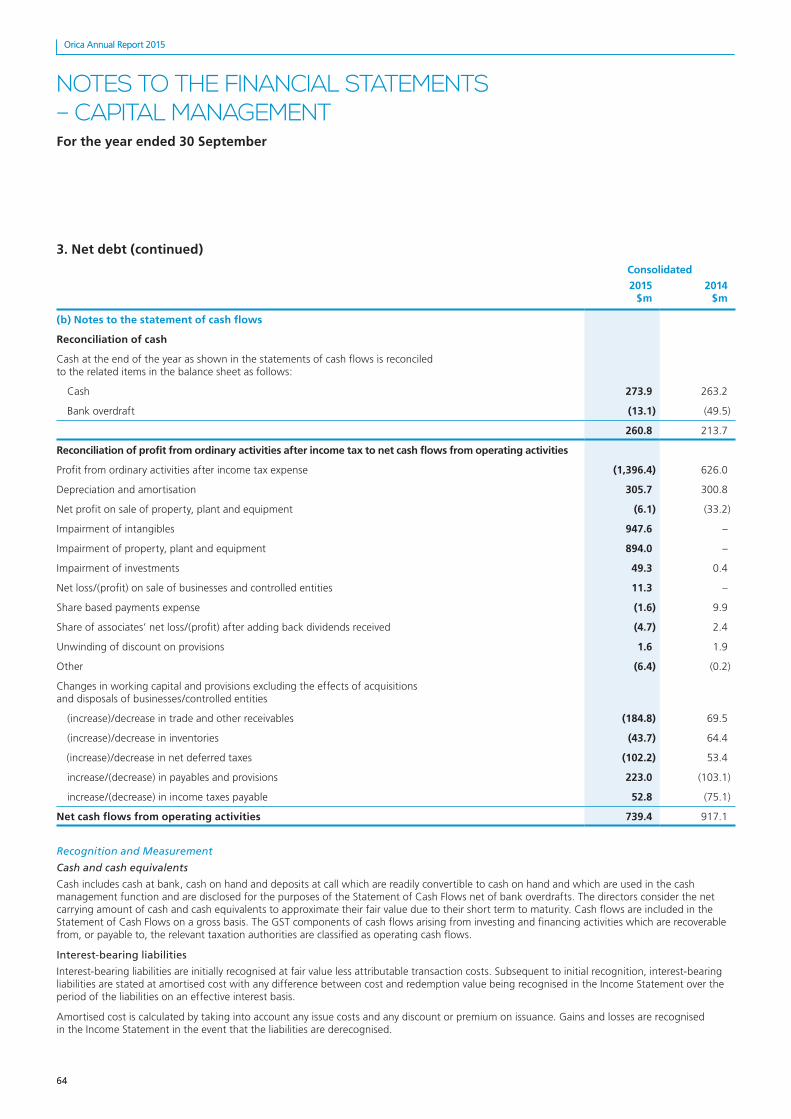
3. Net debt (continued)
Consolidated
2015 $m
2014 $m
(b) Notes to the statement of cash flows
Reconciliation of cash
Cash at the end of the year as shown in the statements of cash flows is reconciled to the related items in the balance sheet as follows:
Cash 273.9 263.2
Bank overdraft (13.1) (49.5)
260.8 213.7
Reconciliation of profit from ordinary activities after income tax to net cash flows from operating activities
Profit from ordinary activities after income tax expense (1,396.4) 626.0
Depreciation and amortisation 305.7 300.8
Net profit on sale of property, plant and equipment (6.1) (33.2)
Impairment of intangibles 947.6 –
Impairment of property, plant and equipment 894.0 –
Impairment of investments 49.3 0.4
Net loss/(profit) on sale of businesses and controlled entities 11.3 –
Share based payments expense (1.6) 9.9
Share of associates’ net loss/(profit) after adding back dividends received (4.7) 2.4
Unwinding of discount on provisions 1.6 1.9
Other (6.4) (0.2)
Changes in working capital and provisions excluding the effects of acquisitions and disposals of businesses/controlled entities
(increase)/decrease in trade and other receivables (184.8) 69.5
(increase)/decrease in inventories (43.7) 64.4
(increase)/decrease in net deferred taxes (102.2) 53.4
increase/(decrease) in payables and provisions 223.0 (103.1)
increase/(decrease) in income taxes payable 52.8 (75.1)
Net cash flows from operating activities 739.4 917.1
Recognition and Measurement
Cash and cash equivalents
Cash includes cash at bank, cash on hand and deposits at call which are readily convertible to cash on hand and which are used in the cash management function and are disclosed for the purposes of the Statement of Cash Flows net of bank overdrafts. The directors consider the net carrying amount of cash and cash equivalents to approximate their fair value due to their short term to maturity. Cash flows are included in the Statement of Cash Flows on a gross basis. The GST components of cash flows arising from investing and financing activities which are recoverable from, or payable to, the relevant taxation authorities are classified as operating cash flows.
Interest-bearing liabilities
Interest-bearing liabilities are initially recognised at fair value less attributable transaction costs. Subsequent to initial recognition, interest-bearing liabilities are stated at amortised cost with any difference between cost and redemption value being recognised in the Income Statement over the period of the liabilities on an effective interest basis.
Amortised cost is calculated by taking into account any issue costs and any discount or premium on issuance. Gains and losses are recognised in the Income Statement in the event that the liabilities are derecognised.

65
Orica Annual Report 2015
65
Orica Annual Report 2015
NOTES TO THE FINANCIAL STATEMENTS – CAPITAL MANAGEMENTFor the year ended 30 September
3. Net debt (continued)
Borrowing costs
Borrowing costs include interest, unwinding of the effect of discounting on provisions, amortisation of discounts or premiums relating to borrowings and amortisation of ancillary costs incurred in connection with the arrangement of borrowings, including lease finance charges. Borrowing costs are expensed as incurred unless they relate to qualifying assets. Where funds are borrowed specifically for the production of a qualifying asset, the interest on those funds is capitalised, net of any interest earned on those borrowings. Where funds are borrowed generally, borrowing costs are capitalised using a weighted average interest rate.
4. Contributed Equity and Reserves
(a) Contributed Equity
On 2 March 2015 Orica announced a market share buy-back program of up to $400 million over 12 months. On 7 August 2015 Orica announced it was reviewing the on-market share buy-back and the program was cancelled on 18 November 2015. $53.5m of shares were bought back during the financial year and have been proportionally allocated to ordinary shares and retained earnings.
Movements in issued and fully paid shares of Orica since 1 October 2013 were as follows:
Details DateNumber
of shares Issue price
$ $m
Ordinary shares
Opening balance of ordinary shares issued 1-Oct-13 368,203,632 1,877.9
Shares issued under the Orica dividend reinvestment plan 13-Dec-13 2,051,377 23.11 47.4
Shares issued under the Orica dividend reinvestment plan 1-Jul-14 1,818,929 19.03 34.5
Share movements under the Orica LTEIP plan (refer to Note 19):
– Shares issued 21-Feb-14 669,353 24.25 –
– Shares Issued – loan repayment Various – – 13.9
Shares issued under the Orica GEESP plan – 1.3
Balance at the end of year 30-Sep-14 372,743,291 1,975.0
Share movements under market share buy-back Various (2,629,765) (21.7)
Shares issued under the Orica GEESP plan – 1.1
Balance at the end of year 30-Sep-15 370,113,526 1,954.4
Recognition and Measurement
When share capital recognised as equity is repurchased, the amount of the consideration paid, including directly attributable costs, is recognised as a deduction from total equity and net of any related income tax benefit.
(b) Reserves
Recognition and Measurement
Foreign currency translation reserve
The foreign currency translation reserve records the foreign currency differences arising from the translation of foreign operations, the translation of transactions that hedge net investment in a foreign operation or the translation of foreign currency monetary items forming part of the net investment in a foreign operation.

66
Orica Annual Report 2015
66
Orica Annual Report 2015
NOTES TO THE FINANCIAL STATEMENTS – CAPITAL MANAGEMENTFor the year ended 30 September
4. Contributed Equity and Reserves (continued)
(c) Dividends
Consolidated
2015 $m
2014 $m
Dividends paid or declared in respect of the year ended 30 September were:
Ordinary shares
interim dividend of 40 cents per share, 40% franked at 30%, paid 1 July 2014 147.6
interim dividend of 40 cents per share, 35.0 % franked at 30%, paid 1 July 2015 148.0
final dividend of 55 cents per s hare, 100% franked at 30%, paid 13 December 2013 201.7
final dividend of 56 cents per s hare, 35.7% franked at 30%, paid 19 December 2014 208.1
Dividends paid in cash or satisfied by the issue of shares under the dividend reinvestment plan (DRP) during the year were as follows:
paid in cash 289.2 267.4
DRP – satisfied by issue of shares – 81.9
DRP – satisfied by the purchase of shares on open market 66.9 –
Subsequent events
Since the end of the financial year, the directors declared the following dividend:
Final dividend on ordinary shares of 56.0 cents per share, 35.7% franked at 30%, payable 18 December 2015.
Total franking credits related to this dividend are $31.7 million (2014 $31.9 million).
The financial effect of the final dividend on ordinary shares has not been brought to account in the financial statements for the year ended 30 September 2015 – however will be recognised in the 2016 annual financial report.
Franking credits
Franking credits available at the 30% corporate tax rate after allowing for tax payable in respect of the current year’s profit and the payment of the final dividend for 2015 are $5.8 million (2014 Nil).
67
Orica Annual Report 2015
67
Orica Annual Report 2015
NOTES TO THE FINANCIAL STATEMENTS – OPERATING ASSETS AND LIABILITIESFor the year ended 30 September
Section C. Operating assets and liabilitiesThis section highlights current year drivers of the Group’s cash flows, as well as the key operating assets used and liabilities incurred to support delivering financial performance.
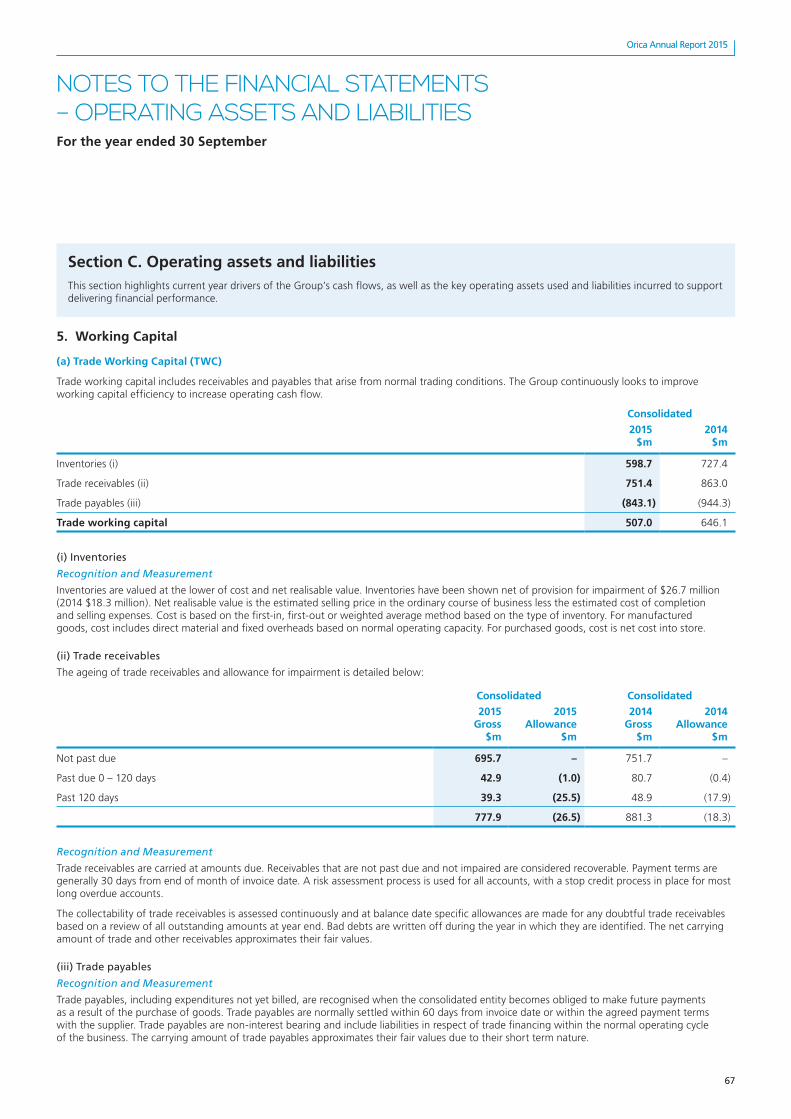
5. Working Capital
(a) Trade Working Capital (TWC)
Trade working capital includes receivables and payables that arise from normal trading conditions. The Group continuously looks to improve working capital efficiency to increase operating cash flow.
Consolidated
2015 $m
2014 $m
Inventories (i) 598.7 727.4
Trade receivables (ii) 751.4 863.0
Trade payables (iii) (843.1) (944.3)
Trade working capital 507.0 646.1
(i) Inventories
Recognition and Measurement
Inventories are valued at the lower of cost and net realisable value. Inventories have been shown net of provision for impairment of $26.7 million (2014 $18.3 million). Net realisable value is the estimated selling price in the ordinary course of business less the estimated cost of completion and selling expenses. Cost is based on the first-in, first-out or weighted average method based on the type of inventory. For manufactured goods, cost includes direct material and fixed overheads based on normal operating capacity. For purchased goods, cost is net cost into store.
(ii) Trade receivables
The ageing of trade receivables and allowance for impairment is detailed below:
Consolidated Consolidated
2015 Gross
$m
2015 Allowance
$m
2014 Gross
$m
2014 Allowance
$m
Not past due 695.7 – 751.7 –
Past due 0 – 120 days 42.9 (1.0) 80.7 (0.4)
Past 120 days 39.3 (25.5) 48.9 (17.9)
777.9 (26.5) 881.3 (18.3)
Recognition and Measurement
Trade receivables are carried at amounts due. Receivables that are not past due and not impaired are considered recoverable. Payment terms are generally 30 days from end of month of invoice date. A risk assessment process is used for all accounts, with a stop credit process in place for most long overdue accounts.
The collectability of trade receivables is assessed continuously and at balance date specific allowances are made for any doubtful trade receivables based on a review of all outstanding amounts at year end. Bad debts are written off during the year in which they are identified. The net carrying amount of trade and other receivables approximates their fair values.
(iii) Trade payables
Recognition and Measurement
Trade payables, including expenditures not yet billed, are recognised when the consolidated entity becomes obliged to make future payments as a result of the purchase of goods. Trade payables are normally settled within 60 days from invoice date or within the agreed payment terms with the supplier. Trade payables are non-interest bearing and include liabilities in respect of trade financing within the normal operating cycle of the business. The carrying amount of trade payables approximates their fair values due to their short term nature.
68
Orica Annual Report 2015
68
Orica Annual Report 2015
NOTES TO THE FINANCIAL STATEMENTS – OPERATING ASSETS AND LIABILITIESFor the year ended 30 September
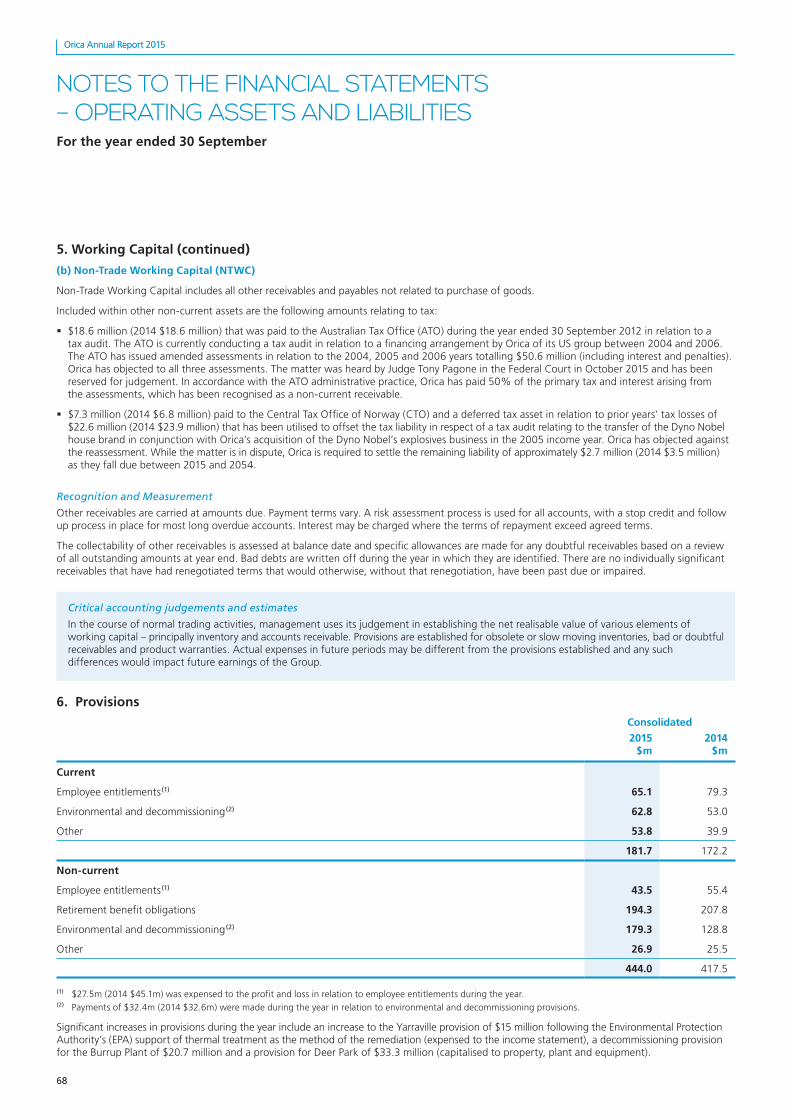
5. Working Capital (continued)
(b) Non-Trade Working Capital (NTWC)
Non-Trade Working Capital includes all other receivables and payables not related to purchase of goods.
Included within other non-current assets are the following amounts relating to tax:
� $18.6 million (2014 $18.6 million) that was paid to the Australian Tax Office (ATO) during the year ended 30 September 2012 in relation to a tax audit. The ATO is currently conducting a tax audit in relation to a financing arrangement by Orica of its US group between 2004 and 2006. The ATO has issued amended assessments in relation to the 2004, 2005 and 2006 years totalling $50.6 million (including interest and penalties). Orica has objected to all three assessments. The matter was heard by Judge Tony Pagone in the Federal Court in October 2015 and has been reserved for judgement. In accordance with the ATO administrative practice, Orica has paid 50% of the primary tax and interest arising from the assessments, which has been recognised as a non-current receivable.
� $7.3 million (2014 $6.8 million) paid to the Central Tax Office of Norway (CTO) and a deferred tax asset in relation to prior years’ tax losses of $22.6 million (2014 $23.9 million) that has been utilised to offset the tax liability in respect of a tax audit relating to the transfer of the Dyno Nobel house brand in conjunction with Orica’s acquisition of the Dyno Nobel’s explosives business in the 2005 income year. Orica has objected against the reassessment. While the matter is in dispute, Orica is required to settle the remaining liability of approximately $2.7 million (2014 $3.5 million) as they fall due between 2015 and 2054.
Recognition and Measurement
Other receivables are carried at amounts due. Payment terms vary. A risk assessment process is used for all accounts, with a stop credit and follow up process in place for most long overdue accounts. Interest may be charged where the terms of repayment exceed agreed terms.
The collectability of other receivables is assessed at balance date and specific allowances are made for any doubtful receivables based on a review of all outstanding amounts at year end. Bad debts are written off during the year in which they are identified. There are no individually significant receivables that have had renegotiated terms that would otherwise, without that renegotiation, have been past due or impaired.
Critical accounting judgements and estimates
In the course of normal trading activities, management uses its judgement in establishing the net realisable value of various elements of working capital – principally inventory and accounts receivable. Provisions are established for obsolete or slow moving inventories, bad or doubtful receivables and product warranties. Actual expenses in future periods may be different from the provisions established and any such differences would impact future earnings of the Group.
6. Provisions
Consolidated
2015 $m
2014 $m
Current
Employee entitlements (1) 65.1 79.3
Environmental and decommissioning (2) 62.8 53.0
Other 53.8 39.9
181.7 172.2
Non-current
Employee entitlements (1) 43.5 55.4
Retirement benefit obligations 194.3 207.8
Environmental and decommissioning (2) 179.3 128.8
Other 26.9 25.5
444.0 417.5
(1) $27.5m (2014 $45.1m) was expensed to the profit and loss in relation to employee entitlements during the year.(2) Payments of $32.4m (2014 $32.6m) were made during the year in relation to environmental and decommissioning provisions.
Significant increases in provisions during the year include an increase to the Yarraville provision of $15 million following the Environmental Protection Authority’s (EPA) support of thermal treatment as the method of the remediation (expensed to the income statement), a decommissioning provision for the Burrup Plant of $20.7 million and a provision for Deer Park of $33.3 million (capitalised to property, plant and equipment).
69
Orica Annual Report 2015
69
Orica Annual Report 2015
NOTES TO THE FINANCIAL STATEMENTS – OPERATING ASSETS AND LIABILITIESFor the year ended 30 September
6. Provisions (continued)
Recognition and Measurement
A provision is recognised when there is a legal or constructive obligation as a result of a past event, it is probable that a future sacrifice of economic benefits will be required to settle the obligation, the timing or amount of which is uncertain and a reliable estimate of the liability can be assessed. If the effect is material, a provision is determined by discounting the expected future cash flows (adjusted for expected future risks) required to settle the obligation at a rate that reflects current market assessments of the time value of money and the risks specific to the liability. The unwinding of the effect of discounting on provisions is recognised as a borrowing cost.
Employee entitlements
Provisions are made for liabilities to employees for annual leave, sick leave and other employee entitlements that represent the amount for which the consolidated entity has a present obligation. These have been calculated at nominal amounts based on the wage and salary rates that the consolidated entity expects to pay as at each reporting date and include related on-costs. Liabilities for employee entitlements which are not expected to be settled within twelve months of balance date, are accrued at the present value of future amounts expected to be paid.
The present value is determined using interest rates applicable to high quality Corporate and Government bonds with maturities approximating the terms of the consolidated entity’s obligations.
A liability is recognised for bonus plans on the achievement of predetermined bonus targets and the benefit calculations are formally documented and determined before signing the financial report.
Environmental
Estimated costs for the remediation of soil, groundwater and untreated waste that have arisen as a result of past events are provided for where a legal or constructive obligation exists and a reliable estimate of the liability can be assessed.
Where the cost relates to land held for resale then, to the extent that the expected realisation exceeds both the book value of the land and the estimated cost of remediation, the cost is capitalised as part of the holding value of that land, otherwise it is expensed.
Decommissioning
The present value of the estimated costs of dismantling and removing an asset and restoring the site on which it is located are recognised as an asset within property, plant and equipment which is depreciated on a straight line basis over its estimated useful life and a corresponding provision is raised where a legal or constructive obligation exists. At each reporting date, the liability is remeasured in line with changes in discount rates, timing and estimated cash flows. Any changes in the liability are added or deducted from the related asset, other than the unwinding of the discount which is recognised as borrowing costs in the Income Statement.
Contingent environmental liabilities
In the normal course of business, contingent liabilities may arise from environmental liabilities connected with current or former sites. Where management are of the view that potential liabilities have a low probability of crystallising or it is not possible to quantify them reliably, they are disclosed as contingent liabilities.
In accordance with the current accounting policy, for sites where the requirements have been assessed and are capable of reliable measurement, estimated regulatory and remediation costs have been capitalised, expensed as incurred or provided for. For environmental matters where there are significant uncertainties with respect to the extent of Orica’s remediation obligations or the remediation techniques that might be approved, no reliable estimate can presently be made of regulatory and remediation costs and any costs are expensed as incurred.
There can be no assurance that new information or regulatory requirements with respect to known sites or the identification of new remedial obligations at other sites will not require additional future provisions for environmental remediation and such provisions could be material.
Orica has entered into arrangements with the relevant regulatory authorities for a number of sites to investigate land and groundwater contamination and, where appropriate, undertake voluntary remediation activities on these sites. Where reliable estimates are possible and remediation techniques have been identified for these sites, provisions have been established in accordance with current accounting policy.
Orica is investigating suitable remediation options for Dense Non-Aqueous Phase Liquid (DNAPL) source areas at Botany giving rise to the groundwater contamination which is being treated by the Groundwater Treatment Plant. No provision has been established for remediation activities in respect of DNAPL as a reliable estimate is not possible at this time.
70
Orica Annual Report 2015
70
Orica Annual Report 2015
NOTES TO THE FINANCIAL STATEMENTS – OPERATING ASSETS AND LIABILITIESFor the year ended 30 September
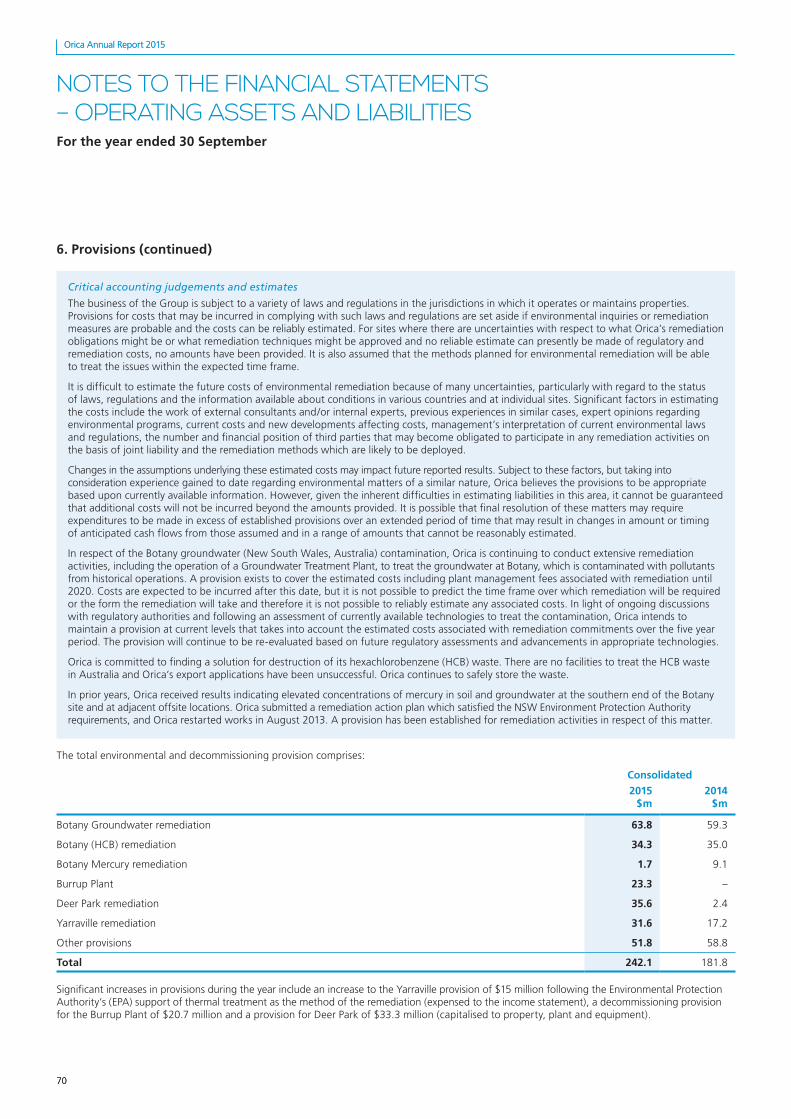
6. Provisions (continued)
Critical accounting judgements and estimates
The business of the Group is subject to a variety of laws and regulations in the jurisdictions in which it operates or maintains properties. Provisions for costs that may be incurred in complying with such laws and regulations are set aside if environmental inquiries or remediation measures are probable and the costs can be reliably estimated. For sites where there are uncertainties with respect to what Orica’s remediation obligations might be or what remediation techniques might be approved and no reliable estimate can presently be made of regulatory and remediation costs, no amounts have been provided. It is also assumed that the methods planned for environmental remediation will be able to treat the issues within the expected time frame.
It is difficult to estimate the future costs of environmental remediation because of many uncertainties, particularly with regard to the status of laws, regulations and the information available about conditions in various countries and at individual sites. Significant factors in estimating the costs include the work of external consultants and/or internal experts, previous experiences in similar cases, expert opinions regarding environmental programs, current costs and new developments affecting costs, management’s interpretation of current environmental laws and regulations, the number and financial position of third parties that may become obligated to participate in any remediation activities on the basis of joint liability and the remediation methods which are likely to be deployed.
Changes in the assumptions underlying these estimated costs may impact future reported results. Subject to these factors, but taking into consideration experience gained to date regarding environmental matters of a similar nature, Orica believes the provisions to be appropriate based upon currently available information. However, given the inherent difficulties in estimating liabilities in this area, it cannot be guaranteed that additional costs will not be incurred beyond the amounts provided. It is possible that final resolution of these matters may require expenditures to be made in excess of established provisions over an extended period of time that may result in changes in amount or timing of anticipated cash flows from those assumed and in a range of amounts that cannot be reasonably estimated.
In respect of the Botany groundwater (New South Wales, Australia) contamination, Orica is continuing to conduct extensive remediation activities, including the operation of a Groundwater Treatment Plant, to treat the groundwater at Botany, which is contaminated with pollutants from historical operations. A provision exists to cover the estimated costs including plant management fees associated with remediation until 2020. Costs are expected to be incurred after this date, but it is not possible to predict the time frame over which remediation will be required or the form the remediation will take and therefore it is not possible to reliably estimate any associated costs. In light of ongoing discussions with regulatory authorities and following an assessment of currently available technologies to treat the contamination, Orica intends to maintain a provision at current levels that takes into account the estimated costs associated with remediation commitments over the five year period. The provision will continue to be re-evaluated based on future regulatory assessments and advancements in appropriate technologies.
Orica is committed to finding a solution for destruction of its hexachlorobenzene (HCB) waste. There are no facilities to treat the HCB waste in Australia and Orica’s export applications have been unsuccessful. Orica continues to safely store the waste.
In prior years, Orica received results indicating elevated concentrations of mercury in soil and groundwater at the southern end of the Botany site and at adjacent offsite locations. Orica submitted a remediation action plan which satisfied the NSW Environment Protection Authority requirements, and Orica restarted works in August 2013. A provision has been established for remediation activities in respect of this matter.
The total environmental and decommissioning provision comprises:
Consolidated
2015 $m
2014 $m
Botany Groundwater remediation 63.8 59.3
Botany (HCB) remediation 34.3 35.0
Botany Mercury remediation 1.7 9.1
Burrup Plant 23.3 –
Deer Park remediation 35.6 2.4
Yarraville remediation 31.6 17.2
Other provisions 51.8 58.8
Total 242.1 181.8
Significant increases in provisions during the year include an increase to the Yarraville provision of $15 million following the Environmental Protection Authority’s (EPA) support of thermal treatment as the method of the remediation (expensed to the income statement), a decommissioning provision for the Burrup Plant of $20.7 million and a provision for Deer Park of $33.3 million (capitalised to property, plant and equipment).
71
Orica Annual Report 2015
71
Orica Annual Report 2015
NOTES TO THE FINANCIAL STATEMENTS – OPERATING ASSETS AND LIABILITIESFor the year ended 30 September
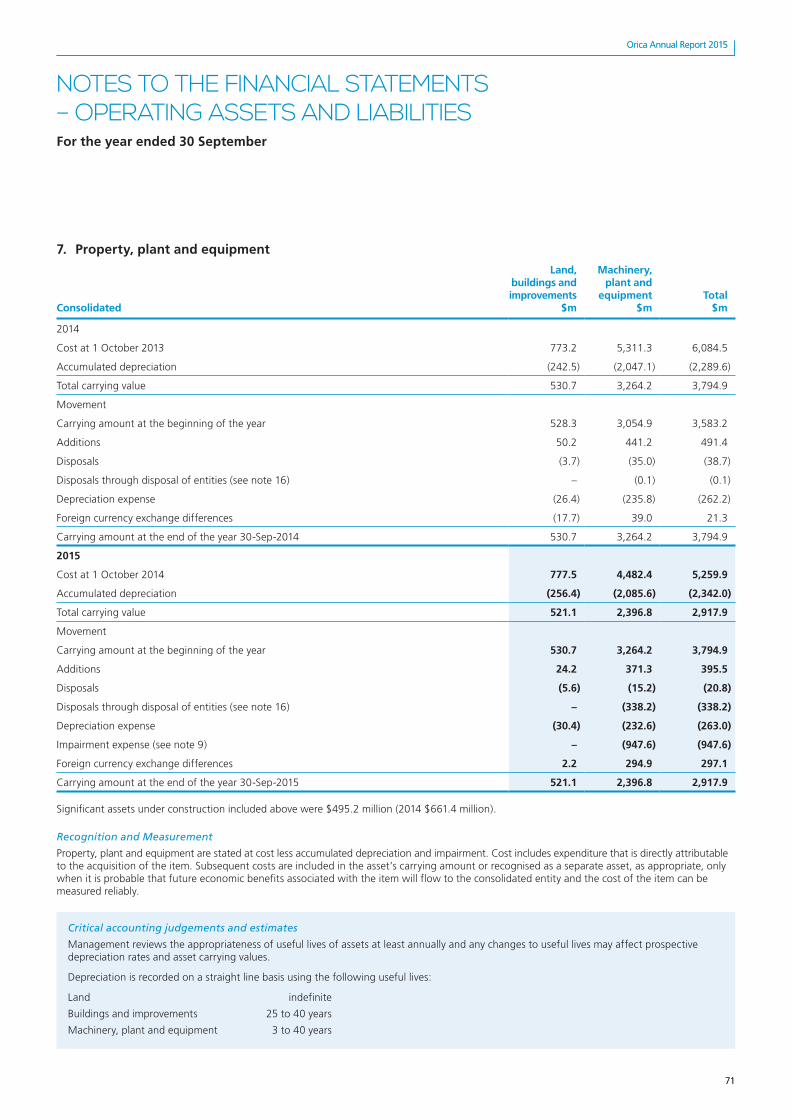
7. Property, plant and equipment
Consolidated
Land, buildings and improvements
$m
Machinery, plant and
equipment $m
Total $m
2014
Cost at 1 October 2013 773.2 5,311.3 6,084.5
Accumulated depreciation (242.5) (2,047.1) (2,289.6)
Total carrying value 530.7 3,264.2 3,794.9
Movement
Carrying amount at the beginning of the year 528.3 3,054.9 3,583.2
Additions 50.2 441.2 491.4
Disposals (3.7) (35.0) (38.7)
Disposals through disposal of entities (see note 16) – (0.1) (0.1)
Depreciation expense (26.4) (235.8) (262.2)
Foreign currency exchange differences (17.7) 39.0 21.3
Carrying amount at the end of the year 30-Sep-2014 530.7 3,264.2 3,794.9
2015
Cost at 1 October 2014 777.5 4,482.4 5,259.9
Accumulated depreciation (256.4) (2,085.6) (2,342.0)
Total carrying value 521.1 2,396.8 2,917.9
Movement
Carrying amount at the beginning of the year 530.7 3,264.2 3,794.9
Additions 24.2 371.3 395.5
Disposals (5.6) (15.2) (20.8)
Disposals through disposal of entities (see note 16) – (338.2) (338.2)
Depreciation expense (30.4) (232.6) (263.0)
Impairment expense (see note 9) – (947.6) (947.6)
Foreign currency exchange differences 2.2 294.9 297.1
Carrying amount at the end of the year 30-Sep-2015 521.1 2,396.8 2,917.9
Significant assets under construction included above were $495.2 million (2014 $661.4 million).
Recognition and Measurement
Property, plant and equipment are stated at cost less accumulated depreciation and impairment. Cost includes expenditure that is directly attributable to the acquisition of the item. Subsequent costs are included in the asset’s carrying amount or recognised as a separate asset, as appropriate, only when it is probable that future economic benefits associated with the item will flow to the consolidated entity and the cost of the item can be measured reliably.
Critical accounting judgements and estimates
Management reviews the appropriateness of useful lives of assets at least annually and any changes to useful lives may affect prospective depreciation rates and asset carrying values.
Depreciation is recorded on a straight line basis using the following useful lives:
Land indefinite
Buildings and improvements 25 to 40 years
Machinery, plant and equipment 3 to 40 years
72
Orica Annual Report 2015
72
Orica Annual Report 2015
NOTES TO THE FINANCIAL STATEMENTS – OPERATING ASSETS AND LIABILITIESFor the year ended 30 September
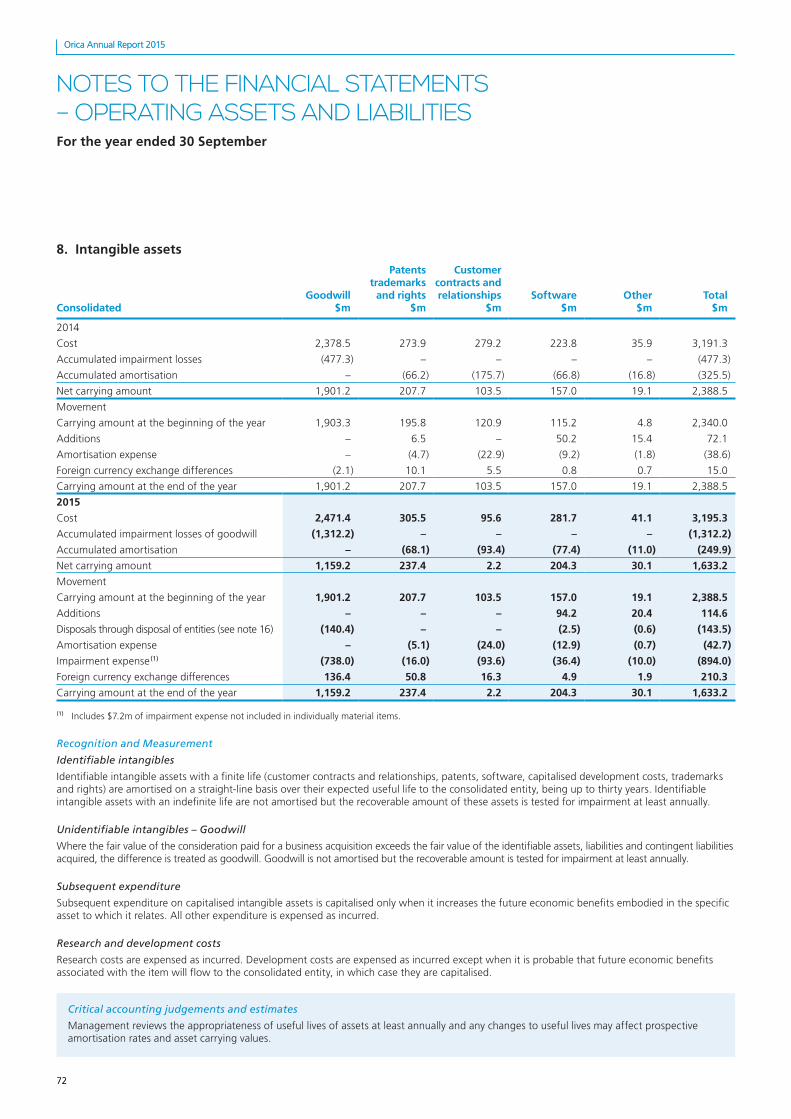
8. Intangible assets
ConsolidatedGoodwill
$m
Patents trademarks
and rights $m
Customer contracts and relationships
$m Software
$mOther
$m Total
$m
2014
Cost 2,378.5 273.9 279.2 223.8 35.9 3,191.3
Accumulated impairment losses (477.3) – – – – (477.3)
Accumulated amortisation – (66.2) (175.7) (66.8) (16.8) (325.5)
Net carrying amount 1,901.2 207.7 103.5 157.0 19.1 2,388.5
Movement
Carrying amount at the beginning of the year 1,903.3 195.8 120.9 115.2 4.8 2,340.0
Additions – 6.5 – 50.2 15.4 72.1
Amortisation expense – (4.7) (22.9) (9.2) (1.8) (38.6)
Foreign currency exchange differences (2.1) 10.1 5.5 0.8 0.7 15.0
Carrying amount at the end of the year 1,901.2 207.7 103.5 157.0 19.1 2,388.5
2015
Cost 2,471.4 305.5 95.6 281.7 41.1 3,195.3
Accumulated impairment losses of goodwill (1,312.2) – – – – (1,312.2)
Accumulated amortisation – (68.1) (93.4) (77.4) (11.0) (249.9)
Net carrying amount 1,159.2 237.4 2.2 204.3 30.1 1,633.2
Movement
Carrying amount at the beginning of the year 1,901.2 207.7 103.5 157.0 19.1 2,388.5
Additions – – – 94.2 20.4 114.6
Disposals through disposal of entities (see note 16) (140.4) – – (2.5) (0.6) (143.5)
Amortisation expense – (5.1) (24.0) (12.9) (0.7) (42.7)
Impairment expense (1) (738.0) (16.0) (93.6) (36.4) (10.0) (894.0)
Foreign currency exchange differences 136.4 50.8 16.3 4.9 1.9 210.3
Carrying amount at the end of the year 1,159.2 237.4 2.2 204.3 30.1 1,633.2
(1) Includes $7.2m of impairment expense not included in individually material items.
Recognition and Measurement
Identifiable intangibles
Identifiable intangible assets with a finite life (customer contracts and relationships, patents, software, capitalised development costs, trademarks and rights) are amortised on a straight-line basis over their expected useful life to the consolidated entity, being up to thirty years. Identifiable intangible assets with an indefinite life are not amortised but the recoverable amount of these assets is tested for impairment at least annually.
Unidentifiable intangibles – Goodwill
Where the fair value of the consideration paid for a business acquisition exceeds the fair value of the identifiable assets, liabilities and contingent liabilities acquired, the difference is treated as goodwill. Goodwill is not amortised but the recoverable amount is tested for impairment at least annually.
Subsequent expenditure
Subsequent expenditure on capitalised intangible assets is capitalised only when it increases the future economic benefits embodied in the specific asset to which it relates. All other expenditure is expensed as incurred.
Research and development costs
Research costs are expensed as incurred. Development costs are expensed as incurred except when it is probable that future economic benefits associated with the item will flow to the consolidated entity, in which case they are capitalised.
Critical accounting judgements and estimates
Management reviews the appropriateness of useful lives of assets at least annually and any changes to useful lives may affect prospective amortisation rates and asset carrying values.
73
Orica Annual Report 2015
73
Orica Annual Report 2015
NOTES TO THE FINANCIAL STATEMENTS – OPERATING ASSETS AND LIABILITIESFor the year ended 30 September
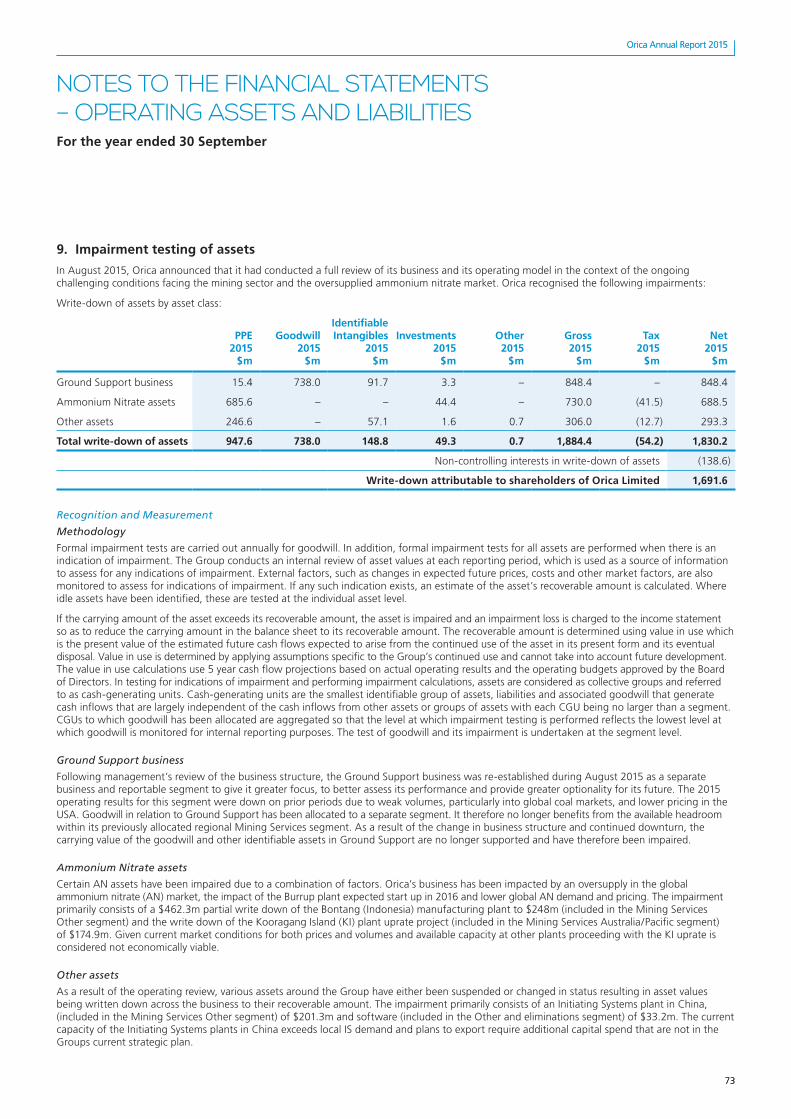
9. Impairment testing of assets
In August 2015, Orica announced that it had conducted a full review of its business and its operating model in the context of the ongoing challenging conditions facing the mining sector and the oversupplied ammonium nitrate market. Orica recognised the following impairments:
Write-down of assets by asset class:
PPE 2015
$m
Goodwill 2015
$m
Identifiable Intangibles
2015 $m
Investments 2015
$m
Other 2015
$m
Gross 2015
$m
Tax 2015
$m
Net 2015
$m
Ground Support business 15.4 738.0 91.7 3.3 – 848.4 – 848.4
Ammonium Nitrate assets 685.6 – – 44.4 – 730.0 (41.5) 688.5
Other assets 246.6 – 57.1 1.6 0.7 306.0 (12.7) 293.3
Total write-down of assets 947.6 738.0 148.8 49.3 0.7 1,884.4 (54.2) 1,830.2
Non-controlling interests in write-down of assets (138.6)
Write-down attributable to shareholders of Orica Limited 1,691.6
Recognition and Measurement
Methodology
Formal impairment tests are carried out annually for goodwill. In addition, formal impairment tests for all assets are performed when there is an indication of impairment. The Group conducts an internal review of asset values at each reporting period, which is used as a source of information to assess for any indications of impairment. External factors, such as changes in expected future prices, costs and other market factors, are also monitored to assess for indications of impairment. If any such indication exists, an estimate of the asset’s recoverable amount is calculated. Where idle assets have been identified, these are tested at the individual asset level.
If the carrying amount of the asset exceeds its recoverable amount, the asset is impaired and an impairment loss is charged to the income statement so as to reduce the carrying amount in the balance sheet to its recoverable amount. The recoverable amount is determined using value in use which is the present value of the estimated future cash flows expected to arise from the continued use of the asset in its present form and its eventual disposal. Value in use is determined by applying assumptions specific to the Group’s continued use and cannot take into account future development. The value in use calculations use 5 year cash flow projections based on actual operating results and the operating budgets approved by the Board of Directors. In testing for indications of impairment and performing impairment calculations, assets are considered as collective groups and referred to as cash-generating units. Cash-generating units are the smallest identifiable group of assets, liabilities and associated goodwill that generate cash inflows that are largely independent of the cash inflows from other assets or groups of assets with each CGU being no larger than a segment. CGUs to which goodwill has been allocated are aggregated so that the level at which impairment testing is performed reflects the lowest level at which goodwill is monitored for internal reporting purposes. The test of goodwill and its impairment is undertaken at the segment level.
Ground Support business
Following management’s review of the business structure, the Ground Support business was re-established during August 2015 as a separate business and reportable segment to give it greater focus, to better assess its performance and provide greater optionality for its future. The 2015 operating results for this segment were down on prior periods due to weak volumes, particularly into global coal markets, and lower pricing in the USA. Goodwill in relation to Ground Support has been allocated to a separate segment. It therefore no longer benefits from the available headroom within its previously allocated regional Mining Services segment. As a result of the change in business structure and continued downturn, the carrying value of the goodwill and other identifiable assets in Ground Support are no longer supported and have therefore been impaired.
Ammonium Nitrate assets
Certain AN assets have been impaired due to a combination of factors. Orica’s business has been impacted by an oversupply in the global ammonium nitrate (AN) market, the impact of the Burrup plant expected start up in 2016 and lower global AN demand and pricing. The impairment primarily consists of a $462.3m partial write down of the Bontang (Indonesia) manufacturing plant to $248m (included in the Mining Services Other segment) and the write down of the Kooragang Island (KI) plant uprate project (included in the Mining Services Australia/Pacific segment) of $174.9m. Given current market conditions for both prices and volumes and available capacity at other plants proceeding with the KI uprate is considered not economically viable.
Other assets
As a result of the operating review, various assets around the Group have either been suspended or changed in status resulting in asset values being written down across the business to their recoverable amount. The impairment primarily consists of an Initiating Systems plant in China, (included in the Mining Services Other segment) of $201.3m and software (included in the Other and eliminations segment) of $33.2m. The current capacity of the Initiating Systems plants in China exceeds local IS demand and plans to export require additional capital spend that are not in the Groups current strategic plan.
74
Orica Annual Report 2015
74
Orica Annual Report 2015
NOTES TO THE FINANCIAL STATEMENTS – OPERATING ASSETS AND LIABILITIESFor the year ended 30 September
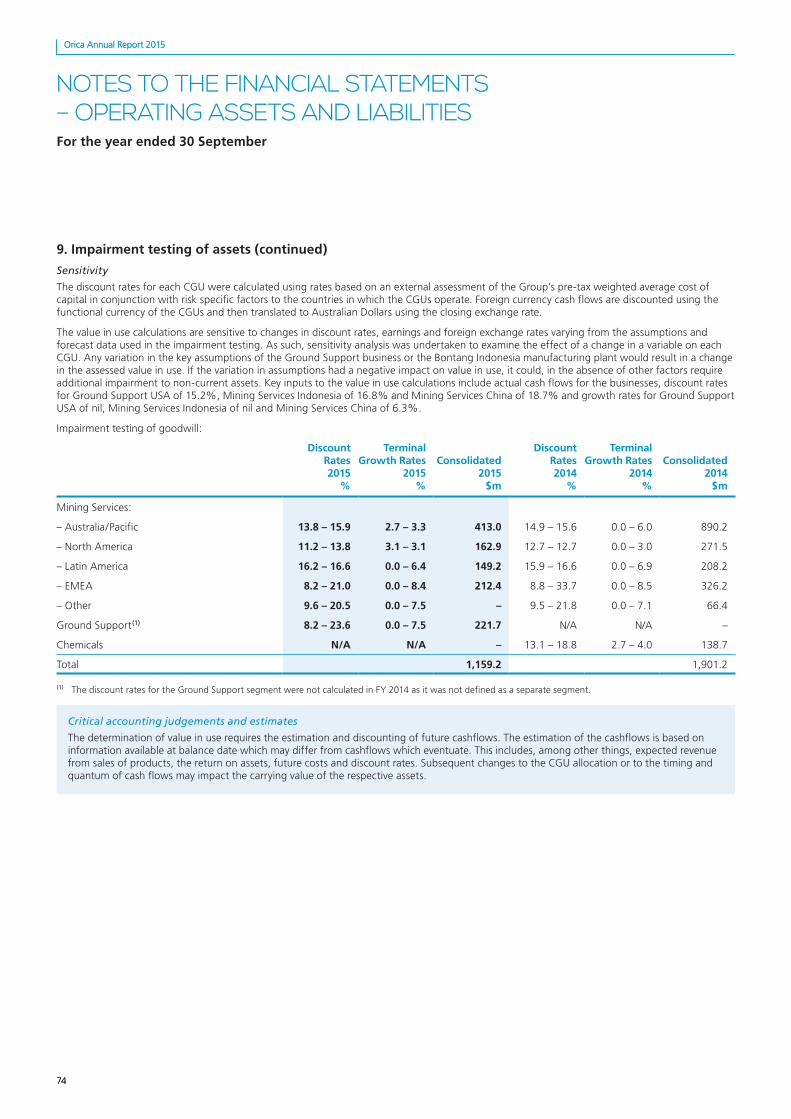
9. Impairment testing of assets (continued)
Sensitivity
The discount rates for each CGU were calculated using rates based on an external assessment of the Group’s pre-tax weighted average cost of capital in conjunction with risk specific factors to the countries in which the CGUs operate. Foreign currency cash flows are discounted using the functional currency of the CGUs and then translated to Australian Dollars using the closing exchange rate.
The value in use calculations are sensitive to changes in discount rates, earnings and foreign exchange rates varying from the assumptions and forecast data used in the impairment testing. As such, sensitivity analysis was undertaken to examine the effect of a change in a variable on each CGU. Any variation in the key assumptions of the Ground Support business or the Bontang Indonesia manufacturing plant would result in a change in the assessed value in use. If the variation in assumptions had a negative impact on value in use, it could, in the absence of other factors require additional impairment to non-current assets. Key inputs to the value in use calculations include actual cash flows for the businesses, discount rates for Ground Support USA of 15.2%, Mining Services Indonesia of 16.8% and Mining Services China of 18.7% and growth rates for Ground Support USA of nil, Mining Services Indonesia of nil and Mining Services China of 6.3%.
Impairment testing of goodwill:
Discount Rates 2015
%
Terminal Growth Rates
2015 %
Consolidated 2015
$m
Discount Rates 2014
%
Terminal Growth Rates
2014 %
Consolidated 2014
$m
Mining Services:
– Australia/Pacific 13.8 – 15.9 2.7 – 3.3 413.0 14.9 – 15.6 0.0 – 6.0 890.2
– North America 11.2 – 13.8 3.1 – 3.1 162.9 12.7 – 12.7 0.0 – 3.0 271.5
– Latin America 16.2 – 16.6 0.0 – 6.4 149.2 15.9 – 16.6 0.0 – 6.9 208.2
– EMEA 8.2 – 21.0 0.0 – 8.4 212.4 8.8 – 33.7 0.0 – 8.5 326.2
– Other 9.6 – 20.5 0.0 – 7.5 – 9.5 – 21.8 0.0 – 7.1 66.4
Ground Support(1) 8.2 – 23.6 0.0 – 7.5 221.7 N/A N/A –
Chemicals N/A N/A – 13.1 – 18.8 2.7 – 4.0 138.7
Total 1,159.2 1,901.2
(1) The discount rates for the Ground Support segment were not calculated in FY 2014 as it was not defined as a separate segment.
Critical accounting judgements and estimates
The determination of value in use requires the estimation and discounting of future cashflows. The estimation of the cashflows is based on information available at balance date which may differ from cashflows which eventuate. This includes, among other things, expected revenue from sales of products, the return on assets, future costs and discount rates. Subsequent changes to the CGU allocation or to the timing and quantum of cash flows may impact the carrying value of the respective assets.
75
Orica Annual Report 2015
75
Orica Annual Report 2015
NOTES TO THE FINANCIAL STATEMENTS – MANAGING FINANCIAL RISKSFor the year ended 30 September
Section D. Managing Financial RisksOrica’s Review of Operations and Financial Performance highlights funding and other treasury matters as material business risks that could adversely affect the achievement of future business performance.
This section discusses the principal market and financial risks the Group is exposed to and the risk management program, which seeks to mitigate these risks and reduce the volatility of Orica’s financial performance.
10. Financial risk management
Financial risk factors
The Group’s overall risk management program seeks to mitigate risks and reduce the volatility of Orica’s financial performance. Financial risk management is carried out centrally by the Group’s Treasury department under policies approved by the Board of Directors.
The Group’s principal financial risks are associated with
� interest rate (note 10a)
� foreign exchange (note 10b)
� credit risk (note 10c) and
� liquidity (note 10d)
(a) Interest rate management
Interest rate risk refers to the risk that the value of a financial instrument or cash flows associated with the instrument will fluctuate due to changes in market interest rates.
The Group is primarily exposed to interest rate risk on outstanding interest bearing liabilities. Non-derivative interest bearing assets are predominantly short-term liquid assets. Interest bearing liabilities issued at fixed rates expose the Group to fair value interest rate risk while borrowings issued at a variable rate give rise to cash flow interest rate risk.
Interest rate risk on long-term interest bearing liabilities is managed by adjusting the ratio of fixed interest debt to variable interest debt. This is managed within policies determined by the Orica Board of Directors via the use of interest rate swaps and cross currency interest rate swaps. Under the policy, up to 90% of debt with a maturity of less than one year can be fixed. This reduces on a sliding scale to year five where a maximum 50% of debt with a maturity of between five and ten years can be fixed. Beyond this, a maximum 25% of the debt with a maturity of between ten and twenty years can be fixed. The Group operated within this range during both the current year and the prior year and as at September, the fixed rate borrowings after the impact of interest rate swaps and cross currency swaps were $1,024 million (2014 $1,144 million).
Interest rate sensitivity
Orica has exposure to interest rate movements in the underlying currencies it deals in. A 10% movement in interest rates without management intervention would have a $3m (2014 $1.3m) impact on profit before tax and a $2.2m (2014 $0.4m) impact on shareholders’ equity.
(b) Foreign exchange risk management
(i) Foreign exchange risk – transactional
Foreign exchange risk refers to the risk that the value of a financial commitment, recognised asset or liability or cash flow will fluctuate due to changes in foreign currency rates.
The Group is exposed to foreign exchange risk primarily due to significant sales and/or purchases denominated, either directly or indirectly, in currencies other than the functional currencies of the Group’s subsidiaries.
As at reporting date, cross currency interest rate swaps entered into to hedge debt principal had a fair value gain of $78.8 million (2014 $14.6 million loss).
Foreign currency transactions
Transactions in foreign currencies are translated at the foreign exchange rate ruling at the date of the transaction. Monetary assets and liabilities denominated in foreign currencies at the balance sheet date are translated to the functional currency of the entity at the foreign exchange rate ruling at that date.
Foreign exchange differences arising on translation are recognised in the Income Statement. Non-monetary assets and liabilities that are measured at historical cost in a foreign currency are translated using the exchange rate ruling at the date of the transaction. Non-monetary assets and liabilities denominated in foreign currencies that are measured at fair value are translated to the functional currency of the entity at foreign exchange rates ruling at the dates the fair value was determined.
76
Orica Annual Report 2015
76
Orica Annual Report 2015
NOTES TO THE FINANCIAL STATEMENTS – MANAGING FINANCIAL RISKSFor the year ended 30 September
10. Financial risk management (continued)
In regard to foreign currency risk relating to sales and purchases, the Group hedges up to 100% of committed exposures. Anticipated exposures are hedged by applying a declining percentage of cover the further the time to the transaction date. Only exposures that can be forecast to a high probability are hedged. Transactions can be hedged for up to five years. The derivative instruments used for hedging purchase and sale exposures are bought vanilla option contracts and forward exchange contracts. Forward exchange contracts may be used only under Board policy for committed exposures and anticipated exposures expected to occur within 12 months. Bought vanilla option contracts may be used for all exposures. These contracts are designated as cash flow hedges and are recognised at their fair value.
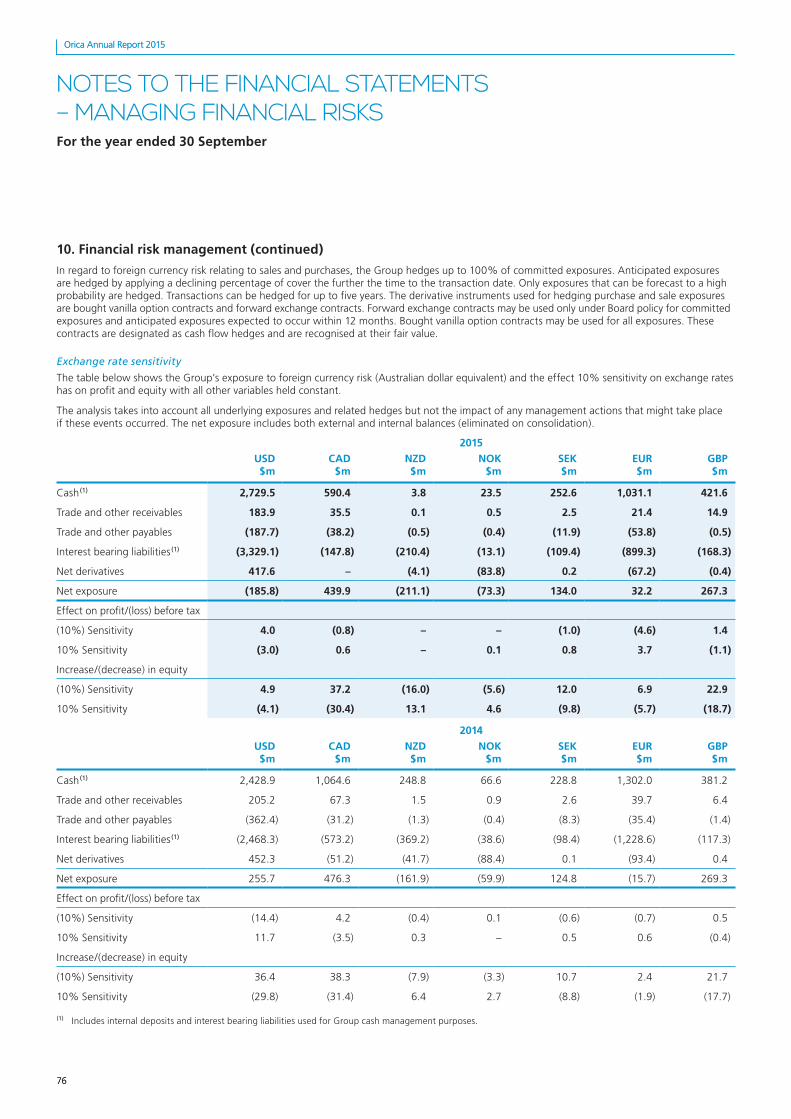
Exchange rate sensitivity
The table below shows the Group’s exposure to foreign currency risk (Australian dollar equivalent) and the effect 10% sensitivity on exchange rates has on profit and equity with all other variables held constant.
The analysis takes into account all underlying exposures and related hedges but not the impact of any management actions that might take place if these events occurred. The net exposure includes both external and internal balances (eliminated on consolidation).
2015
USD $m
CAD $m
NZD $m
NOK $m
SEK $m
EUR $m
GBP $m
Cash (1) 2,729.5 590.4 3.8 23.5 252.6 1,031.1 421.6
Trade and other receivables 183.9 35.5 0.1 0.5 2.5 21.4 14.9
Trade and other payables (187.7) (38.2) (0.5) (0.4) (11.9) (53.8) (0.5)
Interest bearing liabilities (1) (3,329.1) (147.8) (210.4) (13.1) (109.4) (899.3) (168.3)
Net derivatives 417.6 – (4.1) (83.8) 0.2 (67.2) (0.4)
Net exposure (185.8) 439.9 (211.1) (73.3) 134.0 32.2 267.3
Effect on profit/(loss) before tax
(10%) Sensitivity 4.0 (0.8) – – (1.0) (4.6) 1.4
10% Sensitivity (3.0) 0.6 – 0.1 0.8 3.7 (1.1)
Increase/(decrease) in equity
(10%) Sensitivity 4.9 37.2 (16.0) (5.6) 12.0 6.9 22.9
10% Sensitivity (4.1) (30.4) 13.1 4.6 (9.8) (5.7) (18.7)
2014
USD $m
CAD $m
NZD $m
NOK $m
SEK $m
EUR $m
GBP $m
Cash (1) 2,428.9 1,064.6 248.8 66.6 228.8 1,302.0 381.2
Trade and other receivables 205.2 67.3 1.5 0.9 2.6 39.7 6.4
Trade and other payables (362.4) (31.2) (1.3) (0.4) (8.3) (35.4) (1.4)
Interest bearing liabilities (1) (2,468.3) (573.2) (369.2) (38.6) (98.4) (1,228.6) (117.3)
Net derivatives 452.3 (51.2) (41.7) (88.4) 0.1 (93.4) 0.4
Net exposure 255.7 476.3 (161.9) (59.9) 124.8 (15.7) 269.3
Effect on profit/(loss) before tax
(10%) Sensitivity (14.4) 4.2 (0.4) 0.1 (0.6) (0.7) 0.5
10% Sensitivity 11.7 (3.5) 0.3 – 0.5 0.6 (0.4)
Increase/(decrease) in equity
(10%) Sensitivity 36.4 38.3 (7.9) (3.3) 10.7 2.4 21.7
10% Sensitivity (29.8) (31.4) 6.4 2.7 (8.8) (1.9) (17.7)
(1) Includes internal deposits and interest bearing liabilities used for Group cash management purposes.
77
Orica Annual Report 2015
77
Orica Annual Report 2015
NOTES TO THE FINANCIAL STATEMENTS – MANAGING FINANCIAL RISKSFor the year ended 30 September
10. Financial risk management (continued)
(ii) Foreign currency risk – translational
Foreign currency earnings translation risk arises primarily as a result of earnings generated by foreign operations with functional currencies of USD, NZD, NOK, SEK, CLP, COP, MXN and CAD being translated into AUD. Derivative contracts to hedge earnings exposures do not qualify for hedge accounting under Accounting Standards. However, Board approved policy allows hedging of this exposure in order to reduce the volatility of full year earnings resulting from changes in exchange rates.
Financial statements of foreign operations
The assets and liabilities of foreign operations, including goodwill and fair value adjustments arising on consolidation, are translated to Australian dollars at foreign exchange rates ruling at the balance sheet date.
The revenues and expenses of foreign operations, excluding foreign operations in hyperinflationary economies, are translated to Australian dollars at rates approximating the foreign exchange rates ruling at the dates of the transactions. The revenues and expenses of foreign operations in hyperinflationary economies are translated to Australian dollars at the foreign exchange rates ruling at the balance sheet date. Foreign exchange differences arising on retranslation are recognised directly in a separate component of equity.
Prior to translating the financial statements of foreign operations in hyperinflationary economies, the financial statements, including comparatives, are restated to account for changes in the general purchasing power of the local currency. The restatement is based on relevant price indices at the balance sheet date.
Net investment in foreign operations
Exchange differences arising from the translation of the net investment in foreign operations, and of related hedges are taken to the translation reserve. They are released into the Income Statement upon disposal.
Hedging of exposures is undertaken primarily through originating debt in the currency of the foreign operation or by raising debt in a different currency and effectively swapping the debt to the currency of the foreign operation. The remaining translation exposure is managed, where considered appropriate, through forward foreign exchange derivative instruments or cross currency swaps. Gains and losses resulting from these hedging activities are recorded in the foreign currency translation reserve within the equity section of the balance sheet and offset against the foreign exchange impact resulting from the translation of the net assets of foreign operations. Fifty five percent of the Group’s investment in foreign operations was hedged in this manner as at 30 September 2015 (2014 31.0%).
As at reporting date, derivative instruments designated as hedging net investment exposures had a fair value of $69.3 million loss (2014 $101.9 million loss).
(c) Credit risk management
Credit risk represents the loss that would be recognised if counterparties failed to meet their obligations under a contract or arrangement. The Group has exposure to credit risk on all financial assets included within the balance sheets. For discussion on how this risk in relation to receivables is managed refer to note 5. In regards to credit risk arising from derivatives and cash, this is the credit exposure to financial institutions that are counterparties to derivative contracts and cash deposits, with a positive fair value from Orica’s perspective. As at 30 September 2015, the sum of all contracts with a positive fair value was $112.5 million (2014 $56.5 million).
To manage this risk, the Group restricts dealings to highly rated counterparties approved within its credit limit policy. The higher the credit rating of the counterparty, the higher the Group’s allowable exposure is to that counterparty under the policy. The Group does not hold any credit derivatives to offset its credit exposures.
(d) Liquidity risk management
Liquidity risk arises from the possibility that there will be insufficient funds available to make payment as and when required.
The Group manages this risk via:
� maintaining an adequate level of undrawn committed facilities in various currencies that can be drawn upon at short notice;
� using instruments that are readily tradeable in the financial markets;
� monitoring duration of long term debt;
� spreading, to the extent practicable, the maturity dates of long-term debt facilities; and
� comprehensively analysing all inflows and outflows that relate to financial assets and liabilities.

78
Orica Annual Report 2015
78
Orica Annual Report 2015
NOTES TO THE FINANCIAL STATEMENTS – MANAGING FINANCIAL RISKSFor the year ended 30 September
10. Financial risk management (continued)
Facilities available and the amounts drawn and undrawn are as follows:
2015 $m
2014 $m
Unsecured bank overdraft facilities
Unsecured bank overdraft facilities available 128.8 116.1
Amount of facilities undrawn 115.7 66.6
Committed standby and loan facilities
Committed standby and loan facilities available 3,933.0 3,774.0
Amount of facilities unused 1,670.0 1,552.8
The bank overdrafts are payable on demand and are subject to an annual review. The repayment dates of the committed standby and loan facilities range from 28 April 2016 to 25 October 2030 (2014 28 April 2015 to 25 October 2030). The contractual maturity of the Groups’ fixed and floating rate financial instruments and derivatives are shown in the table below. The amounts shown represent the future undiscounted principal and interest cash flows:
As at 30 September 2015 As at 30 September 2014
Consolidated
Less than 1 year
$m
1 to 2 years
$m
2 to 5 years
$m
Over 5 years
$m
Less than 1 year
$m
1 to 2 years
$m
2 to 5 years
$m
Over 5 years
$m
Non-derivative financial assets
Cash 273.9 – – – 263.2 – – –
Trade and other receivables (1) 937.8 74.9 – – 1,043.8 74.3 – –
Derivative financial assets 1,356.5 51.5 326.0 292.8 1,997.0 119.7 337.4 259.9
Financial assets 2,568.2 126.4 326.0 292.8 3,304.0 194.0 337.4 259.9
Non-derivative financial liabilities
Trade and other payables (1) 1,128.1 7.9 – – 1,211.0 6.9 – –
Bank overdrafts 13.1 – – – 49.5 – – –
Bank loans 2.6 59.3 90.1 – 7.0 135.1 66.7 –
Export finance facility 18.2 18.2 54.0 – 14.7 14.7 44.2 14.3
Other short term borrowings – – – – 211.4 – – –
Private placement 210.6 377.5 361.2 1,682.4 353.3 172.4 600.1 1,403.6
Other long term borrowings – 2.7 13.1 – 3.6 6.2 3.6 –
Lease liabilities 1.6 1.8 1.8 – 1.2 1.1 3.2 –
Derivative financial liabilities 1,349.8 69.6 392.7 225.2 1,985.8 137.2 329.4 259.1
Financial liabilities 2,724.0 537.0 912.9 1,907.6 3,837.5 473.6 1,047.2 1,677.0
Net outflow (155.8) (410.6) (586.9) (1,614.8) (533.5) (279.6) (709.8) (1,417.1)
(1) Excludes derivative financial instruments.
Recognition and Measurement
Valuation of financial assets and liabilities (included within other on Balance sheet)
The carrying value of derivatives equals their fair values. All are defined as Level 2 under AASB 7. The inputs are observable for the assets or liabilities, either directly (i.e., as prices) or indirectly (i.e., derived from prices). There has been no movement between levels since prior year.
Valuation techniques include, where applicable, reference to prices quoted in active markets, discounted cash flow analysis, fair value of recent arm’s length transactions involving the same instruments or other instruments that are substantially the same, and option pricing models. Changes in default probabilities are included in the valuation of derivatives through the use of credit and debit valuation adjustments.
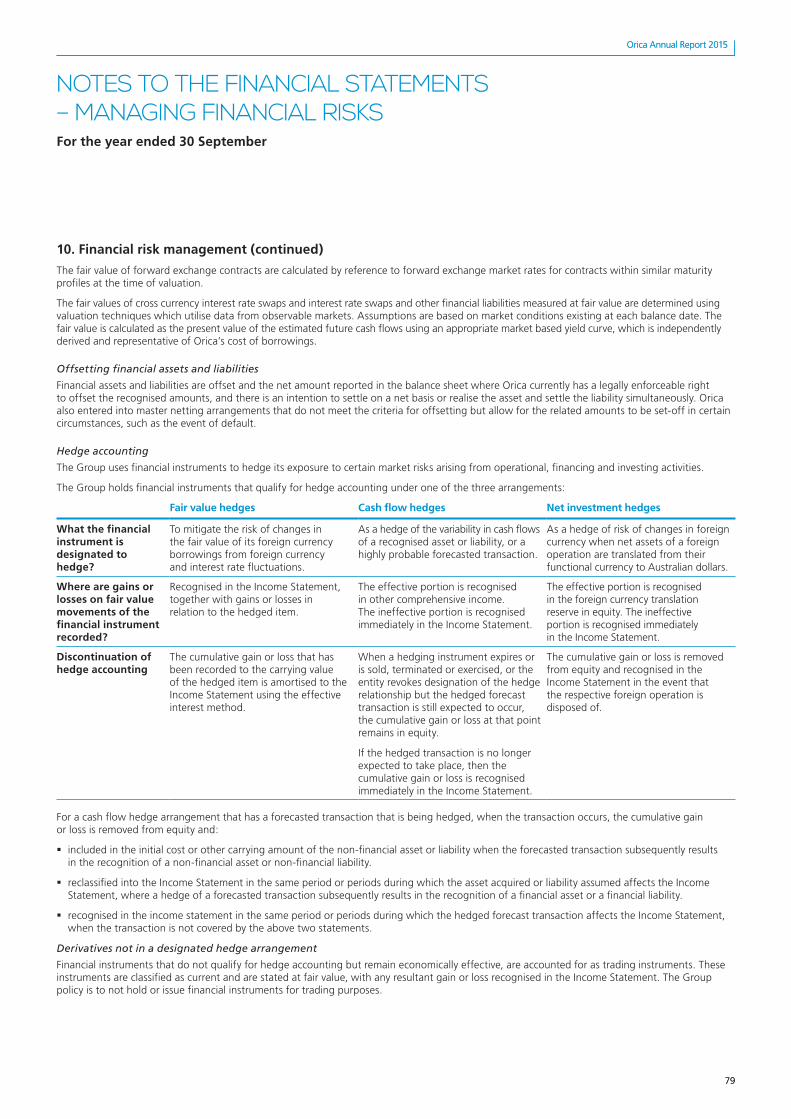
79
Orica Annual Report 2015
79
Orica Annual Report 2015
NOTES TO THE FINANCIAL STATEMENTS – MANAGING FINANCIAL RISKSFor the year ended 30 September
10. Financial risk management (continued)
The fair value of forward exchange contracts are calculated by reference to forward exchange market rates for contracts within similar maturity profiles at the time of valuation.
The fair values of cross currency interest rate swaps and interest rate swaps and other financial liabilities measured at fair value are determined using valuation techniques which utilise data from observable markets. Assumptions are based on market conditions existing at each balance date. The fair value is calculated as the present value of the estimated future cash flows using an appropriate market based yield curve, which is independently derived and representative of Orica’s cost of borrowings.
Offsetting financial assets and liabilities
Financial assets and liabilities are offset and the net amount reported in the balance sheet where Orica currently has a legally enforceable right to offset the recognised amounts, and there is an intention to settle on a net basis or realise the asset and settle the liability simultaneously. Orica also entered into master netting arrangements that do not meet the criteria for offsetting but allow for the related amounts to be set-off in certain circumstances, such as the event of default.
Hedge accounting
The Group uses financial instruments to hedge its exposure to certain market risks arising from operational, financing and investing activities.
The Group holds financial instruments that qualify for hedge accounting under one of the three arrangements:
Fair value hedges Cash flow hedges Net investment hedges
What the financial instrument is designated to hedge?
To mitigate the risk of changes in the fair value of its foreign currency borrowings from foreign currency and interest rate fluctuations.
As a hedge of the variability in cash flows of a recognised asset or liability, or a highly probable forecasted transaction.
As a hedge of risk of changes in foreign currency when net assets of a foreign operation are translated from their functional currency to Australian dollars.
Where are gains or losses on fair value movements of the financial instrument recorded?
Recognised in the Income Statement, together with gains or losses in relation to the hedged item.
The effective portion is recognised in other comprehensive income. The ineffective portion is recognised immediately in the Income Statement.
The effective portion is recognised in the foreign currency translation reserve in equity. The ineffective portion is recognised immediately in the Income Statement.
Discontinuation of hedge accounting
The cumulative gain or loss that has been recorded to the carrying value of the hedged item is amortised to the Income Statement using the effective interest method.
When a hedging instrument expires or is sold, terminated or exercised, or the entity revokes designation of the hedge relationship but the hedged forecast transaction is still expected to occur, the cumulative gain or loss at that point remains in equity.
If the hedged transaction is no longer expected to take place, then the cumulative gain or loss is recognised immediately in the Income Statement.
The cumulative gain or loss is removed from equity and recognised in the Income Statement in the event that the respective foreign operation is disposed of.
For a cash flow hedge arrangement that has a forecasted transaction that is being hedged, when the transaction occurs, the cumulative gain or loss is removed from equity and:
� included in the initial cost or other carrying amount of the non-financial asset or liability when the forecasted transaction subsequently results in the recognition of a non-financial asset or non-financial liability.
� reclassified into the Income Statement in the same period or periods during which the asset acquired or liability assumed affects the Income Statement, where a hedge of a forecasted transaction subsequently results in the recognition of a financial asset or a financial liability.
� recognised in the income statement in the same period or periods during which the hedged forecast transaction affects the Income Statement, when the transaction is not covered by the above two statements.
Derivatives not in a designated hedge arrangement
Financial instruments that do not qualify for hedge accounting but remain economically effective, are accounted for as trading instruments. These instruments are classified as current and are stated at fair value, with any resultant gain or loss recognised in the Income Statement. The Group policy is to not hold or issue financial instruments for trading purposes.
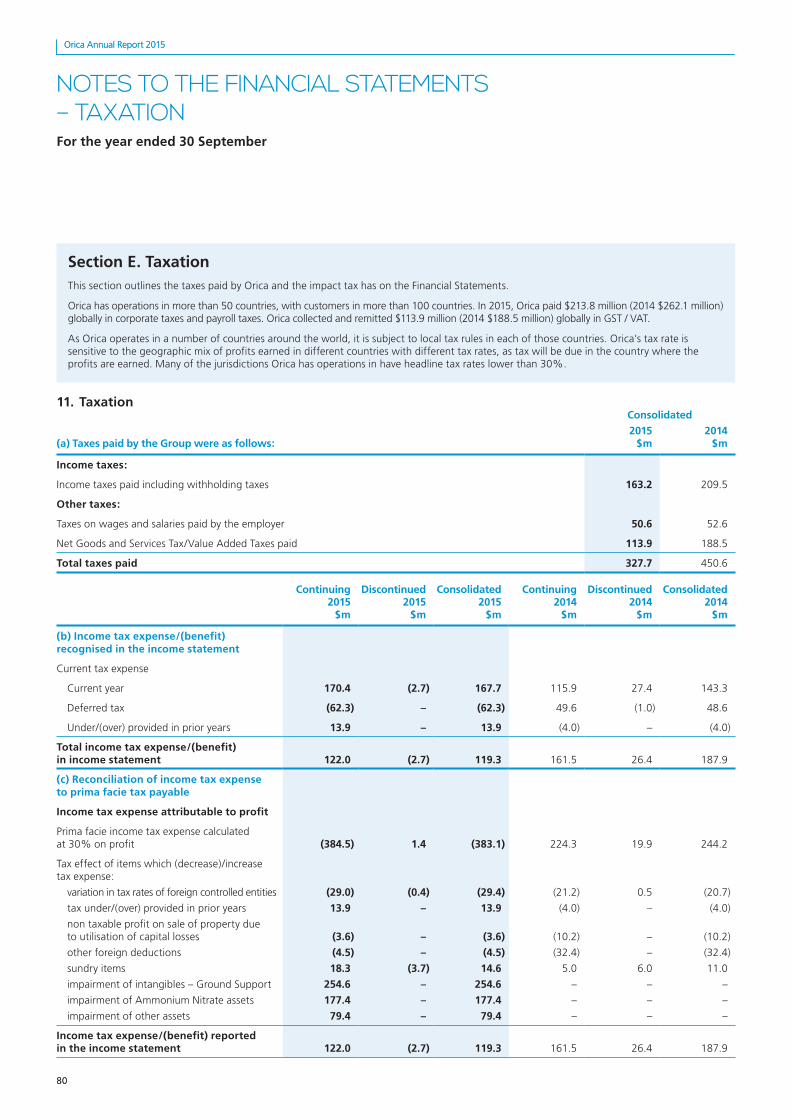
80
Orica Annual Report 2015
80
Orica Annual Report 2015
NOTES TO THE FINANCIAL STATEMENTS – TAXATIONFor the year ended 30 September
Section E. Taxation This section outlines the taxes paid by Orica and the impact tax has on the Financial Statements.
Orica has operations in more than 50 countries, with customers in more than 100 countries. In 2015, Orica paid $213.8 million (2014 $262.1 million) globally in corporate taxes and payroll taxes. Orica collected and remitted $113.9 million (2014 $188.5 million) globally in GST / VAT.
As Orica operates in a number of countries around the world, it is subject to local tax rules in each of those countries. Orica’s tax rate is sensitive to the geographic mix of profits earned in different countries with different tax rates, as tax will be due in the country where the profits are earned. Many of the jurisdictions Orica has operations in have headline tax rates lower than 30%.
11. TaxationConsolidated
(a) Taxes paid by the Group were as follows: 2015
$m2014
$m
Income taxes:
Income taxes paid including withholding taxes 163.2 209.5
Other taxes:
Taxes on wages and salaries paid by the employer 50.6 52.6
Net Goods and Services Tax/Value Added Taxes paid 113.9 188.5
Total taxes paid 327.7 450.6
Continuing 2015
$m
Discontinued 2015
$m
Consolidated 2015
$m
Continuing 2014
$m
Discontinued 2014
$m
Consolidated 2014
$m
(b) Income tax expense/(benefit) recognised in the income statement
Current tax expense
Current year 170.4 (2.7) 167.7 115.9 27.4 143.3
Deferred tax (62.3) – (62.3) 49.6 (1.0) 48.6
Under/(over) provided in prior years 13.9 – 13.9 (4.0) – (4.0)
Total income tax expense/(benefit) in income statement 122.0 (2.7) 119.3 161.5 26.4 187.9
(c) Reconciliation of income tax expense to prima facie tax payable
Income tax expense attributable to profit
Prima facie income tax expense calculated at 30% on profit (384.5) 1.4 (383.1) 224.3 19.9 244.2
Tax effect of items which (decrease)/increase tax expense:
variation in tax rates of foreign controlled entities (29.0) (0.4) (29.4) (21.2) 0.5 (20.7)
tax under/(over) provided in prior years 13.9 – 13.9 (4.0) – (4.0)
non taxable profit on sale of property due to utilisation of capital losses (3.6) – (3.6) (10.2) – (10.2)
other foreign deductions (4.5) – (4.5) (32.4) – (32.4)
sundry items 18.3 (3.7) 14.6 5.0 6.0 11.0
impairment of intangibles – Ground Support 254.6 – 254.6 – – –
impairment of Ammonium Nitrate assets 177.4 – 177.4 – – –
impairment of other assets 79.4 – 79.4 – – –
Income tax expense/(benefit) reported in the income statement 122.0 (2.7) 119.3 161.5 26.4 187.9
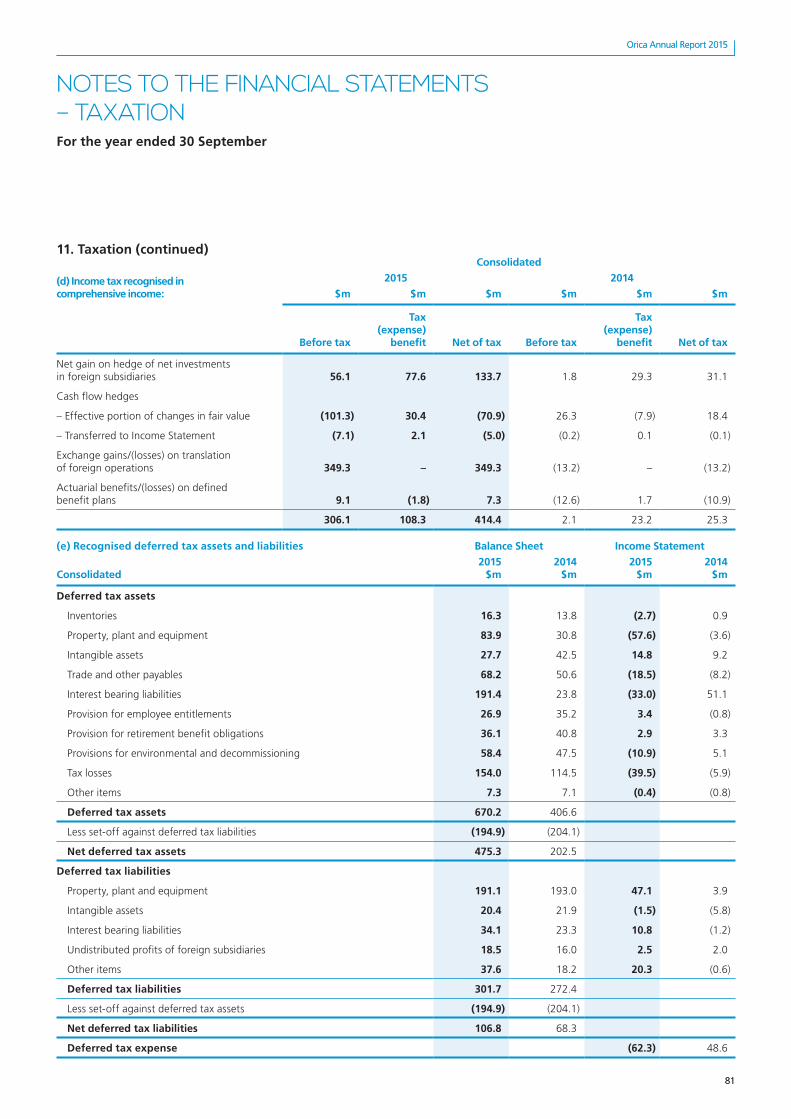
81
Orica Annual Report 2015
81
Orica Annual Report 2015
NOTES TO THE FINANCIAL STATEMENTS – TAXATIONFor the year ended 30 September
11. Taxation (continued)Consolidated
(d) Income tax recognised in comprehensive income:
2015 2014
$m $m $m $m $m $m
Before tax
Tax (expense)
benefit Net of tax Before tax
Tax (expense)
benefit Net of tax
Net gain on hedge of net investments in foreign subsidiaries 56.1 77.6 133.7 1.8 29.3 31.1
Cash flow hedges
– Effective portion of changes in fair value (101.3) 30.4 (70.9) 26.3 (7.9) 18.4
– Transferred to Income Statement (7.1) 2.1 (5.0) (0.2) 0.1 (0.1)
Exchange gains/(losses) on translation of foreign operations 349.3 – 349.3 (13.2) – (13.2)
Actuarial benefits/(losses) on defined benefit plans 9.1 (1.8) 7.3 (12.6) 1.7 (10.9)
306.1 108.3 414.4 2.1 23.2 25.3
(e) Recognised deferred tax assets and liabilities Balance Sheet Income Statement
Consolidated 2015
$m2014
$m2015
$m2014
$m
Deferred tax assets
Inventories 16.3 13.8 (2.7) 0.9
Property, plant and equipment 83.9 30.8 (57.6) (3.6)
Intangible assets 27.7 42.5 14.8 9.2
Trade and other payables 68.2 50.6 (18.5) (8.2)
Interest bearing liabilities 191.4 23.8 (33.0) 51.1
Provision for employee entitlements 26.9 35.2 3.4 (0.8)
Provision for retirement benefit obligations 36.1 40.8 2.9 3.3
Provisions for environmental and decommissioning 58.4 47.5 (10.9) 5.1
Tax losses 154.0 114.5 (39.5) (5.9)
Other items 7.3 7.1 (0.4) (0.8)
Deferred tax assets 670.2 406.6
Less set-off against deferred tax liabilities (194.9) (204.1)
Net deferred tax assets 475.3 202.5
Deferred tax liabilities
Property, plant and equipment 191.1 193.0 47.1 3.9
Intangible assets 20.4 21.9 (1.5) (5.8)
Interest bearing liabilities 34.1 23.3 10.8 (1.2)
Undistributed profits of foreign subsidiaries 18.5 16.0 2.5 2.0
Other items 37.6 18.2 20.3 (0.6)
Deferred tax liabilities 301.7 272.4
Less set-off against deferred tax assets (194.9) (204.1)
Net deferred tax liabilities 106.8 68.3
Deferred tax expense (62.3) 48.6
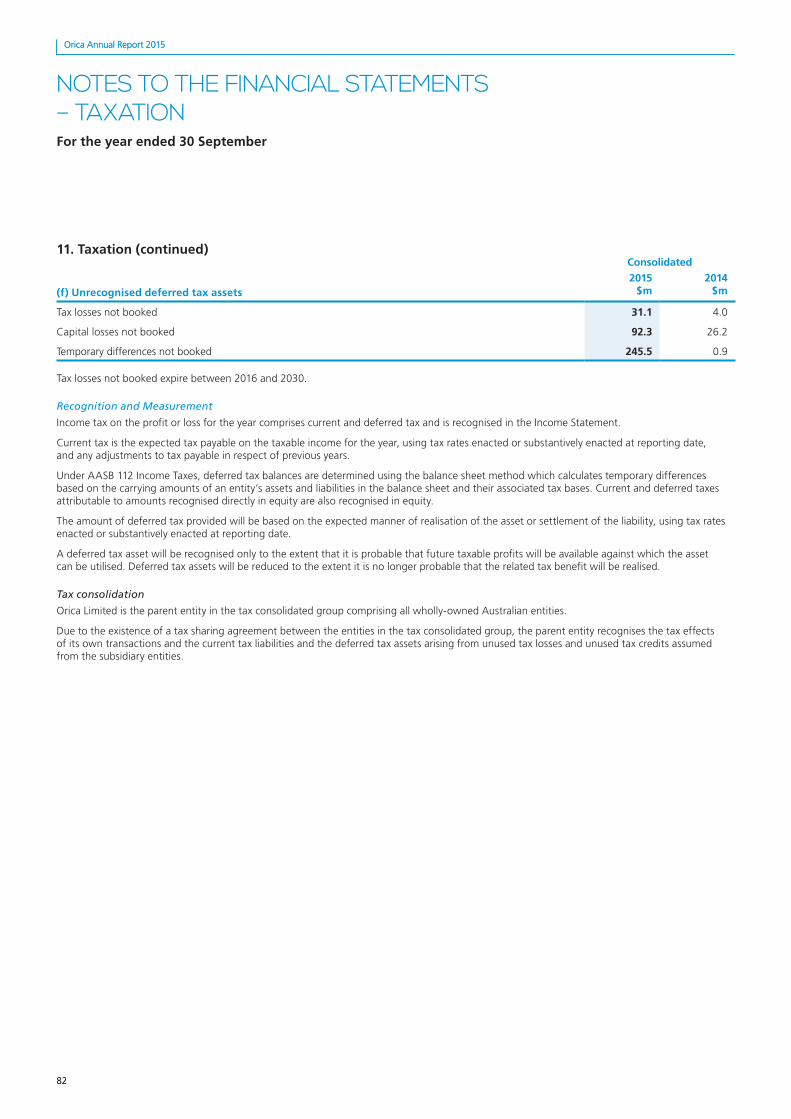
82
Orica Annual Report 2015
82
Orica Annual Report 2015
NOTES TO THE FINANCIAL STATEMENTS – TAXATIONFor the year ended 30 September
11. Taxation (continued)Consolidated
(f) Unrecognised deferred tax assets2015
$m 2014
$m
Tax losses not booked 31.1 4.0
Capital losses not booked 92.3 26.2
Temporary differences not booked 245.5 0.9
Tax losses not booked expire between 2016 and 2030.
Recognition and Measurement
Income tax on the profit or loss for the year comprises current and deferred tax and is recognised in the Income Statement.
Current tax is the expected tax payable on the taxable income for the year, using tax rates enacted or substantively enacted at reporting date, and any adjustments to tax payable in respect of previous years.
Under AASB 112 Income Taxes, deferred tax balances are determined using the balance sheet method which calculates temporary differences based on the carrying amounts of an entity’s assets and liabilities in the balance sheet and their associated tax bases. Current and deferred taxes attributable to amounts recognised directly in equity are also recognised in equity.
The amount of deferred tax provided will be based on the expected manner of realisation of the asset or settlement of the liability, using tax rates enacted or substantively enacted at reporting date.
A deferred tax asset will be recognised only to the extent that it is probable that future taxable profits will be available against which the asset can be utilised. Deferred tax assets will be reduced to the extent it is no longer probable that the related tax benefit will be realised.
Tax consolidation
Orica Limited is the parent entity in the tax consolidated group comprising all wholly-owned Australian entities.
Due to the existence of a tax sharing agreement between the entities in the tax consolidated group, the parent entity recognises the tax effects of its own transactions and the current tax liabilities and the deferred tax assets arising from unused tax losses and unused tax credits assumed from the subsidiary entities.

83
Orica Annual Report 2015
83
Orica Annual Report 2015
NOTES TO THE FINANCIAL STATEMENTS – TAXATIONFor the year ended 30 September
11. Taxation (continued)
Contingent tax liabilities
In the normal course of business, contingent liabilities may arise from tax investigations or legal proceedings. Where management are of the view that potential liabilities have a low probability of crystallising or it is not possible to quantify them reliably, they are disclosed as contingent liabilities.
(i) Investigations and audits
Consistent with other companies of the size and diversity of Orica, the Group is the subject of ongoing information requests, investigations and audit activities by Tax and Regulatory Authorities in jurisdictions in which Orica operates. Orica co-operates fully with the Tax and Regulatory Authorities. It is possible that Orica may incur fines and/or other penalties as a consequence of these investigations and audits.
(ii) German Tax Action
As the result of an income tax audit covering the 2005 to 2008 years, the German Central Tax Office (“the CTO”) has challenged Orica’s tax returns under laws which were announced in 2012 and introduced in 2013 in relation to a financing arrangement by Orica of its German group from 2005 onwards. The amount for the 2005 to 2008 years of the possible reassessment is approximately $20m. No assessment has been received from the CTO for the subsequent years. Orica believes that the laws should not apply to these arrangements and in addition should not be applied retrospectively. The CTO has extended the audit beyond 2008 and may challenge the financing arrangement in the later years.
(iii) Australian Tax Action
The Australian Taxation Office (“ATO”) has issued amended assessments in relation to the 2004, 2005 and 2006 years totalling $50.6 million in relation to a financing arrangement by Orica of its US group between 2004 and 2006. The ATO rejected Orica’s objections against the three assessments and Orica has appealed the matter to the Federal Court. The matter was heard by Judge Tony Pagone in the Federal Court in October 2015 and has been reserved for judgement. In accordance with the ATO administrative practice, Orica has paid 50% of the primary tax and interest arising from the assessments, which has been recognised as a non-current receivable.
(iv) Norway Tax Action
The Tax Office in Norway has issued a final assessment for tax and interest amounting to approximately $33 million, resulting from a reassessment of Orica Norway’s tax return for the 2005 income year relating to a transfer of the Dyno Nobel house brand in conjunction with Orica’s acquisition of Dyno Nobel’s explosives business. Orica is pursuing this matter through an administrative complaints process. Orica has paid a portion of the primary tax and interest arising from the assessment, which has been recognised as a non-current receivable.
(v) Brazilian Tax Action
The Brazilian Taxation authority is claiming unpaid taxes of approximately $17 million plus inflation adjustments, interest and penalties of approximately $26.5 million relating to the 1997 financial year. ICI Plc, the vendor of the business to Orica, has been notified to preserve Orica’s rights under the tax indemnity obtained upon acquisition of the business which provides indemnity for amounts exceeding certain limits. The Brazilian Taxation authority has been granted security over the Lorena site as well as a bank guarantee of up to approximately $9 million.
Critical accounting judgements and estimates
The Group is subject to income taxes in Australia and jurisdictions where it has foreign operations. Significant judgement is required in determining the worldwide provision for income taxes. There are many transactions and calculations undertaken during the ordinary course of business for which the ultimate tax determination is uncertain. The Group recognises liabilities for tax issues based on estimates of whether additional taxes will be due. Where the final tax outcome of these matters is different from the amounts that were initially recorded, such differences will impact the current and deferred tax provision in the period in which such determination is made.
In addition, deferred tax assets are recognised for deductible temporary differences and unused tax losses only if it is probable that future taxable profits are available to utilise those temporary differences and losses, and the tax losses continue to be available having regard to the nature and timing of their origination and compliance with the relevant tax legislation associated with their recoupment.
Assumptions are also made about the application of income tax legislation. These assumptions are subject to risk and uncertainty and there is a possibility that changes in circumstances or differences in opinions will alter outcomes which may impact the amount of deferred tax assets and deferred tax liabilities recorded on the Balance Sheet and the amount of tax losses and timing differences not yet recognised. In these circumstances, the carrying amount of deferred tax assets and liabilities may change, resulting in an impact on the earnings of the Group.
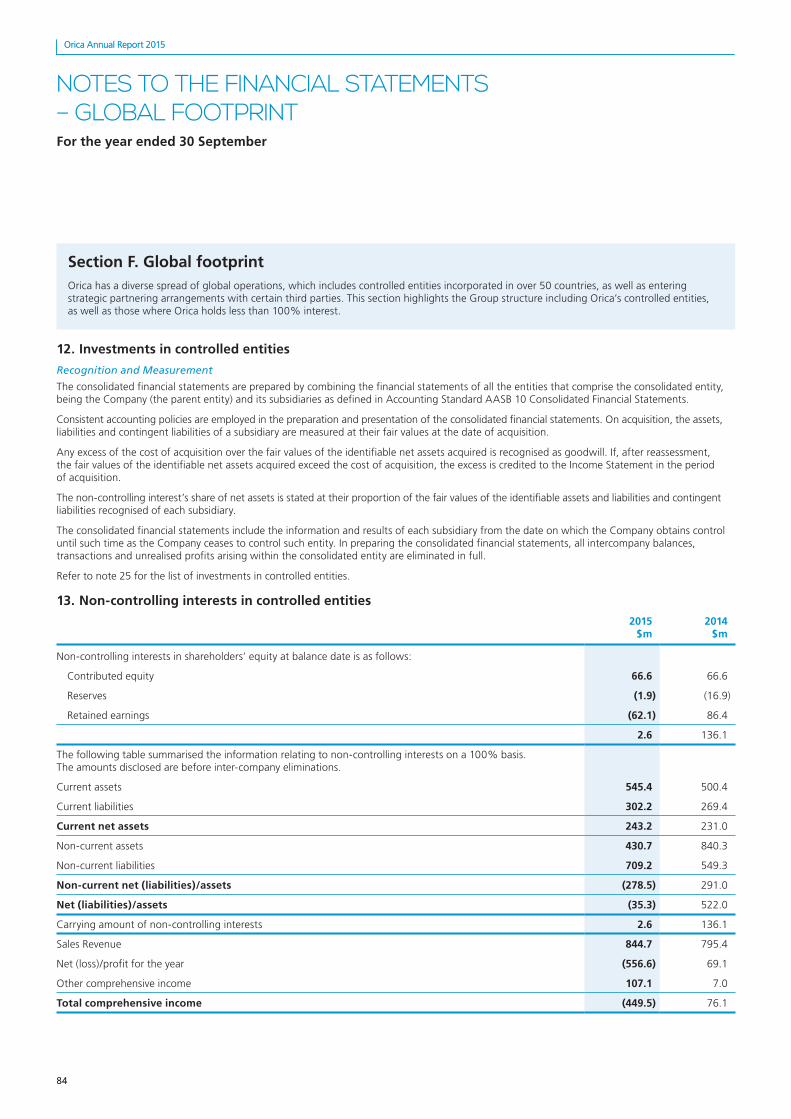
84
Orica Annual Report 2015
84
Orica Annual Report 2015
NOTES TO THE FINANCIAL STATEMENTS – GLOBAL FOOTPRINTFor the year ended 30 September
Section F. Global footprintOrica has a diverse spread of global operations, which includes controlled entities incorporated in over 50 countries, as well as entering strategic partnering arrangements with certain third parties. This section highlights the Group structure including Orica’s controlled entities, as well as those where Orica holds less than 100% interest.
12. Investments in controlled entities
Recognition and Measurement
The consolidated financial statements are prepared by combining the financial statements of all the entities that comprise the consolidated entity, being the Company (the parent entity) and its subsidiaries as defined in Accounting Standard AASB 10 Consolidated Financial Statements.
Consistent accounting policies are employed in the preparation and presentation of the consolidated financial statements. On acquisition, the assets, liabilities and contingent liabilities of a subsidiary are measured at their fair values at the date of acquisition.
Any excess of the cost of acquisition over the fair values of the identifiable net assets acquired is recognised as goodwill. If, after reassessment, the fair values of the identifiable net assets acquired exceed the cost of acquisition, the excess is credited to the Income Statement in the period of acquisition.
The non-controlling interest’s share of net assets is stated at their proportion of the fair values of the identifiable assets and liabilities and contingent liabilities recognised of each subsidiary.
The consolidated financial statements include the information and results of each subsidiary from the date on which the Company obtains control until such time as the Company ceases to control such entity. In preparing the consolidated financial statements, all intercompany balances, transactions and unrealised profits arising within the consolidated entity are eliminated in full.
Refer to note 25 for the list of investments in controlled entities.
13. Non-controlling interests in controlled entities
2015 $m
2014 $m
Non-controlling interests in shareholders’ equity at balance date is as follows:
Contributed equity 66.6 66.6
Reserves (1.9) (16.9)
Retained earnings (62.1) 86.4
2.6 136.1
The following table summarised the information relating to non-controlling interests on a 100% basis. The amounts disclosed are before inter-company eliminations.
Current assets 545.4 500.4
Current liabilities 302.2 269.4
Current net assets 243.2 231.0
Non-current assets 430.7 840.3
Non-current liabilities 709.2 549.3
Non-current net (liabilities)/assets (278.5) 291.0
Net (liabilities)/assets (35.3) 522.0
Carrying amount of non-controlling interests 2.6 136.1
Sales Revenue 844.7 795.4
Net (loss)/profit for the year (556.6) 69.1
Other comprehensive income 107.1 7.0
Total comprehensive income (449.5) 76.1

85
Orica Annual Report 2015
85
Orica Annual Report 2015
NOTES TO THE FINANCIAL STATEMENTS – GLOBAL FOOTPRINTFor the year ended 30 September
2015 $m
2014 $m
(Loss)/profit allocated to non-controlling interests (129.0) 23.5
Other comprehensive income related to non-controlling interests 15.3 (7.9)
Total (113.7) 15.6
Dividends paid – non-controlling interests (16.7) (17.4)
Cash flows (used in)/from operating activities (9.2) 2.7
Cash flows (used in)/from investments activities (12.8) (5.8)
Cash flows from financing activities 29.0 11.6
Net increase in cash and cash equivalents 7.0 8 .5
14. Investments accounted for using the equity method and joint operations
(a) Investments accounted for using the equity method
The table below shows the material investments (based on carrying values). All other investments are included in “Other”.
Consolidated
Ownership Carrying amount
Name Principal activityBalance
date 2015
% 2014
%2015
$m2014
$m
Nelson Brothers, LLC(1) Manufacture and sale of explosives 30 Sep 50.0 50.0 43.9 27.5
Nelson Brothers Mining Services LLC(1) Supply of explosives 30 Sep 50.0 50.0 34.1 32.8
Southwest Energy LLC(1) Sale of explosives 30 Sep 50.0 50.0 113.4 88.0
Thai Nitrate Company Ltd (2) Manufacture and sale of explosives 31 Dec 50.0 50.0 – 30.1
Other Various 12.1 26.4
203.5 204.8
Entities incorporated in (1) USA (2) Thailand
Summary of profit and loss of associates:2015
$m2014
$m
The aggregate net profit after tax of associates on a 100% basis are: 78.6 70.2
Orica’s share of net profit after tax of associates is: 39.0 33.1
(b) Joint operations
The Group owns a 45% interest of Yara Pilbara Nitrates Pty Ltd in conjunction with Yara Australia Pty Ltd (34.6%) and Yara Pilbara Holdings Pty Ltd (20.4%) (ownership – Orica 45%, Yara 45% and Apache 10%). The entity will operate a 330,000 tonnes per annum industrial grade ammonium nitrate plant on the Burrup Peninsula (Western Australia, Australia).
Construction of the plant at a capital cost of approximately US$830 million (100% interest) will be completed in 2016 with Yara managing construction and the ongoing operation of the plant.
The parties have committed to require substantially all of the output to be sold to them and they have rights to substantially all of the economic benefits of the assets. The dependence of the manufacturing entity upon Orica and Yara for the generation of cash flows indicates that the parties have an obligation for the liabilities of the manufacturing arrangement and accordingly it is accounted for as a joint operation.
13. Non-controlling interests in controlled entities (continued)
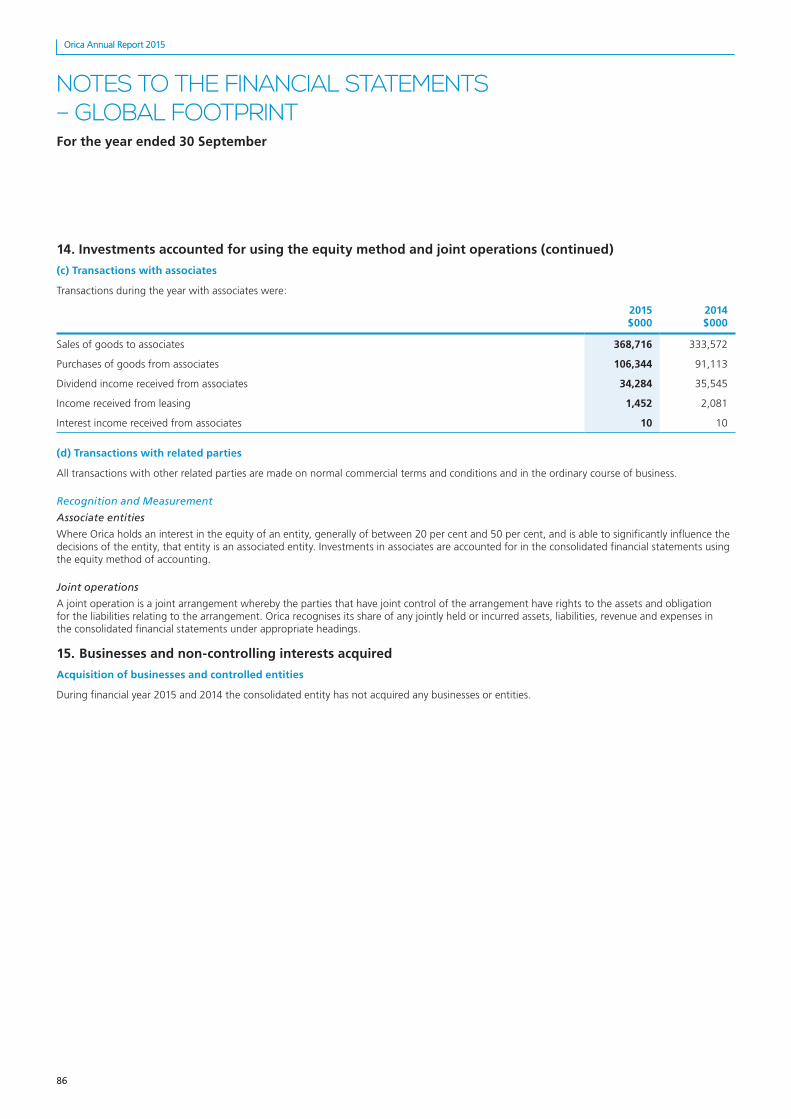
86
Orica Annual Report 2015
86
Orica Annual Report 2015
NOTES TO THE FINANCIAL STATEMENTS – GLOBAL FOOTPRINTFor the year ended 30 September
14. Investments accounted for using the equity method and joint operations (continued)
(c) Transactions with associates
Transactions during the year with associates were:
2015 $000
2014 $000
Sales of goods to associates 368,716 333,572
Purchases of goods from associates 106,344 91,113
Dividend income received from associates 34,284 35,545
Income received from leasing 1,452 2,081
Interest income received from associates 10 10
(d) Transactions with related parties
All transactions with other related parties are made on normal commercial terms and conditions and in the ordinary course of business.
Recognition and Measurement
Associate entities
Where Orica holds an interest in the equity of an entity, generally of between 20 per cent and 50 per cent, and is able to significantly influence the decisions of the entity, that entity is an associated entity. Investments in associates are accounted for in the consolidated financial statements using the equity method of accounting.
Joint operations
A joint operation is a joint arrangement whereby the parties that have joint control of the arrangement have rights to the assets and obligation for the liabilities relating to the arrangement. Orica recognises its share of any jointly held or incurred assets, liabilities, revenue and expenses in the consolidated financial statements under appropriate headings.
15. Businesses and non-controlling interests acquired
Acquisition of businesses and controlled entities
During financial year 2015 and 2014 the consolidated entity has not acquired any businesses or entities.

87
Orica Annual Report 2015
87
Orica Annual Report 2015
NOTES TO THE FINANCIAL STATEMENTS – GLOBAL FOOTPRINTFor the year ended 30 September
16. Discontinued operations and businesses disposed
This note shows the results of the continuing businesses and the discontinued business.
The Chemicals business was sold on 27 February 2015 and is reported as a Discontinued operation. Chemicals earnings for the period ended 30 September 2015 are included in the 2015 Discontinued numbers below.
For the year ended 30 September
Continuing 2015
$m
Discontinued 2015
$m
Consolidated 2015
$m
Continuing 2014
$m
Discontinued 2014
$m
Consolidated 2014
$m
Sales revenue (2) 5,653.3 497.4 6,123.2 5,721.5 1,145.0 6,796.3
Other income 50.1 0.8 50.9 56.1 0.8 56.9
Expenses
Raw materials and inventories (2) (2,671.9) (275.4) (2,919.8) (2,649.9) (696.8) (3,276.5)
Employee benefits expense (1,135.1) (49.3) (1,184.4) (1,156.9) (109.7) (1,266.6)
Depreciation and amortisation expense (292.7) (13.0) (305.7) (269.9) (30.9) (300.8)
Purchased services (360.7) (26.0) (386.7) (287.0) (48.3) (335.3)
Repairs and maintenance (155.5) (4.0) (159.5) (167.5) (11.4) (178.9)
Impairment of property, plant & equipment (947.6) – (947.6) – – –
Impairment of intangibles (894.0) – (894.0) – – –
Impairment of investments (49.3) – (49.3) (0.4) – (0.4)
Outgoing freight (255.8) (36.2) (292.0) (244.4) (79.0) (323.4)
Lease payments – operating leases (53.8) (3.1) (56.9) (57.2) (11.0) (68.2)
Other expenses (3) (125.6) (86.6) (212.2) (115.1) (91.4) (206.5)
Share of net profit of associates accounted for using the equity method 39.0 – 39.0 33.2 (0.1) 33.1
Total (6,903.0) (493.6) (7,369.1) (4,915.1) (1,078.6) (5,923.5)
(Loss)/profit from operations (1,199.6) 4.6 (1,195.0) 862.5 67.2 929.7
Net financing costs
Financial income 42.2 0.1 42.3 35.3 – 35.3
Financial expenses (124.4) – (124.4) (150.1) (1.0) (151.1)
Net financing costs (82.2) 0.1 (82.1) (114.8) (1.0) (115.8)
(Loss)/profit before income tax expense (1,281.8) 4.7 (1,277.1) 747.7 66.2 813.9
Income tax (expense)/benefit (122.0) 2.7 (119.3) (161.5) (26.4) (187.9)
Net (loss)/profit for the year (1,403.8) 7.4 (1,396.4) 586.2 39.8 626.0
Net (loss)/profit for the year attributable to:
Shareholders of Orica Limited (1,274.4) 7.0 (1,267.4) 563.6 38.9 602.5
Non-controlling interests (129.4) 0.4 (129.0) 22.6 0.9 23.5
Net (loss)/profit for the year (1,403.8) 7.4 (1,396.4) 586.2 39.8 626.0
(1) The $4.6 million profit from operations (for Chemicals business within Discontinued operations) is for the five months period ended 27 February 2015 and the $67.2 million profit for the 12 months period ended 30 September 2014.
(2) Consolidated includes elimination of inter-segment sales of $27.5m (2014 $70.2m).(3) The 2015 Discontinued operations includes $26.7 million pre tax loss ($13.5m loss post tax) on sale of Chemicals business.
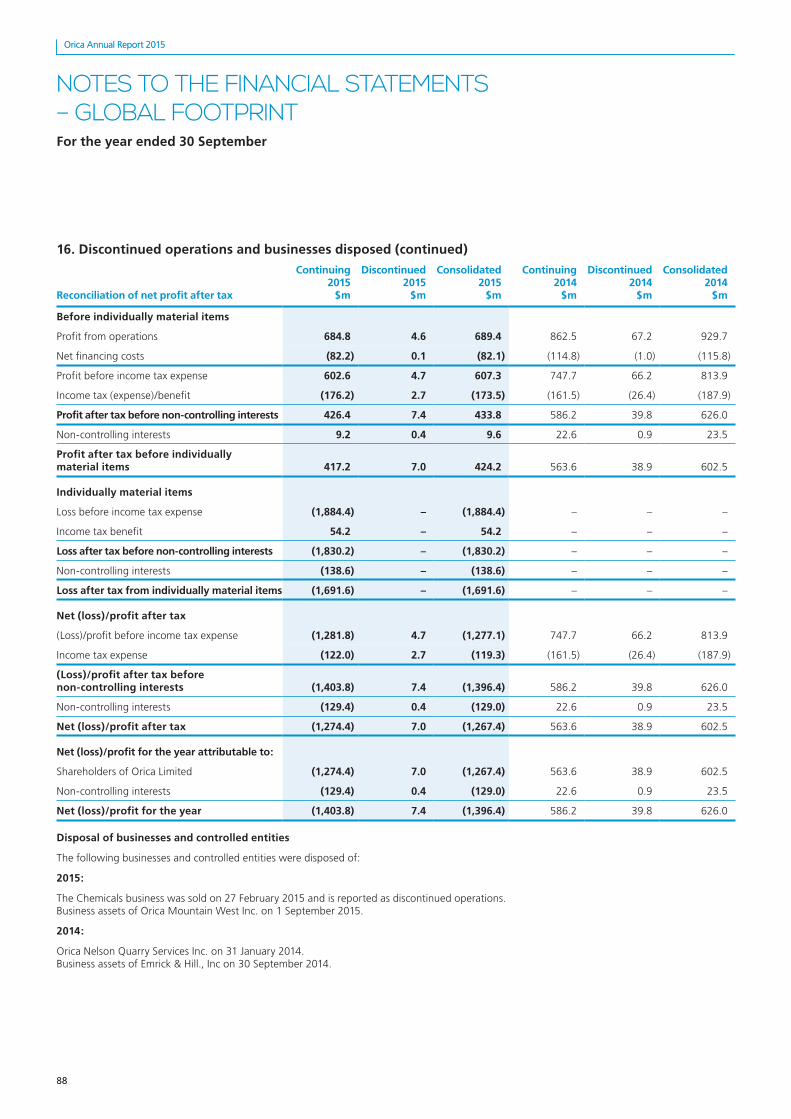
88
Orica Annual Report 2015
88
Orica Annual Report 2015
NOTES TO THE FINANCIAL STATEMENTS – GLOBAL FOOTPRINTFor the year ended 30 September
16. Discontinued operations and businesses disposed (continued)
Reconciliation of net profit after tax
Continuing 2015
$m
Discontinued 2015
$m
Consolidated 2015
$m
Continuing 2014
$m
Discontinued 2014
$m
Consolidated 2014
$m
Before individually material items
Profit from operations 684.8 4.6 689.4 862.5 67.2 929.7
Net financing costs (82.2) 0.1 (82.1) (114.8) (1.0) (115.8)
Profit before income tax expense 602.6 4.7 607.3 747.7 66.2 813.9
Income tax (expense)/benefit (176.2) 2.7 (173.5) (161.5) (26.4) (187.9)
Profit after tax before non-controlling interests 426.4 7.4 433.8 586.2 39.8 626.0
Non-controlling interests 9.2 0.4 9.6 22.6 0.9 23.5
Profit after tax before individually material items 417.2 7.0 424.2 563.6 38.9 602.5
Individually material items
Loss before income tax expense (1,884.4) – (1,884.4) – – –
Income tax benefit 54.2 – 54.2 – – –
Loss after tax before non-controlling interests (1,830.2) – (1,830.2) – – –
Non-controlling interests (138.6) – (138.6) – – –
Loss after tax from individually material items (1,691.6) – (1,691.6) – – –
Net (loss)/profit after tax
(Loss)/profit before income tax expense (1,281.8) 4.7 (1,277.1) 747.7 66.2 813.9
Income tax expense (122.0) 2.7 (119.3) (161.5) (26.4) (187.9)
(Loss)/profit after tax before non-controlling interests (1,403.8) 7.4 (1,396.4) 586.2 39.8 626.0
Non-controlling interests (129.4) 0.4 (129.0) 22.6 0.9 23.5
Net (loss)/profit after tax (1,274.4) 7.0 (1,267.4) 563.6 38.9 602.5
Net (loss)/profit for the year attributable to:
Shareholders of Orica Limited (1,274.4) 7.0 (1,267.4) 563.6 38.9 602.5
Non-controlling interests (129.4) 0.4 (129.0) 22.6 0.9 23.5
Net (loss)/profit for the year (1,403.8) 7.4 (1,396.4) 586.2 39.8 626.0
Disposal of businesses and controlled entities
The following businesses and controlled entities were disposed of:
2015:
The Chemicals business was sold on 27 February 2015 and is reported as discontinued operations. Business assets of Orica Mountain West Inc. on 1 September 2015.
2014:
Orica Nelson Quarry Services Inc. on 31 January 2014. Business assets of Emrick & Hill., Inc on 30 September 2014.
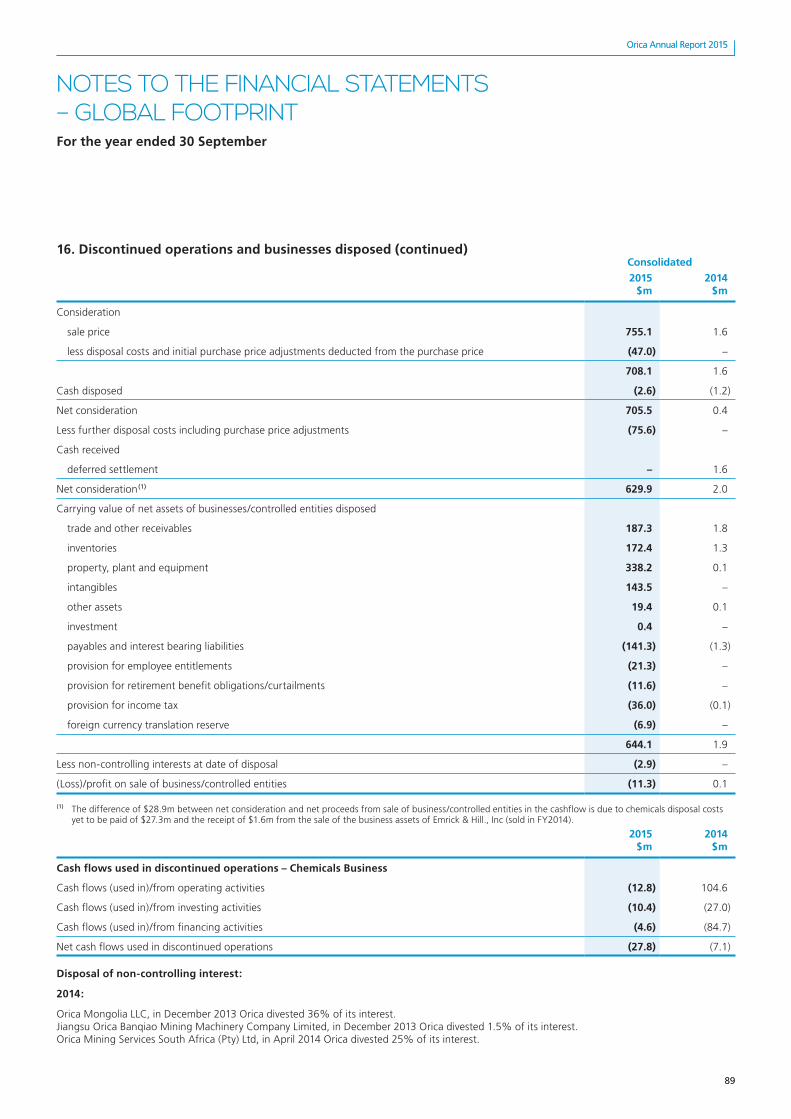
89
Orica Annual Report 2015
89
Orica Annual Report 2015
NOTES TO THE FINANCIAL STATEMENTS – GLOBAL FOOTPRINTFor the year ended 30 September
16. Discontinued operations and businesses disposed (continued)Consolidated
2015 $m
2014 $m
Consideration
sale price 755.1 1.6
less disposal costs and initial purchase price adjustments deducted from the purchase price (47.0) –
708.1 1.6
Cash disposed (2.6) (1.2)
Net consideration 705.5 0.4
Less further disposal costs including purchase price adjustments (75.6) –
Cash received
deferred settlement – 1.6
Net consideration (1) 629.9 2.0
Carrying value of net assets of businesses/controlled entities disposed
trade and other receivables 187.3 1.8
inventories 172.4 1.3
property, plant and equipment 338.2 0.1
intangibles 143.5 –
other assets 19.4 0.1
investment 0.4 –
payables and interest bearing liabilities (141.3) (1.3)
provision for employee entitlements (21.3) –
provision for retirement benefit obligations/curtailments (11.6) –
provision for income tax (36.0) (0.1)
foreign currency translation reserve (6.9) –
644.1 1.9
Less non-controlling interests at date of disposal (2.9) –
(Loss)/profit on sale of business/controlled entities (11.3) 0.1
(1) The difference of $28.9m between net consideration and net proceeds from sale of business/controlled entities in the cashflow is due to chemicals disposal costs yet to be paid of $27.3m and the receipt of $1.6m from the sale of the business assets of Emrick & Hill., Inc (sold in FY2014).
2015 $m
2014 $m
Cash flows used in discontinued operations – Chemicals Business
Cash flows (used in)/from operating activities (12.8) 104.6
Cash flows (used in)/from investing activities (10.4) (27.0)
Cash flows (used in)/from financing activities (4.6) (84.7)
Net cash flows used in discontinued operations (27.8) (7.1)
Disposal of non-controlling interest:
2014:
Orica Mongolia LLC, in December 2013 Orica divested 36% of its interest. Jiangsu Orica Banqiao Mining Machinery Company Limited, in December 2013 Orica divested 1.5% of its interest. Orica Mining Services South Africa (Pty) Ltd, in April 2014 Orica divested 25% of its interest.
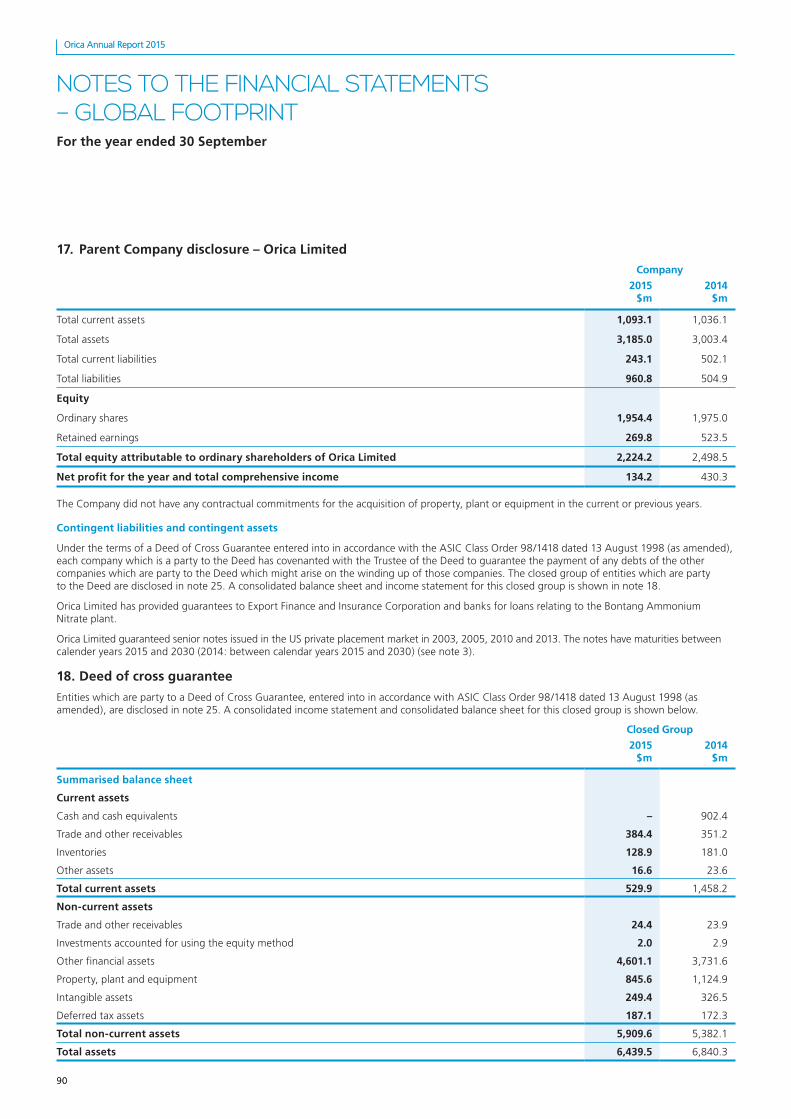
90
Orica Annual Report 2015
90
Orica Annual Report 2015
NOTES TO THE FINANCIAL STATEMENTS – GLOBAL FOOTPRINTFor the year ended 30 September
17. Parent Company disclosure – Orica Limited
Company
2015 $m
2014 $m
Total current assets 1,093.1 1,036.1
Total assets 3,185.0 3,003.4
Total current liabilities 243.1 502.1
Total liabilities 960.8 504.9
Equity
Ordinary shares 1,954.4 1,975.0
Retained earnings 269.8 523.5
Total equity attributable to ordinary shareholders of Orica Limited 2,224.2 2,498.5
Net profit for the year and total comprehensive income 134.2 430.3
The Company did not have any contractual commitments for the acquisition of property, plant or equipment in the current or previous years.
Contingent liabilities and contingent assets
Under the terms of a Deed of Cross Guarantee entered into in accordance with the ASIC Class Order 98/1418 dated 13 August 1998 (as amended), each company which is a party to the Deed has covenanted with the Trustee of the Deed to guarantee the payment of any debts of the other companies which are party to the Deed which might arise on the winding up of those companies. The closed group of entities which are party to the Deed are disclosed in note 25. A consolidated balance sheet and income statement for this closed group is shown in note 18.
Orica Limited has provided guarantees to Export Finance and Insurance Corporation and banks for loans relating to the Bontang Ammonium Nitrate plant.
Orica Limited guaranteed senior notes issued in the US private placement market in 2003, 2005, 2010 and 2013. The notes have maturities between calender years 2015 and 2030 (2014: between calendar years 2015 and 2030) (see note 3).
18. Deed of cross guarantee
Entities which are party to a Deed of Cross Guarantee, entered into in accordance with ASIC Class Order 98/1418 dated 13 August 1998 (as amended), are disclosed in note 25. A consolidated income statement and consolidated balance sheet for this closed group is shown below.
Closed Group
2015 $m
2014 $m
Summarised balance sheet
Current assets
Cash and cash equivalents – 902.4
Trade and other receivables 384.4 351.2
Inventories 128.9 181.0
Other assets 16.6 23.6
Total current assets 529.9 1,458.2
Non-current assets
Trade and other receivables 24.4 23.9
Investments accounted for using the equity method 2.0 2.9
Other financial assets 4,601.1 3,731.6
Property, plant and equipment 845.6 1,124.9
Intangible assets 249.4 326.5
Deferred tax assets 187.1 172.3
Total non-current assets 5,909.6 5,382.1
Total assets 6,439.5 6,840.3
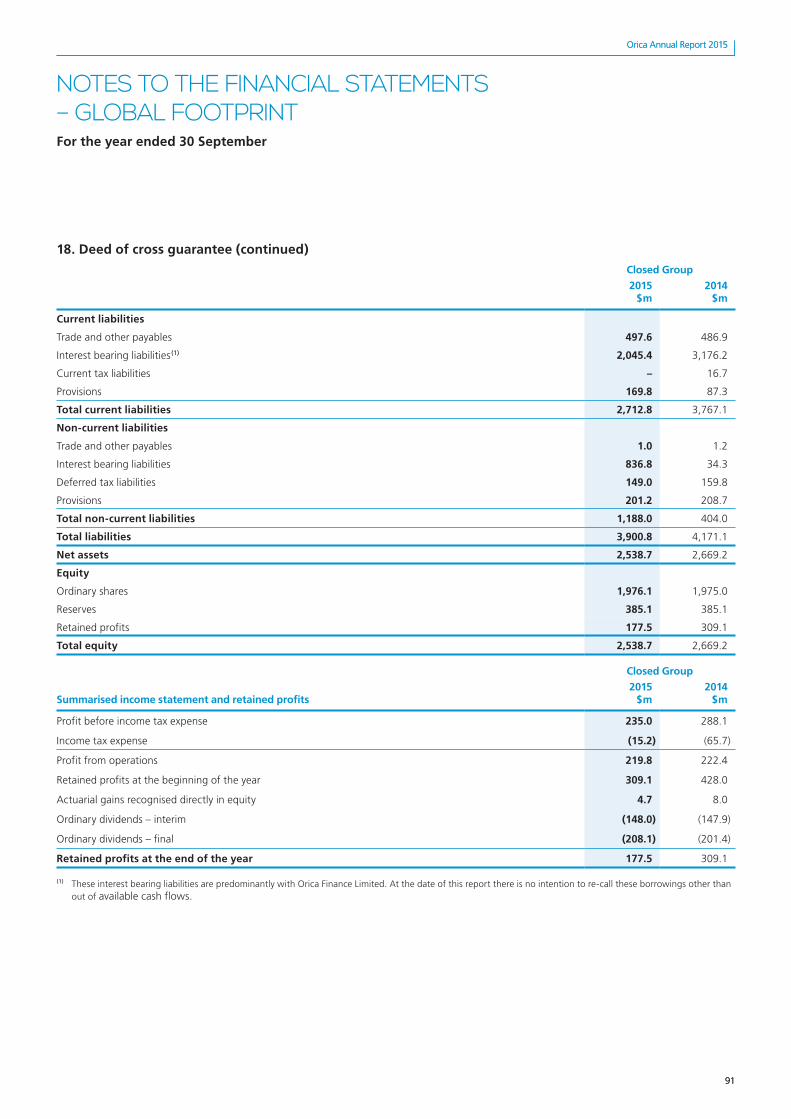
91
Orica Annual Report 2015
91
Orica Annual Report 2015
NOTES TO THE FINANCIAL STATEMENTS – GLOBAL FOOTPRINTFor the year ended 30 September
Closed Group
2015 $m
2014 $m
Current liabilities
Trade and other payables 497.6 486.9
Interest bearing liabilities (1) 2,045.4 3,176.2
Current tax liabilities – 16.7
Provisions 169.8 87.3
Total current liabilities 2,712.8 3,767.1
Non-current liabilities
Trade and other payables 1.0 1.2
Interest bearing liabilities 836.8 34.3
Deferred tax liabilities 149.0 159.8
Provisions 201.2 208.7
Total non-current liabilities 1,188.0 404.0
Total liabilities 3,900.8 4,171.1
Net assets 2,538.7 2,669.2
Equity
Ordinary shares 1,976.1 1,975.0
Reserves 385.1 385.1
Retained profits 177.5 309.1
Total equity 2,538.7 2,669.2
Closed Group
Summarised income statement and retained profits2015
$m 2014
$m
Profit before income tax expense 235.0 288.1
Income tax expense (15.2) (65.7)
Profit from operations 219.8 222.4
Retained profits at the beginning of the year 309.1 428.0
Actuarial gains recognised directly in equity 4.7 8.0
Ordinary dividends – interim (148.0) (147.9)
Ordinary dividends – final (208.1) (201.4)
Retained profits at the end of the year 177.5 309.1
(1) These interest bearing liabilities are predominantly with Orica Finance Limited. At the date of this report there is no intention to re-call these borrowings other than out of available cash flows.
18. Deed of cross guarantee (continued)
92
Orica Annual Report 2015
92
Orica Annual Report 2015
NOTES TO THE FINANCIAL STATEMENTS – REwARD AND RECOGNITIONFor the year ended 30 September
Section G. Reward and recognitionOrica operates in over 50 countries and has more than 12,000 employees. This section provides insights into the reward and recognition of employees, in addition to the employee benefits expense and employee provisions disclosed in the Income Statement and Note 6 respectively.
This section should be read in conjunction with the Remuneration Report, contained within the Directors’ Report, which provides specific details on the setting of remuneration for Key Management Personnel.
19. Employee share plans and Remuneration
Employees’ options entitlement
The following plans have options over Orica shares outstanding at 30 September 2014 or 30 September 2015:
� The Long Term Incentive Plan (LTIP) (Refer to Remuneration Report Section B)
� LTEIP shares which are treated as options for accounting purposes
� Long Term Incentive Rights Plan (LTIRP)
� The Sign-on Rights Plans
Orica engaged PwC to value issued options. The valuations prepared by PwC use methodologies consistent with assumptions that apply under the Black Scholes option pricing model and reflect the value (as at grant date) of options held at 30 September. The assumptions underlying the option valuations are: (a) the exercise price of the option, (b) the life of the option, (c) the current price of the underlying securities, (d) the expected volatility of the share price, (e) the dividends expected on the shares, and (f) the risk-free interest rate for the life of the option.
(a) (i) Long Term Equity Incentive Plan (LTEIP)
The Orica Long-Term Equity Incentive Plan (LTEIP) was the long-term incentive component of the remuneration arrangements for Executive KMP from 2004 until Financial year 2015 when a performance rights plan was implemented. The LTEIP is an equity plan where shares are acquired up front through the provision of a non-recourse loan from the Company, provided for the sole purpose of acquiring shares in Orica. It operates much like a traditional option plan, as the outstanding loan balance is effectively the ‘exercise price’ that must be paid before any value can be realised. Maximum rewards under LTEIP arise where there is strong share price performance, strong earnings per share growth and strong relative total shareholder return performance.

93
Orica Annual Report 2015
93
Orica Annual Report 2015
NOTES TO THE FINANCIAL STATEMENTS – REwARD AND RECOGNITIONFor the year ended 30 September
19. Employee share plans and Remuneration (continued)
The number of option (LTEIP) issues, values and related Executive loan information in relation to Orica Executive KMP is shown in the following table:
Grant date Vesting date
Number of options
issued
Number of options held at 30 September
2015
Number of options held at 30 September
2014
Number of participants at 30 September
2015
Number of participants at 30 September
2014
Value of options at
grant date(1) $
21 Feb 14 23 Jan 17 839,544 522,534 839,544 9 14 6,800,306
11 Mar 13 23 Jan 16 33,919 33,919 33,919 1 1 282,545
7 Feb 13 23 Jan 16 704,355 377,356 670,436 8 10 6,282,847
24 Feb 12 23 Jan 15 305,302 – 305,302 – 1 2,842,362
19 Dec 11 23 Jan 15 592,713 – 451,683 – 4 4,747,631
2,475,833 933,809 2,300,884 18 30 20,955,691
(1) The assumptions underlying the options valuations are:
Grant date
Price of Orica Shares at grant date
$
Expected volatility in share price
%
Dividends expected on shares(2)
%
Risk free interest rate
%
Fair value per option (3)
$
21 Feb 14 24.30 25 Nil 3.05 8.10
11 Mar 13 25.90 25 Nil 2.97 8.33
7 Feb 13 26.73 25 Nil 2.78 8.92
24 Feb 12 26.62 25 Nil 3.71 9.31
19 Dec 11 24.68 25 Nil 2.99 8.01
(2) A net dividend yield of nil has been adopted as participants will fully benefit from dividend receipts as loan repayment during the life of the LTEIP instruments.(3) Under the December 2010 and subsequent LTEIP schemes, a portion of the loan may be forgiven based on Orica’s compound growth in earnings per share over a
pre-determined performance period. Under accounting standards, the share based payments expense (fair value per option) is adjusted to an expense based on the actual EPS growth achieved. The range of fair values per option is:
Grant date
Less than 5% EPS growth per annum
$
EPS growth of 5% per annum
$
EPS growth of 10% per annum
$
EPS growth of 15% or higher per annum
$
21 Feb 14 6.77 7.42 8.10 8.83
11 Mar 13 6.90 7.47 8.33 9.09
7 Feb 13 7.53 8.20 8.92 9.78
24 Feb 12 5.87 7.44 9.31 11.32
19 Dec 11 5.02 6.37 8.01 9.89
LTEIP options over unissued shares:
Exercisable between
Balance 30 Sep 13
Issued during the
period
Exercised during the
period
Lapsed during the
period Balance
30 Sep 14
Issued during the
period
Exercised during the
period
Lapsed during the
period Balance
30 Sep 15
18 Nov 16 – 23 Jan 17 – 839,544 – – 839,544 – – (317,010) 522,534
18 Nov 15 – 23 Jan 16 33,919 – – – 33,919 – – – 33,919
18 Nov 15 – 23 Jan 16 704,355 – – (33,919) 670,436 – – (293,080) 377,356
18 Nov 14 – 23 Jan 15 305,302 – – – 305,302 – – (305,302) –
18 Nov 14 – 23 Jan 15 451,683 – – – 451,683 – – (451,683) –
19 Nov 13 – 23 Jan 14 1,419,915 – (589,192) (830,723) – – – – –
Total 2,915,174 839,544 (589,192) (864,642) 2,300,884 – – (1,367,075) 933,809
The amounts receivable from employees in relation to these loans and share capital issued under these schemes are not recognised and any shares purchased on-market are recognised as a share buy-back and deducted from shareholders equity.
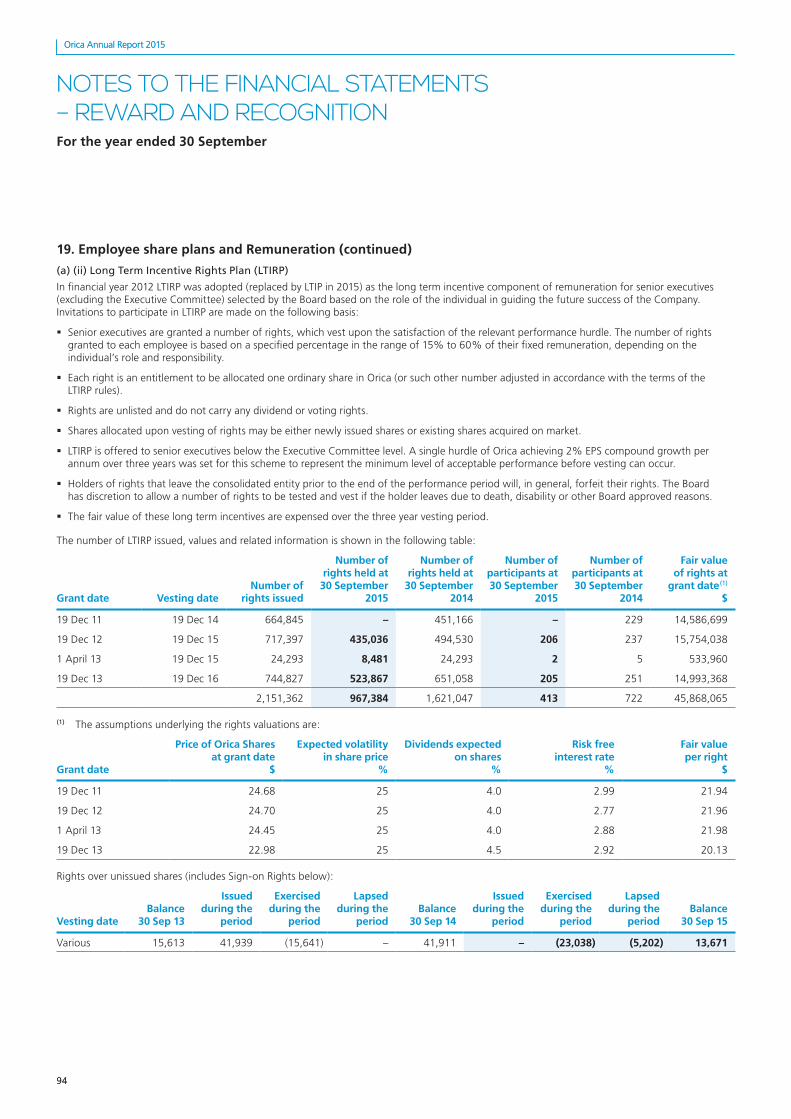
94
Orica Annual Report 2015
94
Orica Annual Report 2015
NOTES TO THE FINANCIAL STATEMENTS – REwARD AND RECOGNITIONFor the year ended 30 September
19. Employee share plans and Remuneration (continued)
(a) (ii) Long Term Incentive Rights Plan (LTIRP)
In financial year 2012 LTIRP was adopted (replaced by LTIP in 2015) as the long term incentive component of remuneration for senior executives (excluding the Executive Committee) selected by the Board based on the role of the individual in guiding the future success of the Company. Invitations to participate in LTIRP are made on the following basis:
� Senior executives are granted a number of rights, which vest upon the satisfaction of the relevant performance hurdle. The number of rights granted to each employee is based on a specified percentage in the range of 15% to 60% of their fixed remuneration, depending on the individual’s role and responsibility.
� Each right is an entitlement to be allocated one ordinary share in Orica (or such other number adjusted in accordance with the terms of the LTIRP rules).
� Rights are unlisted and do not carry any dividend or voting rights.
� Shares allocated upon vesting of rights may be either newly issued shares or existing shares acquired on market.
� LTIRP is offered to senior executives below the Executive Committee level. A single hurdle of Orica achieving 2% EPS compound growth per annum over three years was set for this scheme to represent the minimum level of acceptable performance before vesting can occur.
� Holders of rights that leave the consolidated entity prior to the end of the performance period will, in general, forfeit their rights. The Board has discretion to allow a number of rights to be tested and vest if the holder leaves due to death, disability or other Board approved reasons.
� The fair value of these long term incentives are expensed over the three year vesting period.
The number of LTIRP issued, values and related information is shown in the following table:
Grant date Vesting dateNumber of
rights issued
Number of rights held at
30 September 2015
Number of rights held at
30 September 2014
Number of participants at 30 September
2015
Number of participants at 30 September
2014
Fair value of rights at
grant date(1) $
19 Dec 11 19 Dec 14 664,845 – 451,166 – 229 14,586,699
19 Dec 12 19 Dec 15 717,397 435,036 494,530 206 237 15,754,038
1 April 13 19 Dec 15 24,293 8,481 24,293 2 5 533,960
19 Dec 13 19 Dec 16 744,827 523,867 651,058 205 251 14,993,368
2,151,362 967,384 1,621,047 413 722 45,868,065
(1) The assumptions underlying the rights valuations are:
Grant date
Price of Orica Shares at grant date
$
Expected volatility in share price
%
Dividends expected on shares
%
Risk free interest rate
%
Fair value per right
$
19 Dec 11 24.68 25 4.0 2.99 21.94
19 Dec 12 24.70 25 4.0 2.77 21.96
1 April 13 24.45 25 4.0 2.88 21.98
19 Dec 13 22.98 25 4.5 2.92 20.13
Rights over unissued shares (includes Sign-on Rights below):
Vesting dateBalance
30 Sep 13
Issued during the
period
Exercised during the
period
Lapsed during the
periodBalance
30 Sep 14
Issued during the
period
Exercised during the
period
Lapsed during the
periodBalance
30 Sep 15
Various 15,613 41,939 (15,641) – 41,911 – (23,038) (5,202) 13,671
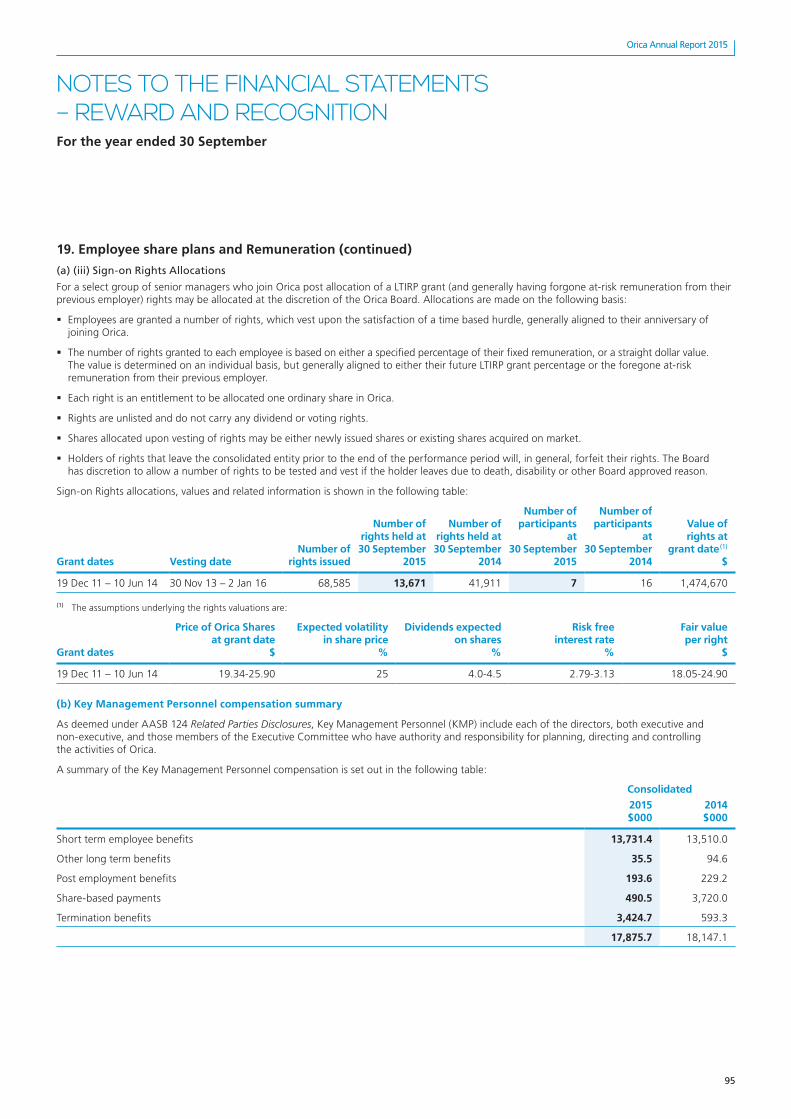
95
Orica Annual Report 2015
95
Orica Annual Report 2015
NOTES TO THE FINANCIAL STATEMENTS – REwARD AND RECOGNITIONFor the year ended 30 September
19. Employee share plans and Remuneration (continued)
(a) (iii) Sign-on Rights Allocations
For a select group of senior managers who join Orica post allocation of a LTIRP grant (and generally having forgone at-risk remuneration from their previous employer) rights may be allocated at the discretion of the Orica Board. Allocations are made on the following basis:
� Employees are granted a number of rights, which vest upon the satisfaction of a time based hurdle, generally aligned to their anniversary of joining Orica.
� The number of rights granted to each employee is based on either a specified percentage of their fixed remuneration, or a straight dollar value. The value is determined on an individual basis, but generally aligned to either their future LTIRP grant percentage or the foregone at-risk remuneration from their previous employer.
� Each right is an entitlement to be allocated one ordinary share in Orica.
� Rights are unlisted and do not carry any dividend or voting rights.
� Shares allocated upon vesting of rights may be either newly issued shares or existing shares acquired on market.
� Holders of rights that leave the consolidated entity prior to the end of the performance period will, in general, forfeit their rights. The Board has discretion to allow a number of rights to be tested and vest if the holder leaves due to death, disability or other Board approved reason.
Sign-on Rights allocations, values and related information is shown in the following table:
Grant dates Vesting dateNumber of
rights issued
Number of rights held at 30 September
2015
Number of rights held at 30 September
2014
Number of participants
at 30 September
2015
Number of participants
at 30 September
2014
Value of rights at
grant date(1) $
19 Dec 11 – 10 Jun 14 30 Nov 13 – 2 Jan 16 68,585 13,671 41,911 7 16 1,474,670
(1) The assumptions underlying the rights valuations are:
Grant dates
Price of Orica Shares at grant date
$
Expected volatility in share price
%
Dividends expected on shares
%
Risk free interest rate
%
Fair value per right
$
19 Dec 11 – 10 Jun 14 19.34-25.90 25 4.0-4.5 2.79-3.13 18.05-24.90
(b) Key Management Personnel compensation summary
As deemed under AASB 124 Related Parties Disclosures, Key Management Personnel (KMP) include each of the directors, both executive and non-executive, and those members of the Executive Committee who have authority and responsibility for planning, directing and controlling the activities of Orica.
A summary of the Key Management Personnel compensation is set out in the following table:
Consolidated
2015 $000
2014 $000
Short term employee benefits 13,731.4 13,510.0
Other long term benefits 35.5 94.6
Post employment benefits 193.6 229.2
Share-based payments 490.5 3,720.0
Termination benefits 3,424.7 593.3
17,875.7 18,147.1
96
Orica Annual Report 2015
96
Orica Annual Report 2015
NOTES TO THE FINANCIAL STATEMENTS – REwARD AND RECOGNITIONFor the year ended 30 September
20. Superannuation commitments
Recognition and Measurement
Contributions to defined contribution superannuation funds are taken to the Income Statement in the year in which the expense is incurred. For each defined benefit scheme, the cost of providing pensions is charged to the Income Statement so as to recognise current and past service costs, interest cost on defined benefit obligations, and the effect of any curtailments or settlements, net of returns on plan assets. All actuarial gains and losses are recognised in other comprehensive income. The consolidated entity’s net obligation in respect of defined benefit pension plans is calculated by estimating the amount of future benefit that employees have earned in return for their service in the current and prior periods; that benefit is discounted to determine its present value, and the fair value of any plan assets is deducted. The discount rate is the yield at the balance sheet date on high quality corporate bonds or in countries where there is no deep market in such bonds, the market yields on government bonds that have maturity dates approximating the terms of the consolidated entity’s obligations. The calculation is performed annually by a qualified actuary using the projected unit credit method.
(a) Superannuation plans
The consolidated entity contributes to a number of superannuation plans that exist to provide benefit for employees and their dependants on retirement, disability or death. The superannuation plans cover company sponsored plans, other qualifying plans and multi-employer industry/union plans.
Company sponsored plans
� The principal benefits are pensions or lump sum payments for members on resignation, retirement, disability or death. The benefits are provided on either a defined benefit or defined contribution basis.
� Employee contribution rates are either fixed by the rules of the plans or selected by members from time to time from a specified range of rates. The employer entities contribute the balance of the cost required to fund the defined benefits or, in the case of defined contribution plans, the amounts required by the rules of the plan.
� The contributions made by the employer entities to defined contribution plans are in accordance with the requirements of the governing rules of such plans or are required under law.
Government plans
� Some controlled entities participate in government plans on behalf of certain employees, which provide pension benefits. There exists a legally enforceable obligation on employer entities to contribute as required by legislation.
Industry plans
� Some controlled entities participate in industry plans on behalf of certain employees.
� These plans operate on an accumulation basis and provide lump sum benefits for members on resignation, retirement, disability or death.
The employer entities have a legally enforceable obligation to contribute a regular amount for each employee member of these plans.
� The employer entities have no other legal liability to contribute to the plans.
(b) Defined contribution pension plans
The consolidated entity contributes to several defined contribution pension plans on behalf of its employees. The amount recognised as an expense for the financial year ended 30 September 2015 was $37.4 million (2014 $47.3 million).
(c) Defined benefit pension plans
The consolidated entity participates in several local and overseas defined benefit post-employment plans that provide benefits to employees upon retirement. Plan funding is carried out in accordance with the requirements of trust deeds and the advice of actuaries. The information within these financial statements has been prepared by the local plan external actuaries. Orica were assisted by Towers Watson Australia to consolidate those results globally. During the year, the consolidated entity made employer contributions of $29.3 million (2014 $35.4 million) to defined benefit plans. The Group’s external actuaries have forecast total employer contributions and benefit payments to defined benefit plans of $28.6 million for 2016.
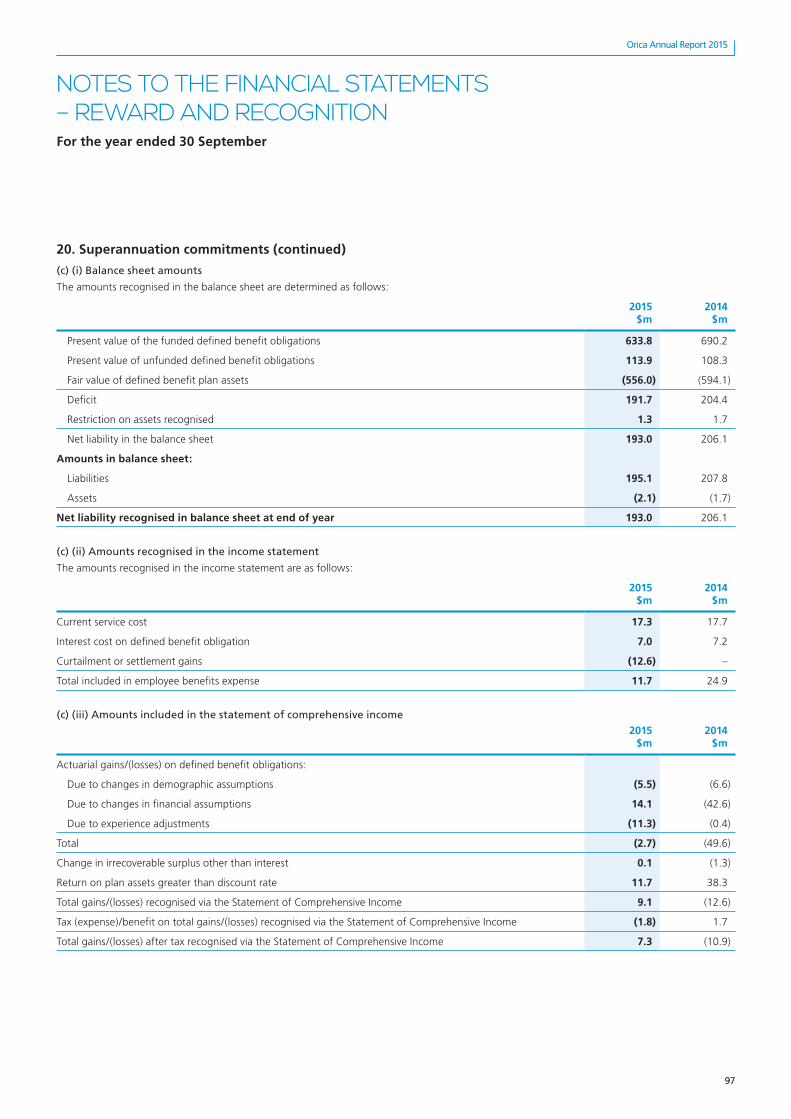
97
Orica Annual Report 2015
97
Orica Annual Report 2015
NOTES TO THE FINANCIAL STATEMENTS – REwARD AND RECOGNITIONFor the year ended 30 September
20. Superannuation commitments (continued)
(c) (i) Balance sheet amounts
The amounts recognised in the balance sheet are determined as follows:
2015 $m
2014 $m
Present value of the funded defined benefit obligations 633.8 690.2
Present value of unfunded defined benefit obligations 113.9 108.3
Fair value of defined benefit plan assets (556.0) (594.1)
Deficit 191.7 204.4
Restriction on assets recognised 1.3 1.7
Net liability in the balance sheet 193.0 206.1
Amounts in balance sheet:
Liabilities 195.1 207.8
Assets (2.1) (1.7)
Net liability recognised in balance sheet at end of year 193.0 206.1
(c) (ii) Amounts recognised in the income statement
The amounts recognised in the income statement are as follows:
2015 $m
2014 $m
Current service cost 17.3 17.7
Interest cost on defined benefit obligation 7.0 7.2
Curtailment or settlement gains (12.6) –
Total included in employee benefits expense 11.7 24.9
(c) (iii) Amounts included in the statement of comprehensive income
2015 $m
2014 $m
Actuarial gains/(losses) on defined benefit obligations:
Due to changes in demographic assumptions (5.5) (6.6)
Due to changes in financial assumptions 14.1 (42.6)
Due to experience adjustments (11.3) (0.4)
Total (2.7) (49.6)
Change in irrecoverable surplus other than interest 0.1 (1.3)
Return on plan assets greater than discount rate 11.7 38.3
Total gains/(losses) recognised via the Statement of Comprehensive Income 9.1 (12.6)
Tax (expense)/benefit on total gains/(losses) recognised via the Statement of Comprehensive Income (1.8) 1.7
Total gains/(losses) after tax recognised via the Statement of Comprehensive Income 7.3 (10.9)
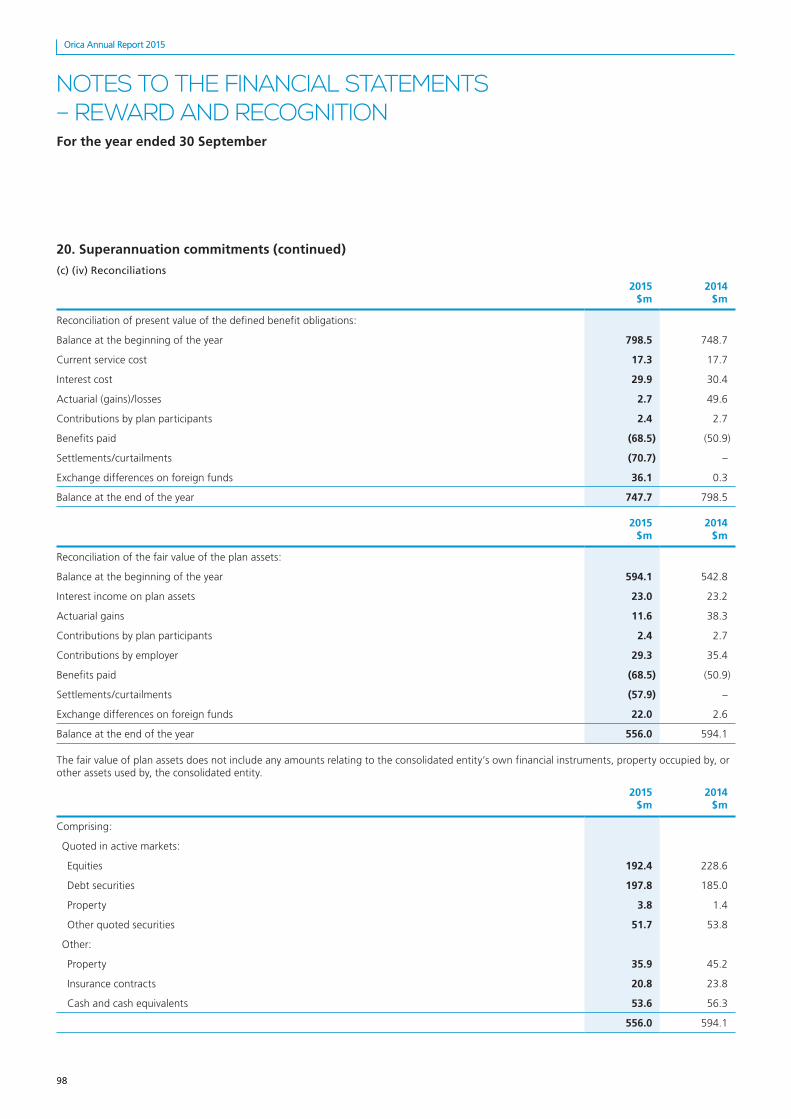
98
Orica Annual Report 2015
98
Orica Annual Report 2015
NOTES TO THE FINANCIAL STATEMENTS – REwARD AND RECOGNITIONFor the year ended 30 September
20. Superannuation commitments (continued)
(c) (iv) Reconciliations
2015 $m
2014 $m
Reconciliation of present value of the defined benefit obligations:
Balance at the beginning of the year 798.5 748.7
Current service cost 17.3 17.7
Interest cost 29.9 30.4
Actuarial (gains)/losses 2.7 49.6
Contributions by plan participants 2.4 2.7
Benefits paid (68.5) (50.9)
Settlements/curtailments (70.7) –
Exchange differences on foreign funds 36.1 0.3
Balance at the end of the year 747.7 798.5
2015 $m
2014 $m
Reconciliation of the fair value of the plan assets:
Balance at the beginning of the year 594.1 542.8
Interest income on plan assets 23.0 23.2
Actuarial gains 11.6 38.3
Contributions by plan participants 2.4 2.7
Contributions by employer 29.3 35.4
Benefits paid (68.5) (50.9)
Settlements/curtailments (57.9) –
Exchange differences on foreign funds 22.0 2.6
Balance at the end of the year 556.0 594.1
The fair value of plan assets does not include any amounts relating to the consolidated entity’s own financial instruments, property occupied by, or other assets used by, the consolidated entity.
2015 $m
2014 $m
Comprising:
Quoted in active markets:
Equities 192.4 228.6
Debt securities 197.8 185.0
Property 3.8 1.4
Other quoted securities 51.7 53.8
Other:
Property 35.9 45.2
Insurance contracts 20.8 23.8
Cash and cash equivalents 53.6 56.3
556.0 594.1
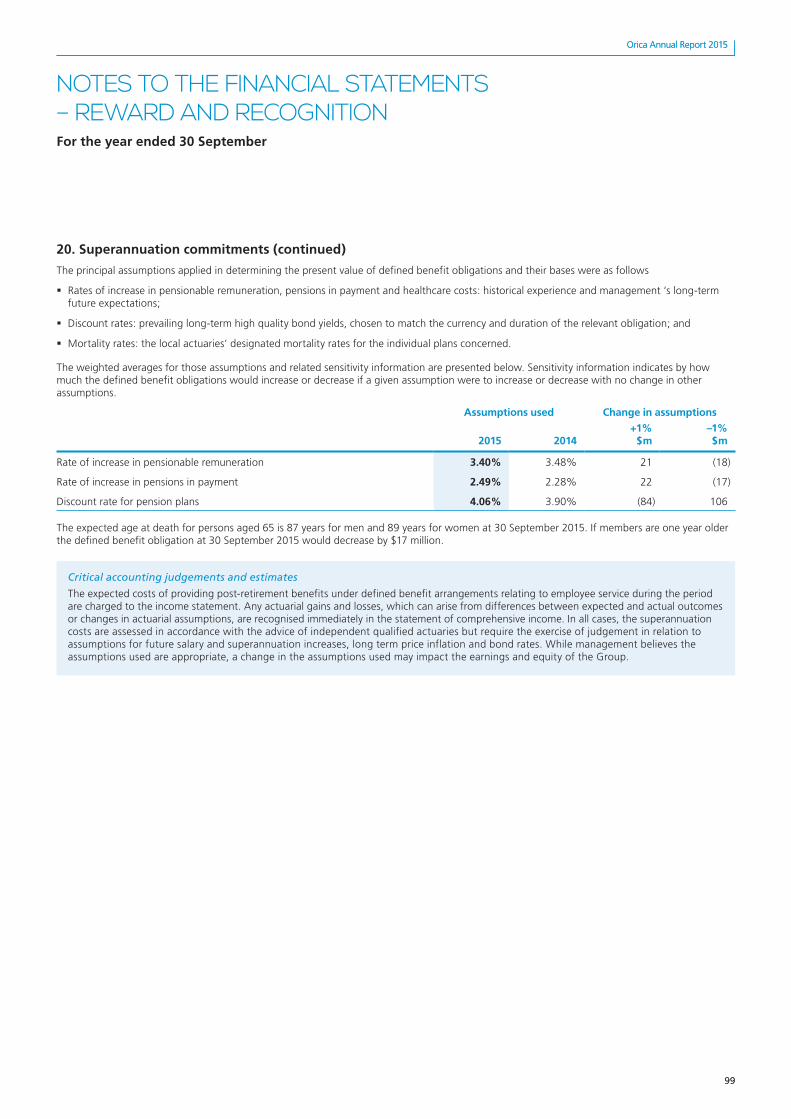
99
Orica Annual Report 2015
99
Orica Annual Report 2015
NOTES TO THE FINANCIAL STATEMENTS – REwARD AND RECOGNITIONFor the year ended 30 September
20. Superannuation commitments (continued)
The principal assumptions applied in determining the present value of defined benefit obligations and their bases were as follows
� Rates of increase in pensionable remuneration, pensions in payment and healthcare costs: historical experience and management ‘s long-term future expectations;
� Discount rates: prevailing long-term high quality bond yields, chosen to match the currency and duration of the relevant obligation; and
� Mortality rates: the local actuaries’ designated mortality rates for the individual plans concerned.
The weighted averages for those assumptions and related sensitivity information are presented below. Sensitivity information indicates by how much the defined benefit obligations would increase or decrease if a given assumption were to increase or decrease with no change in other assumptions.
Assumptions used Change in assumptions
2015 2014+1%
$m–1% $m
Rate of increase in pensionable remuneration 3.40% 3.48% 21 (18)
Rate of increase in pensions in payment 2.49% 2.28% 22 (17)
Discount rate for pension plans 4.06% 3.90% (84) 106
The expected age at death for persons aged 65 is 87 years for men and 89 years for women at 30 September 2015. If members are one year older the defined benefit obligation at 30 September 2015 would decrease by $17 million.
Critical accounting judgements and estimates
The expected costs of providing post-retirement benefits under defined benefit arrangements relating to employee service during the period are charged to the income statement. Any actuarial gains and losses, which can arise from differences between expected and actual outcomes or changes in actuarial assumptions, are recognised immediately in the statement of comprehensive income. In all cases, the superannuation costs are assessed in accordance with the advice of independent qualified actuaries but require the exercise of judgement in relation to assumptions for future salary and superannuation increases, long term price inflation and bond rates. While management believes the assumptions used are appropriate, a change in the assumptions used may impact the earnings and equity of the Group.
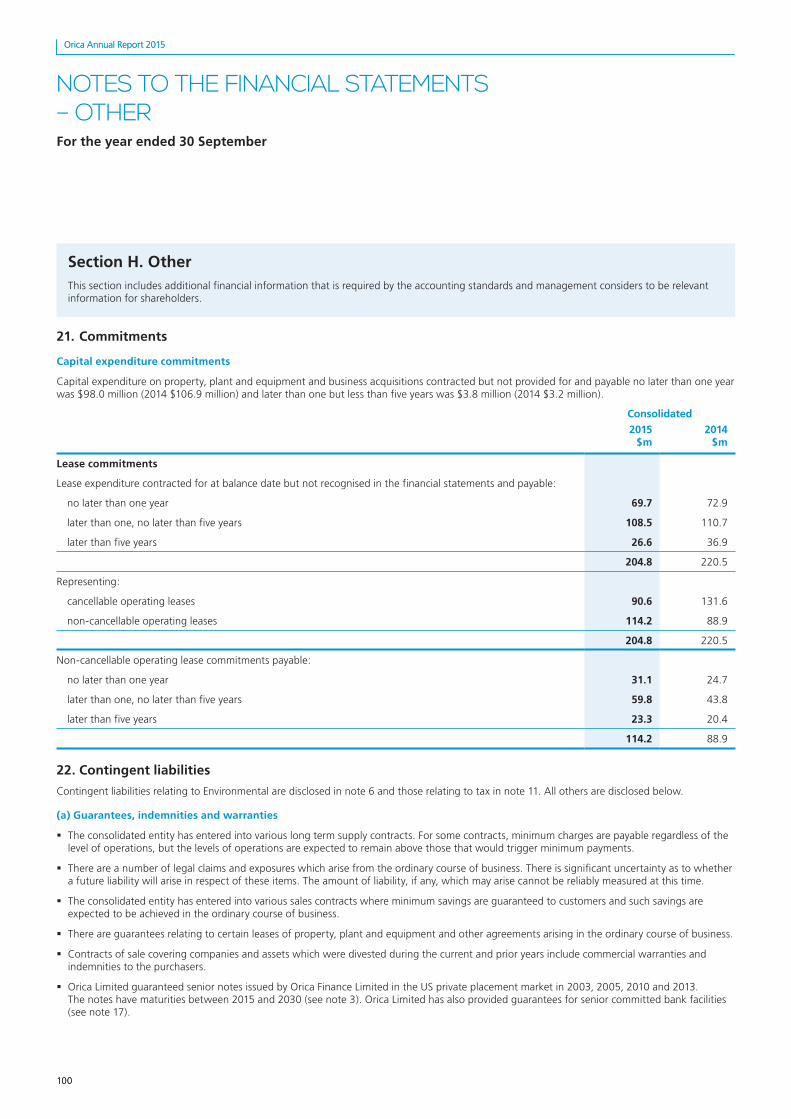
100
Orica Annual Report 2015
100
Orica Annual Report 2015
NOTES TO THE FINANCIAL STATEMENTS – OTHERFor the year ended 30 September
Section H. OtherThis section includes additional financial information that is required by the accounting standards and management considers to be relevant information for shareholders.
21. Commitments
Capital expenditure commitments
Capital expenditure on property, plant and equipment and business acquisitions contracted but not provided for and payable no later than one year was $98.0 million (2014 $106.9 million) and later than one but less than five years was $3.8 million (2014 $3.2 million).
Consolidated
2015 $m
2014 $m
Lease commitments
Lease expenditure contracted for at balance date but not recognised in the financial statements and payable:
no later than one year 69.7 72.9
later than one, no later than five years 108.5 110.7
later than five years 26.6 36.9
204.8 220.5
Representing:
cancellable operating leases 90.6 131.6
non-cancellable operating leases 114.2 88.9
204.8 220.5
Non-cancellable operating lease commitments payable:
no later than one year 31.1 24.7
later than one, no later than five years 59.8 43.8
later than five years 23.3 20.4
114.2 88.9
22. Contingent liabilities
Contingent liabilities relating to Environmental are disclosed in note 6 and those relating to tax in note 11. All others are disclosed below.
(a) Guarantees, indemnities and warranties
� The consolidated entity has entered into various long term supply contracts. For some contracts, minimum charges are payable regardless of the level of operations, but the levels of operations are expected to remain above those that would trigger minimum payments.
� There are a number of legal claims and exposures which arise from the ordinary course of business. There is significant uncertainty as to whether a future liability will arise in respect of these items. The amount of liability, if any, which may arise cannot be reliably measured at this time.
� The consolidated entity has entered into various sales contracts where minimum savings are guaranteed to customers and such savings are expected to be achieved in the ordinary course of business.
� There are guarantees relating to certain leases of property, plant and equipment and other agreements arising in the ordinary course of business.
� Contracts of sale covering companies and assets which were divested during the current and prior years include commercial warranties and indemnities to the purchasers.
� Orica Limited guaranteed senior notes issued by Orica Finance Limited in the US private placement market in 2003, 2005, 2010 and 2013. The notes have maturities between 2015 and 2030 (see note 3). Orica Limited has also provided guarantees for senior committed bank facilities (see note 17).

101
Orica Annual Report 2015
101
Orica Annual Report 2015
NOTES TO THE FINANCIAL STATEMENTS – OTHERFor the year ended 30 September
22. Contingent liabilities (continued)
(b) Other
In 2013, the Polish Competition Authority brought down an adverse finding against 3 firms, including Minova Poland, in relation to the supply of ground support products to Polish coal mines during 2005 to 2010, fining Minova Poland $4.7million. Orica is appealing the adverse finding and fine.
Critical accounting judgements and estimates
In the normal course of business, contingent liabilities may arise from product-specific and general legal proceedings, from guarantees or from environmental liabilities connected with current or former sites. Where management are of the view that potential liabilities have a low probability of crystallising or it is not possible to quantify them reliably, they are disclosed as contingent liabilities.
Legal proceedings
The outcome of currently pending and future legal, judicial, regulatory, administrative and other proceedings of a litigious nature (“Proceedings”) cannot be predicted with certainty. Thus, an adverse decision in Proceedings could result in additional costs that are not covered, either wholly or partially, under insurance policies and that could significantly impact the business and results of operations of the Group. Proceedings can raise difficult and complex legal issues and are subject to many uncertainties and complexities including, but not limited to, the facts and circumstances of each particular case, issues regarding the jurisdiction in which each Proceeding is brought and differences in applicable law. Upon resolution of any pending Proceedings, the Group may be forced to incur charges in excess of the presently established provisions and related insurance coverage. It is possible that the financial position, results of operations or cash flows of the Group could be materially affected by an unfavourable outcome of those Proceedings. Proceedings are evaluated on a case-by-case basis considering the available information, including that from legal counsel, to assess potential outcomes. Where it is considered probable that a future obligation will result in an outflow of resources, a provision is recorded in the amount of the present value of the expected cash outflows if these are deemed to be reliably measurable.
Warranties and Indemnities
In the course of acquisitions and disposals of businesses and assets, Orica routinely negotiates warranties and indemnities across a range of commercial issues and risks, including environmental risks associated with real property. Management uses the information available and exercises judgement in the overall context of these transactions, in determining the scope and extent of these warranties and indemnities. In assessing Orica’s financial position, management relies on warranties and indemnities received, and considers potential exposures on warranties and indemnities provided. It is possible that the financial position, results of operations and cash flows of the Group could be materially affected if circumstances arise where warranties and indemnities received are not honoured, or for those provided, circumstances change adversely.
23. Auditors’ remuneration
Consolidated
2015 $000
2014 $000
Total remuneration received, or due and receivable, by the auditors for:
Audit services
Auditors of the Company – KPMG Australia
– Audit and review of financial reports 3,722 4,463
– Other regulatory audit services 80 226
Auditors of the Company – overseas KPMG firms
– Audit and review of financial reports (1) 2,321 2,185
6,123 6,874
Other services (2)
Auditors of the Company – KPMG Australia
– other assurance services 268 –
268 –
6,391 6,874
From time to time, KPMG, the auditors of Orica, provide other services to the Group, which are subject to strict corporate governance procedures adopted by the Company which encompass the selection of service providers and the setting of their remuneration.(1) Fees paid or payable for overseas subsidiaries’ local lodgement purposes.(2) The Board Audit and Risk Committee must approve any other services provided by KPMG above a value of $100,000 per assignment and it also reviews and
approves at year end other services provided by KPMG below a value of $100,000. In addition, the guidelines adopted by KPMG for the provision of other services ensure their statutory independence is not compromised.
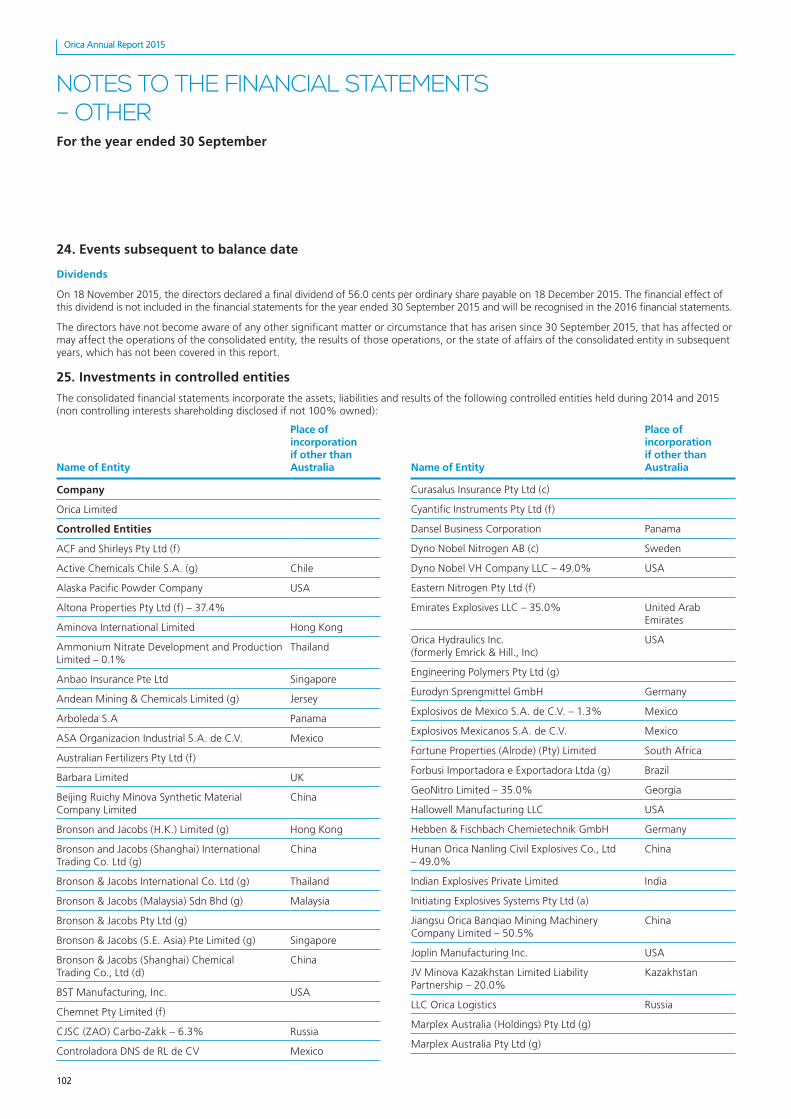
102
Orica Annual Report 2015
102
Orica Annual Report 2015
NOTES TO THE FINANCIAL STATEMENTS – OTHERFor the year ended 30 September
24. Events subsequent to balance date
Dividends
On 18 November 2015, the directors declared a final dividend of 56.0 cents per ordinary share payable on 18 December 2015. The financial effect of this dividend is not included in the financial statements for the year ended 30 September 2015 and will be recognised in the 2016 financial statements.
The directors have not become aware of any other significant matter or circumstance that has arisen since 30 September 2015, that has affected or may affect the operations of the consolidated entity, the results of those operations, or the state of affairs of the consolidated entity in subsequent years, which has not been covered in this report.
25. Investments in controlled entities
The consolidated financial statements incorporate the assets, liabilities and results of the following controlled entities held during 2014 and 2015 (non controlling interests shareholding disclosed if not 100% owned):
Name of Entity
Place of incorporation if other than Australia
Company
Orica Limited
Controlled Entities
ACF and Shirleys Pty Ltd (f)
Active Chemicals Chile S.A. (g) Chile
Alaska Pacific Powder Company USA
Altona Properties Pty Ltd (f) – 37.4%
Aminova International Limited Hong Kong
Ammonium Nitrate Development and Production Limited – 0.1%
Thailand
Anbao Insurance Pte Ltd Singapore
Andean Mining & Chemicals Limited (g) Jersey
Arboleda S.A Panama
ASA Organizacion Industrial S.A. de C.V. Mexico
Australian Fertilizers Pty Ltd (f)
Barbara Limited UK
Beijing Ruichy Minova Synthetic Material Company Limited
China
Bronson and Jacobs (H.K.) Limited (g) Hong Kong
Bronson and Jacobs (Shanghai) International Trading Co. Ltd (g)
China
Bronson & Jacobs International Co. Ltd (g) Thailand
Bronson & Jacobs (Malaysia) Sdn Bhd (g) Malaysia
Bronson & Jacobs Pty Ltd (g)
Bronson & Jacobs (S.E. Asia) Pte Limited (g) Singapore
Bronson & Jacobs (Shanghai) Chemical Trading Co., Ltd (d)
China
BST Manufacturing, Inc. USA
Chemnet Pty Limited (f)
CJSC (ZAO) Carbo-Zakk – 6.3% Russia
Controladora DNS de RL de CV Mexico
Name of Entity
Place of incorporation if other than Australia
Curasalus Insurance Pty Ltd (c)
Cyantific Instruments Pty Ltd (f)
Dansel Business Corporation Panama
Dyno Nobel Nitrogen AB (c) Sweden
Dyno Nobel VH Company LLC – 49.0% USA
Eastern Nitrogen Pty Ltd (f)
Emirates Explosives LLC – 35.0% United Arab Emirates
Orica Hydraulics Inc. (formerly Emrick & Hill., Inc)
USA
Engineering Polymers Pty Ltd (g)
Eurodyn Sprengmittel GmbH Germany
Explosivos de Mexico S.A. de C.V. – 1.3% Mexico
Explosivos Mexicanos S.A. de C.V. Mexico
Fortune Properties (Alrode) (Pty) Limited South Africa
Forbusi Importadora e Exportadora Ltda (g) Brazil
GeoNitro Limited – 35.0% Georgia
Hallowell Manufacturing LLC USA
Hebben & Fischbach Chemietechnik GmbH Germany
Hunan Orica Nanling Civil Explosives Co., Ltd – 49.0%
China
Indian Explosives Private Limited India
Initiating Explosives Systems Pty Ltd (a)
Jiangsu Orica Banqiao Mining Machinery Company Limited – 50.5%
China
Joplin Manufacturing Inc. USA
JV Minova Kazakhstan Limited Liability Partnership – 20.0%
Kazakhstan
LLC Orica Logistics Russia
Marplex Australia (Holdings) Pty Ltd (g)
Marplex Australia Pty Ltd (g)

103
Orica Annual Report 2015
103
Orica Annual Report 2015
NOTES TO THE FINANCIAL STATEMENTS – OTHERFor the year ended 30 September
Name of Entity
Place of incorporation if other than Australia
MIEX UK Limited (g) UK
Mining Quarry Services SPRL Belgium
Minova AG Switzerland
Minova Arnall Sp. z o.o. Poland
Minova Asia Pacific Ltd Taiwan
Minova Australia Pty Ltd
Minova Bohemia s.r.o. Czech Republic
Minova BWZ GmbH (h) Germany
Minova CarboTech GmbH Germany
Minova Carbotech Tunnelling Engineering (Shanghai) Company Limited
China
Minova Codiv S.L. Spain
Minova Ekochem S.A. Poland
Minova Holding GmbH Germany
Minova Holding Inc USA
Minova International Limited UK
Minova Ksante Sp. z o.o. Poland
Minova MAI GmbH Austria
Minova Mexico S.A. de C.V. Mexico
Minova MineTek Private Limited – 24.0% India
Minova Mining Services SA – 49.0% Chile
Minova Nordic AB Sweden
Minova Romania S.R.L. Romania
Minova Ukraina OOO – 10.0% Ukraine
Minova (Tianjin) Co., Ltd. China
Minova Weldgrip Limited UK
Mintun 1 Limited UK
Mintun 2 Limited UK
Mintun 3 Limited UK
Mintun 4 Limited UK
MMTT Limited UK
Nitedals Krudtvaerk AS Norway
Nitro Asia Company Inc. – 41.6% Philippines
Nitro Consult AB Sweden
Nitro Consult AS Norway
Nitroamonia de Mexico S.A de C.V. Mexico
Nobel Industrier AS Norway
Nordenfjeldske Spraengstof AS Norway
Name of Entity
Place of incorporation if other than Australia
Northwest Energetic Services LLC – 48.7% USA
Nutnim 1 Limited UK
Nutnim 2 Limited UK
OOO Minova Russia
OOO Minova TPS – 6.3% Russia
Orica-CCM Energy Systems Sdn Bhd – 45.0% Malaysia
Orica-GM Holdings Limited – 49.0% UK
Orica Africa (Pty) Ltd (formerly Orica South Africa (Proprietary Limited)
South Africa
Orica Argentina S.A.I.C. Argentina
Orica Australia Pty Ltd (a)
Orica Australia Securities Pty Ltd (f)
Orica BKM SASU – 25% (b) Democratic Republic of Congo
Orica Belgium S.A. Belgium
Orica Blast & Quarry Surveys Limited – 25.0% UK
Orica Bolivia S.A. Bolivia
Orica Brasil Ltda Brazil
Orica Brasil Produtos Quimicos Ltda (g) Brazil
Orica Caledonie SAS New Caledonia
Orica Canada Inc Canada
Orica Canada Investments ULC Canada
Orica Caribe, S.A. Panama
Orica Centroamerica S.A. Costa Rica
Orica Chemicals Argentina S.A. (g) Argentina
Orica Chemicals Australia Operations Pty Ltd (g)
Orica Chemicals Chile S.A. (g) Chile
Orica Chemicals Colombia S.A.S. (g) Colombia
Orica Chemicals Holdings Pty Ltd (formerly Orica Clarendon Pty Ltd) (g)
Orica Chemicals New Zealand Limited (formerly Orica Clarendon NZ Limited) (e)
New Zealand
Orica Chemicals Peru S.A. (g) Peru
Orica Chemicals Trading Agency (Beijing) Co., Ltd. (g)
China
Orica Chile Distribution S.A. Chile
Orica Chile S.A. Chile
Orica CIS CJSC Russia
Orica Colombia S.A.S. Colombia
25. Investments in controlled entities (continued)
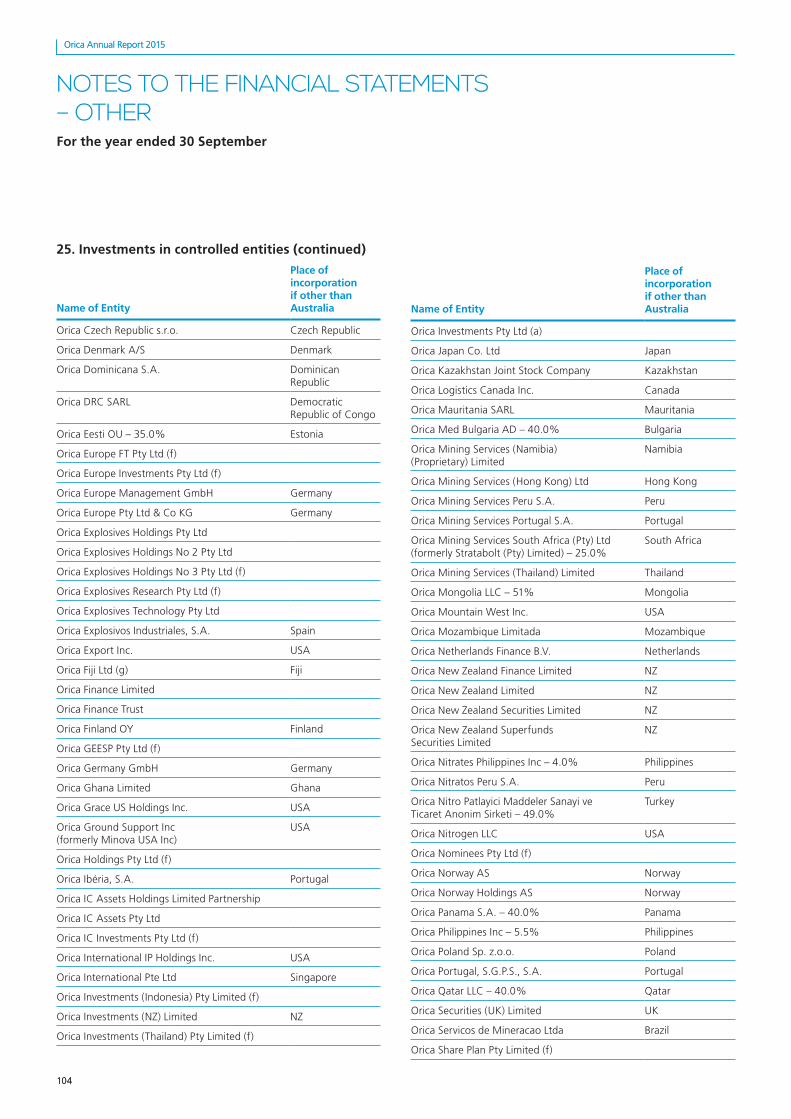
104
Orica Annual Report 2015
104
Orica Annual Report 2015
NOTES TO THE FINANCIAL STATEMENTS – OTHERFor the year ended 30 September
Name of Entity
Place of incorporation if other than Australia
Orica Czech Republic s.r.o. Czech Republic
Orica Denmark A/S Denmark
Orica Dominicana S.A. Dominican Republic
Orica DRC SARL Democratic Republic of Congo
Orica Eesti OU – 35.0% Estonia
Orica Europe FT Pty Ltd (f)
Orica Europe Investments Pty Ltd (f)
Orica Europe Management GmbH Germany
Orica Europe Pty Ltd & Co KG Germany
Orica Explosives Holdings Pty Ltd
Orica Explosives Holdings No 2 Pty Ltd
Orica Explosives Holdings No 3 Pty Ltd (f)
Orica Explosives Research Pty Ltd (f)
Orica Explosives Technology Pty Ltd
Orica Explosivos Industriales, S.A. Spain
Orica Export Inc. USA
Orica Fiji Ltd (g) Fiji
Orica Finance Limited
Orica Finance Trust
Orica Finland OY Finland
Orica GEESP Pty Ltd (f)
Orica Germany GmbH Germany
Orica Ghana Limited Ghana
Orica Grace US Holdings Inc. USA
Orica Ground Support Inc (formerly Minova USA Inc)
USA
Orica Holdings Pty Ltd (f)
Orica Ibéria, S.A. Portugal
Orica IC Assets Holdings Limited Partnership
Orica IC Assets Pty Ltd
Orica IC Investments Pty Ltd (f)
Orica International IP Holdings Inc. USA
Orica International Pte Ltd Singapore
Orica Investments (Indonesia) Pty Limited (f)
Orica Investments (NZ) Limited NZ
Orica Investments (Thailand) Pty Limited (f)
Name of Entity
Place of incorporation if other than Australia
Orica Investments Pty Ltd (a)
Orica Japan Co. Ltd Japan
Orica Kazakhstan Joint Stock Company Kazakhstan
Orica Logistics Canada Inc. Canada
Orica Mauritania SARL Mauritania
Orica Med Bulgaria AD – 40.0% Bulgaria
Orica Mining Services (Namibia) (Proprietary) Limited
Namibia
Orica Mining Services (Hong Kong) Ltd Hong Kong
Orica Mining Services Peru S.A. Peru
Orica Mining Services Portugal S.A. Portugal
Orica Mining Services South Africa (Pty) Ltd (formerly Stratabolt (Pty) Limited) – 25.0%
South Africa
Orica Mining Services (Thailand) Limited Thailand
Orica Mongolia LLC – 51% Mongolia
Orica Mountain West Inc. USA
Orica Mozambique Limitada Mozambique
Orica Netherlands Finance B.V. Netherlands
Orica New Zealand Finance Limited NZ
Orica New Zealand Limited NZ
Orica New Zealand Securities Limited NZ
Orica New Zealand Superfunds Securities Limited
NZ
Orica Nitrates Philippines Inc – 4.0% Philippines
Orica Nitratos Peru S.A. Peru
Orica Nitro Patlayici Maddeler Sanayi ve Ticaret Anonim Sirketi – 49.0%
Turkey
Orica Nitrogen LLC USA
Orica Nominees Pty Ltd (f)
Orica Norway AS Norway
Orica Norway Holdings AS Norway
Orica Panama S.A. – 40.0% Panama
Orica Philippines Inc – 5.5% Philippines
Orica Poland Sp. z.o.o. Poland
Orica Portugal, S.G.P.S., S.A. Portugal
Orica Qatar LLC – 40.0% Qatar
Orica Securities (UK) Limited UK
Orica Servicos de Mineracao Ltda Brazil
Orica Share Plan Pty Limited (f)
25. Investments in controlled entities (continued)
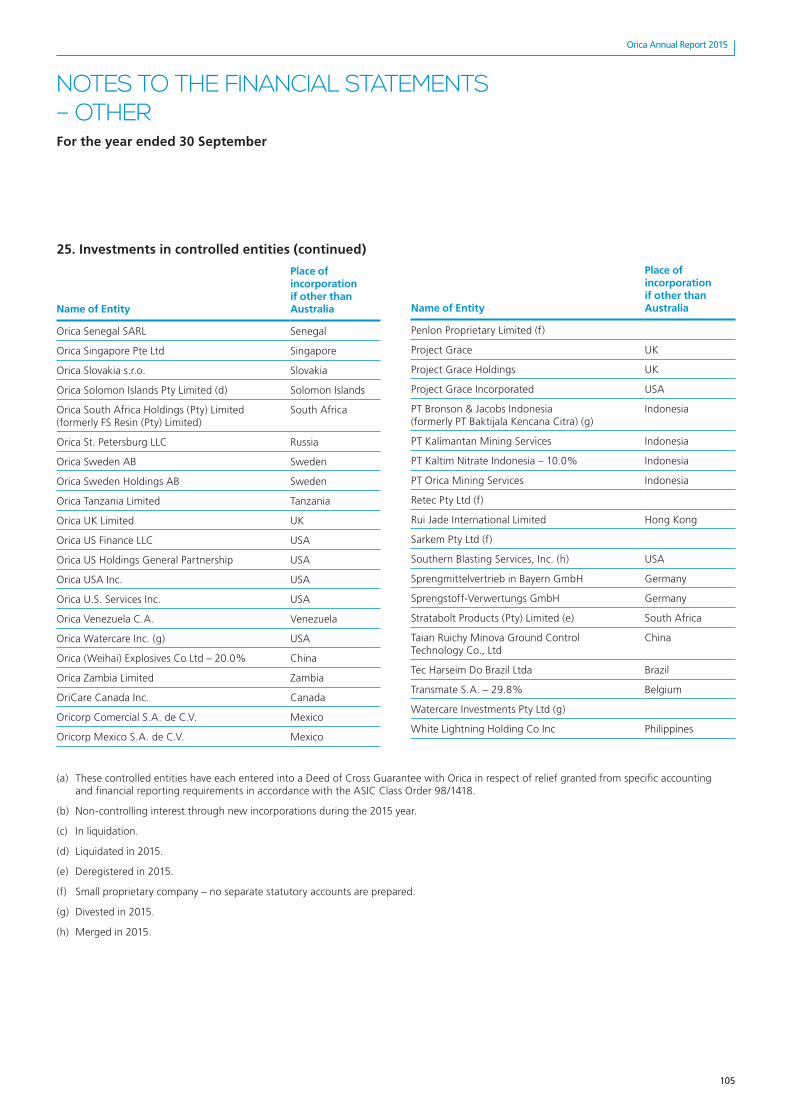
105
Orica Annual Report 2015
105
Orica Annual Report 2015
NOTES TO THE FINANCIAL STATEMENTS – OTHERFor the year ended 30 September
Name of Entity
Place of incorporation if other than Australia
Orica Senegal SARL Senegal
Orica Singapore Pte Ltd Singapore
Orica Slovakia s.r.o. Slovakia
Orica Solomon Islands Pty Limited (d) Solomon Islands
Orica South Africa Holdings (Pty) Limited (formerly FS Resin (Pty) Limited)
South Africa
Orica St. Petersburg LLC Russia
Orica Sweden AB Sweden
Orica Sweden Holdings AB Sweden
Orica Tanzania Limited Tanzania
Orica UK Limited UK
Orica US Finance LLC USA
Orica US Holdings General Partnership USA
Orica USA Inc. USA
Orica U.S. Services Inc. USA
Orica Venezuela C.A. Venezuela
Orica Watercare Inc. (g) USA
Orica (Weihai) Explosives Co Ltd – 20.0% China
Orica Zambia Limited Zambia
OriCare Canada Inc. Canada
Oricorp Comercial S.A. de C.V. Mexico
Oricorp Mexico S.A. de C.V. Mexico
Name of Entity
Place of incorporation if other than Australia
Penlon Proprietary Limited (f)
Project Grace UK
Project Grace Holdings UK
Project Grace Incorporated USA
PT Bronson & Jacobs Indonesia (formerly PT Baktijala Kencana Citra) (g)
Indonesia
PT Kalimantan Mining Services Indonesia
PT Kaltim Nitrate Indonesia – 10.0% Indonesia
PT Orica Mining Services Indonesia
Retec Pty Ltd (f)
Rui Jade International Limited Hong Kong
Sarkem Pty Ltd (f)
Southern Blasting Services, Inc. (h) USA
Sprengmittelvertrieb in Bayern GmbH Germany
Sprengstoff-Verwertungs GmbH Germany
Stratabolt Products (Pty) Limited (e) South Africa
Taian Ruichy Minova Ground Control Technology Co., Ltd
China
Tec Harseim Do Brazil Ltda Brazil
Transmate S.A. – 29.8% Belgium
Watercare Investments Pty Ltd (g)
White Lightning Holding Co Inc Philippines
(a) These controlled entities have each entered into a Deed of Cross Guarantee with Orica in respect of relief granted from specific accounting and financial reporting requirements in accordance with the ASIC Class Order 98/1418.
(b) Non-controlling interest through new incorporations during the 2015 year.
(c) In liquidation.
(d) Liquidated in 2015.
(e) Deregistered in 2015.
(f) Small proprietary company – no separate statutory accounts are prepared.
(g) Divested in 2015.
(h) Merged in 2015.
25. Investments in controlled entities (continued)
106
Orica Annual Report 2015
106
Orica Annual Report 2015
NOTES TO THE FINANCIAL STATEMENTS – OTHERFor the year ended 30 September
26. New accounting policies
(i) Changes in accounting policies
Except as described below, the accounting policies applied by the Group in the financial report are the same as those applied by the consolidated entity in its consolidated financial report for the year ended 30 September 2014.
The standards relevant to Orica that have been adopted during the period are:
� AASB 2012-3 Amendments to Australian Accounting Standards – Offsetting Financial Assets and Financial Liabilities – applicable for annual reporting periods beginning on or after 1 January 2014.
� AASB 2013-3 Amendments to AASB 136 – Recoverable Amount Disclosures for Non-Financial Assets – applicable for annual reporting periods beginning on or after 1 January 2014.
� AASB 2013-4 Amendments to Australian Accounting Standards – Novation of Derivatives and Continuation of Hedge Accounting – applicable for annual reporting periods beginning on or after 1 January 2014.
� AASB 2014-1 Amendments to Australian Accounting Standards arising from AASB 119 Defined Benefit Plans: Employee Contributions [Operative dates: Part A-C – 1 July 2014].
These standards do not have a material effect on the financial statements and impact mainly on disclosures.
(ii) Recently issued or amended accounting standards
Standards taking effect from 1 October 2015 and later
� AASB 2009-11 Amendments to Australian Accounting Standards arising from AASB 9 – [AASB 1, 3, 4, 5, 7, 101, 102, 108, 112, 118, 121, 127, 128, 131, 132, 136, 139, 1023 & 1038 and Interpretations 10 & 12] – available for annual reporting periods beginning on or after 1 January 2018.
� AASB 2010-7 Amendments to Australian Accounting Standards arising from AASB 9 (December 2010) – available for annual reporting periods on or after 1 January 2018.
� AASB 2015-2 Amendments to Australian Accounting Standards – Disclosure Initiative: Amendments to AASB 101 – available for annual reporting periods on or after 1 January 2016.
� AASB 2015-3 Amendments to Australian Accounting Standards arising from the Withdrawal of AASB 1031 Materiality – available for annual reporting periods on or after 1 July 2015.
� AASB 2015-1 Amendments to Australian Accounting Standards – Annual Improvements to Australian Accounting Standards 2012-2014 Cycle – available for annual reporting periods on or after 1 January 2016.
� AASB 9 (2014) Financial Instruments, AASB 2014-7 Amendments to Australian Accounting Standards arising from AASB 9 (December 2014) and AASB 2014-8 Amendments to Australian Accounting Standards arising from AASB 9 (December 2014) – Application of AASB 9 (December 2009) and AASB 9 (December 2010) – available for annual reporting periods on or after 1 January 2018.
� AASB 15 Revenue from Contracts with Customers and AASB 2014-5 Amendments to Australian Accounting Standards arising from AASB 15 available for annual reporting periods on or after 1 January 2018.
� AASB 2014-1 Amendments to Australian Accounting Standards arising from AASB 119 Defined Benefit Plans: Employee Contributions [Operative dates: Part D – 1 Jan 2016; Part E – 1 Jan 2018].
� AASB 2014-3 Amendments to Australian Accounting Standards Accounting for Acquisitions of Interests in Joint Operations – available for annual reporting periods on or after 1 January 2016.
� AASB 2014-4 Clarification of Acceptable Methods of Depreciation and Amortisation – available for annual reporting periods on or after 1 January 2016.
The consolidated entity expects to adopt these standards in the 2016 and subsequent financial years – however the financial impact of adopting the new or amended standards has not yet been determined.