Embed Size (px)
Citation preview

Oribatid mite communities in soil: structure, function and response to global
environmental change
By
Huijie Gan
A dissertation submitted in partial fulfillment
of the requirements for the degree of
Doctor of Philosophy
(Ecology and Evolutionary Biology)
in the University of Michigan
2013
Doctoral Committee:
Professor Donald R. Zak, Co-Chair
Professor Mark D. Hunter, Co-Chair
Assistant Professor Timothy Y. James
Professor Barry M. OConnor
Professor Ivette Perfecto

© Huijie Gan
2013
ii
This dissertation is dedicated to my parents. I certainly would not be
where I am without their nurture, love and support

iii
ACKNOWLEDGEMENTS
This dissertation would not have been possible without the help of many people in many diverse
ways. First, I would like to thank my advisors, Don and Mark, for their excellent guidance and
support along my doctoral journal. Don always inspires and encourages me to pursue my
research interest. He provides me with any resources I needed for research as well as other things.
Nowadays, I still keep the basketball and the bicycle that Don gave me. Mark always provides
me with insightful comments and teaches me to be self-critical about my own research. He
would go over the language errors I made and explain patiently to me why they are wrong. I
would not expect any better co-chairs other than Don and Mark for my dissertation research. I
would also like to gratefully and sincerely thank the rest of my committee members for their
input and constructive comments. Ivette is the first person to lead me into the exciting world of
microarthropods during the Field Ecology course in my first year. Barry is extremely helpful
when I first started to work with mites. Tim always takes time to answer any of my questions
related to fungi.
I would like to thank many people in the Soils lab and the Hunter Lab who have helped
me with this research. I am grateful to have Rima Upchurch to help me with equipment, lab
training and experiment set up etc.. I want to thank Pat Micks and Sierra Patterson for driving me
many times for field trips. I also thank Sarah Eisenlord, Elizabeth Entwistle, Lauren Clings, Zac
Freedman and Leiling Tao for their thought-provoking discussion on many aspects of this
dissertation.

iv
I also received a lot of help from the University of Michigan Department of Ecology and
Evolutionary Biology including funding (EEB Block Grant) as well as logistical support from
EEB office staff. I am especially thankful to the help I have received from Jane Sullivan and
Cynthia Carl through my graduate years.
I am deeply grateful to have wonderful parents, grandparents and siblings. They always
encourage me to follow my dreams and support me to pursue my dreams the best they can. I
would also like to thank my boyfriend Jiangfeng Wu, who encourages to explore other
dimensions of life and is also smart enough to explain to me the meaning of eigenvalues.

v
TABLE OF CONTENTS
DEDICATION…………………………………………………….…………………………. ii
ACKNOWLEDGEMENTS…………………………………………………………………. iii
LIST OF FIGURES………………………………………...……………………………….. vi
LIST OF TABLES………………………………………………………………………… viii
ABSTRACT……………………………………………………………………………….... ix
CHAPTER
I. Introduction……………………………………………………………………...………… 1
II. Stochastic (dispersal limitation) and deterministic (environmental filtering and biotic
interaction) processes as drivers of soil oribatid mite community assembly…………...……10
III. Trophic structure and trophic dynamics of soil oribatid mites..……………………..…. 50
IV. The effects of chronic N deposition on the community structure and function of soil
oribatid mites……………………………………………………..…………………..…….. 79
V. The consequences of changes in microarthropod communities under chronic N deposition
for fungal communities and litter decay ……………………………….…………………. 118
VI. Conclusion………………………………………………………………………….…. 155

vi
LIST OF FIGURES
Figure 2.1 Map of forest sites composing a long-term chronosequence following glacial
retreat……………………………………………………………………….. 36
Figure 2.2 Oribatid species richness in four study sites illustrated through rarefaction
analysis………………………………………………………………………. 37
Figure 2.3 The species composition of the Oribatid community differs among 4 sites and 3
sampling dates…………………………………………………………….…. 38
Figure 2.4 The relationship between oribatid community dissimilarity and geographic
distance depends on body size. (a) Species with adult body length > 0.45 mm; (b)
species with adult body length ≤ 0.45mm………………………………….. 39
Figure 2.5 Oribatid species with strongest responses to (a) temperature, (b) soil C: N ratio
and (3) soil fungal biomass from significant RDA results…………………... 40
Figure A2.1 Principle Component Analysis (PCA) of all climatic, biogeochemical and biotic
factors used in our study…………………………………………………….. 45
Figure 3.1 Dominant oribatid mite species in the forest floor of four hardwood forests
occupy more than three trophic levels………………………………………. 69
Figure 3.2 Trophic positions of oribatid mites in the forest floor did not differ between
ambient and elevated N deposition plots…………………………………… 70
Figure 3.3 The proportions of different feeding habits among 91 oribatid mite species from
combining current measurements with previously published studies……… 71
Figure 3.4 Trophic positions of oribatid mites show little variation among different
studies………………………………………………………………………. 72
Figure 4.1 Map of four study sites in the Great Lake region in North America………. 102
Figure 4.2 The abundance of Oribatida, Mesostigmata and Collembola in the forest floors
was significantly lower under experimental elevated N deposition……….. 103
Figure 4.3 The rarefaction curves of oribatid mite communities in the forest floors (a) and
inside the litterbags (b)……………………………………………………... 104
Figure 4.4 The nMDS ordination of the oribatid mite communities on the forest floor. 105
Figure 4.5 The mass loss rates of aspen litter inside the litterbags did not differ between the
ambient plots and the elevated N deposition plots…………………………. 106

vii
Figure 4.6 The abundance of microarthropods including Oribatida (a), Collembola (b) and
Mesostigmata (c) inside the litterbags…………………………………….. 107
Figure 4.7 Total C (a) and 13
C content (b) of microbial PLFAs inside the litterbags….. 108
Figure A4.1 Total biomass of microbial PLFAs outside litterbags on the forest floor (a) and in
the soil underneath the litterbags (b) did not change over time or under
experimentally elevated N deposition……………………………………… 111
Figure A4.2 The 13
C content of soil microbial PLFAs underneath the litterbags….…… 112
Figure 5.1 Litter decay in the 96-day incubation. (a) Decay rate (k) was lower in microcosms
with litter from experimental N deposition and (b) total respired C (A0) depended
on both litter type and microarthropod treatment………………………….. 146
Figure 5.2 Figure 5.2. Enzyme activities in the leachate from the microcosms on day 55 of
the 96-day incubation (a) β-glucosidase (BG) varied among litter types and
microarthropod treatments; (b) Cellobiohydrolase (CBH) was higher in N-
deposition litter and (c) acetylglucosaminidase (NAG) was higher in the no-
microarthropod control…………………………………………………….. 147
Figure 5.3 The average number of microarthropods in the microcosms at harvest remained
higher in the ambient microarthropod treatment than the N-deposition
microarthropod treatment…………………………………………………... 148
Figure 5.4 Fungal communities, visualized by nMDS of TRF classes from HaeIII digest,
varied between litter types and microarthropod treatments……………...… 149
Figure 5.5 Similarities between fungal communities are positively related to the similarities
of oribatid abundance but not oribatid species composition……………….. 150

viii
LIST OF TABLES
Table 2.1 Climatic, biogeochemical and biotic properties (mean ± SE) of four hardwood
sites sampled in our study…………………………………………………... 34
Table 2.2 Results from Mantel/partial Mantel test with Spearman’s rank correlation
coefficient (ρ) of dissimilarity matrices between oribatid mite communities and
four categories of environmental factors…………………………………… 35
Table A2.1 Species composition of oribatid mites in our study sites…………………… 41
Table A2.2 Redundancy analyses of oribatid communities with each climatic, biogeochemical
and biotic factor…………………………………………..………………… 44
Table A3.1 Trophic positions and possible food resources of oribatid mites from our own
samples and from other published studies, as indicated by their average δ15
N
value………………………………………………………………………… 73
Table 4.1 Analysis of Variance (ANOVA) of the density of microarthropods in the forest
floors and in the litterbags…………………………………………..……... 100
Table 4.2 PerMANOVA analysis of the species composition of oribatid mite communities
on the forest floor or inside litterbags……………………………………... 101
Table A4.1 Species scores from nMDS analysis using the incidence data of oribatid mite
communities……………………………………………………………….. 109
Table 5.1 Selected TRF classes from HaeIII digest with their possible taxonomic
associations and the percentage of in the microcosms with different litter types
and microarthropod treatments…………………………………………….. 144
Table 5.2 Similarity of fungal communities with different litter types and microarthropod
treatments…………………………………………………………………... 145

ix
ABSTRACT
Oribatid mite communities in soil: structure, function and response to global
environmental change
By
Huijie Gan
Co-Chair: Donald R. Zak
Co-Chair: Mark D. Hunter
Little is known regarding the relative role of stochastic and deterministic forces in the
community assembly of soil oribatid mites, which are species-rich and fulfill important roles in
ecosystem functioning as detritivores. This dissertation investigates the mechanisms underlying
the community assembly of soil oribatid mites and addresses how global environmental change
influences their community structure and function. I hypothesized that dispersal limitation was a
central mechanism structuring oribatid mite communities, due to their low locomotive activity
through the soil. However, a study of the geographic distribution of oribatid mites along a
chronosequence in a deglaciated region demonstrates that soil/litter dwelling oribatid mites are
not limited by dispersal in their re-colonization of deglaciated areas, as evidenced by an overall
high similarity in the species richness and composition of oribatid mites along the
chronosequence. In contrast, climatic, biogeochemical and biotic factors explained significant
amounts of variation in the species composition of soil oribatid communities, indicating that

x
environmental filtering and competition for food resource are more important than dispersal
limitation in structuring soil oribatid mite communities. Moreover, stable isotope (15
N) analysis
reveals that over half of soil oribatid mites are fungal feeders and that their trophic positions are
stable among diverse environments, indicating a high level of feeding specialization among soil
oribatid mites. Feeding specialization and competition for food resources, especially for fungal
hyphae, among soil oribatid mites provides a potential mechanism underlying the observed
decline in the density of soil oribatids under chronic N deposition. Furthermore, a litterbag
experiment reveals that the decline in microarthropod abundance in forest floors is associated
with a reduction in the mobilization of newly-added C into fungal biomass. Microcosm
experiments further illustrate that a decline in microarthropod abundance alters fungal
communities through microarthropod-fungi interactions. Although such changes in fungal
communities do not influence subsequent litter decay during the early stages of litter
decomposition, changes in the abundance of microarthropods and subsequent feedback on fungal
communities may have important influence on the decay of recalcitrant organic matter.

1
Chapter I
Introduction
Understanding processes that structure biotic communities is a central theme in community
ecology (Begon et al. 2006). In niche-based theory, differentiation of ecological traits allows
coexistence of competing species by their partitioning of limiting resources and occupancy of
different niches (Tilman 2004). In contrast, neutral theory assumes that all individuals are
ecologically equivalent in their birth/death rates and that their communities are structured solely
by demographic stochasticity and dispersal limitation (Hubbell 2001). In practice, community
assembly is determined by both stochastic and deterministic factors (Belyea and Lancaster 1999,
Leibold and McPeek 2006). Dispersal limitation determines the pool of potential colonizers that
are capable of reaching a location (MacArthur 1967). Abiotic environmental factors restrict
species establishment at the site, acting like a filter, or a hierarchy of filters that select for
particular traits (Weiher and Keddy 1995). Biotic interactions such as competition and predation
operate within constraints imposed by local environmental factors and dispersal limitation to
select for a subset of species that actually coexist in the community (Menge and Sutherland
1987). Furthermore, when a community becomes saturated with species that overlap in the use of
limiting resources, their populations become smaller and effects of demographic stochasticity are
amplified (Lande 1993).
All of these stochastic and deterministic factors may operate simultaneously and interact
with one another during community assembly (Strange et al. 1993). For example, the order of
species arrival from dispersal may influence the outcomes of species interactions through priority

2
effects (Figuerola and Green 2002). On the other hand, resident species may alter their habitats
to facilitate the colonization of new species (Bruno et al. 2003). Additionally, the relative
importance of stochastic and deterministic factors may vary among taxonomic groups and
depend on environmental conditions. For instance, some consider that dispersal limitation is
negligible in microorganisms, such that “everything is everywhere and environments select”
(Martiny et al. 2006). In contrast, in highly disturbed environments, frequent disturbance events
may interrupt or diminish the importance of species interactions and their deterministic outcomes
in community organization (Ricklefs 1987).
Most studies that have addressed the relative roles of stochastic and deterministic
processes as drivers of community assembly have focused on aquatic ecosystems or the
aboveground components of terrestrial ecosystems (Strange et al. 1993, Tilman 2004). However,
soil animal communities are among the most species-rich components of terrestrial ecosystems
(Giller 1996). As such, they hold promise for generating important insights into the ecological
forces shaping community assembly. Yet, due to the small body size of most soil animals and the
opaque nature of soil, little is known regarding the mechanisms underlying the community
structure of soil animals (Coleman 2008).
Meanwhile, anthropogenic activities have been increasingly important in shaping the
organization of biotic communities (Sampson and Groves 1989). Global warming has induced
irreversible changes in the structures and functions of many plant and animal communities (Root
et al. 2003, Memmott et al. 2007). Accumulating evidences also reveals that changes in global
climate and land use may have detrimental effects on many groups of soil animals (Blankinship
et al. 2011, Eisenhauer et al. 2012). Therefore, understanding the mechanisms underlying the
community structure of soil animals is a pressing challenge in a world that is facing increasing
3
rates of biodiversity loss and ecosystem degradation (Clark 2009). This knowledge will help to
predict how soil animals will respond to global environmental changes and the potential
consequences of such changes for ecosystem functioning.
This dissertation focuses on an important group of soil animals in many ecosystems, the
soil oribatid mites, to investigate the mechanisms underlying their community assembly and
address how global environmental change influences their community structure and function.
Low locomotive ability and high local diversity have made soil oribatid mites an ideal group of
organisms to test general ecological principles underlying community organization. Moreover,
their important roles in litter decay as detritivores suggests that any changes in their community
structure in response to global environmental change is likely to have further consequences for
ecosystem functioning.
In the classic sense of this group (excluding Astigmata), orbatid mites (Oribatida, Acari;
also known as beetle mites, armored mites or moss mites) are a suborder of Chelicerata and
comprise more than 10,000 named species representing 172 families (Krantz and Walter 2009).
Although many are arboreal and a few are aquatic, most oribatid mites inhabit the soil-litter
system. The soil habitat is a highly dynamic matrix without continuous inter-connectance among
soil pores. Such poor connectance should generate greater obstacles for the movement of soil
animals, compared to those in aquatic ecosystems or the aboveground portions of terrestrial
ecosystems. Indeed, the maximum active dispersal rate is estimated to be no more than 10 m.
year-1
for many groups of wingless soil animals including soil oribatid mites (Ghilarov and Perel
1984, Marinissen and Vandenbosch 1992). Consequently, dispersal limitation is likely to be a
central mechanism structuring communities of soil oribatid mites.
Despite their low locomotive activity, oribatid mites are often the dominant arthropod

4
group in highly organic soils of temperate forests. Up to 170 species can coexist in the litter and
soil of hardwood forests at a collective density of 300,000 individuals /m2 (Hansen 2000, Walter
and Proctor 2004). Some studies have suggested that many soil oribatid mites have similar
feeding habits, with most species apparently consuming a mixture of microbial and plant
materials (Scheu et al., 2005). The existence of astonishingly high local diversity, with an
apparently low level of food resource specialization, is considered an ecological “enigma”
(Anderson 1975a) . However, the feeding behaviors of many oribatid mites specie are actually
unknown. Understanding the feeding habits of soil oribatid mites is needed to investigate any
niche differentiation in food resource utilization and to address the enigma of their high local
diversity.
Soil oribatid mites also perform vital roles during litter decomposition (Scheu et al. 2005)
and they affect litter decomposition through three processes: (1) direct litter consumption; (2)
litter fragmentation or dispersal of microbial propagules via physical movement and (3) feeding
on microorganisms (Lussenhop 1992). Oribatid mites usually exhibit “K-style” life history traits
with low reproductive output (1-3 generations per year, 1-6 eggs per clutch) (Walter and Proctor
2004) and a relatively long life cycle, which typically spans one to two years in temperate to
boreal regions (Krantz and Walter 2009). The low rate of reproduction and long life cycle
suggest that oribatid mites may be sensitive to environmental change (Behan-Pelletier 1999).
However, little is known regarding how global environmental changes influence the community
structure of soil oribatid mites and their functions in litter decay (Setala 2002).
This dissertation is divided into four primary chapters. Chapter II explores the relative
roles of stochastic (dispersal limitation) and deterministic (environmental filtering and biotic
interaction) processes as drivers of soil oribatid mite community assembly. Chapter III examines

5
the trophic structure and trophic dynamics of soil oribatid mites, which provide potential
mechanisms underlying their coexistence at high diversity in small areas. Chapter IV investigates
how soil oribatid mites (together with other groups of soil microarthropods) respond to chronic N
deposition, a pervasive agent of global environmental change; and the consequence of this
change on litter decay under field condition. In Chapter V, I established microcosms in the
laboratory to further test how changes in oribatid mite communities under chronic N deposition
feeds back to influence fungal communities and litter decay.
Chapter II. Stochastic (dispersal limitation) and deterministic (environmental filtering and
biotic interaction) processes as drivers of soil oribatid mite community assembly. Soil
oribatid mites are a major group of wingless microarthropods in many temperate forests and
perform important functions during litter decay (Lussenhop 1992, Hansen 2000) ; nonetheless,
little is known about the ecological forces structuring their communities. I hypothesized that
dispersal limitation was a central mechanism structuring oribatid mite communities, due to their
low locomotive activity through the soil. We tested this hypothesis by studying the geographic
distribution of oribatid mites along a chronosequence across a deglaciated region, in which the
effect of limited dispersal is expected to be profound. In addition, contemporary ecological
factors, such as climate, soil properties and biotic factors, could induce niche partitioning due to
environmental filtering and biotic interactions during the assembly of oribatid mite communities
along the chronosequence. Therefore, we expected that additional biotic and abiotic factors
would combine with dispersal limitation to determine oribatid mite community structure.
Chapter III. Trophic structure and trophic dynamics of soil oribatid mites. High local
diversity of soil oribatid mites suggests that intense competitions and differentiation in resource
utilization may exist among these oribatid species(Anderson 1975b). However, fine-scale

6
differences in food resource utilization among soil oribatid mites could go undetected using
traditional methods, such as gut content analyses or food choice experiments (Scheu 2002). In
this study, I used stable isotope measurements to study the feeding habits of soil oribatid mites. I
expected a high degree of trophic differentiation underlying the coexistence of soil oribatid
mites. I also investigated the stability of the feeding habits of soil oribatid mites in the face of
environmental change, as well as variation among different forest types. If oribatid mites are
feeding generalists, I would expect a shift in their feeding habits with changes in food
availability under different environments.
Chapter IV. The effects of chronic N deposition on the community structure and function of
soil oribatid mites. Anthropogenic nitrogen (N) deposition is a pervasive agent of global
environmental change (Vitousek et al. 1997). During the next century, atmospheric nitrogen (N)
deposition is projected to more than double (Galloway et al. 2004), potentially slowing litter
decomposition by altering microbial community composition and function (Zak et al. 2008, Liu
and Greaver 2010). If the flow of energy though detrital food webs is diminished by the slowing
of decay under higher rates of atmospheric N deposition, this agent of global change could also
negatively impact the abundance and composition of soil fauna. To test this hypothesis, I studied
soil oribatid communities in four sugar maple-dominated forests that comprise a long-term N
deposition experiment. To examine whether changes in soil oribatid communities could then feed
back to influence litter decay, litterbags with 13
C-enriched aspen litter were placed in the forest
floor in one study site. Litterbags were retrieved four times over a 16-month-study to investigate
how litter decay differs between ambient and experimental N deposition treatment.
Chapter V. The consequences of changes in microarthropod communities under chronic N
deposition for fungal communities and litter decay. Results from Chapter IV demonstrated

7
that the abundance of microarthropods declines and the composition of oribatid communities
change under chronic N deposition. Because soil microarthropods form essential interactions
with soil fungi, any change in microarthropod communities is likely to have further
consequences for litter decay via their interactions with the fungal community (Scheu et al.
2005). I hypothesized that the decline in soil microarthropod abundance and the alteration of
their species composition under chronic N deposition would further influence litter decay by
altering fungal communities. To test this hypothesis, I established 150 microcosms with
microarthropods collected from forest floors under ambient and experimental N deposition in a
long-term (>17 years) field study. I monitored CO2 accumulation during a 96-day incubation and
characterized fungal communities at the end of the study. I expected that compared to the
microarthropod community under ambient N deposition, the lower abundance and different
composition of microarthropods under chronic N deposition would alter fungal community
composition resulting in lower enzyme activities and slower litter decay.

8
Literature Cited
Anderson, J. 1975a. The enigma of soil animal species diversity. Progress in soil zoology
2975:51-58.
Anderson, J. 1975b. The enigma of soil animal species diversity. Pages 51-58 in J. Vaněk, editor.
Progress in soil zoology. Academia, Publishing House of the Czechostovak Academy of
Sciences, Prague.
Begon, M., C. Townsend, and J. Harper. 2006. Ecology: from individuals to ecosystems. 4
edition. Blackwell Publishing Ltd.
Behan-Pelletier, V. M. 1999. Oribatid mite biodiversity in agroecosystems: role for bioindication.
Agriculture Ecosystems & Environment 74:411-423.
Belyea, L. R. and J. Lancaster. 1999. Assembly rules within a contingent ecology. Oikos 86:402-
416.
Blankinship, J. C., P. A. Niklaus, and B. A. Hungate. 2011. A meta-analysis of responses of soil
biota to global change. Oecologia 165:553-565.
Bruno, J. F., J. J. Stachowicz, and M. D. Bertness. 2003. Inclusion of facilitation into ecological
theory. Trends in Ecology & Evolution 18:119-125.
Clark, J. S. 2009. Beyond neutral science. Trends in Ecology & Evolution 24:8-15.
Coleman, D. C. 2008. From peds to paradoxes: linkages between soil biota and their influences
on ecological processes. Soil Biology and Biochemistry 40:271-289.
Eisenhauer, N., S. Cesarz, R. Koller, K. Worm, and P. B. Reich. 2012. Global change
belowground: impacts of elevated CO2, nitrogen, and summer drought on soil food webs
and biodiversity. Global Change Biology 18:435-447.
Figuerola, J. and A. J. Green. 2002. Dispersal of aquatic organisms by waterbirds: a review of
past research and priorities for future studies. Freshwater biology 47:483-494.
Galloway, J. N., F. J. Dentener, D. G. Capone, E. W. Boyer, R. W. Howarth, S. P. Seitzinger, G. P.
Asner, C. C. Cleveland, P. A. Green, E. A. Holland, D. M. Karl, A. F. Michaels, J. H.
Porter, A. R. Townsend, and C. J. Vorosmarty. 2004. Nitrogen cycles: past, present, and
future. Biogeochemistry 70:151-226.
Ghilarov, M. S. and T. S. Perel. 1984. Transfer of Earthworms (Lumbricidae, Oligochaeta) for
Soil Amelioration in the Ussr. Pedobiologia 27:107-113.
Giller, P. S. 1996. The diversity of soil communities, the ‘poor man's tropical rainforest’.
Biodiversity and Conservation 5:135-168.
Hansen, R. A. 2000. Effects of habitat complexity and composition on a diverse litter
microarthropod assemblage. Ecology 81:1120-1132.
Hubbell, S. 2001. The unified theory of biodiversity and biogeography. Princeton University
Press.
Krantz, G. and D. Walter. 2009. A manual of Acarology. Pages 430-438. Texas Tech University
Press.
Lande, R. 1993. Risks of population extinction from demographic and environmental
stochasticity and random catastrophes. American Naturalist:911-927.
Leibold, M. A. and M. A. McPeek. 2006. Coexistence of the niche and neutral perspectives in
community ecology. Ecology 87:1399-1410.
Liu, L. and T. L. Greaver. 2010. A global perspective on belowground carbon dynamics under
nitrogen enrichment. Ecology Letters 13:819-828.
Lussenhop, J. 1992. Mechanisms of Microarthropod Microbial Interactions in Soil. Advances in
Ecological Research 23:1-33.

9
MacArthur, R. H. 1967. The theory of island biogeography. Princeton University Press.
Marinissen, J. C. Y. and F. Vandenbosch. 1992. Colonization of New Habitats by Earthworms.
Oecologia 91:371-376.
Martiny, J. B. H., B. J. M. Bohannan, J. H. Brown, R. K. Colwell, J. A. Fuhrman, J. L. Green, M.
C. Horner-Devine, M. Kane, J. A. Krumins, C. R. Kuske, P. J. Morin, S. Naeem, L.
Ovreas, A. L. Reysenbach, V. H. Smith, and J. T. Staley. 2006. Microbial biogeography:
putting microorganisms on the map. Nature Reviews Microbiology 4:102-112.
Memmott, J., P. G. Craze, N. M. Waser, and M. V. Price. 2007. Global warming and the
disruption of plant–pollinator interactions. Ecology Letters 10:710-717.
Menge, B. A. and J. P. Sutherland. 1987. Community regulation: variation in disturbance,
competition, and predation in relation to environmental stress and recruitment. American
Naturalist:730-757.
Ricklefs, R. E. 1987. Community diversity: relative roles of local and regional processes.
Science 235:167-171.
Root, T. L., J. T. Price, K. R. Hall, S. H. Schneider, C. Rosenzweig, and J. A. Pounds. 2003.
Fingerprints of global warming on wild animals and plants. Nature 421:57-60.
Sampson, R. J. and W. B. Groves. 1989. Community structure and crime: Testing social-
disorganization theory. American journal of sociology:774-802.
Scheu, S. 2002. The soil food web: structure and perspectives. European Journal of Soil Biology
38:11-20.
Scheu, S., L. Ruess, and M. Bonkowski. 2005. Interactions between microorganisms and soil
micro-and mesofauna. Pages 253-275 in F. Buscot and A. Varma, editors.
Microorganisms in Soils: Roles in Genesis and Functions. Springer, Berlin.
Setala, H. 2002. Sensitivity of ecosystem functioning to changes in trophic structure, functional
group composition and species diversity in belowground food webs. Ecological Research
17:207-215.
Strange, E. M., P. B. Moyle, and T. C. Foin. 1993. Interactions between stochastic and
deterministic processes in stream fish community assembly. Environmental Biology of
Fishes 36:1-15.
Tilman, D. 2004. Niche tradeoffs, neutrality, and community structure: a stochastic theory of
resource competition, invasion, and community assembly. Proceedings of the National
Academy of Sciences of the United States of America 101:10854-10861.
Vitousek, P. M., J. D. Aber, R. W. Howarth, G. E. Likens, P. A. Matson, D. W. Schindler, W. H.
Schlesinger, and D. Tilman. 1997. Human alteration of the global nitrogen cycle: Sources
and consequences. Ecological Applications 7:737-750.
Walter, D. and H. Proctor. 2004. Mites: Ecology, Evolution and Behaviour. CABI bublishing.
Weiher, E. and P. A. Keddy. 1995. Assembly rules, null models, and trait dispersion: new
questions from old patterns. Oikos 74:159-164.
Zak, D. R., W. E. Holmes, A. J. Burton, K. S. Pregitzer, and A. F. Talhelm. 2008. Simulated
Atmospheric No3- Deposition Increases Soil Organic Matter by Slowing Decomposition.
Ecological Applications 18:2016-2027.

10
Chapter II
Stochastic (dispersal limitation) and deterministic (environmental filtering and biotic
interaction) processes as drivers of soil oribatid mite community assembly
Abstract. Soil oribatid mites are a major group of wingless microarthropods in many temperate
forests and these organisms perform important functions during litter decay; nonetheless, little is
known about the ecological forces structuring their communities. We hypothesized that dispersal
limitation was a central mechanism structuring oribatid mite communities, due to their low
locomotive activity through the soil. We tested this hypothesis by studying the geographic
distribution of oribatid mites along a long-term chronosequence following glacial retreat, in
which the effect of limited dispersal is expected to be profound. Our results reveal high local
diversity of oribatid mites (46~56 species), but low β diversity (an average of 31%
dissimilarity) across the chronosequence. In contrast to our hypothesis that oribatid mite
diversity would be the lowest in the youngest site due to dispersal limitation following glacial
retreat, we found similar richness and composition of oribatid mite species along the
chronosequence. This suggests that passive dispersal might be an overlooked, but prominent,
dispersal mode for these forest floor organisms. Interestingly, the degree of dispersal limitation
depends on body size, with the subgroup of mites with large body size exhibiting a significant
positive relationship between community dissimilarity and geographic distance, a proxy for time
since deglaciation. In contrast, the community composition of small-bodied species is similar
regardless of geographic distance, suggesting that small-bodied mite species were able to
colonize all four study sites more easily than were large-bodied mites. Our study also suggests

11
that environmental filtering (temperature, litter fall and soil C:N ratio) and competition for food
resource (fungal biomass and Collembola abundance) are important determinants of oribatid
species composition.

12
Introduction
The relative roles of stochastic (e.g., dispersal limitation) and deterministic (e.g., environmental
filtering and biotic interactions) processes as drivers of community assembly remains an actively
debated topic in ecology (Chave 2004, Tilman 2004). Soil animal communities, which contain an
astonishing diversity, have been described as “the poor man’s tropical forest” (Giller 1996). As
such, they hold promise for generating important insights into the ecological forces shaping
community assembly. The soil habitat is a highly dynamic matrix without continuous inter-
connectance among soil pores. Such poor connectance should generate greater obstacles for the
movement of soil animals, compared to those in aquatic ecosystems or the aboveground portions
of terrestrial ecosystems. Consequently, dispersal limitation may be a relatively more important
ecological force in structuring communities of soil animals.
The importance of dispersal limitation in structuring community assemblages is most
profound after severe disturbances such as continental glaciation. For instance, since the end of
the Pleistocene glaciation, many forest communities in Eastern North America have gained new
species throughout the Holocene, increasing in diversity as forest species expanded their ranges
from refuges far to the south (Davis 1983). Whereas some organisms can rapidly expand their
geographic distribution following glacial retreat, especially those with high dispersal ability such
as plants with winged seeds and flying animals, limited dispersal is probably more important in
structuring communities of soil fauna. For example, it is generally accepted that the late
Wisconsin Glaciation eliminated most indigenous earthworms in northeastern North America
(Gates 1982, Reynolds 2004). The majority of the earthworms now inhabiting soils in Canada
and northern regions of the US result from relatively new introductions of European earthworms,
which began largely within the last two or three decades (Scheu and Parkinson 1994).

13
Compared to the systematic research on earthworm distributions (Addison 2009), the
distributions of other groups of soil fauna in post-glaciation regions are rarely investigated.
Oribatid mites, a major group of wingless microarthropods in the forest floor of many temperate
forest ecosystems (Osler and Beattie 1999, Maraun et al. 2007), perform important functions
during litter decomposition via litter comminution and selective grazing on microbial
communities (Lussenhop 1992). Despite their important roles in ecosystem functioning, oribatid
mites exhibit low locomotive activity (Berthet 1964). Based on two ex situ experiments of
oribatid mite movement through forest soil (Ojala and Huhta 2001, Lehmitz et al. 2012), the
maximum active dispersal rate was estimated to be 1-8 m year-1
, which is comparable to that of
5-10 m year-1
for earthworms (Ghilarov and Perel 1984, Marinissen and Vandenbosch 1992).
While passive dispersal such as anthropochorous dispersal (via agricultural products, fishing bait
etc.) is critical for current earthworm distributions in glaciated regions, it may be less common in
soil microarthropods. Because of their low locomotive ability, oribatid mites inhabiting forest
floor would advance no more than 80 km over 10,000 years, if they relied solely on their own
power (Ojala and Huhta 2001, Lehmitz et al. 2012).
Considering their low dispersal ability, we hypothesized that dispersal limitation was a
central mechanism structuring oribatid mite communities. To test this hypothesis, we studied the
geographic distribution of oribatid mites along a chronosequence in a deglaciated region of
eastern North America, in which we expected the effect of limited dispersal to be most profound.
We reasoned that (1) oribatid mite diversity would increase with time since deglaciation, and (2)
communities in close proximity would be more similar to one another than would those that are
far apart. Furthermore, as the dispersal ability of organisms is highly related to their body size
(Finlay 2002), we also expected that small- bodied oribatid mites would experience a lower
14
degree of dispersal limitation than large-bodied mites. Additionally, contemporary ecological
factors, such as climate, soil properties as well as biotic factors, could induce niche partitioning
due to environmental filtering and biotic interactions during the assembly of oribatid mite
communities. Therefore, we expected that additional biotic and abiotic factors would combine
with dispersal limitation to determine oribatid mite community structure.
Materials and Methods
Study sites
Our four study sites span 420 km within Lower and Upper Michigan, USA (Fig. 2.1). These sites
are ideal to test our hypothesis regarding the effect of deglaciation on soil fauna communities,
because they differ in their ages since deglaciation. We denote the four sites from north to south
as site A, site B, site C and site D with ages of 9,500, 11,000, 13,000 and 13,500 years,
respectively (Eisenlord et al. 2012; W. Farrand, personal communication). A climatic gradient
coincides with the geographic range, in which the northern-most site experiences a lower mean
annual temperature (4.54 C) and the southern-most site experiences a higher mean annual
temperature (7.44 C).
We selected sugar-maple (Acer saccharum Marsh.) dominated northern hardwood forest
as our study system, because it is a prevalent natural ecosystem in northeastern North America.
The overstory ages (through 2011) are similar among sites, ranging from 98 to 104 years
(Patterson et al. 2012), ensuring that the chronosequence is not confounded by different
successional stages of the sites. Each site contains three 30-m x 30-m plots that are 10- to 150-m
apart (Eisenlord et al. 2012). These hardwood forests are underlain by sandy soils that are well-
drained sandy typic Haplothords of the Kalkaska series. The understory vegetation consists of
mainly sugar maple seedlings (~ 90% of all stems), and the Oi horizon is primarily sugar maple

15
litter (Patterson et al. 2012). As these sites were selected from a population of 31 candidate sites
based on floristic and edaphic similarity (Burton et al. 1991), their shared habitat similarity
minimizes those aspects of environmental filtering, which should favor our ability to detect any
signal of dispersal limitation.
Sample collection
Forest floor (Oi and Oe/a horizons) samples were collected in May 2011, June 2012 and August
2012. Six forest floor subsamples (10-cm x 10-cm) were collected within each plot on each
sampling date for a total of 216 forest floor samples. For the second and third sampling time
(June 2012 and August 2012), three additional mineral soil samples were also collected from
each plot using 5-cm x 5-cm soil cores (a total of 72 samples of mineral soil).
All the subsamples inside plastic bags were placed in a cooler and transported to the lab
within 48 hours. Each subsample was transferred to a modified Tullgren funnel (Crossley and
Blair 1991) over 5 days and the extracted microarthropods were stored in 70% ethanol for
sorting and identification. Three major groups (Mesostigmata, Collembola and Oribatida) of the
extracted microarthropods were enumerated under a microscope. The most abundant group
(Oribatida, adults only) was further identified to genus or species, based on the keys written by
R. A. Norton and V. M. Behan-Pelletier (unpublished data) for use at the Ohio State University
Summer Acarology Program (http://www.biosci.ohio-state.edu/~acarolog/summerProgram/).
Dispersal limitation, environmental filtering and biotic interaction
To determine the relative influence of stochastic (dispersal limitation) and deterministic
(environmental filtering and biotic interaction) processes on oribatid mite community assembly,
we created four data sets including geographic distance, climatic, biogeochemical and biotic
matrices. Because distance between sites overlays time since deglaciation in our

16
chronosequence, we used distance as a proxy for time to study the role of dispersal limitation in
shaping oribatid mite communities. Global positioning system (GPS) coordinates were taken at
the center of each sample plot and the geographic distance matrix was calculated as the great
circle distance based on the GPS coordinates of the sites.
To estimate potential effects of environmental filtering and biotic interactions on
structuring oribatid communities, we created another three matrices: climatic, biogeochemical
and biotic matrices (Table 2.1). The climatic matrix included annual mean air temperature (C)
and precipitation (mm) from 1988-2004. All precipitation and temperature data were recorded at
each study site; interpolation from the nearest NOAA data was used when study site specific data
were unavailable (due to malfunctions of the sensor etc.), using monthly relationships between
our site data and that from the nearest NOAA station.
The biogeochemical matrix consisted of characteristics of leaf litter fall, O-horizon and
mineral soils that are known to influence the physiology and ecology of oribatid mites
(Hasegawa 1997, VanStraalen and Verhoef 1997, Hasegawa 2001, Irmler 2006).These factors
included litter fall and its C: N ratio (averaged from year 2001-2011); mass of O-horizon, C: N
ratios of Oi-horizon and top 10 cm of forest floor and mineral soil (excluding Oi-horizon), soil
organic matter (0-10 cm), soil bulk density (0-10 cm) and soil pH (0-10 cm). The
biogeochemical data of O-horizon and upper 10cm of mineral soil were all measured in 2004
except soil pH, which was measured in 2008 (Pregitzer et al. 2008). Foliar calcium (averaged
from 1988-2005) is positively correlated with soil calcium concentration; it was included in the
biogeochemical matrix, because calcium is vital in the integument development of some oribatid
species (Norton and Behan-Pelletier 1991).
The biotic matrix consisted of soil fungal biomass and total microbial biomass measured

17
as phospholipid fatty acid (PLFA) (measured in 2006, van Dipen et al. 2010). The abundance of
Collembola and Mesostigmata (individuals. m-2
) in the forest floor were also included (surveyed
in May 2011, Gan et al. 2013). Collembola are a subgroup of primitive insects that occupy
similar trophic levels as detritivorous oribatid mites (Hishi et al. 2007). Mesostigmata are a
subgroup of mites generally with larger body size than Oribatida and are predators of Collembola
and sometimes oribatid larvae (Koehler 1999). Therefore, the biotic matrix represents groups of
organisms with potential biotic interactions with oribatid mites including food availability,
competition and predation.
We use long-term averages of the above climatic, biogeochemical and biotic factors
whenever possible, because oribatid mites tend to have long life cycles compared to other
microarthropods, with up to 5 years of developmental time from egg to adult and up to 2 years of
adult survival (Norton 1994). All of the climatic and litter fall data are archived and publicly
accessible on the web http://www.webpages.uidaho.edu/nitrogen-gradient/Archived_data.htm .
We recognize the obvious limitation that some of the microbial PFLA and biogeochemical data
were collected during different periods than our faunal surveys, and acknowledge that some
parameters may have changed over time. However, we include these analyses here because they
represent the best data available, and in the hope that differences among sites (the focus of our
analyses) have remained relatively stable over time. We nonetheless recommend caution in their
interpretation.
Data analysis
For each sampling date, we compiled the species composition of oribatid mites from each plot in
three ways: abundance, incidence, and presence/absence matrices. The raw abundance of a
species is the number of individuals summed over all subsamples (6 subsamples of forest floor

18
and 3 subsamples of mineral soil per plot). To down-weight the dominant species, we converted
the raw abundance data into an incidence matrix. The incidence score is 1 if the species was only
encountered once in one of the subsamples; and the maximum score is 6 for forest floor or 3 for
mineral soil if the species was found in all the subsamples in that plot. We initially separated
forest floor and mineral soil communities for analysis because they may respond differently to
environmental factors. On the other hand, as vertical migration between forest floor and upper
mineral soil is likely to occur (Luxton 1981), we also combined species from forest floor and
mineral soil to represent an overall litter/soil dwelling oribatid mite community. Additionally,
combining these two horizons ensures adequate sampling effort within each site to estimate
species composition at the site level.
To investigate whether the species richness of oribatid mites varied with land history after
deglaciation, rarefaction curves were generated from the raw abundance data, with 9 data points
(3 plots x 3 sampling dates) from each site (forest floor and soil combined). Ninety-five %
confidence intervals were calculated for each rarefaction curve to assess any overlap between
sites. Secondly, we used non-Metric Multidimensional Scaling (nMDS) to visualize how the
species composition varied among sampling horizons (forest floor vs. mineral soil), study sites (n
= 4) and sampling dates (n =3). The species composition of each site was the sum of results of
three plots at that site. Prior to nMDS, the raw abundance and incidence matrices were each
converted to a relative abundance matrix by first dividing by the site sum and then taking the
square root transformation as the Hellinger transformation (Legendre and Gallagher 2001). We
did not transform the presence/absence matrix before nMDS. Analysis of similarity (ANOSIM)
was performed to provide statistical comparisons following nMDS. For both nMDS and
ANOSIM, the Bray-Curtis dissimilarity index was used, as it provides a realistic measurement of

19
dissimilarity between biological communities (Bray and Curtis 1957).
Mantel tests were used to examine if there was any correlation between oribatid mite
communities and geographic distance, climatic, biogeochemical or biotic factors. For each of the
three oribatid mite community matrices mentioned above (raw abundance, incidence and
presence/absence), we summed the species composition of three sampling dates from the same
site into one matrix to ensure adequate sampling and to eliminate any seasonal effect. The
abundance and incidence matrices at the site level were transformed with Hellinger
transformation before Mantel tests were applied. For the Mantel tests, the Bray-Curtis
dissimilarity index was used to calculate the dissimilarity of oribatid mite communities between
sites. Climatic, biogeochemical and biotic data sets (Table 2.1) were each converted to a
dissimilarity matrix by calculating the Euclidean distance after z-transformation. Spearman’s
rank correlation coefficient (ρ) was used in the Mantel tests and significance level was tested
using a permutation method (permutation times = 2000). Partial Mantel tests were also applied if
oribatid mite communities had significant association (P < 0.05) with more than one explanatory
data set (geographic distance, climatic, biogeochemical and biotic factors) to control for
covariance between any two explanatory matrices. Scatterplots between community dissimilarity
and geographic distance, climatic, biogeochemical and biotic dissimilarities between sites (6
pairs for each Mantel test) were generated to visualize the Mantel tests results.
To determine whether the relationship between community dissimilarity and geographic
distance (or climatic, biogeochemical and biotic dissimilarity) from the above Mantel tests was
influenced by body size, we divided the communities into two sub-groups based on their body
sizes. The values of the body sizes were taken from the literature as the averages of adult body
lengths. A histogram of the body sizes of all species from all four study sites (79 spp.) was

20
generated and the midpoint (0.45mm) was used to divide the community into two subgroups.
There are 40 species in the small-bodied group with their body sizes ≤ 0.45 mm and 39 species
in the large-bodied group with their body sizes > 0.45mm. Mantel tests were performed
separately on these two sub-groups for all three community matrices with four explanatory data
sets as above.
Although the Mantel test is valid for investigating the relationship between community
dissimilarity and geographic distance or environmental dissimilarity, it usually underestimates
the variance partitioned by explanatory factors (Legendre et al. 2007). We therefore used
redundancy analysis (RDA) to further test which environmental factor explains most of the
variation in original community composition (rather than the dissimilarity matrix as in the
Mantel test) as suggested by Legendre et al. (2007). RDA was used instead of Canonical
Corresponding Analysis (CCA) because of the relatively small environmental gradient in our
study. Due to our small sample size (n=4), we applied RDA to each climatic, biogeochemical and
biotic factor separately. For the combined community from both forest floor and mineral soil, all
environmental factors in Table 2.1 were used. When analyzing the communities from forest floor
and mineral soil separately, the biogeochemical and biotic factors that were not relevant for that
horizon were excluded. We also repeated RDA with the small-bodied and large-bodied
subgroups of mites. As we did not have enough statistical power to test the interaction terms in
the RDA analysis, Principle Component Analysis (PCA) of all environmental factors was
provided to assess any correlation between the explanatory factors. Furthermore, for any
environmental variable with significant explanatory power under the RDA analysis, we
performed simple regression between its Euclidean distances (after z-transformation) and
geographic distance to investigate any spatial autocorrelation of the environmental factor. If we

21
detected significant spatial autocorrelation, we then compared a simple regression with only
environmental dissimilarity to a multiple regression with both environmental dissimilarity and
geographic distance, and used Akaike’s Information Criterion (AIC) to select the better model.
The species rarefaction curves were generated using EstimateS (Colwell 2006).
Multivariate analysis including nMDS, ANOSIM, RDA and PCA were performed in package
VEGAN (Oksanen et al. 2012) in R 2.15.1 (R Development Core Team 2012).
Results
Multivariate analyses of species composition using raw abundance, incidence and
presence/absence matrices in general yield identical trends with varying significance levels. We
have chosen to present the results derived from the incidence data set, as it is likely to be least
biased by down-weighting both the dominant species (over-represented in the raw abundance
data) and the rare species (over-represented in the presence/absence data).
Overall, we collected and examined 11,101 adult oribatid mites from 79 species with 8
singletons. In contrast to our expectation, the species richness of oribatid mites did not decline
northward as sites decreased in time since deglaciation; instead, the total number of oribatid
species at each site was similar, ranging from 46 (Site C) to 56 (Site B and Site D). The
saturation of the rarefaction curves (Fig. 2.2) illustrates that we had sampled sufficiently to
estimate total species richness at each of the 4 sites. While site D had much lower oribatid
abundance compared to other sites, its species richness (56 spp.) was comparable to other sites
(Fig. 2.2). The overlap of the 95% confidence intervals of the rarefaction curves (not shown, for
clarity) indicated that there was no significant difference in species richness among sites.
However, species composition varied among study sites (R2
= 0.33, P = 0.001) and
differed between forest floor and mineral soil (R2
= 0.18, P = 0.001), but remained similar among

22
sampling dates (R2
= 0.09, P = 0.223) (Fig. 2.3.). Among the 5 most dominant species at each
site, three species were shared including Scheloribates pallidulus (17.2% ~ 27.4%, relative
abundance), Oppiella nova (9.5% ~ 16.0%) and Suctobelbella sp2 (7.5 % to 16.5%). However,
some species, such as Eueremaeus nemoralis, was dominant at one site (8.1% at site C) but rare
at others (~ 0.1 % at sites A and B). Furthermore, the species composition of oribatid mites
collected from the mineral soil clearly differed from that in the forest floor (Fig. 2.3.). However,
this difference was primarily driven by the lower species richness in mineral soil (50 spp.), which
were a subset of the same species found in the forest floor (77 spp.) except two rare species
(Microtritia sp. and Nanhermannia sp.). All species information is provided in Appendix Table
A2.1.
When considering all oribatid species, a Mantel test between community dissimilarity
and geographic distance revealed that oribatid communities at close proximity were not more
similar to one another than were those far apart (Fig. 2.3, ρ= 0.6, P > 0.05). In contrast, there was
a positive association between oribatid mite community composition and the climatic matrix
(Fig. 2.3, ρ= 0.83, P = 0.04) while the associations with biogeochemical and biotic matrices were
not significant (Table 2.2, ρ = -0.65, 0.49; P > 0.1).
When we divided the species into two subgroups based on their body size, we found that
the communities of large-bodied oribatid species became more dissimilar as geographic distance
increased (Fig. 2.4, ρ= 0.94, P = 0.035), whereas the community composition of small-bodied
oribatids remained similar regardless of distance (Fig. 2.4, ρ= 0.48, P > 0.1). Associations
between oribatid mite communities and biogeochemical and biotic matrices remained
insignificant for either small- or large-bodied subgroups; the positive correlation between
oribatid mite community dissimilarity (all species) and climatic dissimilarity mentioned above

23
was retained as marginally significant (Table 2.2, ρ = 0.89, P = 0.08) in the small-bodied
subgroup but disappeared in the large-bodied subgroup (Table 2.2, ρ = 0.6, P = 0.12).
Furthermore, the positive correlation between the dissimilarity of large-bodied mites and
geographic distance remained significant after controlling for the covariance with climatic
factors (partial Mantel, ρ = 0.92, P = 0.043). Because distance is a surrogate for time in our
study, these results suggest that dispersal limitation is a factor influencing large, but not small-
bodied oribatid mites. Analysis of the community in the forest floor showed the same results as
that of the combined community, while the dissimilarity of community in the mineral soils did
not have associations with geographic distance or any environmental dissimilarity for either size
groups (Table 2.2).
While we found a positive association between oribatid mite community dissimilarity and
climatic dissimilarity, redundancy analysis revealed that it was temperature in the climatic matrix
that contributed significantly to the variation in species composition among sites (Table A2.2, R2
= 0.41, P = 0.04). Because temperature overlay with the chronosequence in our study, we
compared the simple regression between community dissimilarity and temperature only (adjusted
R2= 0.74, P = 0.02) to the multiple regression with both temperature and geographic distance
(adjusted R2= 0.71, P = 0.07). The lower AIC score for the first model (-31 vs. -30) suggested
that temperature itself was a significant factor explaining variation in the community of oribatid
mites. Furthermore, when we applied RDA to small- and large-bodied mites separately, the same
pattern remained although the contribution from temperature was only marginal in the large-
bodied group (Table A2.2, R2
= 0.42, P = 0.09)
Although Mantel tests did not reveal any association between community dissimilarity
and biogeochemical or biotic dissimilarity matrices, RDA illustrated that the amount of litter fall

24
and the abundance of Collembola contributed substantially to variation in oribatid mite
communities in the forest floor (Table A2.2, R2 = 0.46, 0.43, P = 0.08, 0.09). Furthermore,
species composition of oribatid mites in the mineral soil was influenced by soil C:N ratio (top
10cm including OeOa horizon, R2 = 0.42, P = 0.04 ) and soil fungal biomass (R
2 = 0.43, P =
0.08). The influence of soil fungal biomass is more apparent for the small-bodied group in
mineral soil (R2 = 0.52, P = 0.02). While we did have enough statistical power to test the
interaction between temperature and fungal biomass, PCA indicated that there was no significant
correlation between these factors (Appendix Fig. A2.1). Furthermore, the pairwise dissimilarity
(between sites) of these explanatory factors did not correlate with geographic distance, indicating
that they are not confounded by spatial autocorrelation in structuring oribatid mite communities
in our study.
We further identified the species with the strongest responses to each environmental
factor by looking at the first three species with the highest and lowest species score from the
significant RDA results. Due to our small sample size (n = 4), we only reported the species
scores from RDA with P < 0.05 to reduce the Type I error. As showed in Fig. 2.5a, species Eu.
nemoralis, Epidamaeus longitarsalis and Eremobelba sp. were associated with high temperature
whereas species Oppia nitens, Eniochthonius crosbyi and Ceratozetes gracilis were more likely
to occur under low temperature. For soil-inhabiting species, Fuscozetes fuscipes, Oribatella sp1
and Eremobelba sp. responded positively to soil C:N ratio, while Rhysotritia ardua, Xylobates
prionotus and Nothrus sp1were associated with low soil C:N ratio (Fig. 2.5b). Furthermore,
small-bodied species inhabited in soil including O. nitens, Quadroppia sp. and Xylobates.
oblongus were positively associated with soil fungal biomass while Fosseremus americanus,
Tryhypochthonious sp. and Eremobelba sp. were associated with low fungal biomass (Fig. 2.5c).

25
Discussion
We hypothesized that oribatid mite diversity would be the lowest in the youngest site due to
dispersal limitation following glacial retreat; however, we did not find any evidence to support
this hypothesis at a spatial scale of 400 km. There are two possible explanations, the first of
which involves different colonizing routes following glacial retreat. The last glaciation in our
study region, known as the Wisconsin advance, reached its maximum extent in Indiana and Ohio
approximately 18,000 years ago (Prest 1969). While the ice sheets generally retreated from south
to north, the recolonization by biota could occur by different routes depending on their refuge
areas and their dispersal modes (Davis 1983). For instance, while maples moved into the
northern United States from the west following the retreat of ice, beech moved northward east of
the Appalachians, expanding westward across the lower Great Lakes region (Davis 1983). For
oribatid mites, it is possible that re-colonization occurred from west of areas of southwest North
Dakota, which were ice-free during the last glacial maximum (Clayton and Moran 1982). The
existence of multiple routes to recolonization has the potential to blur any clear spatial diversity
pattern generated by dispersal limitation.
A second possible explanation for our observed result is that despite low rates of
locomotion on the forest floor, oribatids may possess other dispersal modes enabling rapid re-
colonization of deglaciated areas. The existence of unexpected long-distance dispersal events,
such as dispersal on drift ice and drift wood, have been important mechanisms shaping flora
among the isolated Arctic islands following glacial retreat (Coulson et al. 2000, Johansen and
Hytteborn 2001). An example of long-distance dispersal in oribatid mites is through phoresy,
whereby an organism “hitches” a ride by clinging to the body of another, usually much bigger
organism, and dispersing when a new suitable habitat is reached (Houck and OConnor 1991).

26
Phoresy in oribatids is rare compared to that in its parasitic sister group, Astigmata mites (Houck
and OConnor 1991), but there have been observations of phoresy by oribatid mites on
harvestman and passalid beetles (Norton 1980). A large number of oribatid mites (146 spp.) have
also been recovered from the plumage of a diverse group of raptors and Antarctic birds
(Lebedeva and Krivolutsky 2003, Lebedeva and Lebedev 2007). Furthermore, although forest
floor oribatid species are rarely dispersed by wind (Karasawa et al. 2005), Lehmitz et al. (2011)
reported that about 10% of wind-dispersed oribatid species belonged to species able to live in the
soil, suggesting wind as a potential dispersal mechanism for litter/soil dwelling oribatids mites.
Rapid recolonization of oribatid mites into recently emerged nunataks (ice-free land in glacial
areas) also suggests the existence of long-distance dispersal (Ingimarsdóttir et al. 2012).
Passive dispersal i.e. via water, animals or wind as mentioned above, could be an
overlooked, but prominent, dispersal mode for litter or soil dwelling oribatid mites in
determining their community structure. Our finding is consistent with this idea, wherein there
was a strong signal of dispersal limitation from the oribatid subgroup with large body size, but
not for those with a small body size (Fig. 2.4). While one may expect a stronger effect of
dispersal limitation from soil-inhabiting species, we did not observe any relationship between
community dissimilarity and geographic distance for oribatid mites in mineral soil for either
body size (Table 2.2). The lack of such relationship is likely due to the lower sampling effort in
mineral soil. Nevertheless, the average dissimilarity of small-bodied species among sites was
lower than that of large-bodied mites (Fig. 2.4, 27% vs. 41% of Bray-Curtis dissimilarity); and
the same result applied in forest floor (31% vs. 43%) and mineral soil (24% vs. 55%). This
suggests that small-bodied mite species are able to colonize all four study sites easily and are
more similar in their species composition, whereas species with large body sizes are more

27
restricted in their movement across the chronosequence. Such difference between body size may
be partially due to the fact that one of our study sites (site A) is located in a different peninsula
from the other three sites (Fig. 2.1). The water between these two peninsulas may function as a
dispersal barrier especially for the large-bodied species, which may be less likely to disperse
passively than will small-bodied species.
A similar pattern has been found in land snails on the Pacific islands, in which very small
snail genera form 67% of Pacific island snail fauna in contrast to 27% of continental fauna
(Vagvolgyi 1975). This provides indirect evidence of a dispersal advantage for small species
during aerial oversea dispersal. Small organisms are not only easier to transport, but they also
generally exhibit larger population sizes that may increase the probability of dispersal (Van der
Gucht et al. 2007). It has even been suggested that there exists a threshold value of body size (1
mm) under which species are ubiquitous dispersers and less likely to be geographically restricted
(Finlay 2002). Adult body lengths in oribatid mites encompass this threshold, ranging from about
0.15 mm to more than 2.00 mm, with most species not exceeding 1 mm. However, it would be
unrealistic to conclude that oribatids are not dispersal limited solely based on their small body
size, as many species, even though less than 1 mm in length (such as those in the large-bodied
group in our study), do not reach the high local density that is required for ubiquitous dispersal.
The dispersal-competition trade-off between small-bodied species and large-bodied species
(Ellwood et al. 2009) could be well applied to oribatid community assembly, contributing to their
high local diversity.
The possible existence of unexpectedly high dispersal ability, especially for species with
small body size, may have homogenized oribatid mite community composition (an average of
31 % dissimilarity), producing a low β diversity in our study. Oribatid mites also have a low
28
species turn-over rate at a continental scale, as indicated by low slopes of their species-area
relationships on islands and continents (Maraun et al. 2007). Similar results indicating a lack of
dispersal limitation come from a study in mangrove forests in which species composition of
oribatid mites was affected more by microhabitat diversity than geographic distance between
islands (Karasawa and Hijii 2004). In contrast, unexpectedly high β diversity (~ 60%
dissimilarity) of oribatid mite communities has been observed in patchy environments (canopy
suspended soil) in temperate forests (Lindo and Winchester 2008). Furthermore, several other
studies have revealed strong evidence for dispersal limitation among soil oribatid mites (Lindo
and Winchester 2009, Caruso et al. 2012, Ingimarsdottir et al. 2012). The discrepancy between
these studies and our results could arise from differences in the spatial scales of the studies
(Freestone and Inouye 2006). The studies mentioned above were conducted at local scales
spanning from 500 meters (Caruso et al. 2012) to 56 km (Lindo and Winchester 2009), whereas
our study spanned over 400 km and a chronosequence around 10,000 years. High species
turnover and community heterogeneity can occur at a small spatial scales due to intraspecific
aggregation or species-specific microhabitat associations, and any dispersal limitation observed
at this scale is likely to be confounded by unmeasured fine-scale environmental variables that are
spatially structured (Dray et al. 2006). On the other hand, our study sites along the
chronosequence were selected for similar edaphic and floristic characteristics to minimize
environmental heterogeneity (Burton et al., 1991), which should favor our ability to detect any
signal of dispersal limitation. Therefore, the similar species richness and the low β diversity
among sites provide strong evidence for the conclusion that soil oribatid mites are not severely
limited by dispersal to recolonize the deglaciated regions at a time scale of 10,000 years.
The quick recovery of soil oribatid mites in deglaciated areas is not restricted to our study

29
sites, but appears to apply to other deglaciated areas in North America. Based on a preliminary
analysis of the Catalogue of Oribatida (Acari) of Continental United States and Canada
(Marshall et al. 1987), the number of oribatid species recorded in deglaciated areas (Northeast of
USA and most parts of Canada) is only slightly lower than that recorded in ice free regions of the
southern part of North America (642 vs. 872 species). Furthermore, there are 249 species that
only occur in deglaciated areas, and 490 species restricted to ice-free regions. This pattern
suggests that soil oribatid mites can disperse rapidly enough to establish a sizeable species pool
in deglaciated areas and generate latitudinally-based differences in species composition. It should
be noticed that the re-colonization of oribatid species into deglaciated regions has been occurring
over the last 10,000 years. The lack of dispersal limitation at this time scale does not exclude the
possibility of dispersal limitation at a shorter time scale. As a matter of fact, studies have found
that the diversity of soil oribatid mites did not recover in no-tillage farming or abandoned old
fields within decades (Siepel 1991, Adl et al., 2006). Nevertheless, the rapid recovery of oribatid
mites following glacial retreat is notably faster than other groups of soil fauna such as
earthworms, which is at the other extreme of body size among soil fauna. It will be interesting to
investigate how dispersal limitation influences the distribution of other groups of soil fauna with
intermediate body size (e.g., Isopoda and Enchytraeidae) in deglaciated regions.
Our results suggest that environmental filtering and biotic interactions operate during
community assembly of oribatid mites. While correlational, we found strong associations
between oribatid communities (forest floor and mineral soil combined) and air temperature in
our RDA analysis (Fig 5c). Air temperature was highly correlated with soil temperature in our
study (r2 = 0.99), and soil temperature has differential effects on the developmental rates of
different oribatid species (Ermilov and Locnyska 2008). Moreover, different oribatid species

30
have distinct ranges of freeze and heat tolerance (Siepel 1996). It will be interesting to test
whether the species with strong association with high temperature in our study (e.g., E.
nemoralis, E. longitarsalis and Eremobelba sp.) have low freeze tolerance. Furthermore, we also
have evidences for a substantial influence of litter fall (Table A2.2) and soil C: N ratio (Fig. 2.5c)
on oribatid communities in the forest floor and mineral soil respectively. The amount of litter fall
may represent initial resource input and soil C: N ratio could be an indirect measurement of
resource quality. Overall, this suggests that temperature, litter input and soil C: N ratio may serve
as an environmental filter to select oribatid mites best adapted to the local environment.
It might seem surprising to find no association between oribatid community structure and
precipitation or other biogeochemical properties such as soil pH, which have been shown to
influence oribatid communities in previous studies (VanStraalen and Verhoef 1997, Irmler 2006,
Nielsen et al. 2010). However, our four study sites are all sugar maple forests, selected based on
their similarity in plant communities and soil properties. This necessarily results in a narrow
range of precipitation and biogeochemical properties among sites. The similarity of such
environmental factors among our study sites could select for similar communities of mites and
could partly contribute to the low β diversity we observed.
Soil fungal biomass explained a significant proportion of the variation in the small-
bodied oribatid species in mineral soil, suggesting that food availability is important in
structuring oribatid mite communities (Fig. 2.5c). At the same time, the abundance of
Collembola in the forest floor also seemed to influence the community structure of oribatid mites
living in the same horizon. As most oribatid species and Collembola rely at least partially on
fungal hyphae as a food resource (Siepel and De Ruiter-Dijkman 1993, Maraun et al. 2003),
oribatid mites and Collembola may compete for food resources. Differences in food availability

31
(i.e., fungal hyphae) could alter the competitive relationships among different oribatid species
and thus change their relative abundance. Interestingly, while one species (X. oblongus) with a
strong association with fungal biomass is found to feed primarily on fungal hyphae as a
secondary decomposer, another species (O. nitens) is believed to be a predator or scavenger,
relying on live/dead animal tissue (Gan et al. submitted manuscript). However, it should be noted
that we only had measurements of soil fungal biomass in 2006 and the Collembola abundance (in
2011) was highly variable (Table 2.1). Nevertheless, these results suggest that both fungal
biomass and Collembola abundance have the potential to influence the composition of oribatid
communities by altering their competitive relationship for food resources.
In conclusion, despite their low locomotive activity, our results reveal a high local
diversity of oribatid mites (46~56 spp.), but low β diversity (an average of 31% dissimilarity)
across a long-term chronosequence. The lack of a clear spatial pattern in overall oribatid mite
community composition across our study sites suggests that passive dispersal might be an
overlooked but prominent dispersal mode by which oribatid mites recolonize deglaciated areas.
Such passive dispersal may be more effective for species with small body sizes, whereas the
effect of dispersal limitation is more pronounced for species with large body sizes. Our study
also suggests that environmental filtering (temperature, litter fall and soil C:N) and competition
for food resources (fungal biomass and Collembola abundance) contribute to determining
oribatid species composition. Understanding the interactions among dispersal, environmental
filtering and competition for food resources as driving forces of oribatid community assembly
may help to predict how soil fauna will respond to global environmental change. Increases in
temperature and changes in precipitation regimes, which are likely to occur in many regions,
could have direct consequences for oribatid species composition as well as other soil organisms

32
(Eisenhauer et al. 2012; Nielsen et al. 2010). Additional drivers of environmental change such as
atmospheric nitrogen deposition (Zak et al. 2008) that influence soil fungal communities, could
have indirect effects on oribatid communities that would further feedback to alter ecosystem
processes (Gan et al. 2013).

33
Acknowledgements
This chapter was coauthored with Don R. Zak and Mark D. Hunter and is in revision for
publication in Ecosphere. The authors would like to thank Kurt Pregitzer and Andrew Burton
contributed substantially to our work through their long-term dedication to the design and
maintenance of the study sites, as part of a long term field-based N deposition experiment. We
also thank Catherine Doktycz and Liane Racelis for their help with fieldwork. This work was
supported by grants from the US National Science Foundation and the US Department of Energy,
Division of Environmental Biology.

34
Table 2.1. Climatic, biogeochemical and biotic properties (mean ± SE) of four hardwood sites
sampled in our study.
Factors Site A Site B Site C Site D
Climatic
Air Temperature (°C) 4.5 ± 0.22 5.9 ± 0.21 6.7 ± 0.21 7.4 ± 0.21
Precipitation (mm) 850 ± 27 880 ± 23 905 ± 22 836 ± 25
Biogeochemical
Litter fall (g.m
-2 y
-1) 414 ± 19.7 370 ± 11.1 515 ± 19.6 552 ± 27.0
Litter C:N 72.6 ± 6.0 52.5 ± 4.0 55.6 ± 3.7 66 ± 5.6
Litter Calcium (mg.g-1
) 12.4 ± 0.33 16.3 ± 0.30 13.1 ± 0.20 14.3 ± 0.22
O_mass (g.m-2
) 819 ± 108 2037 ± 519 2001± 372 2513 ± 301
Oi_C:N 40.2 ± 3.4 26.3 ± 0.8 24.7 ± 0.6 29.6 ± 1.0
Top 10 cm C:N † 13.1 ± 0.1 16.4 ± 0.8 14.6 ± 1.1 15.3 ± 0.9
SOM 0-10 cm (g.m-2
) ‡ 4388 ± 570 4709 ± 805 3480 ± 424 2346 ± 526
Bulk density (g.cm-2
) 1.11 ± 0.16 0.96 ± 0.1 1.17 ± 0.04 0.91 ± 0.12
Soil pH 4.5 ± 0.17 4.7 ± 0.07 4.4 ± 0.07 4.6 ± 0.25
Bioticc
Collembola (individuals.m-2
) 83 ± 38 257 ± 29 806 ± 286 2872 ± 2432
Mesostigmata (individuals.m-2
) 739 ± 2111 389 ± 96 1072 ± 195 650 ± 148
Fungi PLFAs ( nmol g-1
soil) 18.1 ± 1.69 10.4 ± 0.68 12.8 ± 3.39 10 ± 1.6
Total PLFAs ( nmol g-1
soil) 94.3 ± 6.7 63 ± 5.5 87.9 ± 23.2 61.7 ± 9.2
Notes: Multi-year measurements include: climatic data (1988-2004), litter fall (2001-2011), litter
C:N (2002-2007), litter calcium (1988-2005). Biogeochemical data on O horizons and mineral
soil (except soil pH) were measured in 2004 and are available from Pregitzer et al. 2008. Soil pH
was measured in 2008. Collembola and Mesostigmata were collected in O horizon in 2011. Soil
fungal and total microbial PLFAs were measured in 2006 and are available in van Diepen et al.
2010.
† Top 10 cm C:N is measurement of top 10 cm of OeOa horizon and mineral soil after removal of
Oi horizon.
‡ SOM 0-10 cm is soil organic matter from upper 0-10 cm of mineral soil excluding O horizon.
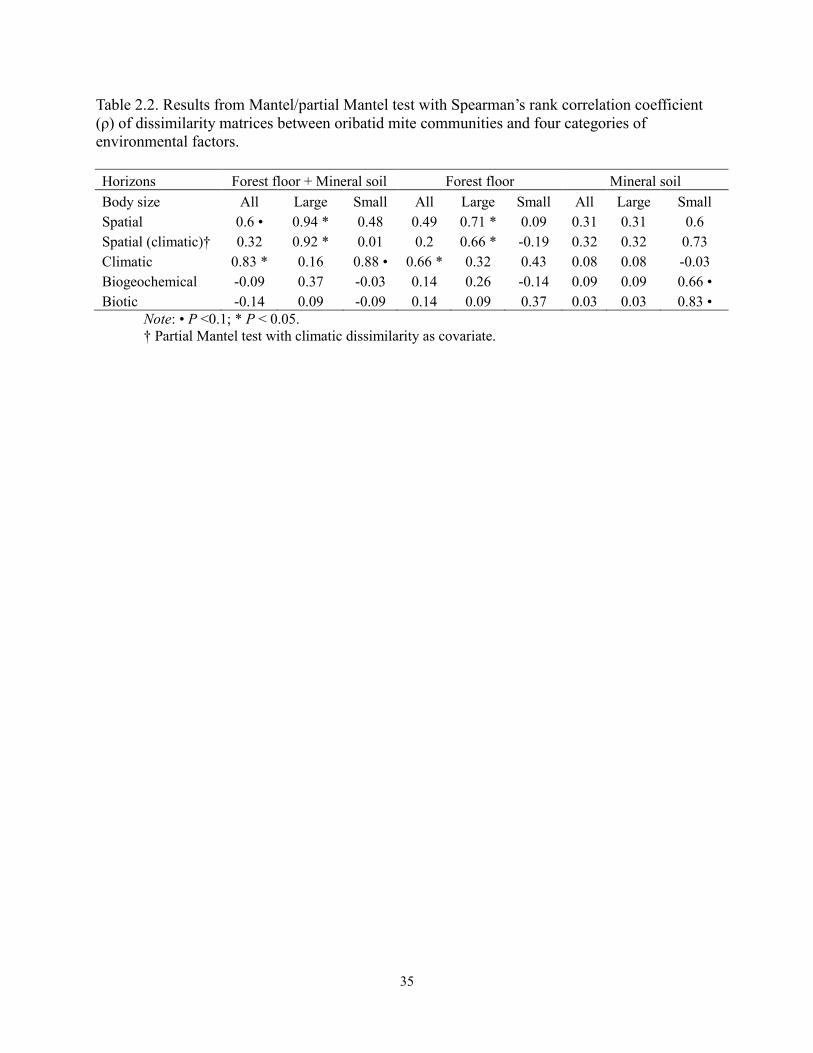
35
Table 2.2. Results from Mantel/partial Mantel test with Spearman’s rank correlation coefficient
(ρ) of dissimilarity matrices between oribatid mite communities and four categories of
environmental factors.
Horizons Forest floor + Mineral soil Forest floor Mineral soil
Body size All Large Small All Large Small All Large Small
Spatial 0.6 • 0.94 * 0.48 0.49 0.71 * 0.09 0.31 0.31 0.6
Spatial (climatic)† 0.32 0.92 * 0.01 0.2 0.66 * -0.19 0.32 0.32 0.73
Climatic 0.83 * 0.16 0.88 • 0.66 * 0.32 0.43 0.08 0.08 -0.03
Biogeochemical -0.09 0.37 -0.03 0.14 0.26 -0.14 0.09 0.09 0.66 •
Biotic -0.14 0.09 -0.09 0.14 0.09 0.37 0.03 0.03 0.83 •
Note: • P <0.1; * P < 0.05.
† Partial Mantel test with climatic dissimilarity as covariate.

36
Figure 2.1. Forest sites composing a long-term chronosequence following glacial retreat. The
southernmost site D is the oldest (13500 years), whereas the northern-most site A is the youngest
(9500 years).

37
Figure 2.2. Total oribatid species richness (forest floor and mineral soil combined) in four study
sites illustrated through rarefaction analysis. The data used for each site consisted of three
replicate plots from three sampling dates.
0
10
20
30
40
50
60
70
0 1000 2000 3000 4000
Num
ber
of specie
s
Individuals
SiteA
SiteB
SiteC
SiteD

38
Figure 2.3. non-Metric Multidimensional Scaling (nMDS) illustrated that the species
composition of the oribatid community varied among study sites and horizons, but did not differ
among sampling dates. Stress value = 0.14. ANOSIM: site R2
= 0.33, P = 0.001; horizon R2
=
0.18, P = 0.001; season R2
= 0.09, P = 0.22. Incidence data (after Hellinger transformation) were
used in this analysis.
-0.6
-0.2
0.2
0.6
1
-0.6 -0.2 0.2 0.6 1
nM
DS
II
nMDS I
Site A Site B Site C Site D
white: May 2011; grey: Jun 2012; black: Aug
s
s s
s
f
f
s s
s f
f
f f
f
f
f
f f
f
s: mineral soil
f: forest floor s

39
Figure 2.4. The relationship between oribatid community dissimilarity and geographic distance
depends on body size. (a) Species with adult body length > 0.45 mm; (b) species with adult body
length ≤ 0.45mm. Species from forest floor and mineral soil are combined for this analysis. ρ
indicates the Spearman’s rank correlation coefficient between two dissimilarity matrices. P
values indicate the significance of Mantel tests between the community dissimilarity matrices
and the geographic distance matrix from four study sites. Incidence data (after Hellinger
transformation) were used in this analysis.
ρ = 0.94 P = 0.04
0.1
0.2
0.3
0.4
0.5
0.6
1.8 2.2 2.6 3
Dis
sim
ilarity
Geographical distance (log)
Large
Small
ρ = 0.48 P > 0.1

40
Figure 2.5. Oribatid species with strongest responses to (a) temperature, (b) soil C: N ratio and
(3) soil fungal biomass from significant RDA results. Temperature (R2 = 0.41, P = 0.04), soil
C:N ratio (R2 = 0.42, P = 0.04) and soil fungal biomass (R
2 = 0.54, P = 0.02) contributed
substantially to the variation of oribatid mite communities in our study.
-1.5
1.5
-1.50 1.50
Temperature
site A
site C
site D
site B
Eremobelba
Ep. longitarsalis
Eu. nemoralis
C. gracilis
O. nitens
En. crossbyi
(a) Forest floor + Mineral soil
all species
-1.5
2.0
-1.5 1.5
C : N
site A
site C
site D
site B
Eremobelba
Epidamaeus sp1
F. fuscipes
R. ardua
X. prionotus
Nothrus sp1
(b) Mineral soil, all species
-1.5
2.0
-2 1.5
Soil_fungi
site A
site C
site D
site B
Eremobelba
Tryhypochthonius
F. americanus X. oblongus
O. nitens
Quadroppia
(c) Mineral soil, small-bodied

41
Appendix
Table A2.1. Species composition of oribatid mites in our study sites. Incidence data are shown in
this table. The values are the total number of times that a species was encountered from a total of
54 subsamples from forest floor and 18 subsamples from mineral soil.
Horizons Forest floor Mineral soil
Species Site A Site B Site C Site D Site A Site B Site C Site D
Achipteria sp. 1 6 0 0 0 0 0 0
Adrodamaeus sp. 3 0 3 8 0 1 0 0
Allosuctobelba sp. 4 3 4 0 1 1 2 1
Anachipteria howardi 0 4 0 1 0 0 1 0
Archiphthiracarus sp1 4 3 2 0 0 0 0 0
Archiphthiracarus sp2 2 0 0 0 0 0 0 0
Archiphthiracarus sp3 3 0 0 0 0 0 0 0
Archoplophora sp. 5 11 0 1 1 1 0 0
Atropacarus sp. 3 4 0 0 0 2 1 1
Autogneta sp. 5 2 0 2 0 0 0 2
Banksinoma sp. 1 4 0 0 0 2 0 2
Carabodes polyporetes 6 6 12 3 1 0 0 0
Carabodes sp1 1 4 0 1 0 0 0 0
Carobodes sp2 0 0 1 0 0 1 0 0
Cepheus cepheiformis 0 1 0 0 0 0 0 0
Ceratozetes gracilis 24 9 2 0 5 4 2 2
Chamobates cuspidatus 3 4 10 3 0 0 3 0
Cultroribula sp. 1 17 1 4 1 4 1 1
Eniochthonius crosbyi 36 26 13 0 7 3 8 3
Epidamaeus sp2 0 0 0 2 0 0 0 0
Epidamaeus sp3 0 0 0 5 0 0 0 0
Epidamaeus longiseta 1 2 3 2 0 0 0 0
Epidamaeus longitarsalis 0 1 5 9 0 0 2 2
Epidamaeus sp1 1 18 0 1 1 7 0 3
Eremaeus translamellatus 0 21 2 0 0 2 0 0
Eremobelba sp. 0 19 8 4 0 11 5 8
Eremulus sp. 0 0 0 4 0 1 0 1
Eueremaeus nemoralis 2 2 40 19 0 1 6 0
Euphthiracarus sp1 0 1 0 2 0 1 0 0
Euphthiracarus sp2 0 0 0 2 0 0 0 0
Fosseremus americanus 1 16 5 0 0 3 2 2
Fuscozetes fuscipes 0 19 0 0 0 3 0 1
Galumna sp1 7 3 1 9 0 0 0 0
Galumna sp2 1 0 0 4 0 0 0 0
Graptoppia foveolata 3 0 2 2 5 5 1 4

42
Heminothrus sp. 1 0 0 0 0 0 0 0
Lepidozetes sp. 21 11 8 9 2 1 3 2
Lucoppia cf. apletosa 0 0 0 2 0 0 0 0
Microtritia sp. 0 0 0 0 0 1 0 0
Multioppia c.f. carolinae 18 7 5 19 4 9 7 9
Nanhermannia sp. 0 0 0 0 0 0 3 0
Nothrus silvestris 18 2 7 2 5 1 1 1
Nothrus sp1 1 0 0 0 0 0 0 0
Ommatocepheus sp. 1 2 2 0 0 0 2 0
Oppia nitens 21 16 0 1 5 2 0 0
Oppiella nova 37 35 25 29 14 12 12 12
Oribatella calcarata 0 4 1 1 0 3 0 1
Oribatella sp1 0 0 1 0 0 0 0 0
Oribatula tibialis 28 33 45 28 1 4 10 1
Parachipteria sp. 2 6 31 2 0 0 3 0
Parapyroppia monodactyla 3 7 0 1 0 0 0 0
Peloribates sp. 0 0 0 1 0 0 0 0
Pergalumina sp. 3 1 0 0 0 0 0 0
Phthiracarus sp1 18 10 3 1 1 2 0 0
Phthiracarus sp2 3 3 0 0 0 0 0 0
Pilogalumna sp. 0 11 4 2 0 1 0 1
Platynothrus sp. 0 0 1 0 1 0 0 0
Podopterotegaeus sp. 4 5 2 1 8 4 7 5
Porobelba parki 2 10 13 7 1 0 3 2
Propelops sp. 1 0 0 0 0 0 0 0
Protokalumna sp. 0 0 0 1 0 0 0 0
Provertex sp. 0 4 0 2 0 0 1 1
Pyroppia sp1 0 2 0 0 0 0 0 0
Quadroppia sp. 3 0 0 0 2 0 0 0
Rhysotritia ardua 12 30 17 13 0 1 3 1
Scheloribates pallidulus 53 45 49 49 11 13 16 11
Siculobata sp. 0 1 2 0 0 0 0 0
Suctobelbella sp1 18 22 20 6 2 3 4 3
Suctobelbella sp2 31 29 22 15 11 13 15 13
Tectocephus spp. 26 29 38 6 4 5 7 5
Tryhypochthonious sp. 0 1 0 0 0 1 0 4
Xylobates oblongus 37 22 19 12 15 7 12 10
Xylobates prionotus 0 0 0 1 0 0 0 0
Xylobates sp1 0 0 0 1 1 0 0 0
Xylobates sp2 1 0 0 0 0 0 0 0
Xylobates sp3 0 0 1 3 0 0 0 0
Zygoribatula frisiae 0 0 0 1 0 0 1 0
Zygoribatula sp1 0 0 3 0 0 0 0 0

43
Zygoribatula clavata 1 0 2 0 0 0 0 0
Total richness 49 51 41 48 25 36 30 31

44
Table A2.2. Redundancy analyses of oribatid communities with each climatic, biogeochemical
and biotic factor. For the combined community from both forest floor and mineral soil, all
environmental factors were used. For community from forest floor (or mineral soil), the
biogeochemical and biotic factors which are not relevant for that horizon were excluded.
Horizons Forest floor + Mineral soil Forest floor Mineral soil
Body size All Large Small All Large Small All Large Small
Temperature 0.41 * 0.42 • 0.40 * 0.43 0.44 0.41 0.37 0.27 0.44
Precipitation 0.27 0.25 0.28 0.28 0.25 0.31 0.27 0.38 0.18
Litter fall 0.38 0.41 0.35 0.46 • 0.48 0.44 … … …
Litter C:N 0.30 0.31 0.28 0.28 0.28 0.27 … … …
Litter Ca 0.32 0.31 0.33 0.27 0.28 0.25 … … …
O_mass 0.39 0.38 0.40 0.36 0.39 0.35 … … …
Oi_C:N 0.36 0.37 0.34 0.30 0.33 0.27 … … …
Top 10 cm C:N 0.33 0.32 0.34 0.26 0.28 0.25 0.42 * 0.31 0.50 •
Soil pH 0.33 0.32 0.33 … … … 0.41 0.46 0.37
SOM 0-10 cm 0.37 0.33 0.36 … … … 0.23 0.19 0.25
Bulk density 0.30 0.26 0.35 … … … 0.39 0.35 0.43
Collembola 0.35 0.33 0.37 0.43 • 0.40 • 0.47 • … … …
Mesostigmata 0.33 0.33 0.33 0.29 0.31 0.28 … … …
Soil fungi 0.37 0.35 0.39 … … … 0.43 • 0.28 0.54 *
Soil microbes 0.33 0.29 0.37 … … … 0.43 0.30 0.52 •

45
Figure A2.1. Principle Component Analysis (PCA) of all climatic, biogeochemical and biotic
factors used in our study.
-1.5
1.5
-1.5 1.5
PC
A2 (
29 %
)
PCA1 (49%)
Precipitation
Temperature
Litter fall
Collembola
O_mass
Top 10cm C:N
Litter Ca
Soil pH
SOM
Oi_C:N
Soil fungi
Litter C:N
Mesostigmata
Total
microbes
Bulk density
Site A
Site C
Site D
Site B

46
Literature Cited
Addison, J. 2009. Distribution and impacts of invasive earthworms in Canadian forest
ecosystems. Biological Invasions 11:59-79.
Adl, S. M., D. C. Coleman, and F. Read. 2006. Slow recovery of soil biodiversity in sandy loam
soils of Georgia after 25 years of no-tillage management. Agriculture, Ecosystems &
Environment 114:323-334.
Belyea, L. R. and J. Lancaster. 1999. Assembly rules within a contingent ecology. Oikos:402-
416.
Berthet, P. L. 1964. Field-study of the mobility of Oribatei (Acari) using radioactive tagging.
Journal of Animal Ecology 33:443-449.
Bray, J. R. and J. T. Curtis. 1957. An ordination of the upland forest communities of Southern
Wisconsin. Ecological Monographs 27:326-349.
Burton, A. J., C. W. Ramm, and K. S. Pregitzer. 1991. Use of multivariate methods in forest
research site selection. Canadian Journal of Forest Research 21:1573-1016.
Caruso, T., M. Taormina, and M. Migliorini. 2012. Relative role of deterministic and stochastic
determinants of soil animal community: a spatially explicit analysis of oribatid mites.
Journal of Animal Ecology 81:214-221.
Chave, J. 2004. Neutral theory and community ecology. Ecology Letters 7:241-253.
Clayton, L. and S. R. Moran. 1982. Chronology of late Wisconsinan glaciation in middle North
America. Quaternary Science Review 1:55-82.
Coulson, S. J., H. P. Leinaas, R. A. Ims, and G. Sovik. 2000. Experimental manipulation of the
winter surface ice layer: the effects on a High Arctic soil microarthropod community.
Ecography 23:299-306.
Crossley, D. A. and J. M. Blair. 1991. A high-efficiency, low-technology Tullgren-type extractor
for soil microarthropods. Agriculture Ecosystems & Environment 34:187-192.
Davis, M. B. 1983. Quaternary history of deciduous forests of eastern North-America and
Europe. Annals of the Missouri Botanical Garden 70:550-563.
Dray, S., P. Legendre, and P. R. Peres-Neto. 2006. Spatial modelling: a comprehensive
framework for principal coordinate analysis of neighbour matrices (PCNM). ecological
modelling 196:483-493.
Eisenhauer, N., S. Cesarz, R. Koller, K. Worm, and P. B. Reich. 2012. Global change
belowground: impacts of elevated CO2, nitrogen, and summer drought on soil food webs
and biodiversity. Global Change Biology 18:435-447.
Ellwood, F., A. Manica, and W. A. Foster. 2009. Stochastic and deterministic processes jointly
structure tropical arthropod communities. Ecology Letters 12:277-284.
Ermilov, S. G. and M. Locnyska. 2008. The influence of temperature on the development time of
three oribatid mite species (Acari, Oribatida). North-Western Journal of Zoology 4:274-
281.
Finlay, B. J. 2002. Global dispersal of free-living microbial eukaryote species. Science
296:1061-1063.
Gan, H. J., D. R. Zak, and M. D. Hunter. 2013. Chronic nitrogen deposition alters the structure
and function of detrital food webs in a northern hardwood ecosystem. Ecological
Applications. In press. [doi: 10.1890/12-1895.1]
Gan, H. J., D. R. Zak, and M. D. Hunter. In review. Trophic stability of soil oribatid mites in the
face of environmental change. Soil Biology & Biochemistry..
Gates, G. E. 1982. Farewell to North American megadriles. . Megadrilogica 4:12-77.

47
Ghilarov, M. S. and T. S. Perel. 1984. Transfer of earthworms (Lumbricidae, Oligochaeta) for
soil amelioration in the USSR. Pedobiologia 27:107-113.
Giller, P. S. 1996. The diversity of soil communities, the ‘poor man's tropical rainforest’.
Biodiversity and Conservation 5:135-168.
Hasegawa, M. 1997. Changes in collembola and cryptostigmata communities during the
decomposition of pine needles. Pedobiologia 41:225-241.
Hasegawa, M. 2001. The relationship between the organic matter composition of a forest floor
and the structure of a soil arthropod community. European Journal of Soil Biology
37:281-284.
Hishi, T., F. Hyodo, S. Saitoh, and H. Takeda. 2007. The feeding habits of collembola along
decomposition gradients using stable carbon and nitrogen isotope analyses. Soil Biology
& Biochemistry 39:1820-1823.
Houck, M. A. and B. M. OConnor. 1991. Ecological and evolutionary significance of phoresy in
the astigmata. Annual Review of Entomology 36:611-636.
Hunt, H. W., D. C. Coleman, E. R. Ingham, R. E. Ingham, E. T. Elliott, J. C. Moore, S. L. Rose,
C. P. P. Reid, and C. R. Morley. 1987. The detrital food web in a shortgrass prairie.
Biology and Fertility of Soils 3:57-68.
Ingimarsdóttir, M., T. Caruso, J. Ripa, Ó. B. Magnúsdóttir, M. Migliorini, and K. Hedlund. 2012.
Primary assembly of soil communities: disentangling the effect of dispersal and local
environment. Oecologia 170:745-754.
Ingimarsdóttir, M., T. Caruso, J. Ripa, Ó. B. Magnúsdóttir, M. Migliorini, and K. Hedlund. 2012.
Primary assembly of soil communities: disentangling the effect of dispersal and local
environment. Oecologia:1-10.
Irmler, U. 2006. Climatic and litter fall effects on collembolan and oribatid mite species and
communities in a beech wood based on a 7 years investigation. European Journal of Soil
Biology 42:51-62.
Johansen, S. and H. Hytteborn. 2001. A contribution to the discussion of biota dispersal with drift
ice and driftwood in the North Atlantic. Journal of Biogeography 28:105-115.
Karasawa, S. and N. Hijii. 2004. Effects of microhabitat diversity and geographical isolation on
oribatid mite (Acari: Oribatida) communities in mangrove forests. Pedobiologia 48:245-
255.
Karasawa, S., Gotoh, K., T. Sasaki, and N. Hijii. 2005. Wind-based dispersal of oribatid mites
(Acari: Oribatida) in a subtropical forest in Japan. 日本ダニ学会誌 14.
Koehler, H. H. 1999. Predatory mites (Gamasina, Mesostigmata). Agriculture Ecosystems &
Environment 74:395-410.
Lebedeva, N. V. and D. A. Krivolutsky. 2003. Birds spread soil microarthropods to Arctic
islands. Doklady Biological Science:182-186.
Lebedeva, N. V. and V. D. Lebedev. 2007. Diversity of oribatidmites (Acari, Oribatei) and other
soil microarthropods in plumage of raptos. Caucasian Entomological Bulletin 3:9-18.
Legendre, P. and E. D. Gallagher. 2001. Ecologically meaningful transformations for ordination
of species data. Oecologia 129:271-280.
Lehmitz, R., D. Russell, K. Hohberg, A. Christian, and W. E. R. Xylander. 2012. Active dispersal
of oribatid mites into young soils. Applied Soil Ecology 55:10-19.
Lindo, Z. and N. N. Winchester. 2008. Scale dependent diversity patterns in arboreal and
terrestrial oribatid mite (Acari : Oribatida) communities. Ecography 31:53-60.
Lindo, Z. and N. N. Winchester. 2009. Spatial and environmental factors contributing to patterns

48
in arboreal and terrestrial oribatid mite diversity across spatial scales. Oecologia 160:817-
825.
Luxton, M. 1981. Studies on the oribatid mites of a Danish beech wood soil: Part V. Vertical
distribution. Pedobiologia 21:365-386.
Maraun, M., H. Martens, S. Migge, A. Theenhaus, and S. Scheu. 2003. Adding to ‘the enigma of
soil animal diversity’: fungal feeders and saprophagous soil invertebrates prefer similar
food substrates. European Journal of Soil Biology 39:85-95.
Maraun, M., H. Schatz, and S. Scheu. 2007. Awesome or ordinary? Global diversity patterns of
oribatid mites. Ecography 30:209-216.
Marinissen, J. C. Y. and F. Vandenbosch. 1992. Colonization of new habitats by earthworms.
Oecologia 91:371-376.
Marshall, V. G., R. Reevrs, and R. A. Norton. 1987. Catalogue of the Oribatida (Acari) of
continental United States and Canada. Memoirs of the Entomological Society of Canada
119:1-418.
Nielsen, U. N., G. H. Osler, C. D. Campbell, D. F. Burslem, and R. van der Wal. 2010. The
influence of vegetation type, soil properties and precipitation on the composition of soil
mite and microbial communities at the landscape scale. Journal of Biogeography
37:1317-1328.
Norton, R. A. 1980. Observations on phoresy by oribatid mites (Acari: Oribatei). . International
Journal of Acarology 6:121-130.
Norton, R. A. 1994. Evolutionary aspects of oribatid mite life histories and consequences for the
origin of the Astigmata. Mites. Ecological and evolutionary analyses of life-history
patterns:99-135.
Norton, R. A. and V. M. Behan-Pelletier. 1991. Calcium-carbonate and calcium-oxalate as
cuticular hardening agents in oribatid mites (Acari, Oribatida). Canadian Journal of
Zoology-Revue Canadienne De Zoologie 69:1504-1511.
Ojala, R. and V. Huhta. 2001. Dispersal of microarthropods in forest soil. Pedobiologia 45:443-
450.
Osler, G. H. R. and A. J. Beattie. 1999. Taxonomic and structural similarities in soil oribatid
communities. Ecography 22:567-574.
Patterson, S. L., D. R. Zak, A. J. Burton, A. F. Talhelm, and K. S. Pregitzer. 2012. Simulated N
deposition negatively impacts sugar maple regeneration in a northern hardwood
ecosystem. Journal of Applied Ecology 49:155-163.
Pregitzer, K. S., A. J. Burton, D. R. Zak, and A. F. Talhelm. 2008. Simulated chronic nitrogen
deposition increases carbon storage in Northern Temperate forests. Global Change
Biology 14:142-153.
Prest, V. K. 1969. Retreat of Wisconsin and recent ice in North America. Geo. Surv. Can.
Map:1257A.
R Development Core Team. 2012. R: A language and environment for statistical computing. R
Fundation for Statistical Computing, Vienna, Austria.
Reynolds, J. W. 2004. The status of earthworm biogeography, diversity and taxonomy in North
Ameirca revisted with glimpse into the future. Pages 63-74 in C. A. Edwards, editor.
Earthworm Ecology. CRC press.
Scheu, S. and D. Parkinson. 1994. Effects of Invasion of an Aspen Forest (Canada) by
Dendrobaena-Octaedra (Lumbricidae) on Plant-Growth. Ecology 75:2348-2361.
Siepel, H. 1991. Nature restoration and the role of the mesofauna in decomposition of organic

49
matter. Proceedings of the Section Experimental and Applied Entomology of the
Netherlands Entomological Society 2:22–27.
Siepel, H. 1996. The importance of unpredictable and short-term environmental extremes for
biodiversity in oribatid mites. Biodiversity Letters 3:26-34.
Siepel, H. and E. M. De Ruiter-Dijkman. 1993. Feeding guids of oribatid mites based on their
carbohydrase activities. Soil Biology & Biochemistry 25:1389-1394.
Tilman, D. 2004. Niche tradeoffs, neutrality, and community structure: a stochastic theory of
resource competition, invasion, and community assembly. Proceedings of the National
Academy of Sciences of the United States of America 101:10854-10861.
Vagvolgyi, J. 1975. Body size, aerial dispersal, and origin of the Pacific land snail fauna.
Systematic Biology 24:465-488.
Van der Gucht, K., K. Cottenie, K. Muylaert, N. Vloemans, S. Cousin, S. Declerck, E. Jeppesen,
J. M. Conde-Porcuna, K. Schwenk, and G. Zwart. 2007. The power of species sorting:
local factors drive bacterial community composition over a wide range of spatial scales.
Proceedings of the National Academy of Sciences 104:20404-20409.
van Diepen, L. T., E. A. Lilleskov, K. S. Pregitzer, and R. M. Miller. 2010. Simulated nitrogen
deposition causes a decline of intra-and extraradical abundance of arbuscular mycorrhizal
fungi and changes in microbial community structure in northern hardwood forests.
Ecosystems 13:683-695.
VanStraalen, N. M. and H. A. Verhoef. 1997. The development of a bioindicator system for soil
acidity based on arthropod pH preferences. Journal of Applied Ecology 34:217-232.
Zak, D. R., W. E. Holmes, A. J. Burton, K. S. Pregitzer, and A. F. Talhelm. 2008. Simulated
Atmospheric No3- Deposition Increases Soil Organic Matter by Slowing Decomposition.
Ecological Applications 18:2016-2027.

50
Chapter III
Trophic structure and trophic dynamics of soil oribatid mites
Abstract. A key issue in ecology is the degree to which trophic structure within communities
responds to environmental change. Organisms with generalist diets are more flexible in their
feeding habits than are specialists, and may suffer less in a changing environment. Soil fauna
fulfill crucial ecosystem functions in terrestrial ecosystems and many are thought to have
generalized diets. They may therefore be buffered from negative effects of environmental
change. Here, we used 15
N isotope analysis to study trophic differentiation among 91 species of
oribatid mites and their responses to chronic atmospheric N deposition. Combining our own
measurements with published data, we established that the trophic positions of mite species were
remarkably stable within and among forests, as well as between ambient and experimental N
deposition. Trophic stability indicates a higher than expected level of feeding specialization,
which may foster diversity, but limit the ability to switch food resources in a changing
environment.

51
Introduction
Soil animal communities are among the most species-rich components of terrestrial ecosystems
(Giller 1996). In one square meter of soil, there may reside ~200 species of arthropods and up to
~1000 species of soil animals (Anderson 1975a). However, studies of the feeding biology of soil
animals have revealed that many exhibit surprisingly similar behavior, with most apparently
consuming a mixture of microbial and plant materials; accordingly, they have been classified as
non-specialized feeders (Scheu et al. 2005). The existence of astonishingly high local diversity,
with a low level of food resource specialization, is considered an ecological “enigma”.
To explain the high diversity of soil animal communities, there has been speculation
about finer-scale differences in food resource utilization among these generalist decomposers,
which could go undetected using traditional methods, such as gut content analyses or food choice
experiments (Anderson 1975a). For instance, it is difficult to use gut content analyses to
distinguish between what is ingested by soil animals and what is actually assimilated as food,
unless egestion is also studied (Scheu 2002). Similarly, observations of litter feeding do not
exclude the possibility that the soil animals actually target microorganisms or other animals that
colonize or dwell on the leaf litter. In this case, soil animals should be characterized as
bacterial/fungal feeders (microbivores) or predators, rather than saprotrophic feeders that
consume litter itself (Coleman et al. 2004).
In contrast to gut content analysis or food choice experiments, stable isotope ratios reflect
the long-term trophic relationships of animals and are a powerful tool in evaluating the trophic
structure of animal communities (Minagawa and Wada 1984, Scheu and Falca 2000). In general,
there is discrimination against 15
N during catabolism, leading to an accumulation of 15
N in
organisms relative to their food resource (Minagawa and Wada 1984). Reviews of different food

52
webs have demonstrated that there is an average increase of 3.4‰ of 15
N with each trophic level,
although the enrichment levels may vary among different taxonomic groups or developmental
stages (Post 2002).
Measuring the trophic structure of soil animals would not only provide insight into
potential niche differentiation underlying their coexistence, but also substantially improve our
ability to predict effects of global environmental change on soil food web structure and
dynamics. If many soil fauna are indeed dietary generalists, they may be buffered to a greater
extent from environmental change than are dietary specialists. Recent meta-analyses indicate that
chronic atmospheric N deposition, a pervasive agent of global change, can reduce microbial
biomass (-20%) and inhibit litter decay in many forests (Knorr et al. 2005, Liu and Greaver
2010), thereby decreasing the flow of energy through soil food webs (Gan et al. 2013). Reduced
energy flow from the microbial community could alter the trophic structure of soil food webs,
especially if microbivorous soil animals switch their diets to other food sources. The generalist
feeding habits ascribed to most soil animals suggest that such a switch is plausible (Behan and
Hill 1978, Maraun et al. 2003, Scheu et al. 2005), but we have a limited understanding of how a
reduced flow of energy, the result of chronic N deposition, may affect the trophic structure of soil
food webs.
Our study focused on the trophic structure of soil oribatid mites, a major group of
wingless microarthropods in many ecosystems; up to 170 species can coexist in the litter and soil
of hardwood forests (Hansen 2000). Recent studies of their δ15
N reveal that they occupy more
than four trophic levels, which may, in part, contribute to their high local diversity (Schneider et
al. 2004). However, estimating trophic differentiation among oribatid mites based on 15
N
analysis requires additional empirical work (Maraun et al. 2011). By obtaining measurements of

53
15N from oribatid mites dwelling in the forest floor and combining information from previous
15N studies, the first aim of our study was to investigate the trophic structure of an oribatid mite
community and determine the frequency of saprotrophic feeders compared to those with other
feeding habits. We expected to find a low frequency of saprotrophic species, assuming a lack of
coevolution between consumers and dead plant material. Secondly, we investigated the stability
of the trophic structure of soil oribatid mites in the face of environmental change, specifically
chronic nitrogen deposition as well as variation among different forest types. Previous research
at our field sites has revealed that chronic experimental N deposition has reduced plant litter
decay and accelerated organic matter accumulation in forest floor and surface mineral soil (Zak
et al. 2008). At the same time, microbial biomass has been reduced by 18% under experimental
N deposition (DeForest et al. 2004). The lower microbial biomass and the slowing of litter
decomposition has reduced the flow of energy into the detrital food web, reducing the abundance
of microarthropods by 41% and shifting species composition within the oribatid mite community
(Gan et al. 2013). We expected that, following the decrease in microbial biomass and slowing of
litter decay under chronic nitrogen deposition (Zak et al. 2008), oribatid mites would feed more
on plant litter leading to a decline in their trophic position from higher to lower trophic levels.
Materials and methods
Site description
We collected soil oribatid mites from a long-term study of experimental N deposition consisting
of four sugar maple (Acer saccharum)-dominated northern hardwood forests in the Great Lakes
region of North America. These four sites are denoted as Site A (46:51N; 88:52W), Site B
(45:32N; 84:51W), Site C (44:22N; 85:49W) and Site D (43:40N; 86:08W) spanning from north
to south in the state of Michigan, USA. The sites are floristically and edaphically matched (>80%

54
sugar maple on sandy soils), but they differ in climate along a north-south latitudinal gradient.
These hardwood forests are underlain by slightly acid soils (pH 4.41 – 4.70) that are well-drained
sandy typic Haplothords of the Kalkaska series. Within each study site, six 30-m x 30-m plots
were established in 1994; 3 plots receive ambient N deposition and the remaining 3 plots receive
an additional 30 kg NO3--N ha
-1 y
-1. The additional NO3
- is delivered over the growing season in
six equal applications of solid NaNO3 pellets; an additional 10-m wide buffer surrounds each
plot, and it also receives the experimental treatments.
Oribatid mite collections
Forest floor (including Oi and Oe/a horizons) samples were first collected in late May 2011 as in
Gan et al. (2013). Within each plot, a 10-cm x 10-cm PVC frame was randomly placed on the
forest floor, and any organic substrate above the mineral soil was collected and placed into a
plastic bag. At each site, a total of 6 samples were collected from each plot receiving either
ambient (n = 3) or experimental N deposition (n = 3), resulting in a total of 144 samples (4 sites
x 6 plots x 6 samples). All of the samples were transported to the lab in coolers and placed on
modified Tullgren funnels within 48 hours to extract microarthropods (Crossley and Blair 1991).
After the 5-day extraction, litter was placed in a 60 °C oven for 24 hours for subsequent
determination of dry mass. A second microarthropod collection was conducted in early June
2012 in all four study sites, but from ambient N plots only (4 sites x 3 plots x 6 samples = 72
samples total).
The extracted microarthropods were preserved in 70% ethanol, which does not influence
the 15
N of soil animals (Fábián 1998). The major group, oribatid mites, were enumerated under
a microscope and further identified to genus or species based on the keys written by R.A. Norton
and V.M. Behan-Pelletier (unpublished data) for use at the Ohio State University Summer

55
Acarology Program.
Stable isotope analysis
Dominant oribatid mite species from each site were removed from ethanol and placed into pre-
weighed tin capsules. Ten to 150 individuals for each species were composited to generate
enough mass for stable isotope analysis, which also ensured that we had a representative sample
of individuals from a particular species. The tin capsules with oribatid mites were weighed again,
after they were oven-dried at 60 °C for 24 hours, to obtain the dry weight of mites. Each species
composite ranged from 0.40 mg to 1.50 mg. For each study site, we selected the dominant
species to ensure enough mass for isotope analysis. In total, we were able to analyze 23 species
of oribatid mites, each with 1-4 composite replicates from the ambient N plots at our four study
sites. In addition, nine of the 23 species were also sufficiently abundant in the experimental N
deposition plots for analysis. These 9 species were paired for comparisons with the same species
from adjacent ambient N plots, with 5 species pairs from Site A, 3 pairs from Site C and 1 pair
from Site B from the same sampling trip (May 2011).
A total of 24 ground litter samples were also analyzed for 15
N abundance, which we used
as background to adjust the 15
N of mites. The litter samples collected on May 2011 were oven
dried at 60 °C for 24 hours, following microarthropod extraction. The dried litter from each N
deposition treatment (ambient vs. elevated) was composited and homogenized for each site. A
subsample of 5 g from each of the litter composites was ground. Two replicates (5 mg) from the
ground samples, together with mite samples collected in June 2012, were sent for stable isotope
analysis at the Stable Isotope Facility at the University of California, Davis. The mite samples
collected in May 2011 were analyzed in the Terrestrial Ecology Stable Isotope Lab at the
University of Michigan. In both facilities, the 15
N/14
N ratios of animals and litter were

56
determined by a coupled system of an elemental analyser (UC Davis: NA 1500, Carlo Erba,
Milan; U of Michigan: NC2500, CE Elantech, NJ) and stable isotope mass spectrometer (UC
Davis: MAT 251, Thermo Finnigan, CA; U of Michigan: Delta Plus, Thermo Finnigan, CA).
The natural abundance of stable isotopes was expressed using δ notation (‰) and
calculated as δsample = ( Rsample – Rstandard )/ Rstandard, where Rsample and Rstandard are the heavy/light
isotope ratios of the sample and standard. In the facility at UC Davis, two laboratory standards
(Nylon 5 and Glutamic acid) were interspersed among the samples and the standard deviation of
the laboratory standards ranges from 0.20 to 0.21‰. In the facility at the University of Michigan,
six laboratory standards (keratin, caffeine, NBS tomato leaves, NBS bovine liver, corn flour and
rice flour) were interspersed among the samples and the regression (r2 = 0.9999) between their
known and measured 15
N values was used to calibrate that of the samples. The final values were
calibrated as relative to an internal standard (atmospheric N2).
Calibration of the trophic positions of oribatid mites
Because the δ15
N for the basal food resources varied among study sites, we calibrated the trophic
positions of oribatid mites separately at each site, based upon the δ15
N of the litter in which the
oribatid mites were collected. First, we chose the lowest δ15
N of the litter as a base line (-3.26‰
from the ambient plots of Site D for convenience. Then, the δ15
N values of mites (δ15
Nraw) from
different plots and sites were calibrated by subtracting the difference between the δ15
N values of
the litter (δ15
Nlitter) and -3.26‰, such that the calibrated δ15
N values of mites δ15
Ncalibrated =
δ15
Nraw – (δ15
Nlitter- (-3.26‰)). We assigned oribatid mite species into different trophic groups
based on their calibrated δ15
N values: lichen feeders (lycophages), saprotrophic feeders,
bacterial/fungal feeders and predators/scavengers.
57
Saprotrophic feeders are not enriched in their δ15
N by 3.4‰ above that of litter
(Vanderklift and Ponsard 2003). When animals feed on low protein diets (such as litter), the
dietary protein is reserved for body composition and maintenance, rather than catabolized for
energy (Gannes et al. 1997). As such, the 15
N of their diet is maintained in body tissue, instead of
an accumulation of the heavier isotope during catabolism. Therefore, we set the δ15
N for
saprotrophic feeders to vary around those of their resource (δ15
N of litter +/- 1.7‰) similar to the
approach used by (Illig et al. 2005). Lichens in general exhibit distinctly low δ15
N and lichen
feeders maintain those values in their bodies. Therefore, we categorized any oribatid mite species
with a δ15
N at least 1.7‰ lower than that of litter as a lichen feeder. The upper limit of the δ15
N
of saprotrophic feeders, 3.4‰, would designate the upper boundary for fungal/bacterial feeders,
and species with δ15
N higher than that would be designated as predators (live animals) or
scavenger (dead animals).
Review of previous studies of trophic positions of soil oribatid mites
To determine the prevalence of saprotrophic feeders among soil oribatid mites, and to compare
the stability of trophic structure among additional field sites, we summarized the δ15
N of oribatid
mites from published studies to enhance the sample size. In total, there were 7 publications with
measurements of δ15
N of oribatid mites (Maraun et al. 2011), and we excluded two studies that
focused on bark-living oribatid mites (Erdmann et al. 2007, Fischer et al. 2010), resulting in 5
studies with data for oribatid mites dwelling in forest floors, including Scheu and Falca 2000,
Schneider et al. 2004, Illig et al. 2005, Pollierer et al. 2009 and Maraun et al. 2011.
From these studies, we used the average δ15
N of each oribatid species and also that of the
leaf litter collected from the associated sampling location. To make those measurements
comparable among studies, we only included the adults of litter-dwelling oribatid mites, even

58
though it has been suggested that developmental stage (juveniles vs. adults) or dwelling depth
(litter vs. mineral soils) has little effect on trophic positions (Scheu and Falca 2000). To allow
comparison of δ15
N among oribatid mite species from different studies, we adjusted the δ15
N of
the animals by correcting for the differences between the δ15
N of the litter in our study (-3.26‰)
and those in the literature. We assigned oribatid mites into trophic positions based on their
calibrated δ15
N; these included lichen feeders, saprotrophic feeders, fungal/bacterial feeders and
predators/scavengers. The resulting trophic affiliations did not differ from the conclusions
presented in the original literature.
Statistical analysis
We used two-way ANOVA (site and treatment, type I sum of squares) to assess any difference in
the δ15
N of forest floor from our four study sites with different N deposition levels. Each δ15
N of
forest floor was averaged from the two subsamples from the same ground sample. The forest
floor of the experimental N deposition plots at Site B was subjected to a 15
N labeling experiment
conducted in 1998 and is highly enriched (Zak et al. 2004); we thus treated its δ15
N as a missing
value in the two-way ANOVA analysis. We also used two-way ANOVA (site and species, with
type II sum of squares for site) to test whether the trophic positions of oribatid mites varied
among different study sites, after removing the variation among different species. A student’s
paired t-test was used to compare the δ15
N of oribatid mites (after calibration) under ambient and
experimental N deposition.
We then combined our measurements with data from previous studies. We were
interested in whether the δ15
N of oribatid mite species differed among measurements from
different authors. Therefore, we used two-way ANOVA with Species and Author as main effects
to analyze within-species variation in δ15
N measurements of the same oribatid species from

59
different authors after controlling for the variation among species (Species was entered first into
the model with type II sum of squares for Author). All of the above statistical analysis was
performed in software R 2.15.1 (R Development Core Team 2012).
Results
15N of forest floor
The natural abundance of 15
N in the forest floor of the ambient plots was similar among sites,
ranging from -3.26 to -1.77‰ (F3,2 = 4.06, P = 0.20). As expected, the forest floor in the
experimental N deposition plots at Site B was highly enriched in 15
N (5.18‰), as a consequence
of a 15
N labeling experiment conducted at this site in 1998 (Zak et al. 2004). When we excluded
Site B from the analysis, we still found a slight increase (an average of 1‰) in 15
N in forest floor
under chronic nitrogen deposition (F1,2 = 17.9, P = 0.051). This likely arises from added NO3- -N,
which is enriched compared with litter with a 0 δ15
N.
Trophic positions of oribatid mites
The calibrated δ15
N of 23 oribatid mite species (ambient plots only, a total of 43 measurements)
formed a continuum ranging over 9‰, with Parachipteria sp. being the lowest (- 3.54‰),
whereas the highest was Emerobelba sp. (6.11‰, Fig. 3.1). Two-way ANOVA revealed that the
δ15
N values of oribatid mites did not vary between sampling years (F1, 19 = 0.23, P = 0.63) or
among sampling sites (Fig. 3.2, F3, 17 = 1.24, P = 0.32). For subsequent analyses, we treated the
samples from different years or sampling sites as replicates, resulting in 1- 4 replicates for each
species.
Based on an increase of 3.4‰ per trophic level and the base line level at -3.26‰, we
have designated 3 species as saprotrophic feeders (-4.96 to – 1.56‰), 13 species as

60
fungal/bacterial feeders (-1.56 to 1.84‰) and 6 species as predators/scavengers (1.84 to 5.24‰)
that feed on dead or live animal tissues or any food item that has a high δ15
N value. We also had
one species Eremobelba. sp. with an extremely high δ15
N (6.11‰), which we therefore
designated as a secondary predator (Fig. 3.1).
Response to chronic nitrogen deposition
We were able to collect 9 species with paired measurements from plots receiving ambient and
experimental N deposition. A Student’s paired t test revealed that the trophic levels of oribatid
mites did not differ between N deposition treatments (Fig. 3.2, t = - 1.17, P = 0.27). The
differences in δ15
N between the N deposition treatments were smaller than 1‰ for most species,
except Oppiella nova (-2.62‰; Fig. 3.2).
Review of the trophic positions of oribatid mites
Combining our own measurements with previously published data, we could examine a total of
91 litter-dwelling oribatid mites. They formed a continuum ranging from -7.11 to 6.11‰ (see
Table A3.1 in Appendix). Out of these 91 oribatid species in the forest floor, there was only 1
species with a distinctly negative δ15
N (Carabodes labyrinthicus), and it was therefore
categorized as a lichen feeder. Additionally, one species expressed a δ15
N two trophic levels
above that of the saprotrophic feeders, and it was therefore categorized as a secondary predator
(Eremobelba. sp., Fig. 3.1). Over half of the species (55%) were ascribed to the second trophic
level as microbivores and only 22% of the species were designated as litter feeders. The
remaining 21% of the species were categorized as predators/scavengers (Fig. 3.3). There were 16
species with measurements from more than one study (a total of 46 measurements with 2-5
replicates for each species). Two-way ANOVA of the 16 species revealed that δ15
N of the same

61
species did not differ among studies (F5,25 = 0.15, P = 0.96, Fig. 3.4). A complete list of oribatid
species with their trophic positions can be found in Appendix T1.
Discussion
Trophic structure of soil oribatid mites
In contrast to the idea that most soil oribatid mites feed on dead plant material, the occurrence of
saprotrophic feeders was low, comprising 13% of species in our study and 22% when we
combined our data with that available in the literature (Fig 3.3.). The percentage of lichen feeders
was also low, probably due to the scarcity of lichen in the forest floor of these temperate forests.
This is in contrast to the high occurrence of lichen feeders on tree bark or in the forest floor of
coniferous forests with a high abundance of lichen (Erdmann et al. 2007). Over half of the
oribatid mites were categorized as fungal/bacterial feeders. Considering their chewing
mouthparts and the observation of fungal hyphae in their guts (Anderson 1975b, Kaneko 1988),
oribatid mites are more likely to be fungal feeders than bacterial feeders, which generally require
tube-like mouthparts to ingest bacterial cells (Yeates et al. 1993). Oribatid mites in the second
trophic level could theoretically feed on saprotrophic mites at a lower trophic position; however,
orbatid mites are usually heavily sclerotized, making predation by other oribatids unlikely
(Peschel et al. 2006). The oribatid mites that were categorized as predators are more likely to
feed on other less-defended soil animals such as fungal-feeding Collembola or bacterial-feeding
nematodes. They may also acquire their high δ15
N from feeding on dead animals as scavengers. It
is uncertain whether Eremobelba. sp. acquired its high δ15
N by scavenging on dead animals or by
preying upon other predators; the latter would make it a secondary predator. Nevertheless, almost
80% of oribatid mite species exhibited δ15
N much higher than that of litter, suggesting that litter
is not their major food resource. Using a different approach with 13
C-labeled plant leaf and root

62
litter, Pollierer et al. (2007) came to a similar conclusion. In their study, leaf litter contributed
little as a carbon source for soil animals, and the great majority of soil animals acquired carbon
from roots or root-derived carbon resources, especially ectomyccorrizal fungi.
If the majority of the oribatid mites rely on live food items (i.e., fungi hyphae or animal
tissue), then biotic interactions between oribatid mites and their food resources are a potential
driver of high oribatid diversity. In particular, over half of the oribatid mites were categorized as
fungivores. Considering the vast diversity of fungi in the forest floor, specialized feeding by
oribatid mites on certain groups of fungi may help to maintain the coexistence of oribatid species
with similar trophic positions. Indeed, soil oribatid mites have distinct preferences when offered
different fungal diets (Mitchell and Parkinson 1976, Schneider and Maraun 2005). On the other
hand, soil-borne fungi have a plethora of defensive traits against fungivores, including the
formation of crystalline structures outside fungal hyphae as well as the production of toxic
secondary metabolites (Böllmann et al. 2010). These observations suggest that fungi and
fungivorous oribatid mites have the potential to co-evolve in a manner similar to that observed in
plant-herbivores interactions aboveground (Thompson 1994). Such close evolutionary
interactions may provide the key for understanding the high diversity of both fungi and
fungivores in soil habitats.
Understanding the trophic structure of orbatid mite communities not only helps to explain
their high local richness, but also has implications for ecosystem functioning. For instance, the
contribution of litter feeders to soil respiration could be trivial; however, fungal feeding by
orbatid mites could regulate fungal community composition as well as the mineralization of N
from ingested fungal hyphae (McGonigle 1995, Crowther et al. 2011). Moreover, other groups of
soil animals such as Collembola and Enchytraeidae also derive a majority of their diet from fungi

63
(Didden 1993, Maraun et al. 2003). Overall, fungivores comprise between 21 and 76% of the soil
fauna biomass in both natural and managed ecosystems (McGonigle 1995). Modeling suggests
that fungivores may consume 86% of net fungal production in woodland soil (McBrayer et al.
1974), although empirical studies of fungal consumption by soil animals are rare. Gut content
analysis has found that fungal hyphae in the guts of soil oribatid mites constitute 3% of the
standing fungal biomass in an aspen forest (Mitchell and Parkinson 1976). Considering the low
proportion of active hyphae in soil (Kjøller and Struwe 1982), and their consumption by other
fungivorous animals, the proportion of net fungal production consumed by soil animals could be
substantial. By influencing fungal communities though grazing, fungivores could have important
consequences for ecosystem processes such as litter decay (Gan et al. 2013) and C storage
(Clemmensen et al. 2013).
Stability of the trophic positions of oribatid mites from different environments
We expected that fungal-feeding oribatid mites would switch to consuming litter under chronic N
deposition, in response to reduced fungal biomass and the accumulation of organic matter under
experimental N deposition (Zak et al. 2008). However, the 15
N of oribatid mites categorized as
fungal feeders under ambient N deposition did not decline significantly under experimental N
deposition treatments. The exception was O. nova, which displayed a 2.6‰ decline in 15
N
under chronic N deposition. This marked decline suggests that O. nova switched trophic
positions from a fungal feeder under ambient N deposition (0.53‰) to a saprotrophic feeder
under chronic N deposition (-1.88‰). It should be noted that O. nova is the most cosmopolitan
species of all oribatid mites and often cited as a pioneer and dominant species in highly disturbed
systems (Marshall et al. 1987; Siepel 1996). It reproduces asexually and has the most rapid
development time of any species under study (Haenko 1988). Such ecological flexibility and

64
rapid ontogeny suggests that O. nova is more of a generalist than the other oribatids that we
studied. However, we were only able to obtain a single measurement of 15
N from O. nova in
each N deposition treatment, due to its small body size (0.3 mm), which produced a limited
biomass for stable isotope analysis. More replicated measurements will be needed in order to
confirm that this decline in 15
N represents a true dietary shift. In contrast to O. nova, most
oribatid mites are characterized by “K-selected” life history traits including slow development,
low rates of reproduction, and long adult life (Norton 1994). These traits may constrain their
ability to respond to environmental change.
The general lack of change in the trophic positions of oribatid mites under chronic N
deposition suggests that their trophic structure is relatively stable, despite changes in their food
resources (fungal biomass and organic matter) under chronic N deposition. Two further lines of
evidence in our study indicate stability in the trophic positions of soil oribatid mites across larger
spatial scales. First the 15
N of oribatid mites did not differ significantly among the four sugar-
maple forests that we sampled (Fig. 3.1). These four sites vary in annual average temperature
from 4.7 oC at Site A (northern site) to 7.6
oC at Site D (southern site), a temperature differential
that approximates typical scenarios of global climate change. Second, our literature survey
revealed similar trophic positions for the same oribatid species collected from different
ecosystems (beech vs. sugar-maple forest, Fig. 3.4). Our results are consistent with previous
findings that the 15
N of oribatid mites vary little with soil depths in the same forest (Scheu and
Falca 2000) or among different forests (Schneider et al. 2004). Similarly, Erdmann et al. (2007)
found that oribatid species from the bark of different trees (coniferous vs. broad-leaf trees) shared
very similar trophic position, despite differences in the abundance and composition of their
potential food resources (lichens, algae and fungi etc.) between these two types of tree bark. By

65
combining data of our own with data from previous studies, we provide more conclusive
evidence that soil oribatid mites express stability in their trophic positions at large spatial scales.
Stability in the trophic positions of oribatid mites is unexpected because oribatid mites
are often considered generalists that change their diets based on the food resources that are
available (Behan and Hill 1978, Maraun et al. 2003, Scheu et al. 2005). However, the stability in
their trophic positions within and among ecosystems, and their lack of response under chronic N
deposition, indicate that oribatid mites may be more specialized than previously thought.
Schneider et al. (2004) have suggested that niche differentiation among different trophic groups
may, in part, contribute to the high diversity of soil oribatid mites. We have evidence to suggest
that differentiation within trophic groups may be another important mechanism in maintaining
their local diversity. For example, while both categorized in the second trophic level as
microbivores, Galumna lanceata (0. 82 +/- 0.53‰, mean +/- 1SD) consistently exhibited a
higher 15
N than did Carabodes femoralis (-0.83 +/- 0. 24‰) without any overlap in their trophic
positions. Likewise, litter feeding Steganacarus magnus (- 1.96 +/- 0. 65‰) had a consistently
higher 15
N than did Platynothrus peltifer (-4.0 +/- 0. 47‰) in the same trophic group. We
recognize the small number of replicates available to us for some species, but these species-
specific 15
N within trophic levels suggest that oribatid species may feed selectively and
consistently on food items with different 15
N abundances, thereby acquiring the 15
N of their
food resources.
Variation in 15
N within trophic groups resulted in a continuum of trophic positions of
oribatid mites, rather than discrete trophic levels. Such continuous distribution of trophic
positions is, in fact, rather common in soil animal communities (Schneider et al. 2004;
Chahartaghi et al. 2005), which contrasts with stepwise enrichment of 15
N in distinct trophic

66
levels in some aquatic ecosystems (Minagawa and Wada, 1984). The variation in 15
N in the same
trophic group of mites may reflect different food resources with varying 15
N in soils, such as
differences between fungal groups (saprotrophic or mycorrhizal fungi) or different parts (chitin
vs. protein) of fungi (Hobbie et al. 2012). Alternatively, continuous change in 15
N may reflect
diet mixing, whereby mites are feeding on more than one trophic level. While selective feeding
and omnivory are both widespread in oribatid mites (Walter 1987), the use of a single stable
isotope is unable to separate these two mechanisms. Nevertheless, the stability of their isotopic
trophic positions suggests that oribatid mites feed consistently on specific food items or specific
mixtures.
We caution that most of the available 15
N measurements of oribatid mites were from
temperate forests (and mountain rain forest from Illig et al. 2005); studies from other ecosystems
(grasslands, boreal forests and tundra) are sorely needed for comparisons of the consistency of
trophic positions of oribatid mites from different ecosystems. However, at least in temperate
hardwood forests, the high occurrence of fungivores and the stability of their trophic positions
under different environments, suggests a degree of specialization that helps to resolve the enigma
of their high local diversity. Moreover, the apparent inflexibility of their diets in the face of
environmental variability suggests that oribatid densities may suffer under environmental
change, with concomitant effects on ecosystem processes. Indeed, a marked decline in the
density of soil oribatid mites under chronic N deposition has been documented in our previous
work (Gan et al. 2013). While the degree of dietary specialization in other groups of soil animals
is not well known, the negative effects of environmental change on many groups of soil animals
suggests that they may generally have a limited ability to accommodate a quickly-changing
environment (Blankinship et al. 2011). The change in abundance and community structure of soil

67
animals is likely to have further consequences for ecosystem functioning, including carbon
cycling (Gan et al. 2013).

68
Acknowledgements
This chapter was coauthored with Don R. Zak and Mark D. Hunter and is in revision for
publication in Soil Biology& Biochemistry. The authors would like to thank Kurt Pregitzer and
Andrew Burton contributed substantially to our work through their long-term dedication to the
design and maintenance of the study sites, as part of a long term field-based N deposition
experiment. We also thank Pat Micks for her help with the measurements of the 15
N isotope. This
work was supported by grants from the US National Science Foundation and the US Department
of Energy, Division of Environmental Biology.

69
Figure 3.1. Dominant oribatid mite species in the forest floor of four hardwood forests occupy
more than three trophic levels. δ15
N values of mites were calibrated based on differences between
15N levels of substrates from that of the ambient N treatment of Site D (- 3.26‰). Two-way
ANOVA (type II sum of square) indicated that the same species from different sites did not differ
in their δ15
N values (F3, 17 = 1.24, P = 0.32). Diamond: Site A; triangle: Site B; square: Site C;
circle: Site D. Error bar represents 1 SD when there were replicated measurements.
-6
-4
-2
0
2
4
6
8
Pa
rach
ipte
ria
sp
.
Cu
ltro
rib
ula
sp
.
Pa
rap
yro
pp
ia s
p.
Lep
ido
zete
s sp
.
Ga
lum
na
sp
.
Ph
thir
aca
rus
sp.
Rh
yso
trit
ia a
rdu
a
Tec
toce
ph
us
vela
tus
No
thru
s si
lves
tris
Eu
erem
aeu
s n
emo
rali
s
Fu
sco
zete
s f
usc
ipes
Op
pie
lla
no
va
En
ioch
tho
niu
s cr
osb
yi
Sch
elo
rib
ate
s p
all
idu
lus
Ori
ba
tula
tib
iali
s
Tec
toce
ph
us
min
or
Xyl
ob
ate
s o
blo
ng
us
Ere
ma
eus
tra
nsl
am
ella
tus
Cer
ato
zete
s g
raci
lis
Ep
ida
ma
eus
sp.
Op
pia
nit
ens
Mu
ltio
pp
ia s
p.
Em
ero
bel
ba
sp
.
δ 1
5N
(‰
)
Site A
Site B
Site C
Site D
Litter

70
Figure 3.2. Trophic positions of oribatid mites (indicated by their δ15
N) in the forest floor did not
differ between ambient (empty) and elevated (solid) N deposition plots. δ15
N values of mite were
calibrated based on differences between δ 15
N of substrates from that of the ambient N treatment
of Site D (- 3.26‰). Error bar represents 1 SD when there were replicated measurements.
Student’s t test (paired): t = - 1.17, P = 0.27.
-6
-4
-2
0
2
4
6
δ 15
N (
‰)
Ambient
Elevated
Litter

71
Figure 3.3. The proportions of different feeding habits among 91 oribatid mite species from
combining current measurements with previously published studies.
Lichen
feeder
1%
Litter
feeder
22%
Fungal
feeder
55%
Predator/sc
avenger
21%
Secondary
predator
1%

72
Figure 3.4. Trophic positions of oribatid mites (indicated by δ15
N) show little variation among
different studies (two-way ANOVA with type II sums of squares, F5,25 = 0.15, P = 0.96). δ15
N
values of mites were calibrated based on differences between δ15
N of substrates from that of the
ambient N treatment of Site D (- 3.26‰). Error bar represents 1 SE. The number in parenthesis
after the species name indicates the number of studies with measurement for that species.
-6
-4
-2
0
2
4
Pla
tynoth
rus
pel
tife
r(4)
Ach
ipte
ria c
ole
optr
ata
(3)
Noth
rus
pa
lust
ris(
2)
Euze
tes
glo
bulu
s(2)
Ste
ganaca
rus
mag
nus(
5)
Cara
bodes
fem
ora
lis(
2)
Cham
obate
s cu
spid
atu
s(2
)
Nanher
mannia
nana
(2)
Atr
opa
caru
s st
ricu
lus(
4)
Cham
obate
s vo
igts
i(4)
Hyp
od
am
aeu
s ri
pari
us(
2)
Ori
batu
la t
ibia
lis(
2)
Noth
rus
silv
estr
is(4
)
Galu
mna
lance
ata
(2)
Cer
ato
zete
s gra
cili
s(2)
Hyp
och
thon
ius
rufu
lus(
4)
δ 1
5N
(‰
)
litter
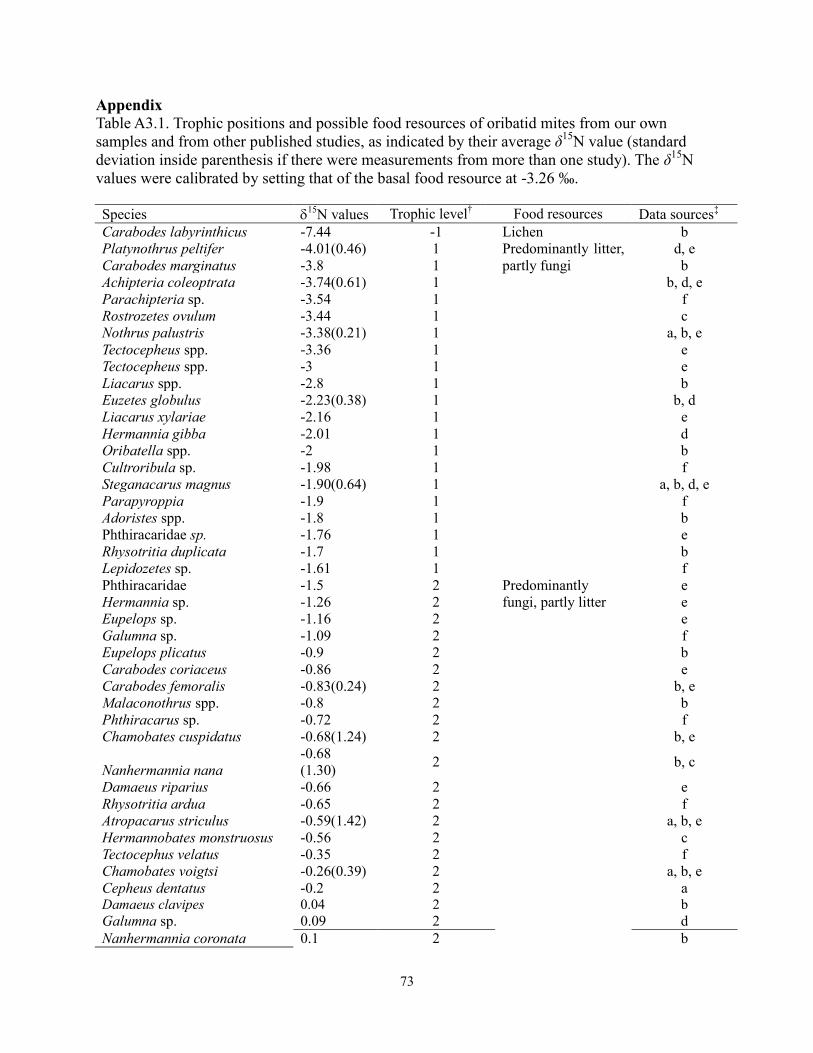
73
Appendix
Table A3.1. Trophic positions and possible food resources of oribatid mites from our own
samples and from other published studies, as indicated by their average δ15
N value (standard
deviation inside parenthesis if there were measurements from more than one study). The δ15
N
values were calibrated by setting that of the basal food resource at -3.26 ‰.
Species 15
N values Trophic level† Food resources Data sources
‡
Carabodes labyrinthicus -7.44 -1 Lichen b
Platynothrus peltifer -4.01(0.46) 1 Predominantly litter,
partly fungi
d, e
Carabodes marginatus -3.8 1 b
Achipteria coleoptrata -3.74(0.61) 1 b, d, e
Parachipteria sp. -3.54 1 f
Rostrozetes ovulum -3.44 1 c
Nothrus palustris -3.38(0.21) 1 a, b, e
Tectocepheus spp. -3.36 1 e
Tectocepheus spp. -3 1 e
Liacarus spp. -2.8 1 b
Euzetes globulus -2.23(0.38) 1 b, d
Liacarus xylariae -2.16 1 e
Hermannia gibba -2.01 1 d
Oribatella spp. -2 1 b
Cultroribula sp. -1.98 1 f
Steganacarus magnus -1.90(0.64) 1 a, b, d, e
Parapyroppia -1.9 1 f
Adoristes spp. -1.8 1 b
Phthiracaridae sp. -1.76 1 e
Rhysotritia duplicata -1.7 1 b
Lepidozetes sp. -1.61 1 f
Phthiracaridae -1.5 2 Predominantly
fungi, partly litter
e
Hermannia sp. -1.26 2 e
Eupelops sp. -1.16 2 e
Galumna sp. -1.09 2 f
Eupelops plicatus -0.9 2 b
Carabodes coriaceus -0.86 2 e
Carabodes femoralis -0.83(0.24) 2 b, e
Malaconothrus spp. -0.8 2 b
Phthiracarus sp. -0.72 2 f
Chamobates cuspidatus -0.68(1.24) 2 b, e
Nanhermannia nana
-0.68
(1.30) 2 b, c
Damaeus riparius -0.66 2 e
Rhysotritia ardua -0.65 2 f
Atropacarus striculus -0.59(1.42) 2 a, b, e
Hermannobates monstruosus -0.56 2 c
Tectocephus velatus -0.35 2 f
Chamobates voigtsi -0.26(0.39) 2 a, b, e
Cepheus dentatus -0.2 2 a Damaeus clavipes 0.04 2 b
Galumna sp. 0.09 2 d
Nanhermannia coronata 0.1 2 b
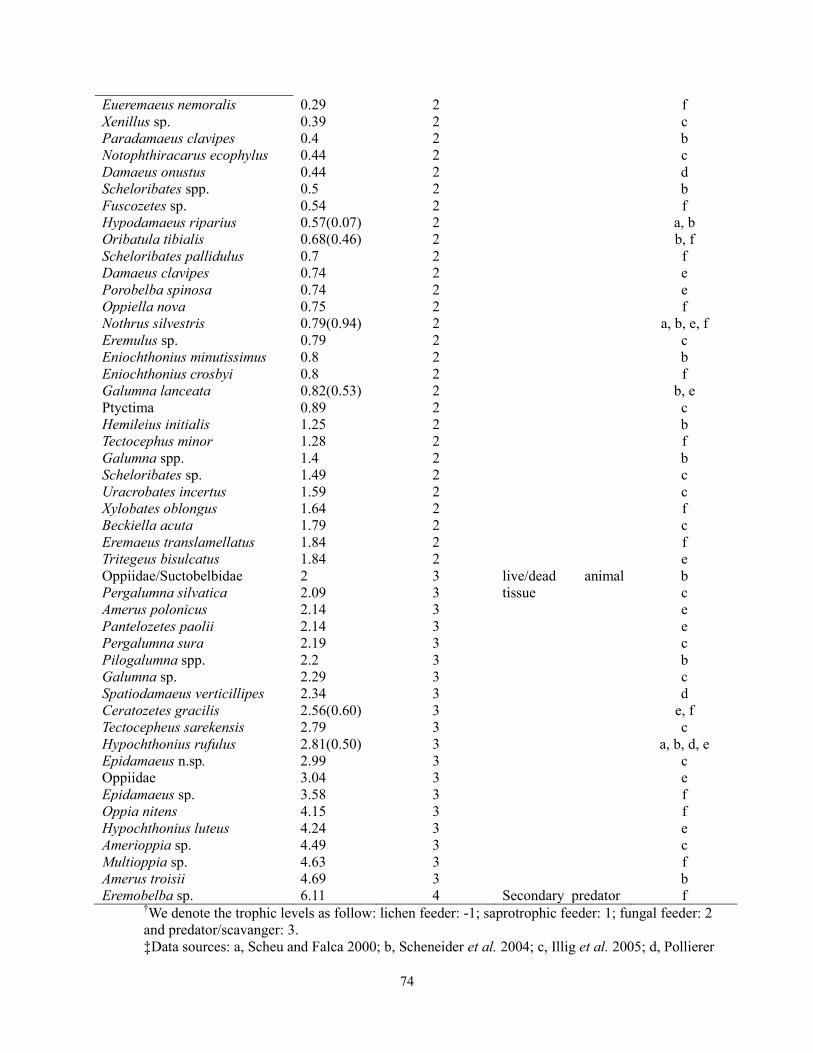
74
Eueremaeus nemoralis 0.29 2 f
Xenillus sp. 0.39 2 c
Paradamaeus clavipes 0.4 2 b
Notophthiracarus ecophylus 0.44 2 c
Damaeus onustus 0.44 2 d
Scheloribates spp. 0.5 2 b
Fuscozetes sp. 0.54 2 f
Hypodamaeus riparius 0.57(0.07) 2 a, b
Oribatula tibialis 0.68(0.46) 2 b, f
Scheloribates pallidulus 0.7 2 f
Damaeus clavipes 0.74 2 e
Porobelba spinosa 0.74 2 e
Oppiella nova 0.75 2 f
Nothrus silvestris 0.79(0.94) 2 a, b, e, f
Eremulus sp. 0.79 2 c
Eniochthonius minutissimus 0.8 2 b
Eniochthonius crosbyi 0.8 2 f
Galumna lanceata 0.82(0.53) 2 b, e
Ptyctima 0.89 2 c
Hemileius initialis 1.25 2 b
Tectocephus minor 1.28 2 f
Galumna spp. 1.4 2 b
Scheloribates sp. 1.49 2 c
Uracrobates incertus 1.59 2 c
Xylobates oblongus 1.64 2 f
Beckiella acuta 1.79 2 c
Eremaeus translamellatus 1.84 2 f
Tritegeus bisulcatus 1.84 2 e
Oppiidae/Suctobelbidae 2 3 live/dead animal
tissue
b
Pergalumna silvatica 2.09 3 c
Amerus polonicus 2.14 3 e
Pantelozetes paolii 2.14 3 e
Pergalumna sura 2.19 3 c
Pilogalumna spp. 2.2 3 b
Galumna sp. 2.29 3 c
Spatiodamaeus verticillipes 2.34 3 d
Ceratozetes gracilis 2.56(0.60) 3 e, f
Tectocepheus sarekensis 2.79 3 c
Hypochthonius rufulus 2.81(0.50) 3 a, b, d, e
Epidamaeus n.sp. 2.99 3 c
Oppiidae 3.04 3 e
Epidamaeus sp. 3.58 3 f
Oppia nitens 4.15 3 f
Hypochthonius luteus 4.24 3 e
Amerioppia sp. 4.49 3 c
Multioppia sp. 4.63 3 f
Amerus troisii 4.69 3 b
Eremobelba sp. 6.11 4 Secondary predator f †We denote the trophic levels as follow: lichen feeder: -1; saprotrophic feeder: 1; fungal feeder: 2
and predator/scavanger: 3.
‡Data sources: a, Scheu and Falca 2000; b, Scheneider et al. 2004; c, Illig et al. 2005; d, Pollierer

75
et al. 2009; e, Maraun et al. 2011; f, current study.

76
Literature Cited
Anderson, J. 1975a. The enigma of soil animal species diversity. Pages 51-58 in J. Vaněk, editor.
Progress in soil zoology. Academia, Publishing House of the Czechostovak Academy of
Sciences, Prague.
Anderson, J. 1975b. Succession, diversity and trophic relationships of some soil animals in
decomposing leaf litter. The Journal of Animal Ecology 44:475-495.
Behan, V. and S. Hill. 1978. Feeding habits and spore dispersal of oribatid mites in the North
American arctic. Revue d'Écologie et de Biologie du Sol 15:497-516.
Blankinship, J. C., P. A. Niklaus, and B. A. Hungate. 2011. A meta-analysis of responses of soil
biota to global change. Oecologia 165:553-565.
Böllmann, J., M. Elmer, J. Wöllecke, S. Raidl, and R. F. Hüttl. 2010. Defensive strategies of soil
fungi to prevent grazing by Folsomia candida (Collembola). Pedobiologia 53:107-114.
Chahartaghi, M., R. Langel, S. Scheu, and L. Ruess. 2005. Feeding guilds in Collembola based
on nitrogen stable isotope ratios. Soil Biology and Biochemistry 37:1718-1725.
Clemmensen, K., A. Bahr, O. Ovaskainen, A. Dahlberg, A. Ekblad, H. Wallander, J. Stenlid, R.
Finlay, D. Wardle, and B. Lindahl. 2013. Roots and associated fungi drive long-term
carbon sequestration in boreal forest. Science 339:1615-1618.
Coleman, D. C., D. A. Crossley, and P. F. Hendrix. 2004. Fundamentals of soil ecology. 2 edition.
Elsevier Academic Press, San Diego, CA.
Crossley, D. A. and J. M. Blair. 1991. A high-efficiency, low-technology Tullgren-type extractor
for soil microarthropods. Agriculture Ecosystems & Environment 34:187-192.
Crowther, T. W., L. Boddy, and T. H. Jones. 2011. Outcomes of fungal interactions are
determined by soil invertebrate grazers. Ecology Letters 14:1134-1142.
DeForest, J. L., D. R. Zak, K. S. Pregitzer, and A. J. Burton. 2004. Atmospheric nitrate
deposition, microbial community composition, and enzyme activity in northern hardwood
forests. Soil Science Society of America Journal 68:132-138.
Didden, W. A. M. 1993. Ecology of terrestrial Enchytraeidae. Pedobiologia 37:2-29.
Erdmann, G., V. Otte, R. Langel, S. Scheu, and M. Maraun. 2007. The trophic structure of bark-
living oribatid mite communities analysed with stable isotopes (15
N, 13
C) indicates strong
niche differentiation. Experimental and Applied Acarology 41:1-10.
Fábián, M. 1998. The effects of different methods of preservation on the15
N concentration in
Folsomia candida (Collembola). Applied Soil Ecology 9:101-104.
Fischer, B. M., H. Schatz, and M. Maraun. 2010. Community structure, trophic position and
reproductive mode of soil and bark-living oribatid mites in an alpine grassland
ecosystem. Experimental and Applied Acarology 52:221-237.
Gan, H. J., D. R. Zak, and M. D. Hunter. 2013. Chronic nitrogen deposition alters the structure
and function of detrital food webs in a northern hardwood ecosystem. Ecological
Applications In press.
Gannes, L. Z., D. M. O'Brien, and C. M. del Rio. 1997. Stable isotopes in animal ecology:
assumptions, caveats, and a call for more laboratory experiments. Ecology 78:1271-1276.
Giller, P. S. 1996. The diversity of soil communities, the ‘poor man's tropical rainforest’.
Biodiversity and Conservation 5:135-168.
Haenko, N. 1988. Life history of Oppiella nova (Oudemans)(Oribatei) in cool temperate forest
soils in Japan. Acarologia 29:215-221.
Hansen, R. A. 2000. Effects of habitat complexity and composition on a diverse litter
microarthropod assemblage. Ecology 81:1120-1132.

77
Hobbie, E. A., F. S. Sánchez, and P. T. Rygiewicz. 2012. Controls of isotopic patterns in
saprotrophic and ectomycorrhizal fungi. Soil Biology and Biochemistry.
Illig, J., R. Langel, R. A. Norton, S. Scheu, and M. Maraun. 2005. Where are the decomposers?
Uncovering the soil food web of a tropical montane rain forest in southern Ecuador using
stable isotopes (15
N). Journal of Tropical Ecology 21:589-593.
Kaneko, N. 1988. Feeding habits and cheliceral size of oribatid mites in cool temperate forest
soils in Japan. Revue d'Écologie et de Biologie du Sol 25:353-363.
Kjøller, A. and S. Struwe. 1982. Microfungi in ecosystems: fungal occurrence and activity in
litter and soil. Oikos 39:391-422.
Knorr, M., S. D. Frey, and P. S. Curtis. 2005. Nitrogen additions and litter decomposition: A
meta-analysis. Ecology 86:3252-3257.
Liu, L. and T. L. Greaver. 2010. A global perspective on belowground carbon dynamics under
nitrogen enrichment. Ecology Letters 9999.
Maraun, M., G. Erdmann, B. Fischer, M. Pollierer, R. Norton, K. Schneider, and S. Scheu. 2011.
Stable isotopes revisited: their use and limits for oribatid mite trophic ecology. Soil
Biology and Biochemistry 43:877-882.
Maraun, M., H. Martens, S. Migge, A. Theenhaus, and S. Scheu. 2003. Adding to ‘the enigma of
soil animal diversity’: fungal feeders and saprophagous soil invertebrates prefer similar
food substrates. European Journal of Soil Biology 39:85-95.
Marshall, V. G., R. Reevrs, and R. A. Norton. 1987. Catalogue of the Oribatida (Acari) of
continental United States and Canada. Memoirs of the Entomological Society of Canada
119:1-418.
McBrayer, J. F., D. E. Reichle, and M. Witkamp. 1974. Energy flow and nutrient cycling in a
cryptozoan food-web. Oak Ridge National Lab., Tenn.(USA).
McGonigle, T. P. 1995. The significance of grazing on fungi in nutrient cycling. Canadian
Journal of Botany 73:1370-1376.
Minagawa, M. and E. Wada. 1984. Stepwise enrichment of 15
N along food chains: Further
evidence and the relation between δ15
N and animal age. Geochimica Et Cosmochimica
Acta 48:1135-1140.
Mitchell, M. J. and D. Parkinson. 1976. Fungal feeding of oribatid mites (Acari: Cryptostigmata)
in an aspen woodland soil. Ecology 57:302-312.
Norton, R. A. 1994. Evolutionary aspects of oribatid mite life histories and consequences for the
origin of the Astigmata. Pages 99-135 in M. Houck, editor. Mites: ecological and
evolutionary analyses of life-history patterns. Chapman & Hall, New York, USA.
Peschel, K., R. A. Norton, S. Scheu, and M. Maraun. 2006. Do oribatid mites live in enemy-free
space? Evidence from feeding experiments with the predatory mite Pergamasus
septentrionalis. Soil Biology & Biochemistry 38:2985-2989.
Pollierer, M. M., R. Langel, S. Scheu, and M. Maraun. 2009. Compartmentalization of the soil
animal food web as indicated by dual analysis of stable isotope ratios ( 15
N/14
N
and13
C/12
C). Soil Biology and Biochemistry 41:1221-1226.
Post, D. M. 2002. Using stable isotopes to estimate trophic position: models, methods, and
assumptions. Ecology 83:703-718.
R Development Core Team. 2012. R: A language and environment for statistical computing. R
Fundation for Statistical Computing, Vienna, Austria.
Scheu, S. 2002. The soil food web: structure and perspectives. European Journal of Soil Biology
38:11-20.

78
Scheu, S. and M. Falca. 2000. The soil food web of two beech forests (Fagus sylvatica) of
contrasting humus type: stable isotope analysis of a macro-and a mesofauna-dominated
community. Oecologia 123:285-296.
Scheu, S., L. Ruess, and M. Bonkowski. 2005. Interactions between microorganisms and soil
micro-and mesofauna. Pages 253-275 in F. Buscot and A. Varma, editors.
Microorganisms in Soils: Roles in Genesis and Functions. Springer, Berlin.
Schneider, K. and M. Maraun. 2005. Feeding preferences among dark pigmented fungal taxa
(“Dematiacea”) indicate limited trophic niche differentiation of oribatid mites (Oribatida,
Acari). Pedobiologia 49:61-67.
Schneider, K., S. Migge, R. A. Norton, S. Scheu, R. Langel, A. Reineking, and M. Maraun. 2004.
Trophic niche differentiation in soil microarthropods (Oribatida, Acari): evidence from
stable isotope ratios (15
N/14
N). Soil Biology and Biochemistry 36:1769-1774.
Siepel, H. 1996. Biodiversity of soil microarthropods: the filtering of species. Biodiversity &
Conservation 5:251-260.
Thompson, J. N. 1994. The coevolutionary process. University of Chicago Press, Chicago, IL.
Usher, M. B. and T. Parr. 1977. Are there successional changes in arthropod decomposer
communities?
Vanderklift, M. A. and S. Ponsard. 2003. Sources of variation in consumer-diet δ15
N enrichment:
a meta-analysis. Oecologia 136:169-182.
Walter, D. E. 1987. Trophic behavior of"mycophagous" microarthropods. Ecology 68:226-229.
Yeates, G., T. Bongers, R. De Goede, D. Freckman, and S. Georgieva. 1993. Feeding habits in
soil nematode families and genera—an outline for soil ecologists. Journal of nematology
25:315.
Zak, D. R., W. E. Holmes, A. J. Burton, K. S. Pregitzer, and A. F. Talhelm. 2008. Simulated
atmospheric NO3- deposition increases soil organic matter by slowing decomposition.
Ecological Applications 18:2016-2027.
Zak, D. R., K. S. Pregitzer, W. E. Holmes, A. J. Burton, and G. P. Zogg. 2004. Anthropogenic N
deposition and the fate of 15
NO3− in a northern hardwood ecosystem. Biogeochemistry
69:143-157.

79
Chapter IV
The effects of chronic N deposition on the community structure and function of soil
oribatid mites
Abstract During the next century, atmospheric nitrogen (N) deposition is projected to more than
double, potentially slowing litter decomposition by altering microbial community composition
and function. If the flow of energy though detrital food webs is diminished by the slowing of
decay under higher rates of atmospheric N deposition, this agent of global change could also
negatively impact the abundance and composition of soil fauna. To test this hypothesis, we
studied soil faunal communities in four sugar maple-dominated forests that comprise a long-term
N deposition experiment. To examine whether changes in soil faunal communities could then
feed back to influence litter decay, litterbags with 13
C-enriched aspen litter were placed in the
forest floor in one study site. The microbial community within the litterbags was characterized
using PLFA analysis. Overall, long-term experimental N deposition reduced the abundance of
microarthropods (ambient = 7844 individuals/m2 vs. experimental N deposition = 4357
individuals/m2; P = 0.004). We attribute this overall decline partly to the reduced energy flow
entering the detrital food web that has been documented in previous work in our system. While
there was no difference in microarthropod species richness between N deposition treatments,
there was a shift in community composition within the most abundant group (Oribatida),
indicating species-specific responses to N deposition. Experimental N deposition reduced the
number of microarthropods colonizing litterbags by 41% (P =0.014). This was associated with a
reduction in 13
C mobilization from leaf litter into fungal biomass. Overall, this study

80
demonstrates that chronic N deposition has a detrimental effect on the soil detritus food web, and
that the negative effect may feed back to influence litter decay and ecosystem functioning.

81
Introduction
Global changes in climate and land use are affecting biodiversity in many ecosystems (Wolters et
al. 2000), and this has triggered extensive research into the consequences of these anthropogenic
forces on ecosystem functioning (Chapin et al. 1998, Diaz et al. 2006). The majority of
experiments have focused on plants and animals living aboveground (Hughes 2000, Walther et
al. 2002, Wu et al. 2011), whereas comparably less is known regarding belowground responses
(Wardle et al. 1999, Blankinship et al. 2011). Most research into soil biotic responses to global
change has focused on microbial communities, whereas the responses of soil fauna at higher
trophic levels, such as nematodes, mites and springtails, are less understood, but clearly mediate
important functions that have ecosystem-level implications (Osler and Sommerkorn 2007,
Sackett et al. 2010). For example, soil fauna can alter the physical environments of the soil
through litter comminution and soil bioturbation (Lussenhop 1992) or regulate the activity and
population dynamics of the microbial community through grazing (Moore et al. 1988, Lussenhop
1992, Hassall et al. 2006). Moreover, significant links between soil fauna communities and
decomposition rates have been observed in the field (Neher et al. 2012).
Anthropogenic nitrogen (N) deposition is a pervasive agent of global environmental
change (Vitousek et al. 1997). Over the past 150 years, atmospheric N deposition has increased
from 0.05- 0.10 g N m-2
yr-1
prior to 1880 to 1.50-2.00 g N m-2
yr-1
in the early 1990s across
large areas of the Northern Hemisphere; this rate is projected to double during the next century
(Galloway et al. 2004). Atmospheric N deposition can stimulate net primary productivity in N-
limited terrestrial ecosystems, thereby increasing ecosystem carbon (C) storage, albeit there is
considerable debate regarding the extent of this stimulation (Nadelhoffer et al. 1999, Magnani et
al. 2007). However, atmospheric N deposition also could increase ecosystem C storage by

82
slowing plant litter decay and accelerating organic matter accumulation in soil (Carreiro et al.
2000, Frey et al. 2004). Although most studies of N deposition focus on changes in the microbial
community (Zak et al. 2011), the few studies that have been conducted suggest that soil fauna at
higher trophic levels could also be affected by anthropogenic N deposition (Boxman et al. 1998,
Xu et al. 2009, Eisenhauer et al. 2012). Shifts in microarthropod community composition, in
response to experimental N deposition, can significantly reduce soil respiration and accelerate
nutrient leaching in laboratory microcosms (Heneghan and Bolger 1996). However, our
knowledge is incomplete regarding the in situ response of soil fauna to anthropogenic N
deposition and potential feedbacks that could modify rates of litter decomposition.
Previous studies have reported that anthropogenic N deposition can have either beneficial
or detrimental effects on detrital food webs. For instance, Sjursen et al. (2005) found increased
microarthropod abundance in a subarctic ecosystem after application of NPK fertilizer,
attributing this to the bottom-up effects of higher plant productivity. In contrast, N fertilization
can reduce carbon allocation belowground to roots and rhizodeposition (Hogberg et al. 2010),
thereby reducing energy availability in the soil environment. Moreover, anthropogenic N
deposition can reduce rates of litter decay (Knorr et al. 2005, Zak et al. 2008), which can also
reduce the energy entering the detritus-based food web. Both of these belowground responses to
anthropogenic N deposition could negatively impact the soil microbial community, as well as
higher trophic levels in the soil food web.
Here, we sought to understand the mechanisms by which chronic N deposition has
influenced the dynamics of the detrital food web in soil. In a long-term field experiment
consisting of four sugar-maple (Acer saccharum) forest stands, chronic experimental N
deposition has slowed plant litter decay and accelerated organic matter accumulation in forest

83
floor and surface mineral soil (Pregitzer et al. 2008, Zak et al. 2008, Edwards et al. 2011). The
slowing of plant litter decay has resulted from a decline in lignolytic extracellular enzyme
activity, originating from the transcriptional down regulation of fungal genes encoding these
enzymes (Edwards et al. 2011). At the same time, microbial biomass had been reduced by 18%
under experimental N deposition (DeForest et al. 2004). We were interested in determining
whether soil fauna at higher trophic levels were also affected negatively by long-term
experimental N deposition; we reasoned that a lower microbial biomass and the slowing of litter
decomposition could plausibly reduce the flow of energy into the detrital food web. We focused
on microarthropod groups involved in important soil processes, such as litter fragmentation and
microbial grazing (Collembola, oribatid mites), as well as mesostigmatic mites that, through their
predation, are potential regulators of grazer abundance (Coleman et al. 2004). We hypothesized
that (1) microarthropod communities are affected negatively by long-term N deposition, due to
reduced energy flow entering the detrital food web; and (2) the change in microarthropod
communities further feeds back to slow litter decomposition. We tested these hypotheses by
quantifying microarthropod populations in forest floors receiving ambient and experimental N
deposition. Additionally, we placed litterbags containing 13
C-labeled leaf litter in one of the
forest stands to determine whether chronic N deposition has compromised the ability of
microarthropod communities to colonize and degrade new litter.
Methods
Site description and experimental design
This long-term study of experimental N deposition consists of four sugar maple (Acer
saccharum)-dominated northern hardwood forests in the Great Lakes region of North America
(Burton et al. 1991). The sites are floristically and edaphically matched (>80% sugar maple on

84
sandy soils), but they differ in climate along a north-south latitudinal gradient (Fig. 4.1). Within
each study site, six 30-m x 30-m plots were established in 1994; 3 plots receive ambient N
deposition and the remaining 3 plots receive ambient plus 30 kg NO3--N ha
-1 y
-1. The additional
NO3- is delivered over the growing season in six equal applications of solid NaNO3 pellets; a 10-
m wide buffer surrounds each plot, and it also receives the experimental treatments. More
detailed descriptions of the study site can be found in Zak et al. (2008)
Microarthropod survey
Forest floor litter was collected in June 2009 in site B as an initial survey of microarthropod
populations. Within each plot, a 10-cm x 10-cm PVC frame was placed randomly on the forest
floor, and the Oi and Oe horizons were collected and placed in a plastic bag. A total of 6 samples
were collected from each plot receiving either ambient (n = 3) or experimental N deposition (n =
3). All of the samples were transported to the lab in coolers and placed in modified Tullgren
funnels within 48 hours (Crossley and Blair 1991) to extract microarthropods. After the 5-day
extraction, litter was placed in a 60 °C oven for 24 hours for the subsequent determination of dry
mass. A second microarthropod survey was conducted in May 2011 in all four study sites using
the same sampling and extraction scheme.
The extracted microarthropods were preserved in 70% ethanol, and three major groups
(Mesostigmata, Collembola and Oribatida) were enumerated under a microscope. For the second
survey, the most abundant group (Oribatida) were further identified to genus or species level
based on the keys written by Norton & Behan-Pelletier (unpublished) for use at the Ohio State
University Summer Acarology Program (http://www.biosci.ohio-
state.edu/~acarolog/summerProgram/).
Litterbag experiment

85
Litterbags (20 cm x 20 cm) were constructed using a layer of 1-cm polyester mesh to form the
top of the bag and 1-mm fiberglass mesh on the bottom. The larger top mesh allowed for the free
movement of invertebrates into the litter bags, and also reduced potential changes in
microclimate created by the litterbags (Bradford et al. 2002). To quantify the active microbial
community that relied on the litter inside the litterbags, 20 g of 13
C-enriched aspen litter (Populus
tremuloides) was placed in each litterbag, representing new litter entering forest floor. We used
aspen to produce 13
C-enriched leaf litter, because sugar maple, the dominant species in our sites,
is a slow growing species that would not produce sufficient quantities of leaf litter for this
experiment. The 13
C-enriched aspen litter was produced by pulse labeling propagated ramets of
one aspen genotype. Labeling was conducted in a field chamber during the 2008 growing season,
and naturally senesced and abscised leaves were collected during autumn. The labeling chamber
was similar to that used by Mikan et al. (2000).
The constructed litterbags were transferred into the field in individual plastic bags. In
total, 96 litterbags with aspen litter were placed in plots receiving ambient (n = 3) and
experimental N deposition (n = 3) in site B during June 2009. In addition, 16 empty litter bags
were placed on the forest floor to control for any external litter input to the litterbags. The Oi
horizon was first removed, and the litterbags were secured to the top of the Oe horizon with steel
pins; the original Oi horizon was then placed on top of each bag. Three supplementary litterbags
were placed in the forest floor, as described above, but were immediately retrieved to estimate
any loss during transportation.
Four litterbags from each plot were collected 2, 4, 12 and 16 months after placement in
the field. Four empty litterbags were also collected on each date to estimate the mass of any
external litter that had infiltrated litterbags. On each collection date, litterbags were placed in

86
separate plastic bags in coolers and transported to the laboratory within 24 hours. In addition,
one soil core sample (5 cm diameter x 5 cm depth) underneath each litterbag was collected.
Moreover, one forest floor sample outside the litterbags was collected from each plot. Both the
soil and litter samples that were collected from outside the litterbags served as paired controls
when comparing the microbial community inside bags (see PLFA analysis below).
In the lab, the litterbags were cut open after the outside was carefully brushed, and any
roots that had penetrated the litterbags were removed. The litter was then thoroughly
homogenized. Approximately 75% of the field-moist litter was placed in modified Tullgren
funnels to extract microarthropods (into 70% ethanol) over 5 days. The remaining litter was
freeze-dried for phospholipid fatty acid (PLFA) analysis. The extracted microarthropods were
sorted into three major groups including Mesostigmata, Collembola and Oribatid mites;
individuals were enumerated under a dissecting microscope and oribatid mites were further
identified to species.
After microarthropod extraction, litter was oven dried at 60 oC and weighed to determine
moisture content. The oven-dried litter was further ground into powder and combusted at 500 °C
to measure the ash-free dry mass. Five subsamples of the original litter were also combusted to
determine the ash-free dry mass of the litter used in the beginning of the experiment. Litter mass
loss during the field incubation was corrected for ash content, and mass loss values were
expressed on an oven-dry, ash-free basis.
PLFA analysis
Phospholipids fatty acids (PLFAs) were extracted from the contents of each litterbag to
determine microbial community composition, biomass and 13
C content. Approximately 25% of
the field-fresh litter from each litterbag was freeze-dried within 24 hours of collection. The litter
87
samples on the forest floors outside the litterbags and the soil samples underneath the litterbags
were also freeze-dried. About 1 g of freeze-dried litter (or 5 g of soil sample) was subjected to a
solution containing 10 mL of CH3OH, 5 mL of CH3Cl, and 4 mL of PO4−3
buffer to extract total
lipids (White et al. 1979). A 21:0 internal standard (5 pmol) was added to each sample at the
beginning of the extraction to determine the extraction efficiency. The extracted PLFAs were
then separated by silicic acid chromatography. Isolated polar lipids were further subjected to an
alkaline CHCl3-CH3OH solution to form fatty-acid methyl esters (FAMEs; Guckert et al. 1985).
Fatty-acid methyl esters were separated using gas chromatography and quantified using a
Finnigan Delta plus mass spectrometer with a GC/C III interface (Thermofinnigan, Bremen,
Germany). Alongside the samples, a standard solution containing five common FAMEs (14:0,
i15:0, 15:0, cy19:0, 18:1w7t) of known concentrations were analyzed after every fifth sample for
quality assurance purposes. The concentration of sample FAMEs was determined by a regression
equation based on the standard FAMEs.
A total of 20 PLFA biomarkers were identified and grouped to bacteria, Actinobacteria
and fungi. The total PLFA abundance (nmol/g litter), after adjustment for extraction efficiency
and extracted litter weight, was used as an indication of total viable microbial biomass. The
12C/
13C ratio for each FAME was used to calculate the
13C content of each group (ug
13C / g
litter), which was used to quantify the newly acquired C from the 13
C-enriched aspen litter.
Data analysis
The density of microarthropod groups in forest floor was calculated in two ways: the first
method combined the abundance of 6 subsamples within each plot and divided the sum by the
total collected area (individuals/m2); The second method employed the sum of the abundance
within each plot divided by the total dried weight of the 6 subsamples (individuals/g dried litter).

88
We also calculated the density-by-area abundance for the microarthropod groups inside the
litterbags based on the area of the litterbag (0.04 m2) and the total dried weight of litter inside.
Because the results from these two methods were highly correlated with each other, we present
only the results of analyses of density-by-area data.
To test how experimental N deposition influenced the microarthropod community in the
forest floor, we first used a Student’s t-test (unpaired) to analyze the first survey data (site B
only). Three-way ANOVA (site, N treatment and taxon group) was used to analyze the density
data from the second survey (all four sites). The species richness of the oribatid community was
assessed using individual-based rarefaction curves and the 95% confidence zone was used to
detect any difference between the N deposition treatments.
The species composition of the oribatid mite communities was represented in a
community matrix using three different indices: relative abundance was calculated as the
percentage of each species within each plot; presence or absence was the binary conversion from
the raw abundance data; incidence of each species was the frequency of finding that species in 6
sub-samples of that plot. The use of incidence data was to scale the original data to 0 (absence)
to 6 (occurred in all 6 sub-samples) to prevent bias of the dominant species or the rare species.
Bray-Curtis dissimilarity was calculated for above three community matrices, which were
then subjected to non-metric Multidimensional Scaling (nMDS) to visualize any differences in
the species composition of oribatid mite communities (Kruskal and Wish 1978; Minchin 1987).
To explore relationships between the compositional trends revealed by ordination and different N
deposition treatments, we fitted the N deposition levels (ambient = 10 Kg N ha-1
yr-1
, elevated =
40 Kg N ha-1
yr-1
) to the nMDS space by rotational correlation (Dargie 1984), which is similar to
a multiple linear regression of the environmental variables on the set of ordination axes.
89
Statistical differences in community structure were also assessed using Permutational
Multivariate Analysis of Variance (PerMANOVA, Anderson 2001). As the three different
community matrices yielded similar results for the above multivariate analysis, only the results
from the incidence data are shown in the result section.
For the litterbag experiment, repeated measures ANOVA was used to explore the effects
of collection date and N deposition treatment on microarthropod density and the microbial PLFA
composition inside the litterbags. nMDS was used to visualize the species composition of
oribatid communities in the litterbags using the incidence data mentioned above; statistical
differences in community composition were assessed by PerMANOVA.
The remaining mass in the litterbags was scaled to percentage of the initial weight, and
then fitted to a first order exponential decay equation (At= e-kt
) with At as the remaining mass at
time t (Jenny et al. 1949). The decay constant k was estimated to represent the decay rate for
each plot. Student’s t test was used to compare the difference in decay rate of litterbags under
different N deposition treatments.
Repeated measures ANOVA was performed on IBM SPSS Statistics 19. The species
rarefaction curves were generated using EstimateS. Multivariate analysis including nMDS and
PerMANOVA were performed in package VEGAN in R 2.15.1 (R Development Core Team
2012).
Results
Microarthropod surveys
The initial survey in site B (June 2009) revealed that the density of all three microarthropod
groups was reduced by experimental N deposition. Oribatid mite density declined from 9722 ±
442 (mean ± 1 SD) individuals/m2 under ambient N deposition to 3833 ± 1551 individuals/m
2

90
under experimental N deposition (P = 0.017); this represented a 60% decline in density.
Similarly, Collembola density under experimental N deposition (406 ± 200 individuals/m2) was
only 34% of that under the ambient treatment (1989 ± 362 individuals/m2; P = 0.044). Finally,
the density of Mesostigmata declined from 1289 ± 164 individuals/m2 under ambient N
deposition to 733 ± 116 individuals/m2 under experimental N deposition (P = 0.011).
For the second survey in May 2011, three-way ANOVA revealed that all three
microarthropods groups responded similarly to experimental N addition across all four study
sites (Table 4.1; Fig. 4. 2). Consistent with the results from the first survey, experimental N
deposition reduced the overall density of microarthropods by 44% across four sites (Fig. 4.2). At
the same time, the abundance of Mesostigmata was related positively with the abundance of
Collembola and oribatid mites (R2 = 0.39, P < 0.01). Despite the decline in overall density of
microarthropods under experimental N deposition, the species richness of the oribatid
community was comparable between N deposition treatments (Fig. 4.3), with the number of
species slightly lower under experimental N deposition (51 species) compared to that in the
ambient treatment (61 species).
However, different oribatid species responded differently to experimental N deposition,
resulting in a change in the community composition (Table 4.2, PerMANOVA, P = 0.01). As
seen in the nMDS ordination space in Fig. 4.4, oribatid communities from different sites were
distinctly different along axis I (PerMANOVA, P < 0.001). At the same time, communities
under experimental N deposition all clustered lower on axis II, suggesting that experimental N
deposition was causing similar changes in species composition (Table 4.2, site x treatment P =
0.514). In addition, fitting the N deposition levels to the ordination space indicates that the
elevated N deposition level is associated with mite communities represented at the lower end of

91
axis II (Fig. 4.4, R2 = 0.309, P =0.022). Oribatid species that were only found (e.g., Atropacarus
striculus, Hypochthoninus rufulus, and Platynothrus peltifer ) or more abundant (e.g., Fuscozetes
fuscipes) under experimental N deposition have relatively low scores on axis II. In contrast,
species with high scores on axis II are those only present (e.g., Epidamaeus spp.,
Ommatocepheus sp. and Pilogalumna sp.) or more abundant (e.g., Tectocepheus velatus) under
ambient deposition. A list of species with their nMDS scores and their association with the N
treatments can be found in the supporting material Table A1.
Litterbag results
Aspen litter decayed rapidly, with an average of 17% of initial mass remaining after 16 months.
Comparison of the decay constant k indicated that there was no difference between mass loss
rates of litter under ambient and experimental N deposition (Fig. 4.5, P = 0.434).
Similar to the results from the forest floor, the density of microarthropods in the litterbags
was lower under experimental N deposition (Fig. 4.6, treatment effect: P = 0.014). The
populations also varied among the retrieval dates (Table 4.1, time effect P < 0.001), wherein
oribatid mite densities were greater during the two summer collection dates (August 2009 and
June 2010), whereas Mesostigmata and Collembola densities declined through time (Fig. 4.6,
time x taxon interaction; P = 0.016). There was a positive relationship between the densities of
Mesostigmata and Collembola, even after accounting for the time effect (partial regression, time
as covariate; R2 = 0.51, P = 0.021). Although the number of oribatid species in the litterbags was
similar between N deposition treatments (Fig. 4.3), oribatid community composition varied
between N deposition treatments (Table 4.2, PerMANOVA treatment effect P = 0.001).
PLFA analyses

92
Total microbial biomass (represented by total PLFA abundance) in the forest floor outside the
litterbags and in the soil underneath the litterbags was very similar among 4 retrieval dates and
did not differ between the ambient and experimental N deposition treatments (Appendix Fig.
A4.1). Similarly, the total microbial biomass inside the litterbags did not differ between the
ambient and experimental N deposition treatments (Fig. 4.7a) although the total biomass was
slightly lower in the second year (time effect, P = 0.027).
Overall, the microbial PLFAs inside the litterbags were highly enriched by 13
C, compared
to those outside the litterbags. The average ratio of 13
C/ 12
C of PLFA on the forest floor was
0.012, whereas this ratio inside the litterbags averaged at 0.035. While the total microbial PLFAs
were similar, the lower 13
C/ 12
C ratio led to a significantly lower 13
C content of microbial PLFAs
under experimental N (Fig. 4.7b, P = 0.03); and all three microbial groups (fungi, Actinobacteria
and Bacteria) responded similarly (taxon x treatment effect, P = 0.259). At the same time, the 13
C
content of the microbial PLFAs declined over time (P < 0.001). Interestingly, the 13
C content of
soil microbes underneath the litterbags did not increase until the last retrieval date, suggesting a
time lag in the mobilization of 13
C labeled aspen litter from the litterbags (Appendix Fig. A4.2).
Discussion
After 17 years of experimental N deposition, the abundance of both detritivores (Oribatida and
Collembola) and predaceous mites (Mesostigmata) has declined in forest floor, suggesting that a
reduction in decay under experimental N deposition has decreased energy flowing through the
soil food web. This finding directly contrasts to previous studies, in which positive effects on soil
fauna have been found under N fertilization. This discrepancy may arise from the fact that those
ecosystems are either young, developing forests (Berch et al. 2006), grasslands (van der Wal et
al. 2009) or heathland (Sjursen et al. 2005), in which enhanced productivity under N deposition

93
has directly increased plant litter production; such an increase would provide additional substrate
for soil fauna, thereby increasing energy available to the soil food web (Berch et al. 2009). In our
study system, net primary productivity has also increased under experimental N deposition, but
has been allocated to stem production, rather than leaf or fine root litter production (Burton et al.
2004, Zak et al. 2011). It appears that equivalent litter production under ambient and
experimental N deposition, combined with reduced decay under experimental N deposition has
decreased the amount of energy available to fuel organisms at high trophic levels in the soil food
web. Our observations, in combination with the studies described above, indicate that changes in
plant litter production and its rate of decay can both be important controls of soil fauna
communities under N deposition.
Consistent with our observations, detrimental effects of anthropogenic N deposition on
soil fauna have been reported from various ecosystems. For example, Eisenhauer et al. (2012)
found that the abundance of predatory nematodes and the species richness of nematodes and
microarthropods were reduced in a long-term (13-year) grassland study under experimental N
deposition. They attributed this decline to decreases in rhizodeposition. Other evidence of the
negative effects of anthropogenic N on soil fauna has been observed in boreal spruce forests
(Lindberg and Bengtsson 2006), lodgepole pine forests (Berch et al. 2006) and subtropical forest
(Xu et al. 2007). However, the amounts of N added in the aforementioned studies were much
higher (≥ 100 kg N ha-1
yr-1
) than those in our experiment (30 kg N ha-1
yr-1
); such high levels of
N could result in soil acidification, base cation depletion and the mobilization of Al3+
, all of
which are detrimental to soil fauna (Matson et al. 2002). Such changes in soil chemistry have not
occurred in our experiment, because soils are newly developed in calcareous glacial drift; soil
pH, salt concentrations, and cations remain unchanged (Zak et al. 2008, Patterson et al. 2012). In

94
contrast, litter decomposition has slowed due to the inhibition of lignolytic activity, resulting in
an accumulation of organic matter in forest floor and surface soil (Pregitzer et al. 2008, Zak et al.
2008). The thickening of forest floor could potentially provide increased living space for soil
fauna; however, declines in their densities suggest that these microarthropods are not limited by
habitat availability. Rather, the positive relationship between the Mesostigmata and their prey
(oribatid mites and Collembola) suggested that the decline in Mesostigmata was due to the
decline in their food resources (oribatid mites and Collembola), which in turns was a bottom up
effect from the inhibition of microbial activity and litter decomposition under long-term
experimental N deposition.
In spite of the decline in overall abundance, we did not observe a change in species
richness of the most abundant group (Oribatida) under experimental N deposition (Fig. 3), which
contrasts with other studies (Eisenhauer et al. 2012). However, it is difficult to compare the
results among studies, because some provide only broad taxonomic resolution (Eisenhauer et al.
2012) and most studies do not quantify sampling effort (i.e., rarefaction analysis), which is
crucial to understand whether the majority of species have been encountered. In our study, we
did observe fewer species under elevated N deposition; however, rarefaction analysis indicates
that species richness should converge between N treatments with additional sampling.
While the total number of oribatid mite species did not differ between the N deposition
treatments, species-specific responses resulted in a shift in community composition (Fig. 4.4).
Overall, there were 16 species absent under experimental N deposition, whereas five species
(Atropacarus striculus, Hypochthoninus rufulus, Platynothrus peltifer and 2 Xylobates spp.)
occurred exclusively under experimental N deposition. Moreover, it should be noted that species
in the same genus can respond differently to experimental N deposition. For instance,

95
Tectocepheus velatus and T. minor are two closely related and morphologically similar species
that are often found in temperate regions (Laumann et al. 2007). T. velatus is dominant in many
ecosystems (Fujikawa 1988, Fujita and Fujiyama 2001), but its relative abundance declined
under experimental N deposition. In contrast, the relative abundance of T. minor increased under
experimental N deposition (Table A4.1). The minor species (T. minor) had also been found to
dominate T.velatus in crop fields, which the authors attributed to the higher migration ability of
T.minor and its ability to utilize different microhabitats (Fujita and Fujiyama 200). In our case,
we are unable to provide an ecological explanation for this response because the autecology of
these species (especially T. minor) is largely unknown. Changes in energy flow or changes in
fungal community composition under experimental N deposition (Edwards et al. 2011) may alter
the competitive ability of mites that have different preferences for fungal species (Mitchell and
Parkinson 1976). We expect that species that rely more on fungal hyphae in their diets will be
more negatively affected by N deposition than those that rely more on detritus or other food
items. Indeed, the accumulation of organic matter on the forest floors may even benefit species
that feed predominantly on litter. Consistent with this expectation, many of the species
detrimentally affected by experimental N deposition (Table A 4.1), including species in the
genera Epidamaeus (Kaneko 1988), Eremaeus (Mitchell and Parkinson 1976), Carabodes
(Schneider et al. 2004), and Galumna (Neena and Haq 1989) feed predominantly on fungal
hyphae (Luxton 1972). On the other hand, the three species that only occurred under
experimental N deposition rarely feed on fungi. For example, A. striculus and P. peltifer are
primary decomposers which feed predominantly on litter, an insight derived from their 15
N/14
N
natural abundance (Schneider et al. 2004) and their lack of chitinase to degrade fungal cell walls
(Siepel and De Ruiter Dijkman 1993); H. rufulus has been reported to be an omnivore that feeds

96
mostly on dead animals (Siepel and De Ruiter Dijkman 1993, Schneider et al. 2004). Another
omnivore (F. fuscipes; Wallwork 1958) also increased in its relative abundance under
experimental N deposition.
We expected that reductions in the densities of soil fauna under experimental N
deposition would then reduce subsequent litter decomposition, completing a feedback process
between litter and soil fauna. Our data are in partial support of this prediction. First, presumably
because of their lower densities in natural litter (above), fewer microarthropods colonized our
experimental litterbags under experimental N deposition. Various studies have observed that
microarthropod communities can accelerate the recovery of fungal communities after disturbance
(Maraun et al. 1998a), stimulate extracellular enzyme activity, and increase microbial respiration
(Kaneko et al. 1998, Wickings and Grandy 2011). Such simulating effects may arise because
microarthropods can: (1) fragment litter, exposing more surface area for microbial activity; (2)
disperse fungal spores and hyphae on their body surface; and (3) graze on fungal hyphae and
simulate metabolism of microorganisms (Behan et al. 1978, Lussenhop 1992). Therefore, the
lower densities of microarthropods under experimental N deposition could result in lower
microbial activity that feeds back to reduce litter decay. However, our results provided mixed
evidence for this prediction. While we did observe a lower 13
C content of microbial PLFAs
inside the litterbags, we did not observe any change in total microbial biomass or litter decay rate
in litterbags under elevated N deposition. Typical limitations of litterbag experiments (e.g. no
control over litter fragments that were lost from the bags) may have reduced the statistical power
necessary to detect any difference in decay rates between treatments. Nevertheless, the lower 13
C
contents of microbial PLFAs may suggest that the ability of the microbial community to utilize
new litter was reduced, which may have resulted in part from lower microarthropod activity.

97
That is, reduced litter fragmentation and a lower surface area for microbial attack may have
reduced the amount of litter 13
C assimilated by the saprotrophic microbial community.
Additionally, changes in the oribatid community could potentially alter the composition of the
microbial community by selective feeding (Mitchell and Parkinson 1997; Maraun et al. 1998b)
with consequences for mobilization of 13
C from the litter.
Ecological Implications
By combining field surveys and a litterbag experiment, we have demonstrated that chronic N
deposition has a detrimental effect on a detritus-based food web, which may have diminished the
ability of saprotrophic organisms to metabolize fresh litter. This finding argues that soil food
webs may not be buffered against global change stressors as previously thought (i.e., elevated
CO2, increased temperature etc.). Functional redundancy has been assumed to be a common
feature of soil fauna (Wolters 2001), and it is believed to be the reason why changes in species
composition may have little influence on decomposing litter (Liiri et al. 2002). However, there is
evidence that environmental stress can produce changes in the abundance and activity of soil
fauna with important consequences for nutrient and carbon cycling (Heneghan and Bolger 1996,
Briones et al. 2009). For example, some microarthropod groups failed to recover after intense
agriculture management, leading to slower organic matter decay in abandoned agricultural areas
(Siepel 1991). In our study, the decline in the overall abundance of microarthropods would
presumably reduce litter fragmentation for saprotrophic microorganisms potentially contributing
to the declining rate of belowground C cycling observed in our system. This suggests a possible
feedback mechanism wherein the inhibition of lignolytic activity under experimental N
deposition reduces the energy entering the detritus-based food web that detrimentally affects the
soil fauna; the decline in soil fauna activity would then feed back to inhibit the ability of

98
microorganisms to decompose new litter. Our results suggest that future rates of atmospheric N
deposition could alter the composition and function of soil food webs, wherein the slowing of
microbial decay initiates a cascading negative effect on higher tropic levels culminating in the
greater storage of C in soil organic matter.

99
Acknowledgements
This chapter was coauthored with Don R. Zak and Mark D. Hunter and is accepted for
publication (in print) in Ecological Applications. The authors would like to thank Kurt Pregitzer
and Andrew Burton contributed substantially to our work through their long-term dedication to
the design and maintenance of the study sites, as part of a long term field-based N deposition
experiment. This work was supported by grants from the US National Science Foundation and
the US Department of Energy, Division of Environmental Biology.

100
Table 4.1. Analysis of Variance (ANOVA) of the density of microarthropods in the forest floors
and in the litterbags.
Source of variation Df
Sum of
Squares F value P
Forest floors
Site 3 2.13 8.29 < 0.001
Taxon 2 16.81 98.04 < 0.001
Treatment 1 0.8 9.38 0.004
Site x Taxon 6 3.52 6.84 <0.001
Site x Treatment 3 0.38 1.48 0.233
Taxon x Treatment 2 0.24 1.38 0.262
Site x Treatment x Taxon 6 0.16 0.32 0.926
Residuals 48 4.12
Litterbags
Time 3 11.84 27.6 <0.001
Taxon 2 5.09 9.25 0.004
Treatment 1 2.27 8.23 0.014
Time x Taxon 6 2.61 3.05 0.016
Time x Treatment 3 1.96 4.57 0.008
Taxon x Treatment 2 0.05 0.03 0.913
Time x Taxon x Treatment 6 0.28 0.33 0.919
Note: The forest floor data were pooled from four study sites, and the litterbag data were
pooled from four retrieval dates. Three-way ANOVA for forest floor data included site (n
= 4), N treatment (n = 2) and taxon group (n = 3). Litterbag data were analyzed using
repeated measures ANOVA, with taxon group and N treatment as between subject
factors. Densities were calculated as the number of individuals per unit area and were
log-transformed before analysis.

101
Table 4.2. PerMANOVA analysis of the species composition of oribatid mite communities on the
forest floor or inside litterbags.
Source of variation Df
Sum Of
Squares F value R2 P
Forest floor
Treatment 1 0.19 2.40 0.07 0.010
Site 3 1.22 5.13 0.42 < 0.001
Treatment x Site 3 0.23 0.97 0.08 0.514
Residuals 16 1.27 0.44
Total 23 2.92
Litterbag
Treatment 1 0.54 3.13 0.11 0.001
Time 1 0.69 4.01 0.14 < 0.001
Treatment x Time 1 0.27 1.55 0.05 0.140
Residuals 20 3.45 0.70
Total 23 4.94 Note: The incidence of the species, calculated as the frequency of encountering that species in the
six subsamples within each plot, was used in the community matrix. The forest floors data were
from the second microarthropod survey across four sites; the litterbags data were pooled from
four retrieval dates. For PerMANOVA analysis, Bray-Curtis index was used and permutation
times = 2000.

102
Figure 4.1. Map of four study sites in the Great Lake region in North America.
CC

103
Figure 4.2. Three-way ANOVA indicated that the abundance of Oribatida, Mesostigmata and
Collembola in the forest floors was significantly lower under experimental elevated N deposition
(P = 0.004). Density data were averaged across four study sites.
0
1000
2000
3000
4000
5000
6000
7000
8000 A
bu
nd
an
ce (
Ind
ivid
ua
ls /
m2
)
Oribatid Collembola Mesostigmata
Ambient
Elevated

104
Figure 4.3. The rarefaction curves of oribatid mite communities in the forest floors (a) and inside
the litterbags (b). The forest floor data were pooled from four study sites, and the litterbag data
were pooled from four retrieval dates. The solid lines are the 95% confidence zones for the
rarefaction curve of ambient plots; the dashed lines are 95% confidence zones for the rarefaction
curve of elevated N deposition plots. Replicate times = 500.
0
5
10
15
20
25
30
35
40
0 500 1000 1500 2000
Ob
served
sp
ecie
s ric
hn
ess
Individuals
Ambient
Elevated
(a) Litterbag
0
20
40
60
80
0 1000 2000 3000 4000 5000
Ob
erse
rved
sp
ecie
s ric
hn
ess
Individuals
Ambient
Elevated
(b) Forest floor
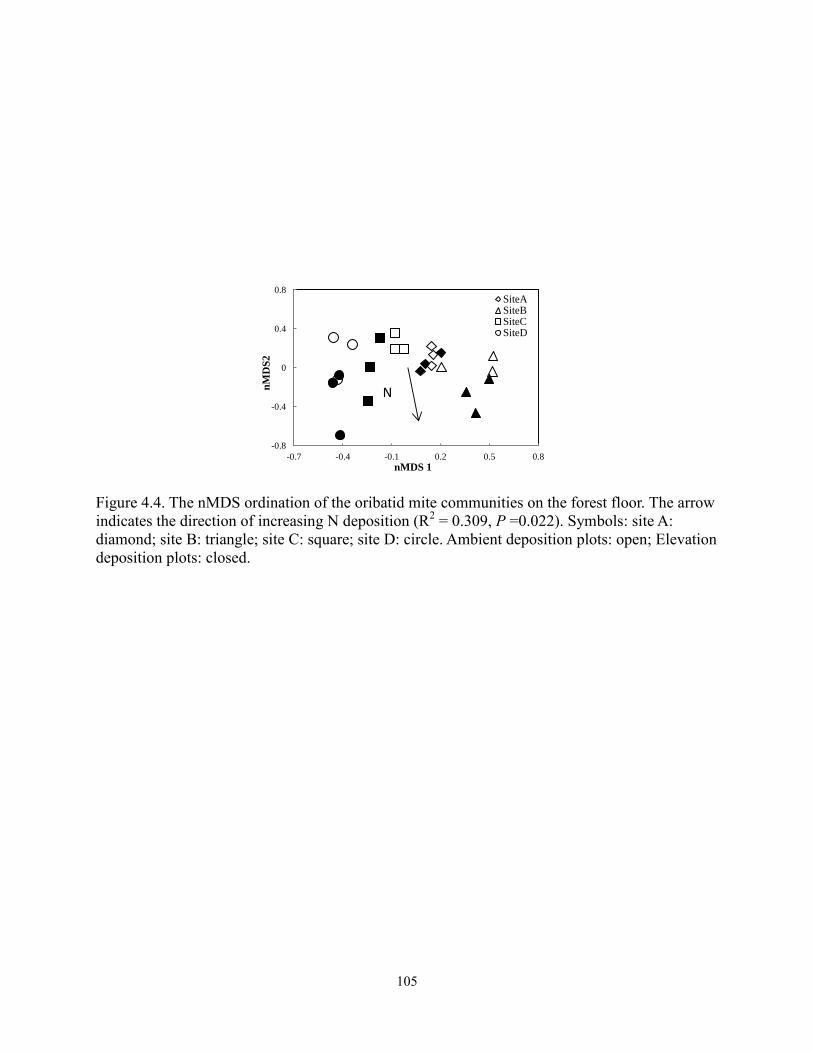
105
Figure 4.4. The nMDS ordination of the oribatid mite communities on the forest floor. The arrow
indicates the direction of increasing N deposition (R2 = 0.309, P =0.022). Symbols: site A:
diamond; site B: triangle; site C: square; site D: circle. Ambient deposition plots: open; Elevation
deposition plots: closed.
-0.8
-0.4
0
0.4
0.8
-0.7 -0.4 -0.1 0.2 0.5 0.8
nM
DS
2
nMDS 1
SiteASiteBSiteCSiteD
N

106
Figure 4.5. The mass loss rates of aspen litter inside the litterbags did not differ between the
ambient plots and the elevated N deposition plots (P = 0.434). The lines are best fit to the first
order exponential decay equation on the average of the ambient deposition (open, dashed lines)
and the elevated treatment (closed, solid lines).
0
20
40
60
80
100
120
0 5 10 15 20
Rem
ain
ing
ma
ss (
%)
Months
Ambient ElevatedExpon. (Plot 6) Expon. (Elevated)

107
Figure 4.6. The abundance of microarthropods including Oribatida (a), Collembola (b) and
Mesostigmata (c) inside the litterbags. Repeated measures ANOVA indicated a decrease in their
density in litterbags under elevated N deposition (treatment effect, P = 0.014).
0
1000
2000
3000
4000
5000(a) Oribatida Ambient
Elevated
0
1000
2000
3000
4000(b) Collembola
0
1000
2000
3000
4000
2 months 4 months 12 months 16 moths
(c) Mesostigmata
Den
sity
(In
div
idu
als
/ m
2
)

108
Figure 4.7. Total C (a) and
13C content (b) of microbial PLFAs inside the litterbags. While the
total microbial biomass did not differ between the N treatments (a, P = 0.56), the 13
C content
declined over time (P < 0.001) and was consistently lower in the N deposition treatment (b, P =
0.03).
0
50
100
150
200
250
300
350
400
Ambient
Elevated
0
2
4
6
8
10
12
14
2 months 4 months 12 months 16months
(b) 13C
(a) Total C
Mic
rob
ial
PL
FA
(n
mo
l /
g l
itte
r)

109
Appendix
Table A4.1. Species scores from nMDS analysis using the incidence data of oribatid mite
communities.
Species nMDS1 nMDS2 Presence
Ommatocepheus sp. -0.03 0.90 A
Pilogalumna sp. -0.15 0.74 A/E
Epidamaeus sp2 -0.85 0.67 A/E
Xylobates sp1 -0.85 0.67 A
Adrodamaeus sp. -0.85 0.60 A
Eremulus sp. -0.85 0.60 A
Oribatella sp2 -0.23 0.59 A/E
Parachipteria sp. -0.02 0.58 A/E
Epidamaeus longitarsalis -0.58 0.46 A/E
Peloribates sp. -0.08 0.41 A/E
Tectocepheus velatus 0.07 0.37 A/E
Provertex sp. -0.23 0.36 A
Carabodes polyporetes -0.05 0.35 A/E
Eueremaeus nemoralis -0.39 0.34 A/E
Epidamaeus longiseta -0.39 0.33 A
Epidamaeus bakeri 0.02 0.28 A/E
Galumna sp1 0.59 0.27 A
Fosseremus americanus 0.59 0.25 A/E
Carabodes sp1 0.36 0.23 A
Galumna sp2 -0.95 0.22 A/E
Suctobelbella sp1 0.20 0.17 A/E
Eremaeus translamellatus 0.70 0.17 A
Euphthiracarus sp1 -0.27 0.16 A
Heminothrus sp. 0.00 0.15 A/E
Autogneta sp. -0.20 0.13 A/E
Chamobates cuspidatus 0.20 0.12 A/E
Oribatula tibialis 0.07 0.12 A/E
Pyroppia sp1 0.93 0.11 A
Suctobelbella sp2 -0.01 0.10 A/E
Cultroribula sp. 0.65 0.05 A/E
Archiphthiracarus sp. 0.10 0.05 A/E
Anachipteria howardi 0.28 0.04 A/E
Rhysotritia ardua -0.10 0.04 A/E
Xylobates oblongus -0.04 0.04 A/E
Oppia nova -0.14 0.03 A/E
Cepheus cepheiformis 0.96 0.01 A

110
Euphthiracarus sp2 -0.90 0.01 A
Xylobates prionotus -0.90 0.01 A
Oribatella calcarata 0.00 0.00 A/E
Podopterotegaeus sp. 0.52 -0.01 A/E
Protokalumna sp. -0.72 -0.02 A/E
Scheloribates pallidulus -0.10 -0.02 A/E
Parapyroppia monodactyla 0.56 -0.03 A/E
Allosuctobelba sp. 0.07 -0.03 A/E
Graptoppia foveolata -0.14 -0.03 A/E
Multioppia sp. -0.20 -0.04 A/E
Lepidozetes singularis 0.03 -0.06 A/E
Nothrus silvestris -0.01 -0.07 A/E
Eniochthonius crosbyi 0.31 -0.08 A/E
Archoplophora sp. 0.61 -0.09 A/E
Epidamaeus sp1 0.39 -0.14 A/E
Achipteria sp. 0.88 -0.15 A/E
Xylobates sp3 0.07 -0.16 E
Pergalumina sp. 0.32 -0.17 A/E
Eremobelba sp. 0.17 -0.18 A/E
Siculobata sp. 0.86 -0.25 A/E
Phthiracarus sp. 0.16 -0.26 A/E
Tectocepheus minor 0.46 -0.27 A/E
Ceratozetes gracilis 0.36 -0.31 A/E
Oppia nitens 0.35 -0.33 A/E
Platynothrus peltifer 0.07 -0.38 E
Nothrus sp1 0.08 -0.41 A
Fuscozetes fuscipes 0.79 -0.44 A/E
Hoplophorella sp. 0.13 -0.51 A
Atropacarus striculus 0.68 -0.54 E
Hypochthoninus rufulus 0.73 -0.99 E
Xylobates sp2. 0.70 -1.21 E
Note: The table was sorted by the axis II score. Species with a high axis II scores are
more likely to be found in ambient plots; species with more negative axis II scores are
more likely to be found in the experimental N deposition plots. A: species present in
ambient deposition plots; E: Species present in elevated deposition plots.

111
Figure A4.1: Total biomass of microbial PLFAs outside litterbags on the forest floor (a) and in
the soil underneath the litterbags (b) did not change over time (P > 0.1) or under experimentally
elevated N deposition (P > 0.1).
0
50
100
150
200
250
300
350
400
Ambient
Elevated
0
5
10
15
20
25
30
35
2 months 4 months 12 months 16 months
(b) Soil
(a) Forest floor
Tota
l m
icro
bia
l P
LF
A (
nm
ol
/ g)

112
Figure A4.2: The
13C content of soil microbial PLFAs underneath the litterbags increased greatly
by the last retrieval date (P < 0.001) but did not differ between N deposition treatments (P =
0.57).
0
1
2
3
4
5
Soil
P
LF
A
13C
(n
mol/
g s
oil
)
2 month 4 months 12 months 16 months
Ambient
Elevated

113
Literature Cited
Anderson, M. 2001. A new method for non-parametric multivariate analysis of variance. Austral
Ecology 26:32–46
Behan, V. M., S. B. Hill, and D. K. M. Kevan. 1978. Effects of nitrogen fertilizers, as urea, on
Acarina and other arthropods in Quebec black spruce humus. Pedobiologia 18:249-263.
Berch, S. M., R. P. Brockley, J. Battigelli, and S. Hagerman. 2009. Impacts of repeated
fertilization on fine roots, mycorrhizas, mesofauna, and soil chemistry under young
interior spruce in central British Columbia. Canadian Journal of Forest Research-Revue
Canadienne De Recherche Forestiere 39:889-896.
Berch, S. M., R. P. Brockley, J. P. Battigelli, S. Hagerman, and B. Holl. 2006. Impacts of
repeated fertilization on components of the soil biota under a young lodgepole pine stand
in the interior of British Columbia. Canadian Journal of Forest Research-Revue
Canadienne De Recherche Forestiere 36:1415-1426.
Blankinship, J. C., P. A. Niklaus, and B. A. Hungate. 2011. A meta-analysis of responses of soil
biota to global change. Oecologia 165:553-565.
Boxman, A. W., K. Blanck, T. E. Brandrud, B. A. Emmett, P. Gundersen, R. F. Hogervorst, O. J.
Kjonaas, H. Persson, and V. Timmermann. 1998. Vegetation and soil biota response to
experimentally-changed nitrogen inputs in coniferous forest ecosystems of the NITREX
project. Forest Ecology and Management 101:65-79.
Bradford, M. A., G. M. Tordoff, T. Eggers, T. H. Jones, and J. E. Newington. 2002. Microbiota,
fauna, and mesh size interactions in litter decomposition. Oikos 99:317-323.
Briones, M. J. I., N. J. Ostle, N. P. McNamara, and J. Poskitt. 2009. Functional shifts of
grassland soil communities in response to soil warming. Soil Biology and Biochemistry
41:315-322.
Burton, A.J., C.W. Ramm, D.D. Reed and K.S. Pregitzer. 1991. Use of multivariate methods in
forest research site selection. Canadian Journal of Forest Research 21:1573-1580.
Burton, A. J., K. S. Pregitzer, J. N. Crawford, G. P. Zogg, and D. R. Zak. 2004. Simulated
chronic NO3- deposition reduces soil respiration in northern hardwood forests. Global
Change Biology 10:1080-1091.
Carreiro, M. M., R. L. Sinsabaugh, D. A. Repert, and D. F. Parkhurst. 2000. Microbial enzyme
shifts explain litter decay responses to simulated nitrogen deposition. Ecology 81:2359-
2365.
Chapin, F. S., O. E. Sala, I. C. Burke, J. P. Grime, D. U. Hooper, W. K. Lauenroth, A. Lombard,
H. A. Mooney, A. R. Mosier, S. Naeem, S. W. Pacala, J. Roy, W. L. Steffen, and D.
Tilman. 1998. Ecosystem consequences of changing biodiversity: experimental evidence
and a research agenda for the future. Bioscience 48:45-52.
Coleman, D. C., D. A. Crossley, and P. F. Hendrix. 2004. Fundamentals of soil ecology. Elsevier
Academic Press.
Crossley, D. A. and J. M. Blair. 1991. A high-efficiency, low-technology Tullgren-type extractor
for soil microarthropods. Agriculture Ecosystems & Environment 34:187-192.
Dargie, T. C. D. 1984. On the integrated interpretation of indirect site ordinations: a case study
using semi-arid vegetation in southeastern Spain. Vegetatio 55: 37-55.
Diaz, S., J. Fargione, F. S. Chapin, and D. Tilman. 2006. Biodiversity loss threatens human well-
being. PLos Biology 4:1300-1305.
DeForest, J.L., D. R. Zak, K. S. Pregitzer, and A. J. Burton. 2004. Atmospheric nitrate
deposition, microbial community composition, and enzyme activity in northern hardwood
114
forests. Soil Science Society of America Journal 68: 132-138.
Edwards, I. P., D. R. Zak, H. Kellner, S. D. Eisenlord, and K. S. Pregitzer. 2011. Simulated
atmospheric N deposition alters fungal community composition and suppresses
ligninolytic gene expression in a northern hardwood forest. PlosOne 6.
Eisenhauer, N., S. Cesarz, R. Koller, K. Worm, and P. B. Reich. 2012. Global change
belowground: impacts of elevated CO2, nitrogen, and summer drought on soil food webs
and biodiversity. Global Change Biology 18:435-447.
Frey, S. D., M. Knorr, J. L. Parrent, and R. T. Simpson. 2004. Chronic nitrogen enrichment
affects the structure and function of the soil microbial community in temperate hardwood
and pine forests. Forest Ecology and Management 196:159-171.
Fujikawa, T. 1988. Biology of Tectocepheus velatus (Michael) and Tectocepheus cuspidentatus
Knulle. Acarologia 29:307-315.
Fujita, M. and S. Fujiyama. 2001. How can the minor species, Tectocepheus minor (Oribatida),
dominate T. velatus in a no-tillage crop field? Pedobiologia 45:36-45.
Galloway, J. N., F. J. Dentener, D. G. Capone, E. W. Boyer, R. W. Howarth, S. P. Seitzinger, G. P.
Asner, C. C. Cleveland, P. A. Green, E. A. Holland, D. M. Karl, A. F. Michaels, J. H.
Porter, A. R. Townsend, and C. J. Vorosmarty. 2004. Nitrogen cycles: past, present, and
future. Biogeochemistry 70:151-226.
Hassall, M., S. Adl, M. Berg, B. Griffiths, and S. Scheu. 2006. Soil fauna-microbe interactions:
towards a conceptual framework for research. European Journal of Soil Biology 42:S54-
S60.
Heneghan, L. and T. Bolger. 1996. Effect of components of 'acid rain' on the contribution of soil
microarthropods to ecosystem function. Journal of Applied Ecology 33:1329-1344.
Hogberg, M. N., M. J. I. Briones, S. G. Keel, D. B. Metcalfe, C. Campbell, A. J. Midwood, B.
Thornton, V. Hurry, S. Linder, T. Nasholm, and P. Hogberg. 2010. Quantification of
effects of season and nitrogen supply on tree below-ground carbon transfer to
ectomycorrhizal fungi and other soil organisms in a boreal pine forest. New Phytologist
187:485-493.
Hughes, L. 2000. Biological consequences of global warming: is the signal already apparent?
Trends in Ecology & Evolution 15:56-61.
Hunt, H. W. and D. H. Wall. 2002. Modelling the effects of loss of soil biodiversity on ecosystem
function. Global Change Biology 8:33-50.
Jenny, H., P. Gessels, and T. Bingmamf. 1949. Comparative study of decomposition rates in
temperate and tropical regions. Soil Sci. 68: 419-432.
Kaneko, N. 1988. Feeding habits and cheliceral size of oribatid mites in cool temperate forest
soils in Japan. Rev. Ecol. Biol. Soil 25:353-363.
Kaneko, N., M. A. McLean, and D. Parkinson. 1998. Do mites and Collembola affect pine litter
fungal biomass and microbial respiration? Applied Soil Ecology 9:209-213.
Knorr, M., S. D. Frey, and P. S. Curtis. 2005. Nitrogen additions and litter decomposition: A
meta-analysis. Ecology 86:3252-3257.
Kruskal, J. B., and M. Wish. 1978. Multidimensional scaling. Sage Publications, Beverly Hills,
California, USA.
Laumann, M., R. A. Norton, G. Weigmann, S. Scheu, M. Maraun, and M. Heethoff. 2007.
Speciation in the parthenogenetic oribatid mite genus Tectocepheus (Acari, Oribatida) as
indicated by molecular phylogeny. Pedobiologia 51:111-122.
Liiri, M., H. Setala, J. Haimi, T. Pennanen, and H. Fritze. 2002. Relationship between soil

115
microarthropod species diversity and plant growth does not change when the system is
disturbed. Oikos 96:137-149.
Lindberg, N. and J. Bengtsson. 2006. Recovery of forest soil fauna diversity and composition
after repeated summer droughts. Oikos 114:494-506.
Lussenhop, J. 1992. Mechanisms of microarthropod microbial interactions in soil. Advances in
Ecological Research 23:1-33.
Luxton, M. 1972. Studies on oribatid mites of a Danish beech wood soil .I. Nutritional biology.
Pedobiologia 12:434-463.
Magnani, F., M. Mencuccini, M. Borghetti, P. Berbigier, F. Berninger, S. Delzon, A. Grelle, P.
Hari, P. G. Jarvis, P. Kolari, A. S. Kowalski, H. Lankreijer, B. E. Law, A. Lindroth, D.
Loustau, G. Manca, J. B. Moncrieff, M. Rayment, V. Tedeschi, R. Valentini, and J. Grace.
2007. The human footprint in the carbon cycle of temperate and boreal forests. Nature
447:848-850.
Maraun, M., S. Visser, and S. Scheu. 1998a. Oribatid mites enhance the recovery of the
microbial community after a strong disturbance. Applied Soil Ecology 9:175-181.
Maraun, M., S. Visser, and S. Scheu. 1998b. Selection of microfungal food by six oribatid mite
species (Oribatida, Acari) from two different beech forest. Pedobiologia 42: 232-240.
Matson, P., K. A. Lohse, and S. J. Hall. 2002. The globalization of nitrogen deposition:
consequences for terrestrial ecosystems. Ambio 31:113-119.
Mikan, C. J., D. R. Zak, M. E. Kubiske, and K. S. Pregitzer. 2000. Combined effects of
atmospheric CO2 and N availability on the belowground carbon and nitrogen dynamics of
aspen mesocosms. Oecologia 124:432-445.
Mitchell, M. J. and D. Parkinson. 1976. Fungal feeding of oribatid mites (Acari:Cryptostigmata)
in an Aspen woodland soil. Ecology 57:302-312.
Moore, J. C., D. E. Walter, and H. W. Hunt. 1988. Arthropod regulation of microbiota and
mesobiota in belowground detrital food webs. Annual Review of Entomology 33:419-
439.
Nadelhoffer, K. J., B. A. Emmett, P. Gundersen, O. J. Kjonaas, C. J. Koopmans, P. Schleppi, A.
Tietema, and R. F. Wright. 1999. Nitrogen deposition makes a minor contribution to
carbon sequestration in temperate forests. Nature 398:145-148.
Neena, P. and M. A. Haq. 1989. Feeding specifity of six species of soil oribatids (Acari:Oribatei).
Pages 503-508 in Channabasavanna, G.P. and C. A. Viraktamath, editors. Progress in
Acarology. Leiden, Brill.
Neher, D., T. Weicht, and M. Barbercheck. 2012. Linking invertebrate communities to
decomposition rate and nitrogen availability in pine forest soils. Applied Soil Ecology
54:14-23.
Osler, G. H. R. and M. Sommerkorn. 2007. Toward a complete soil C and N cycle: incorporating
the soil fauna. Ecology 88:1611-1621.
Patterson, S. L., D. R. Zak, A. J. Burton, A. F. Talhelm, and K. S. Pregitzer. 2012. Simulated N
deposition negatively impacts sugar maple regeneration in a northern hardwood
ecosystem. Journal of Applied Ecology 49:155-163.
Pregitzer, K. S., A. J. Burton, D. R. Zak, and A. F. Talhelm. 2008. Simulated chronic nitrogen
deposition increases carbon storage in northern temperate forests. Global Change Biology
14:142-153.
R Development Core Team. 2012. R: A language and environment for statistical computing. R
Foundation for Statistical Computing, Vienna, Austria. ISBN 3-900051-07-0, URL

116
http://www.R-project.org/.
Sackett, T. E., A. T. Classen, and N. J. Sanders. 2010. Linking soil food web structure to above-
and belowground ecosystem processes: a meta-analysis. Oikos 119:1984-1992.
Schneider, K., S. Migge, R. A. Norton, S. Scheu, R. Langel, A. Reineking, and M. Maraun. 2004.
Trophic niche differentiation in soil microarthropods (Oribatida, Acari): evidence from
stable isotope ratios (15
N/14
N). Soil Biology & Biochemistry 36:1769-1774.
Siepel, H. 1991. Nature restoration and the role of the mesofauna in decomposition of organic
matter. Proc. Exper. & Appl. Entomol. 2: 22-27
Siepel, H. and E. M. De Ruiter Dijkman. 1993. Feeding guilds of oribatid mites based on their
carbohydrase activity. Soil Biology & Biochemistry 25:1491-1497.
Sjursen, H., A. Michelsen, and S. Jonasson. 2005. Effects of long-term soil warming and
fertilisation on microarthropod abundances in three sub-arctic ecosystems. Applied Soil
Ecology 30:148-161.
Van der Wal, A., R. H. E. M. Geerts, H. Korevaar, A. J. Schouten, G. A. J. M. J. O. Akkerhuis,
M. Rutgers, and C. Mulder. 2009. Dissimilar response of plant and soil biota
communities to long-term nutrient addition in grasslands. Biology and Fertility of Soils
45:663-667.
Vitousek, P. M., J. D. Aber, R. W. Howarth, G. E. Likens, P. A. Matson, D. W. Schindler, W. H.
Schlesinger, and D. Tilman. 1997. Human alteration of the global nitrogen cycle: sources
and consequences. Ecological Applications 7:737-750.
Vitousek, P. M., S. Porder, B. Z. Houlton, and O. A. Chadwick. 2010. Terrestrial phosphorus
limitation: mechanisms, implications, and nitrogen-phosphorus interactions. Ecological
Applications 20:5-15.
Wallwork, J. A. 1958. Notes on the feeding behaviour of some forest soil acarina. Oikos 9:260-
271.
Walther, G. R., E. Post, P. Convey, A. Menzel, C. Parmesan, T. J. C. Beebee, J. M. Fromentin, O.
Hoegh-Guldberg, and F. Bairlein. 2002. Ecological responses to recent climate change.
Nature 416:389-395.
Wardle, D. A., K. I. Bonner, G. M. Barker, G. W. Yeates, K. S. Nicholson, R. D. Bardgett, R. N.
Watson, and A. Ghani. 1999. Plant removals in perennial grassland: vegetation dynamics,
decomposers, soil biodiversity, and ecosystem properties. Ecological Monographs
69:535–568.
Wickings, K. and A. S. Grandy. 2011. The oribatid mite Scheloribates moestus (Acari: Oribatida)
alters litter chemistry and nutrient cycling during decomposition. Soil Biology and
Biochemistry 43:351-358.
Wolters, V. 2001. Biodiversity of soil animals and its function. European Journal of Soil Biology
37:221-227.
Wolters, V., W. L. Silver, D. E. Bignell, D. C. Coleman, P. Lavelle, W. H. Van der Putten, P. De
Ruiter, J. Rusek, D. H. Wall, D. A. Wardle, L. Brussaard, J. M. Dangerfield, V. K. Brown,
K. E. Giller, D. U. Hooper, O. Sala, J. Tiedje, and J. A. Van Veen. 2000. The effect of
global change on above- and belowground biodiversity in terrestrial ecosystems:
Implications for ecosystem funtioning. Bioscience 50:1089-1098.
Wu, Z. T., P. Dijkstra, G. W. Koch, J. Penuelas, and B. A. Hungate. 2011. Responses of terrestrial
ecosystems to temperature and precipitation change: a meta-analysis of experimental
manipulation. Global Change Biology 17:927-942.
Xu, G. L., J. M. Mo, S. L. Fu, P. Gundersen, G. Y. Zhou, and J. H. Xue. 2007. Response of soil

117
fauna to simulated nitrogen deposition: a nursery experiment in subtropical China.
Journal of Environmental Sciences-China 19:603-609.
Xu, G. L., P. Schleppi, M. H. Li, and S. L. Fu. 2009. Negative responses of Collembola in a
forest soil (Alptal, Switzerland) under experimentally increased N deposition.
Environmental Pollution 157:2030-2036.
Zak, D. R., W. E. Holmes, A. J. Burton, K. S. Pregitzer, and A. F. Talhelm. 2008. Simulated
atmospheric NO3- deposition increases soil organic matter by slowing decomposition.
Ecological Applications 18:2016-2027.
Zak, D. R., K. S. Pregitzer, A. J. Burton, I. P. Edwards, and H. Kellner. 2011. Microbial
responses to a changing environment: implications for the future functioning of terrestrial
ecosystems. Fungal Ecology 4:386-395.

118
Chapter V
The consequences of changes in microarthropod communities under chronic N deposition
for fungal communities and litter decay
Abstract. Chronic N deposition can have detrimental effects on many groups of soil animals,
including microarthropods. However, little is known about whether such changes in soil
microarthropod communities in turn alter ecosystem processes. We hypothesized that declines in
soil microarthropod abundance and changes in their species composition under chronic N
deposition would inhibit plant litter decay by altering fungal communities. To test this
hypothesis, we established 150 microcosms with microarthropods collected from forest floors
under ambient and experimental N deposition in a long-term (>18 years) field study. We
monitored CO2 accumulation during a 96-day incubation and characterized fungal communities
at the end of the study. Overall, decay rate was lower in litter collected from experimental N
deposition plots regardless of microarthropod treatments. In contrast, the total pool of
metabolized C was highest when litter was inoculated with microarthropods of the same origin as
the litter, suggesting that soil microarthropods may have acclimated to changes in microbial
community composition and function under experimental N deposition. Our study also revealed
that fungal communities differed between litters from ambient and experiment N deposition
plots. However, within each litter type, fungal communities also varied with different levels of
microarthropod abundance. This suggests that any changes in the abundance of microarthropods
under global environmental change may feed back to influence fungal communities. Although
changes in fungal communities under different microarthropod treatments did not influence the
119
decay of labile organic matter in our study, changes in the abundance of microarthropods and
subsequent effects on fungal communities may influence the decay of recalcitrant organic matter.

120
Introduction
Soil animal communities are among the most species-rich components of terrestrial ecosystems
(Giller 1996). They represent one of the greatest reservoirs of global biodiversity and fulfill
crucial ecosystem functions in nutrient and carbon cycling (Mikola et al. 2002, Decaens et al.
2008). Numerous studies have demonstrated that soil animals, including protozoa, nematodes,
microarthropods, enchytraeids, millipeds and earthworms etc., typically enhance litter
decomposition as the result of litter comminution and their effects on microbial activities
(Petersen and Luxton 1982, Filser 2002, Huhta 2007, Blouin et al. 2013). However,
accumulating evidences reveals that global changes in climate and land use are affecting
biodiversity of soil animals in many ecosystems (Blankinship et al. 2011, Eisenhauer et al.
2012). Although neutral or positive responses have been observed, many studies have reported a
reduction in the abundance and diversity of soil animals under global warming and intensified
land use (Adl et al. 2006, Briones et al. 2007, Blankinship et al. 2011). Such detrimental effects
on soil animals have aroused concerns that changes in soil animal communities might alter
ecosystem processes (Wolters et al. 2000, Decaens et al. 2008).
Whether the ecosystem functions mediated by soil animals are buffered against global
environmental stressors depends in part on the extent of functional redundancy in soil animal
communities (Bardgett 2002). Because a large number of soil animals appear to be trophically
equivalent, functional redundancy is sometimes thought to be a common feature of soil biota
(Andrén et al. 1995); others have questioned the validity of functional redundancy in the absence
of empirical evidence (Behan-Pelletier and Newton 1999). A growing number of studies have
stressed the importance of key species of soil animal, and overall species composition, rather
than biodiversity per se on ecosystem functioning (Wolters 2001, Bardgett 2002). For example,

121
initial reductions in soil species richness resulting from global change are unlikely to alter C
dynamics, unless particularly influential species are lost (Nielsen et al. 2011). Therefore, changes
in species composition and the subsequent alteration of important species interactions in soil are
likely to be the main biotic control of ecosystem function in response to environmental change
(Bardgett 2002).
Soil microarthropods are among the most important groups of soil animals that form
essential interactions with soil microorganisms and therefore are vital during litter decomposition
(Scheu et al. 2005). Soil microarthropods affect litter decomposition through three processes: (1)
direct litter consumption; (2) litter fragmentation or dispersal of microbial propagules via
physical movement and (3) feeding on microorganisms (Lussenhop 1992). The contribution of
direct litter consumption to litter decay is thought to be trivial, because the metabolic activity of
soil animals is lower than that of saprotrophic bacteria and fungi (Petersen and Luxton 1982). In
contrast, the interaction between microarthropods and microorganisms is believed to have more
profound effects on litter decay (Petersen and Luxton 1982), because selective foraging by soil
animals can alter microbial community composition and subsequently rates of litter decay. This
suggests that any change in microarthropod community elicited by a changing environment is
likely to affect litter decay via their interactions with saprotrophic microbial communities.
Atmospheric nitrogen (N) deposition is a pervasive agent of global change and many
studies have documented that chronic N deposition is detrimental to soil animals especially
microarthropods (Eisenhauer et al. 2012). The negative effects of N deposition on
microarthropods could occur by altering the soil chemical environment such as soil acidification,
base-cation depletion and Al3+
mobilization, all of which are detrimental to soil animals (Matson
et al. 2002). On the other hand, atmospheric N deposition can reduce microbial biomass and

122
inhibit litter decay (Liu and Greaver 2010), which could negatively affect microarthropods
through bottom-up effects (Nielsen et al. 2011). For example, the inhibition of litter decay,
without additional litter input, can decrease the flow of energy through soil food webs, which can
cascaded up to reduce the abundance of microarthropod populations and alter their community
composition (Gan et al. 2013). Moreover, the detrimental effects of chronic N deposition on
microarthropods appear to be widespread across ecosystem types (Lindberg and Persson 2004,
Berch et al. 2006, Xu et al. 2009). However, little is known regarding how declines in
microarthropod abundance and changes in their community composition under N deposition feed
back to influence microbial communities and subsequent litter decay.
In a previous study, we found that a decline in microarthropod abundance in the forest
floors was associated with a reduction in the mobilization of newly-added C into fungal biomass,
which was likely due to reduced litter fragmentation from fewer microarthropods under chronic
N deposition. (Gan et al. 2013). The reduction in litter comminution would reduce the amount of
litter surface exposed for microbial attack, which would ultimately inhibit litter decay. In the
current study, we are interested in other mechanisms by which microarthropods influence litter
decay, especially the interactions between microarthropods and saprotrophic microorganisms. We
focus on fungal communities because two major groups of soil microarthropods, Collembola and
oribatid mites, are believed to rely on fungal hyphae as their main food resource (Maraun et al.
2003). Furthermore, Collembola and oribatid mites appear to be selective feeders, thereby
altering the competitive relationships among fungal species and their community composition
(Maraun et al. 1998, Schneider et al. 2005, Crowther et al. 2011a). We hypothesized that changes
in microarthropod communities under chronic of N deposition would inhibit litter decay by
altering fungal communities. To test this hypothesis, we established microcosms with

123
microarthropods collected from forest floors under ambient and experimental N deposition in a
long-term field study (Zak et al. 2008). We measured enzyme activities, fungal communities and
overall litter decay under different microarthropod treatments. We expected that compared to the
microarthropod community under ambient N deposition, the lower abundance and different
composition of microarthropods under chronic experimental N deposition would alter fungal
community composition resulting in lower enzyme activities and slower litter decay.
Materials and methods
Sites description and microcosms set up
The ecosystem effects of atmospheric N deposition are studied in four forest stands in the Great
Lakes region of North America (Burton et al. 1991). The sites are sugar maple (Acer
saccharum)-dominated and underlain by slightly acid soils (pH 4.41 – 4.70) that are well-drained
sandy typic Haplothords of the Kalkaska series. Within each study site, six 30-m x 30-m plots
were established in 1994; 3 plots receive ambient N deposition and the remaining 3 plots receive
an additional 30 kg NO3--N ha
-1 y
-1. The additional NO3
- is delivered over the growing season in
six equal applications of solid NaNO3 pellets; an additional 10-m wide buffer surrounds each
plot, and it also receives the experimental treatments.
Ten 10-cm x 10-cm forest floor samples (O-horizon) were randomly collected from each
plot receiving ambient and experimental N deposition in one study site (Pellston, MI) in 2011.
Samples from each plot were placed in plastic bags and transported to lab in coolers. Samples
were combined and homogenized within N deposition treatments for use in experiments. A
subsample from each litter composite was frozen at -80 °C for later analysis of the initial fungal
community. A second subsample was stored at 4 °C as intact substrate for later use. The
remaining composited litter was defaunated by microwaving for 5 minutes in an 800-watt

124
microwave, which kills most animals but not necessarily bacteria or fungi (Huhta et al. 1989).
A total of 150 microcosms were constructed using clear Perspex cylinders (6 cm in
diameter and 5 cm in height, U.S. Plastic Corp) with Nytal nylon screen (mesh width 200 um)
attached to the bottom with rubber bands. The microwaved litter from ambient or experimental N
deposition was cut into ~1cm pieces and each type of litter was divided into 70 subsets. Cutting
the litter into small pieces served to minimize any differential effects of litter comminution by
microarthropods among treatments so that we could focus here on direct effects of
microarthropods on microbes. Each litter subset (~3 gram, dried weight) was placed into a
microcosm. In addition, 5 subsets of unmicrowaved litter from ambient and experimental N
deposition were also placed into microcosms. All microcosms were then placed into l-L Mason
jars. A layer of wet paper towel was placed in the bottom of each Mason jar. A plastic cup was
also placed inside the Mason jar as a stand for the microcosm to avoid its direct contact with the
wet paper towel. The mouth of the Mason jar was loosely wrapped by Parafilm. The use of
Parafilm and wet paper towel, which was frequently re-wetted during incubation, was to
maintain 100% humidity inside the Mason jars.
Since microwaving the litter likely killed some groups of microorganisms, we
reintroduced the microbial community by mixing 200 g of unmicrowaved litter (from either
ambient or experimental N deposition, composited separately) with 1000 mL of DI water and
then filtering the suspension through 100 m mesh. The use of this mesh size was to intercept
most of the soil animals while allowing microorganisms and microfauna (protozoa and small
nematodes) to pass through. Four mL of the litter suspension was added to each microcosm,
matching the source of the suspension to the N deposition treatment of the microcosm. In total,
we had 70 microcosms with microwaved litter and a reintroduced microbial community, and 5

125
microcosms with unmicrowaved litter (with its initial microbial and faunal community) for both
ambient and experimental N deposition treatments. The microcosms were placed in a 20 °C
incubator for a week to allow the re-establishment of microbial communities before we
introduced microarthropods.
Microarthropods reintroduction
Additional forest floor samples were collected to harvest microarthropods from the ambient and
experimental N deposition plots. As before, litter was composited and homogenized within
ambient and experimental N deposition treatments. Six grams (wet-weight) of either ambient or
N deposition litter was placed in a modified Tullgren funnel (Crossley and Blair 1991) to directly
extract microarthropods into a single microcosm. The amount of litter for microarthropod
extraction was comparable to that in the microcosm to create a density of microarthropods that
resembled field condition. We used a factorial design such that for each litter type, 30
microcosms with microwaved litter were inoculated with microarthropods from litter under
ambient N deposition and another 30 microcosms were inoculated with microarthropods from
litter from the experimental N deposition treatment. The remaining 10 microcosms with
microwaved litter, and the 5 microcosms with unmicrowaved litter, did not receive added
microarthropods, and served as no-microarthropod controls and intact incubations for each litter
type. The use of intact incubation controls addressed how our manipulation process (defaunation
by microwaving and reintroduction of microbial and microarthropod communities) affected the
results of our experiments.
To characterize the initial microarthropod communities, we extracted an additional 6
subsamples from each litter type; microarthropods were extracted directly into ethanol for later
identification. Additionally, we had previously obtained data on microarthropod communities

126
under ambient and experimental N deposition (18 subsamples from each N treatment) from the
same study site in a previous study (Gan et al. 2013). We combined data from these two
samplings to represent the initial microarthropod communities before introducing them into the
microcosms.
Respiration measurement
We measured respiration in the microcosms beginning 4 days after the reintroduction of the
microarthropods. The CO2 concentrations inside the microcosms were thereafter measured twice
a week during the first 40 days and then once a week for the remaining days for a total of 96
days. On the day before each scheduled measurement date, the Mason jars were removed from
the incubator. Parafilm was removed from the Mason jars for 2 hours to equalize CO2
concentrations with the ambient atmosphere. The Mason jars were then resealed with lids
containing septa for later headspace gas sampling. After 24 hours, the headspace gas (25 mL) of
the sealed Mason jars was removed and analyzed using a gas chromatograph equipped with a
Porapak Q column with a thermal conductivity detector (Trace 2000, Thermo Quest, CA). The
column was maintained at 55 °C during the analysis and He was used as a carrier gas.
After sampling of the headspace gas, the lids of the Mason jars were removed for 2 hours
to equalize CO2 with ambient atmosphere. The jars were then loosely wrapped with Parafilm and
placed back in the incubator until the next measurement date.
Enzyme activities
To characterize enzyme activities during the incubation (day 55) without destroying the
microcosms, all microcosms were extracted with 12 mL of deionized water and a vacuum of 9.96
kPa (field capacity), yielding 8-12 mL leachate from each microcosm. The leachate was frozen at
-20°C for later measurements of enzyme activities. We measured the activities of enzymes that
127
are responsible for the degradation of three common compounds in decaying litter including
chitin (N-acetylglucosaminidase), cellulose (cellobiohydrolase and β-glucosidase) and lignin
(peroxidase and phenol oxidase). Preliminary measurements of 12 samples indicated that there
was little to no peroxidase or phenol oxidase activity. Therefore, these two enzymes were
dropped from further measurements. For the remaining three enzyme measurements, 8 ml of
leachate from each microcosm was mixed with 10 ml of 50 mM acetate buffer to adjust the pH to
around 5. Activities of the three non-ligninolytic enzymes were fluorometrically measured in 96-
well plates by mixing the buffered leachate with methylumbelliferone (MUB)-linked model
substrates. The details of enzyme analyses can be found in Saiya-Cork et al(2002).
Microarthropod communities
At final harvest (day 96), litter from each microcosm was homogenized and weighed separately.
Approximately 0.5 g from each microcosm was flash frozen in liquid N2 and then stored at -
80 °C for fungal T-RFLP analysis. The remainder of the litter was weighed again and placed in a
modified Tullgren funnel to extract microarthropods. After the 5-day extraction, litter was placed
in a 60 °C oven for 24 hours to determine the remaining dry mass.
The extracted microarthropods were preserved in 70% ethanol, and three major groups
(Mesostigmata, Collembola and Oribatida) were enumerated under a microscope. The most
abundant group (Oribatida, >80% of total microarthropods) was further identified to genus or
species level based on the keys written by R.A. Norton & V.M. Behan-Pelletier (unpublished) for
use at the Ohio State University Summer Acarology Program (http://www.biosci.ohio-
state.edu/~acarolog/summerProgram/).
T-RFLP of fungal community
Community DNA was extracted from 0.1 g of the frozen litter sample (at harvest) using MoBio

128
PowerMax DNA kits, following the manufacturer’s instructions. Sixteen microcosms from the
30 microcosms of each litter-microarthropod treatment were randomly selected for DNA
extraction. All of the no-microarthropod microcosms (10 for each litter type) and intact samples
(5 for each litter type) were also extracted for DNA. In addition, 10 DNA extractions from fresh
ambient and experimental N deposition litter were also included to characterize the initial fungal
communities before the microcosm experiments, yielding to a total of 114 samples. Success of
DNA extraction was confirmed by 1% agarose gel electrophoresis with gel red staining.
Extracted DNA was stored at -80 C before further analysis.
We targeted fungal ITS sequences for PCR amplification using the fungal-specific
primers ITS1-F (Gardes and Bruns 1993) and ITS4 (White et al. 1990) with the forward primer
fluorescently labeled with 6-FAM (6-carboxyfluorescein). These primers span approximately
420 to 825 bp of the fungal ribosomal operon, including part of 18S rDNA, all of ITS1, 5.8S, and
ITS2, and part of 28S rDNA (Manter and Vivanco 2007). PCR reactions were performed in 25
L reaction mixtures contained 1.25 units of Taq DNA polymerase (APEX), 2.5 L of 10X
reaction buffer (Apex), 0.2 mM dNTP’s (LifeTechnology), 0.2 uM of each PCR Primer (IDT),
0.4mg/ L of purified bovine serum albumin (New England BioLabs), and 1 L of template
DNA. The PCR amplification was conducted in a thermocycler as follows: 94°C for 2 min
followed by 32 cycles of 94°C for 30 s, 55°C for 30 s, 72°C for 1 min and a final extension at
72°C for 2 min. PCR products were visualized with electrophoresis on 1% agarose gels stained
with gel red. For each sample, products from two replicated PCR reactions were pooled together
and purified for downstream applications using MoBio UltraClean PCR clean-up kits.
We digested the clean PCR products by separately using HaeIII and HinfI restriction
endonucleases (New England Biolabs) in a 20 L reaction volume. Restriction digests were

129
performed in 100 L PCR tubes (Molecular BioProducts) containing 5U of enzyme, 2 L of 10X
reaction buffer, and 30-70 ng of purified PCR product. Restriction digests were incubated at 37
C for 4 h before enzyme activities were terminated by denaturation at 80 C for 20 minutes.
Reactions were then diluted with 200 L TE buffer, and purified/concentrated using Microcon
Ultracel YM-30 centrifugal filter devices. Reactions were checked for DNA restriction products
by 1% agarose gel electrophoresis stained with gel red.
Restriction products were loaded into barcoded ABI Prizm 96-well optical reaction plates
(Applied Biosystems); each well contained 2 L of purified digested DNA, 0.03 L of
MapMarker 1000 X-rhodamine (ROX) labeled DNA internal length standard (BioVentures, Inc.),
and Hi-Di formamide (Applied Biosystems) to a total volume of 13 L. Each sample was
sequenced twice for replicate measurements. Sample plates were submitted to the University of
Michigan DNA Sequencing Core, where 6-FAM labeled DNA restriction fragments were
separated and quantified by capillary gel electrophoresis on an Applied Biosystems Model
3730xl DNA Analyzer.
Terminal restriction fragment (TRF) patterns in the resulting electropherograms were
aligned and peaks were screened based on standards with known sizes using GeneMarker 1.6
Software (SoftGenetics, State College, PA). Peaks lower than 75 bp or higher 600 bp were
excluded to avoid contamination from excess primers or incomplete digest. Peaks that
contributed less than 1% of the total fluorescence from each measurement were deleted. The
remaining peaks from all samples from each enzyme digest were assigned to TRF classes using
GelCompare II (Applied Maths, Austin, Texas). TRF classes that appeared only once from all
profiles were discarded as artifacts. For each sample, only the TRF classes that were present in
both replicated measurements were kept for further analysis. The resulting profiles were then

130
used to generate a binary (presence/absence) matrix indicating the distribution of TRF classes
from our 114 samples.
To identify the fungal taxa that were associated with the TRF classes, we compared the
sizes of our TRF classes to the theoretical digest of known fungal sequences occurring in our
field study (J., Hasset unpublished data, Entwistle et al. In print). All of these sequences can be
retrieved from Genebank with access numbers GU174269-GU174233 and KC701765-
KC701965 separately. These fungal sequences have been assigned to fungal taxonomic groups
(family or genus) based on their sequence similarity with those of known taxonomic identity in
Genebank. We assigned a TRF to a certain taxonomic group only when the TRF class appeared
in the theoretical digests by both enzymes HaeIII and HinfI.
Data analysis
We first subtracted the CO2 concentration (L /L) of ambient atmosphere from that measured in
the headspace of each microcosm to calculate net CO2 accumulation (g CO2) over a 24-hour
period. We used this value as the average respiration rate in between two measurement dates to
calculate CO2 accumulation over time. The CO2 accumulation was normalized by the initial dry
weight of the litter in the microcosm, and then fit to a first-order exponential model At = A0 (1- e-
kt). The two parameters A0 and k were estimated using a non-linear least squares regression. A0
indicates the total respired C (ug CO2/ g C), reflecting the metabolized substrate pool over the
course of the incubation period (time = t). k is the first-order rate constant, indicating the
proportion of the total metabolized substrate pool that is under decayed per unit time. We also
calculated the mass loss in each microcosm. Therefore, we had 3 indices (actual mass loss, A0
and k) to represent different aspects of the decay process. Simple linear regressions were
performed among these 3 indices to address their relationships.

131
We compared the decay process in microcosms with microwaved litter (n = 140) to those
with unmicrowaved litter (n = 10) using a students’ t test. Within microwaved litter, we further
used two-way ANOVA (Litter, Microarthropod and their interaction) to assess how different litter
types and microarthropod treatments influenced litter decay in the microcosms. The main factor
Litter consisted of two litter types: litter from ambient or experimental N deposition; and the
main factor Microarthropod consisted of three different microarthropod treatments:
microarthropods from ambient plots, microarthropods from experimental N deposition plots, and
no-microarthropod controls. Similar two-way ANOVAs were applied to the enzyme activities
during microcosm incubation and the microarthropod abundance at the end of the incubation.
Tukey HSD post hoc multi-comparisons were applied to any significant terms from the two-way
ANOVAs. Simple linear regressions were performed to assess whether litter decay was
correlated with enzyme activities or microarthropod abundance.
For the binary matrix of fungal TRF classes, we used non-metric dimensional scaling
(nMDS) to visualize the fungal communities in both unmicrowaved litter (before and after
incubation) and incubated microwaved litter. For the second nMDS, we only included the
microwaved litter to investigate how fungal communities in the microcosms differed among litter
types and microarthropod treatments. Multivariate ANOVA based on dissimilarity (Adonis, The
PerMANOVA procedure in the Vegan Package in R) was performed to provide tests of statistical
significance for nMDS. We also summed the occurrence of each TRF class across each treatment
to compare the frequency of their occurrence. The frequency of their occurrence, divided by the
number of samples measured for each treatment, was further used to calculate the similarity
between two treatments. The similarity was calculated by 1- dissimilarity (Bray-Curtis index)
and represented the percentage of shared TRFs between two communities.

132
To investigate how the different oribatid communities may have influenced the fungal
communities in microcosms, simple regressions were performed between the similarity of fungal
communities (calculated as above) and the similarity of oribatid communities in each
experimental treatment (2 litter types x 3 Oribatid treatments = 6 treatments total). We only
included the pair-wise similarities within the same litter type to exclude possible confounding
effects from different litter types. The similarity of oribatid communities was calculated by 1-
dissimilarity (Bray-Curtis index). We used two indices of Oribatid community structure. The
presence/absence of oribatid species in each treatment was used to calculate the similarity in
species composition. Additionally, the abundance of oribatid species in each treatment was used
to calculate similarity in abundance.
All the statistical analyses were performed in R 2.15.1 (R Development Core Team
2012), with multivariate analyses including nMDS and perMANOVA performed in package
Vegan (Oksanen et al. 2007).
Results
Litter decay of microcosms
As expected, total mass loss within microcosms was positively corrected with the metabolized
substrate pool A0 (r2 = 0.34, P < 0.001). A0 and k were negatively corrected (r
2 = 0.58, P <
0.001), indicating that litters with a high metabolized substrate pool decayed at a slower rate than
did those with a low metabolized substrate pool. Overall, the decay rates (k) were comparable
(P > 0.05) between the incubations of microwaved and unmicrowaved litter; however, the
metabolized substrate pool (A0) was higher in microwaved litter than in the unmicrowaved litter
(t = 2.46, P = 0.025). We further compared the decay of microwaved litter with different litter
types and microarthropod treatments. The decay rates (k) were consistently higher in litter from
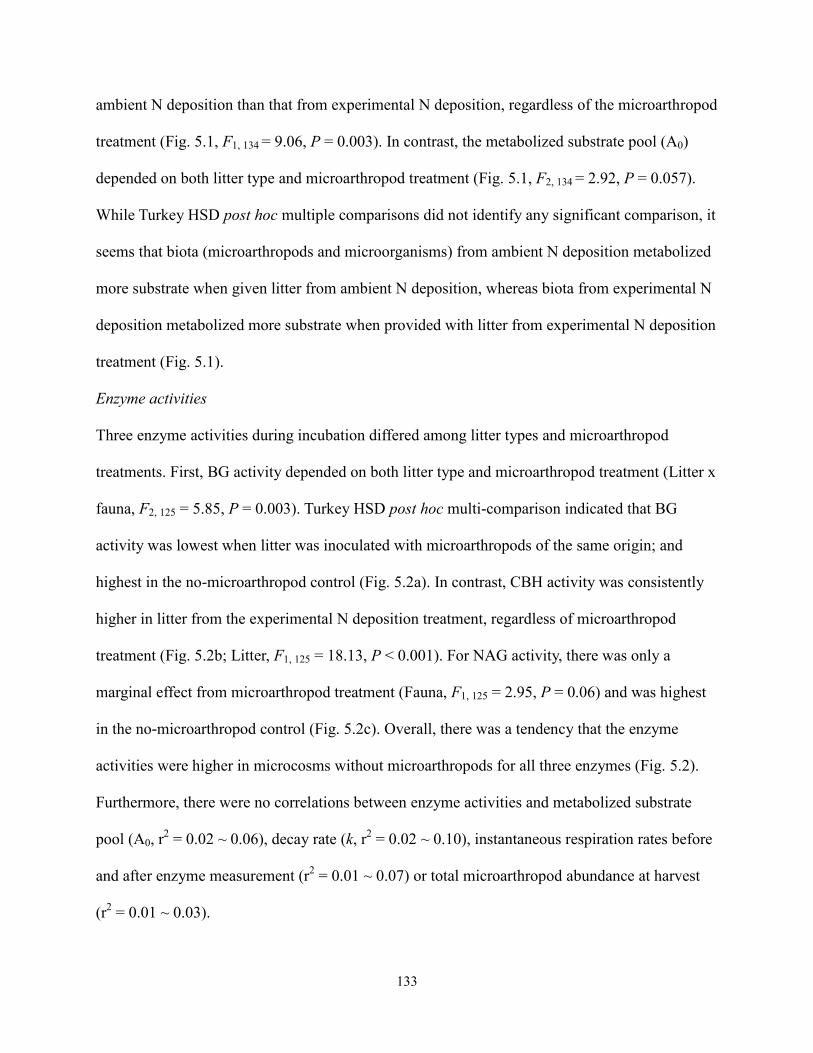
133
ambient N deposition than that from experimental N deposition, regardless of the microarthropod
treatment (Fig. 5.1, F1, 134 = 9.06, P = 0.003). In contrast, the metabolized substrate pool (A0)
depended on both litter type and microarthropod treatment (Fig. 5.1, F2, 134 = 2.92, P = 0.057).
While Turkey HSD post hoc multiple comparisons did not identify any significant comparison, it
seems that biota (microarthropods and microorganisms) from ambient N deposition metabolized
more substrate when given litter from ambient N deposition, whereas biota from experimental N
deposition metabolized more substrate when provided with litter from experimental N deposition
treatment (Fig. 5.1).
Enzyme activities
Three enzyme activities during incubation differed among litter types and microarthropod
treatments. First, BG activity depended on both litter type and microarthropod treatment (Litter x
fauna, F2, 125 = 5.85, P = 0.003). Turkey HSD post hoc multi-comparison indicated that BG
activity was lowest when litter was inoculated with microarthropods of the same origin; and
highest in the no-microarthropod control (Fig. 5.2a). In contrast, CBH activity was consistently
higher in litter from the experimental N deposition treatment, regardless of microarthropod
treatment (Fig. 5.2b; Litter, F1, 125 = 18.13, P < 0.001). For NAG activity, there was only a
marginal effect from microarthropod treatment (Fauna, F1, 125 = 2.95, P = 0.06) and was highest
in the no-microarthropod control (Fig. 5.2c). Overall, there was a tendency that the enzyme
activities were higher in microcosms without microarthropods for all three enzymes (Fig. 5.2).
Furthermore, there were no correlations between enzyme activities and metabolized substrate
pool (A0, r2 = 0.02 ~ 0.06), decay rate (k, r
2 = 0.02 ~ 0.10), instantaneous respiration rates before
and after enzyme measurement (r2 = 0.01 ~ 0.07) or total microarthropod abundance at harvest
(r2 = 0.01 ~ 0.03).

134
Microarthropod communities
As predicted from previous work (Gan et al. 2013), before the start of the experiment, the
abundance of microarthropods in litter from the experimental N deposition treatment was 38%
lower than that in litter from the ambient N deposition treatment. Additionally, chronic N
deposition reduced the species richness of oribatid mites (34 vs. 41 spp.) and altered their species
composition. For example, Eremaeus translamellatus had a relative abundance of 2. 4% in litter
from ambient N deposition but was totally absent under chronic experimental N deposition. In
contrast, the relative abundance of Fuscozetes fuscipes was 5.6% under ambient N deposition but
this number increased to 15.5% under chronic experimental N deposition. Overall , the five most
dominant species in litter from the ambient N deposition treatment were: Scheloribates
pallidulus (16.5%, proportion of total abundance), Suctobelba sp1 (8.9%), Oppiella nova (8.8%),
Suctobelba sp2 (8.4%) and Tectocepheus spp. (7.7%). In litter under chronic N deposition, they
were Scheloribates pallidulus (18.4%), F. fuscipes (15.5%) Suctobelba sp2 (12.5%),
Tectocepheus spp. (11.1%) and Suctobelba sp1 (7.8%).
However, most oribatid species did not survive the environmental conditions of the
microcosms. At harvest, there were only 1-2 oribatid species inside each microcosm, with O.
nova and S. pallidulus being the dominant species with their relative abundances averaging 71%
and 16% respectively. The abundance of microarthropods at harvest maintained the same pattern
as that before the incubation, in that the abundance of microarthropods was higher in litter from
ambient N deposition compared to that from experimental N deposition (Fig. 5.3, Fauna, F2, 134 =
22.59, P < 0.001).
T-RFLP of fungal community
The total number of TRF classes and the average number per microcosm from HinfI digest were

135
lower than that from HaeIII digest (41 vs. 47 and 10 vs. 13 respectively.). This indicates that
HinfI was a more conservative enzyme than HaeIII. However, multivariate analysis of the peak
profiles from these two enzyme digests showed similar results. Therefore, only the results from
HaeIII are presented here.
Among 47 TRF classes from HaeIII digest across all samples, we were able to assign 10
TRF classes to fungal taxonomic groups based on theoretical digests of known sequences. While
taxonomy associations inferred from TRF sizes are not guaranteed, we have high confidence that
these taxonomic identities are likely correct, because the sequences have been found in our study
sites and they appeared in the theoretical digests from both enzymes. The occurrences of these 10
TRF classes represented 17% of the total TRF occurrences and their occurrences among litter
types and microarthropod treatments can be found in Table 5.1.
Overall, the first nMDS (not shown) indicated that fungal communities in unmicrowaved
litter differed before and after incubation (an average of 56% similarity, Table 5.2). Secondly, the
unmicrowaved litter (both before and after incubation) had different fungal communities from
those in microwaved litter with later reintroduction of microorganisms (an average of 48%
similarity, Table 5.2). This indicated that both manipulation and incubation processes had altered
the fungal communities in microcosms. For example, one TRF class, Hygrophoraceae in
Euagarics (Size 97), was only present in the initial intact litter but disappeared in the microcosms
after incubation (Table 5.1). However, the total number of TRF classes in the unmicrowaved
litter was similar to that in microwaved litter (45 vs. 44), indicating that a majority of the fungal
communities were able to re-colonize the microwaved litter at the end of the incubation.
Within microwaved litter, the composition of fungal TRF classes varied among litter
types and microarthropod treatments (PerMANOVA F2, 78 = 1.88, P = 0.03). First, the fungal

136
community in litter from ambient N deposition was distinguished from that in litter from
experimental N deposition treatment, as demonstrated by the first axis of the second nMDS
ordination (Fig. 4). From the assigned TRF classes, size class 171 (Pezizomycotina:
Leotiomycetes: Helotiales: Sclerotiniaceae ) was absent in litter from ambient N deposition but
appeared 4 times in litter under experimental N deposition (Table 5.1). Within litter from ambient
N deposition, the fungal communities with microarthropod inoculations were more similar to
each other (87% similarity) than to the no-microarthropod control (an average of 80% similarity)
(Fig. 5.4, Table 5.2). For example, one TRF class (Size 155) was present in both microarthropod
treatments but absent in the no-microarthropod control. Interestingly, Size 155 was assigned in
Pezizomycotina: Sordariomycetes: Corycipitaceae: Cordyceps and most of the species in this
genus are known as parasites associated with insets. In contrast, for litter from experimental N
deposition treatment, the fungal community in the no-microarthropod control was similar to that
in microcosms inoculated with microarthropods collected from experimental N deposition.
Additionally, fungal communities from these two microarthropod treatments were separated
from those in microcosms inoculated with microarthropods from ambient N deposition (Fig.
5.4).
Interestingly, simple regressions revealed that the similarities of fungal communities
within each litter type were positively related to the similarities in the abundance of oribatid
mites (R² = 0.59, P = 0.08) but not species composition (R² = 0.14, P = 0.46) (Fig. 5.5). For
instance, within litter from experimental N deposition, the lowest similarity of fungal community
occurred between litter with microarthropods from ambient N deposition and that with no-
microarthropod control (Fig.5. 4). At the same time, there was a large difference (thus low
similarity) in microarthropod abundance between these two treatments (Fig. 5.3).

137
Discussion
We were interested in how the decline in soil microarthropod abundance and alteration in their
species composition reported under chronic N deposition (Gan et al. 2013) might feed back to
influence fungal community structure and litter decay. We initially expected that differences in
microarthropod communities would result in different fungal communities through
microarthropod-fungi interactions. However, our results revealed that fungal communities in
microcosms differed between litter types but that the effects of different microarthropod
treatments were weaker. Within each litter type, fungal communities under different
microarthropod treatments had an overall high degree of similarity, with an average of 83% of
Bray-Curtis similarity index (Fig. 5.4, Table 5.2). Simple regressions revealed that fungal
communities within each litter type were similar when there were similar numbers of oribatid
mites in the microcosms, whereas there was little influence of oribatid species composition.
However, relatively few mite species survived until the end of the experiment and the majority of
of the individuals (71%) that did survive belonged to the single species, O. nova, which is the
most cosmopolitan species of all oribatid mites and often cited as a pioneer and dominant species
in highly disturbed systems (Marshall et al. 1987, Siepel 1996).The convergence of oribatid mite
communities by the end of the incubation period limits our ability to evaluate the impacts of
oribatid community composition on fungal community composition. However, fungal
communities seemed to be affected by microarthropod abundance, albeit explaining less than
11% of overall fungal similarity that ranged from 76% to 87% similarity (Fig. 5.5). Although the
dominant species O. nova is believed to be a feeding generalist and flexible in feeding on plant
litter and fungal hyphae (Gan et al. In revision), a high abundance of microarthropods (mostly O.
nova) was associated with lower occurrences of some fungal species (e.g., S473,

138
Pezizomycotina: Dothidaeles) and higher occurrences of others (e.g. S134, Pezizomycotina:
Helotiales in litter from experimental N deposition) (Table 5.1). This suggests that, similar to the
effects of herbivore grazing on plant communities (Olff and Ritchie 1998), different levels of
microarthropod abundance may impose different grazing intensities on fungal communities and
alter fungal relative abundance through selective feeding.
Fungal community structure at the end of incubation did not correlate with the pattern of
litter decay under different microarthropod treatments. While we expected litter decay to be
slower with microarthropods from the experimental N plots and slowest without
microarthropods, our results did not support this hypothesis. First, decay rate (k) was lower in
litter from experimental N deposition regardless of microarthropod treatment (Fig. 5.1a). This
was probably due to the distinct fungal communities between litter types, which is consistent
with the field studies that report that experimental N deposition had altered fungal communities
and slowed litter decay (Liu and Greaver 2010, Edwards et al. 2011). Second, the influence of
different microarthropod treatments on the metabolized substrate pool (A0) depended on litter
type, wherein A0 was highest when litter and microarthropods were of the same origin (Fig.
5.1b). This so called “home-field advantage” has been demonstrated in other studies wherein
litter decays more rapidly when placed in its original habitat or when inoculated with soil biota
of the same origin (Gholz et al. 2000, Strickland et al. 2009). In contrast, Ayres et al. (2006) did
not find any evidence of higher litter decay in the presence of indigenous soil biota. It should be
noted that soil biota in the aforementioned study only included microorganisms and probably
some microfauna (Protozoa and small nematodes). This may suggest that home-field advantage
is less likely to occur unless major groups of soil animals such as microarthropods are present as
well.

139
The presence of home-field advantage in our study suggests that after 18 years of
experimental N deposition, soil microarthropods may have acclimated to changes in microbial
community composition and function under experimental N deposition. Despite of a slower
decay rate (k), change in microbial and microarthropod communities under chronic experimental
N deposition could metabolize similar total amounts of labile substrate as do soil biota under
ambient N deposition. This result was consistent with previous a study which reported similar
metabolized substrate C pools between ambient and experimental N deposition (Thomas et al.
2012). This may indicate that there is a high degree of functional redundancy among
microorganisms and microarthropods in their ability to degrade labile organic matter, albeit there
are significant changes in the species composition of both microbial and microarthropod
communities under chronic experimental N deposition (Zak et al. 2008, Edwards et al. 2011,
Ramirez et al. 2012, Gan et al. 2013). Functional redundancy in degrading labile organic
compounds during early stages of litter decomposition may not be surprising, given the fact that
many soil organisms can produce enzymes for degrading labile organic compounds (Nannipieri
et al. 2002). In contrast, only certain groups of specialized microorganisms have the ability to
degrade recalcitrant organic matter such as lignin (Nannipieri et al. 2002, Osono 2007). Field
studies have clearly demonstrated that the ability of fungi to degrade recalcitrant organic matter
is compromised by chronic N deposition (Carreiro et al. 2000, Knorr et al. 2005). Furthermore,
some studies have shown that the presence of soil animals can also influence the decay of
recalcitrant organic matter (Scheu 1993, Osono 2007). Therefore, it will be interesting for future
studies to address how microarthropods interact with fungal communities to influence the decay
of recalcitrant compounds, as the rate and extent of their metabolism could be inhibited under N
deposition with significant implications for total soil C storage (Whittinghill et al. 2012).

140
Alternatively, the home-field advantage that we observed in the metabolized substrate C
pool may reflect different grazing intensities in the microarthropod treatments. Fungal respiration
can exhibit a parabolic relationship with grazing intensity, wherein fungal respiration increases
with increasing microarthropod grazing until a peak level, beyond which fungal respiration is
inhibited (Hanlon 1981a). While the presence of grazing can stimulate fungal activity by the
removal of senescent tissues or the mobilization of nitrogen and phosphorus in feces or other
excretions (Hanlon 1981b, Ingham et al. 1985, Lussenhop 1992), high grazing intensity can
reduce fungal activity when tissue loss cannot be compensated for by regrowth (Setälä and Huhta
1991, Lenoir et al. 2007). While it is difficult to determine the optimal grazing intensity, it is
possible that microbial biomass and the microarthropod abundance have been co-adapted to an
optimal level in the two treatments that resembled field conditions, i.e., both microorganisms and
microarthropods from the same level of N deposition (either ambient or experimental). The
incubation of microorganisms with microarthropods from different field conditions will result in
a too high (i.e, microorganisms from experimental N deposition with microarthropods from
ambient N deposition) or too low (i.e., microorganisms from ambient N deposition with
microarthropods from experimental N deposition) grazing intensity.
One mechanism by which soil animals affect litter decomposition is through their
influence on the enzymes produced by microbial communities (Lussenhop 1992). In contrast to
some studies in which invertebrate grazing has stimulated fungal enzyme production (Crowther
et al. 2011b), the addition of microarthropods in our study seemed to inhibit enzyme activities at
least during some part of the incubation, evidenced by the overall higher enzyme activities in
litter without microarthropods. However, we cannot easily quantify the effects of
microarthropods on fungal enzyme production, as the enzyme activities included both fungal and

141
bacterial production. Assuming that the fungal enzyme activity was proportional to the overall
enzyme activity, it is possible that the grazing intensity by microarthropods was sufficiently high
to reduce the enzyme production from fungal community. This is a possible scenario, because we
initially simulated a field density of microarthropods at the beginning of the experiment, but the
fungal community may not have recovered to resemble field conditions during the first half of
the incubation. On the other hand, we did not observe any relationships between enzyme
activities and overall respiration or instantaneous respiration (either before or after the enzyme
measurements). This makes us cautious about the interpretation of the enzyme results, which are
indicative of maximum enzyme potential when given excess amounts of substrate at optimal
conditions, both of which may not be realized in the microcosms (Baldrian 2009).
To summarize, different levels of grazing intensity by microarthropods may have
influenced the fungal community and their enzyme production. However, all three of these
components were likely to be changing over the period of incubation, making it difficult to link
their activities at certain time points to overall litter decay inside the microcosms. Moreover, the
bacterial community is also an important contributor in the early stages of litter decay (Strickland
and Rousk 2010), and the inclusion of information about the bacterial community and total
microbial biomass may provide a more thorough understanding of the mechanisms underlying
the overall litter decay patterns that we observed in the microcosms.
Conclusions
Overall, we could not support the hypothesis that a decline in the abundance of microarthropods
and the alteration of oribatid mite communities under experimental N deposition inhibits litter
decay. Instead, litter with microarthropods of the same origin exhibited the highest metabolized
substrate pool, which was comparable between the ambient and experimental N deposition

142
treatments. This may indicate a high degree of functional redundancy among microorganisms
and microarthropods, which could buffer changes in the species composition of both microbial
and microarthropod communities under chronic N deposition, at least during the early stages of
litter decomposition. Further study should prioritize whether microarthropods interact with the
fungal community to inhibit the decay of recalcitrant compounds, which is likely to occur under
chronic N deposition and has significant implications for total soil C storage (Whittinghill et al.
2012). On the other hand, our results revealed that fungal communities varied with
microarthropod abundance. Given the fact that global environmental changes are altering the
abundance of many groups of soil animal, our study stresses the importance of understanding
trophic interactions between microbial communities and soil animals under different densities, to
fully understand potential effects of global environmental change on microbial communities and
litter decomposition.

143
Acknowledgements
This chapter was coauthored with Don R. Zak and Mark D. Hunter and is being prepared for
submission to journals. The authors would like to thank Liane Racelis for her help with the
respiration measurements.

144
Table 5.1. Selected TRF classes from HaeIII digest with their possible taxonomic associations
and the percentage of occurrences (out of total sample measured for each treatment) in the
microcosms with different litter types and microarthropod treatments. The occurrences of these
10 TRF classes represented 20% of the total occurrences of all TRF classes (47) from all
samples.
TRF
classa
Possible taxonomic associations Occurrences in microcosms
Subphylum Order Family/Genus Litter
typesb
Unmicrowavedc Microwaved d
Before
(10)e
After
(5)
A
(16)
N
(16)
None
(10)
S88 Pezizomycotina Chaetothyriales Herpotrichiellaceae A 80% 80% 50% 69% 50%
N 60% 80% 38% 25% 40%
S93 Pezizomycotina Botryosphaerales Microdiploidea A 80% 60% 0% 6% 0%
N 40% 20% 0% 0% 0%
S97 Agaricomycetes Hygrophoraceae Hygrocybe A 70% 0% 0% 0% 0%
N 20% 0% 0% 0% 0%
S134 Pezizomycotina Helotiales Hyaloscyphaceae A 100% 80% 63% 50% 50%
N 100%
100
% 88% 44% 30%
S155 Pezizomycotina Corycipitaceae Cordyceps A 80% 0% 6% 38% 0%
N 70% 40% 31% 44% 40%
S171 Pezizomycotina Helotiales Sclerotiniaceae A 60% 40% 0% 0% 0%
N 60% 20% 19% 6% 0%
S204 Pezizomycotina Hyalodendriella A 70% 0% 38% 25% 20%
N 70% 0% 25% 25% 10%
S446 Agaricomycetes Cortinariaceae Cortinarius A 100% 20% 6% 0% 30%
N 100% 80% 6% 0% 0%
S473 Pezizomycotina Dothideales A 0% 20% 44% 25% 60%
N 0% 20% 44% 94% 60%
S581 Agaricomycotina Corticiales Corticiaceae A 80% 0% 13% 19% 10%
N 40% 0% 13% 6% 0%
a. The number indicates the size (bp) of the restricted fragment.
b. There were two litter types: litter collected from forest floors under ambient or experimental N
deposition. c. Before: unmicrowaved litter before incubation; after: unmicrowaved litter after incubation.
d. A: microwaved litter inoculated with microarthropods extracted from litter under ambient N
deposition; N: microwaved litter inoculated with microarthropods extracted from litter under
experimental N deposition; None: microwaved litter without microarthropod inoculation. e. Number inside parenthesis indicates the number of microcosms with analyses of fungal T-
RFLP within each litter and microarthropod treatment combination.

145
Table 5.2. Similarity of fungal communities with different litter types and microarthropod
treatments. The similarity was calculated by 1- Bray-Curtis index of dissimilarity and represents
the percentage of shared TRFs between two communities. The data matrix for this calculation
was the sum of the occurrence of each TRF class for each litter and microarthropod combination
divided by the number of samples measured for that treatment.
Litter/Microarthropod treatmentsa
Litter from ambient N deposition Litter under experimental N deposition
Unmicrowaved Microwaved Unmicrowaved Microwaved
Before After A N None Before After A N
Litter from
ambient N
deposition
Unmicrowaved After 0.52 1
Microwaved A 0.31 0.56 1
N 0.32 0.57 0.87 1
None 0.29 0.56 0.8 0.8 1
Litter from
experimental
N deposition
Unmicrowaved Before 0.81 0.54 0.38 0.39 0.34 1
After 0.59 0.72 0.49 0.5 0.46 0.61 1
Microwaved A 0.42 0.7 0.77 0.75 0.74 0.51 0.62 1
N 0.38 0.63 0.71 0.71 0.7 0.42 0.6 0.79 1
None 0.38 0.64 0.71 0.7 0.72 0.45 0.62 0.76 0.84
a. There were two types of litter: litter collected from forest floors under ambient or experimental
N deposition; and five types of microarthropod manipulation: Before: unmicrowaved litter before
incubation; After: unmicrowaved litter after incubation. A: microwaved litter inoculated with
microarthropods extracted from litter under ambient N deposition; N: microwaved litter
inoculated with microarthropods extracted from litter under experimental N deposition; None:
microwaved litter without microarthropod inoculation.

146
Figure 5.1. Litter decay in the 96-day incubation. (a) Decay rate (k) was lower in microcosms
with litter from experimental N deposition (Litter, F1,134 = 9.07, P = 0.003) and (b) total respired
C (A0) depended on both litter type and microarthropod treatment (Litter x Fauna, F2,134 = 2.9, P
= 0.045). Pattern filled, A_fauna: microarthropods collected from litter from ambient N
deposition; Solid filled, N_fauna: microarthropods collected from litter from ambient N
deposition; Empty, None: no microarthropods.
0.0
0.0
0.0
0.1
0.1
0.1
0.1
0.1
0.2
k (s
qu
are
root
tran
sform
ed)
A_fauna N_fauna None
(a) k
13.1
13.1
13.2
13.2
13.3
13.3
13.4
13.4
13.5
13.5
Ambient N-dep litter Experimental N-dep litter
A0(u
g C
O2/g
C, lo
g t
ran
sform
ed)
(b) A0

147
Figure 5.2. Enzyme activities in the leachate from the microcosms on day 55 of the 96-day
incubation (a) β-glucosidase (BG) varied among litter types and microarthropod treatments
(Fauna x Litter, F2, 134 = 5.9, P = 0.003); (b) Cellobiohydrolase (CBH) was higher in N-
deposition litter (Liter, F1, 134 = 18.1, P < 0.001) and (c) acetylglucosaminidase (NAG) was
higher in the no-microarthropod control (Fauna, F2,134 = 3.0, P = 0.05) . BG and CBH are
cellulose-degrading enzymes and NAG is chitin-degrading enzyme. a ,b and c indicate different
levels from Tukey post-hoc multi-comparisons. The meanings of legends are similar to Fig. 1.
0
0.2
0.4
0.6
0.8
1
1.2
um
ol/
hr/
g, lo
g t
ran
sform
ed
(a) BG
A_fauna N_fauna None
a
a
c bc bc
b
-0.8
-0.6
-0.4
-0.2
0
0.2
0.4
um
ol/
hr/
g, lo
g t
ran
sform
ed)
(b) CBH
a
b
0
0.2
0.4
0.6
0.8
1
1.2
um
ol/
hr/
g, lo
g t
ran
sform
ed
Ambient N_dep litter Experimental N_dep litter
(c) NAG
a ab
b
a
b
ab

148
Figure 5.3. The average number of microarthropods in the microcosms at harvest remained
higher in the ambient microarthropod treatment than the N-deposition microarthropod treatment
(Fauna, F2, 134 = 24, P < 0.001). The meanings of legends are similar to Fig. 1
0
10
20
30
40
50
60
Ambient N-dep litter Experimental N-dep litter
Mic
roar
thro
pod
ab
un
dan
ce (
#)
A_fauna N_fauna None

149
Figure 5.4. Fungal communities, visualized by nMDS of TRF classes from HaeIII digest, varied
between litter types and microarthropod treatments (PerMANOVA, Litter x Fauna, F2, 78 = 1.88,
P = 0.03 ). nMDS: stress = 0.14, dimensions = 3. Empty symbols: litter from ambient N
deposition; Filled symbols: litter from experimental N deposition. Square, A_fauna:
microarthropods collected from litter from ambient N deposition; Circle, N_fauna:
microarthropods collected from litter from ambient N deposition; Triangle, None: no
microarthropods. Dashed circle represents similar communities within each litter type.
-0.6
-0.4
-0.2
0
0.2
0.4
-0.4 -0.2 0 0.2 0.4
nM
DS
II
nMDS I
A_fauna
N_fauna
None
Ambient N_dep litter
Experimental
N_dep litter

150
Figure 5.5. Similarities between fungal communities are positively related to the similarities of
oribatid abundance (filled circles) but not oribatid species composition (open circles). The
similarities were calculated by 1- dissimilarity (Bray-Curtis index). The presence/absence of
oribatids was used for the calculation of similarity in species composition; and the abundance of
oribatid species was used for the calculation of similarity in abundance.
P > 0.1
R² = 0.59
P = 0.08
0.7
0.75
0.8
0.85
0.9
0.95
-0.2 0 0.2 0.4 0.6 0.8 1 1.2
Sim
ilar
ity o
f fu
ngal
com
mu
nit
y
Similarity of oribatid community
Oribatid composition Oribatid abundance

151
Literature Cited
Adl, S. M., D. C. Coleman, and F. Read. 2006. Slow recovery of soil biodiversity in sandy loam
soils of Georgia after 25 years of no-tillage management. Agriculture, ecosystems &
environment 114:323-334.
Andrén, O., J. Bengtsson, and M. Clarholm. 1995. Biodiversity and species redundancy among
litter decomposers. Pages 141-151 in H. P. Collins, G. P. Robertson, and M. J. Klug,
editors. The Significance and Regulation of Soil Biodiversity. Springer Netherlands.
Ayres, E., K. M. Dromph, and R. D. Bardgett. 2006. Do plant species encourage soil biota that
specialise in the rapid decomposition of their litter? Soil Biology and Biochemistry
38:183-186.
Baldrian, P. 2009. Microbial enzyme-catalyzed processes in soils and their analysis. Plant Soil
Environ 55:370-378.
Bardgett, R. D. 2002. Causes and consequences of biological diversity in soil. Zoology 105:367-
375.
Behan-Pelletier, V. and G. Newton. 1999. Computers in Biology: Linking soil biodiversity and
ecosystem function—The taxonomic dilemma. BioScience 49:149-153.
Berch, S. M., R. P. Brockley, J. P. Battigelli, S. Hagerman, and B. Holl. 2006. Impacts of
repeated fertilization on components of the soil biota under a young lodgepole pine stand
in the interior of British Columbia. Canadian Journal of Forest Research-Revue
Canadienne De Recherche Forestiere 36:1415-1426.
Blankinship, J. C., P. A. Niklaus, and B. A. Hungate. 2011. A meta-analysis of responses of soil
biota to global change. Oecologia 165:553-565.
Blouin, M., M. E. Hodson, E. Delgado, G. Baker, L. Brussaard, K. R. Butt, J. Dai, L.
Dendooven, G. Pérès, and J. Tondoh. 2013. A review of earthworm impact on soil
function and ecosystem services. European Journal of Soil Science.
Briones, M. J. I., P. Ineson, and A. Heinemeyer. 2007. Predicting potential impacts of climate
change on the geographical distribution of enchytraeids: a meta-analysis approach.
Global Change Biology 13:2252-2269.
Burton, A. J., C. W. Ramm, K. S. Pregitzer, and D. D. Reed. 1991. Use of multivariate methods
in forest research site selection. Canadian Journal of Forest Research 21:1573-1580.
Carreiro, M., R. Sinsabaugh, D. Repert, and D. Parkhurst. 2000. Microbial enzyme shifts explain
litter decay responses to simulated nitrogen deposition. Ecology 81:2359-2365.
Crossley, D. A. and J. M. Blair. 1991. A high-efficiency, low-technology Tullgren-type extractor
for soil microarthropods. Agriculture Ecosystems & Environment 34:187-192.
Crowther, T. W., L. Boddy, and T. H. Jones. 2011a. Outcomes of fungal interactions are
determined by soil invertebrate grazers. Ecology Letters 14:1134-1142.
Crowther, T. W., T. H. Jones, L. Boddy, and P. Baldrian. 2011b. Invertebrate grazing determines
enzyme production by basidiomycete fungi. Soil Biology & Biochemistry 43:2060-2068.
Decaens, T., P. Lavelle, and J.-J. Jimenez. 2008. Priorities for conservation of soil animals. CAB
Reviews 3:1-18.
Edwards, I. P., D. R. Zak, H. Kellner, S. D. Eisenlord, and K. S. Pregitzer. 2011. Simulated
Atmospheric N Deposition Alters Fungal Community Composition and Suppresses
Ligninolytic Gene Expression in a Northern Hardwood Forest. Plos One 6.
Eisenhauer, N., S. Cesarz, R. Koller, K. Worm, and P. B. Reich. 2012. Global change
belowground: impacts of elevated CO2, nitrogen, and summer drought on soil food webs
and biodiversity. Global Change Biology 18:435-447.

152
Entistle, E., D. R. Zak, and I. P. Edwards. In print. Long-term experimental nitrogen deposition
alters the composition of the active fungal community in the forest floor. Soil Science
Society of America Journal In Print.
Filser, J. 2002. The role of Collembola in carbon and nitrogen cycling in soil: Proceedings of the
Xth international Colloquium on Apterygota, České Budějovice 2000: Apterygota at the
Beginning of the Third Millennium. Pedobiologia 46:234-245.
Gan, H. J., D. R. Zak, and M. D. Hunter. 2013. Chronic nitrogen deposition alters the structure
and function of detrital food webs in a northern hardwood ecosystem. Ecological
Applications In press.
Gan, H. J., D. R. Zak, and M. D. Hunter. In revision. Trophic stability of soil oribatid mites in the
face of environmental change. Soil Biology & Biochemistry.
Gardes, M. and T. D. Bruns. 1993. ITS primers with enhanced specificity for basidiomycetes‐application to the identification of mycorrhizae and rusts. Molecular Ecology 2:113-118.
Gholz, H. L., D. A. Wedin, S. M. Smitherman, M. E. Harmon, and W. J. Parton. 2000. Long‐term
dynamics of pine and hardwood litter in contrasting environments: toward a global model
of decomposition. Global Change Biology 6:751-765.
Giller, P. S. 1996. The diversity of soil communities, the ‘poor man's tropical rainforest’.
Biodiversity and Conservation 5:135-168.
Hanlon, R. D. G. 1981a. Influence of grazing by Collembola on the activity of senescent fungal
colonies grown on medium of different nutrient concentrations. Oikos 36:362-367.
Hanlon, R. D. G. 1981b. Some factors influencing microbial growth on soil animals feces.
Pedobiologia 21:264-270.
Huhta, V. 2007. The role of soil fauna in ecosystems: A historical review. Pedobiologia 50:489-
495.
Huhta, V., D. Wright, and D. Coleman. 1989. Characteristics of defaunated soil. I: A comparison
of three techniques applied to two different forest soils. Pedobiologia 33:417-426.
Ingham, R. E., J. A. Trofymow, and E. R. Ingham. 1985. Interactions of bacteria , fungi, and their
nematode grazers-effects on nutrient cycling and plant-growth. Ecological Monographs
55:119-140.
Knorr, M., S. Frey, and P. Curtis. 2005. Nitrogen additions and litter decomposition: a meta-
analysis. Ecology 86:3252-3257.
Lenoir, L., T. Persson, J. Bengtsson, H. Wallander, and A. Wiren. 2007. Bottom–up or top–down
control in forest soil microcosms? Effects of soil fauna on fungal biomass and C/N
mineralisation. Biology and Fertility of Soils 43:281-294.
Lindberg, N. and T. Persson. 2004. Effects of long-term nutrient fertilisation and irrigation on the
microarthropod community in a boreal Norway spruce stand. Forest Ecology and
Management 188:125-135.
Liu, L. and T. L. Greaver. 2010. A global perspective on belowground carbon dynamics under
nitrogen enrichment. Ecology Letters 13:819-828.
Lussenhop, J. 1992. Mechanisms of Microarthropod Microbial Interactions in Soil. Advances in
Ecological Research 23:1-33.
Maraun, M., H. Martens, S. Migge, A. Theenhaus, and S. Scheu. 2003. Adding to ‘the enigma of
soil animal diversity’: fungal feeders and saprophagous soil invertebrates prefer similar
food substrates. European Journal of Soil Biology 39:85-95.
Maraun, M., S. Migge, M. Schaefer, and S. Scheu. 1998. Selection of microfungal food by six
oribatid mite species(Oribatida, Acari) from two different beech forests. Pedobiologia

153
42:232-240.
Marshall, V. G., R. Reevrs, and R. A. Norton. 1987. Catalogue of the Oribatida (Acari) of
continental United States and Canada. Memoirs of the Entomological Society of Canada
119:1-418.
Matson, P., K. A. Lohse, and S. J. Hall. 2002. The globalization of nitrogen deposition:
consequences for terrestrial ecosystems. AMBIO: A Journal of the Human Environment
31:113-119.
Mikola, J., R. D. Bardgett, and K. Hedlund. 2002. Biodiversity, ecosystem functioning and soil
decomposer food webs. Biodiversity and ecosystem functioning: synthesis and
perspectives. Oxford University Press, Oxford:169-180.
Nannipieri, P., E. Kandeler, and P. Ruggiero. 2002. Enzyme activities and microbiological and
biochemical processes in soil. Enzymes in the environment. Marcel Dekker, New York:1-
33.
Nielsen, U. N., E. Ayres, D. H. Wall, and R. D. Bardgett. 2011. Soil biodiversity and carbon
cycling: a review and synthesis of studies examining diversity–function relationships.
European Journal of Soil Science 62:105-116.
Oksanen, J., R. Kindt, P. Legendre, B. O’Hara, M. H. H. Stevens, M. J. Oksanen, and M.
Suggests. 2007. The vegan package. Community ecology package. Disponível em:
http://www. R-project. org. Acesso em 10:2008.
Olff, H. and M. E. Ritchie. 1998. Effects of herbivores on grassland plant diversity. Trends in
Ecology & Evolution 13:261-265.
Osono, T. 2007. Ecology of ligninolytic fungi associated with leaf litter decomposition.
Ecological Research 22:955-974.
Petersen, H. and M. Luxton. 1982. A comparative analysis of soil fauna populations and their
role in decomposition processes. Oikos:288-388.
Ramirez, K. S., J. M. Craine, and N. Fierer. 2012. Consistent effects of nitrogen amendments on
soil microbial communities and processes across biomes. Global Change Biology
18:1918-1927.
Saiya-Cork, K., R. Sinsabaugh, and D. Zak. 2002. The effects of long term nitrogen deposition
on extracellular enzyme activity in an< i> Acer saccharum</i> forest soil. Soil Biology
and Biochemistry 34:1309-1315.
Scheu, S. 1993. Litter microflora-soil macrofauna interactions in lignin decomposition: A
laboratory experiment with 14C-labelled lignin. Soil Biology and Biochemistry 25:1703-
1711.
Scheu, S., L. Ruess, and M. Bonkowski. 2005. Interactions between microorganisms and soil
micro-and mesofauna. Pages 253-275 in F. Buscot and A. Varma, editors.
Microorganisms in Soils: Roles in Genesis and Functions. Springer, Berlin.
Schneider, K., C. Renker, and M. Maraun. 2005. Oribatid mite (Acari, Oribatida) feeding on
ectomycorrhizal fungi. Mycorrhiza 16:67-72.
Setälä, H. and V. Huhta. 1991. Soil fauna increase Betula pendula growth: laboratory
experiments with coniferous forest floor. Ecology:665-671.
Siepel, H. 1996. Biodiversity of soil microarthropods: the filtering of species. Biodiversity &
Conservation 5:251-260.
Strickland, M. S., C. Lauber, N. Fierer, and M. A. Bradford. 2009. Testing the functional
significance of microbial community composition. Ecology 90:441-451.
Strickland, M. S. and J. Rousk. 2010. Considering fungal: bacterial dominance in soils–Methods,

154
controls, and ecosystem implications. Soil Biology and Biochemistry 42:1385-1395.
Thomas, D. C., D. R. Zak, and T. R. Filley. 2012. Chronic N deposition does not apparently alter
the biochemical composition of forest floor and soil organic matter. Soil Biology and
Biochemistry 54:7-13.
White, T. J., T. Bruns, S. Lee, and J. Taylor. 1990. Amplification and direct sequencing of fungal
ribosomal RNA genes for phylogenetics. PCR protocols: a guide to methods and
applications 18:315-322.
Whittinghill, K. A., W. S. Currie, D. R. Zak, A. J. Burton, and K. S. Pregitzer. 2012.
Anthropogenic N Deposition Increases Soil C Storage by Decreasing the Extent of Litter
Decay: Analysis of Field Observations with an Ecosystem Model. Ecosystems 15:450-
461.
Wolters, V. 2001. Biodiversity of soil animals and its function. European Journal of Soil Biology
37:221-227.
Wolters, V., W. L. Silver, D. E. Bignell, D. C. Coleman, P. Lavelle, W. H. Van der Putten, P. De
Ruiter, J. Rusek, D. H. Wall, D. A. Wardle, L. Brussaard, J. M. Dangerfield, V. K. Brown,
K. E. Giller, D. U. Hooper, O. Sala, J. Tiedje, and J. A. Van Veen. 2000. The effect of
global change on above- and belowground biodiversity in terrestrial ecosystems:
Implications for ecosystem funtioning. Bioscience 50:1089-1098.
Xu, G. L., P. Schleppi, M. H. Li, and S. L. Fu. 2009. Negative responses of Collembola in a
forest soil (Alptal, Switzerland) under experimentally increased N deposition.
Environmental Pollution 157:2030-2036.
Zak, D. R., W. E. Holmes, A. J. Burton, K. S. Pregitzer, and A. F. Talhelm. 2008. Simulated
atmospheric NO3- deposition increases soil organic matter by slowing decomposition.
Ecological Applications 18:2016-2027.

155
Chapter VI
Conclusions
Understanding processes that structure biotic communities is a central theme in community
ecology (Begon et al. 2006). It is widely acknowledged that both stochastic and deterministic
forces including dispersal limitation, environmental filtering and biotic interactions are important
in community assembly (Belyea and Lancaster 1999, Leibold and McPeek 2006). However, little
is known regarding the relative role of stochastic and deterministic forces in the community
assembly of soil animal communities, which are among the most species-rich components of
terrestrial ecosystems (Giller 1996). Understanding the mechanisms underlying the structure of
soil animal communities is a pressing challenge in a world that is facing increasing rates of
biodiversity loss and ecosystem degradation (Clark 2009). This knowledge will help us to predict
how soil animals may respond to environmental changes and the potential consequences of such
changes for ecosystem functioning.
In this dissertation, I focused on an important group of soil animals, the soil oribatid
mites, to investigate mechanisms underlying their community assembly and to address how
global environmental change influences their community structure and function. I first
investigated how dispersal limitation, environmental filtering and biotic interactions influenced
the diversity and composition of oribatid mite communities across a glacial chronosequence. To
address if there is any niche differentiation in food resource utilization among soil oribatid mites,
I studied the trophic structure and trophic dynamics of these soil organisms under different
environmental conditions. Furthermore, I investigated how soil oribatid mites (together with

156
other groups of soil microarthropods) respond to chronic N deposition, a pervasive agent of
global environmental change. I then established a litterbag experiment in the field and a
microcosm experiment in the laboratory to examine whether changes in oribatid communities
under chronic N deposition feeds back to influence litter decay. Below I summarize the main
findings from my four primary chapters.
Chapter II. Stochastic (dispersal limitation) and deterministic (environmental filtering and
biotic interaction) processes as drivers of soil oribatid mite community assembly. I
hypothesized that dispersal limitation was a central mechanism structuring oribatid mite
communities, due to their low locomotive activity through the soil. I tested this hypothesis by
studying the geographic distribution of oribatid mites along a chronosequence across a
deglaciated region, in which the effect of limited dispersal is expected to be profound.
However, this study demonstrates that soil/litter dwelling oribatid mites are not limited
by dispersal in their re-colonization of deglaciated areas. This is supported by three lines of
evidence including similar species richness along the chronosequence, a lack of relationship
between overall community dissimilarity and geographic distance, and a large species pool of
oribatid mites in deglaciated regions. However, large-bodied oribatid species seem to be affected
by dispersal limitation. This is supported by the significant relationship between the community
dissimilarity of large-bodied species (but not small-bodied species) and geographic distance. The
community composition of large-bodied species is also more dissimilar (41% dissimilarity)
among sites than that of small-bodied species (27% dissimilarity). Furthermore, compared to the
slow recovery of earthworms in deglaciated areas, the rapid recovery of oribatid mites further
supports the conclusion that soil animals with large body size are more affected by dispersal
limitation than are small-bodied animals. Our study also reveals that environmental filtering

157
(temperature, litter fall and soil C:N ratio) and competition for food resources (fungal biomass
and Collembola abundance) contribute to determining oribatid species composition.
Chapter III. Trophic structure and trophic dynamics of soil oribatid mites. High local
diversity of soil oribatid mites suggests that intense competition and differentiation in resource
utilization may exist among these oribatid species (Anderson 1975). In this study, we used 15
N
isotope analysis to study trophic differentiation among oribatid mites and to examine how
chronic atmospheric N deposition may alter their trophic structure. Our findings have provided
three novel insights into the trophic structure and trophic dynamic of soil oribatid mites.
First, by combining our own measurements and published data, our study is the first to
clearly demonstrate that the majority of soil oribatid mites feed on fungal hyphae and animal
tissue rather than dead plant material. Feeding on dead plant material is a long-held
misconception due to an inability using traditional gut content analysis to identify the actual food
assimilated. Second, I also find that the trophic positions of soil oribatid mites are surprisingly
stable within and among forests, and between ambient and experimental N deposition. This
indicates a high level of feeding specialization among soil oribatid mites, which counters another
misunderstanding, that soil animals are generalists, enabling them to switch diets based on food
availability. Finally, specialized feeding on live organisms illustrates the potential for co-
evolution between soil oribatid mites and their food resources. Such co-evolution may help to
explain the coexistence of high numbers of soil oribatid mite species in small areas. The
specialized diet of these soil animals means that their densities will likely suffer in the face of
environmental change, as will the important roles that they play in ecosystem processes such as
litter comminution.

158
Chapter IV. The effects of chronic N deposition on the community structure and function
of soil oribatid mites. I investigated the influence of anthropogenic nitrogen deposition on soil
oribatid mites and asked if those changes could then feed back to influence ecosystem
functioning. Accumulating evidence suggests that soil animals are sensitive to multiple
environmental stressors (Blankinship et al. 2011, Eisenhauer et al. 2012). However, no study to
date has explicitly explored whether such changes could compromise ecosystem processes such
as litter decay.
Overall, this study demonstrates that long-term experimental N deposition has reduced the
abundance of microarthropods (Oribatid mites, Collembola and Mesostigmata) by 44%. This
overall decline is attributed partly to inhibition of microbial activity and the reduced energy flow
entering the detrital food pathway under chronic N deposition. While there is no difference in
microarthropod species richness between N deposition treatments, there is a shift in community
composition within the most abundant group (Oribatida), indicating species-specific responses to
N deposition. Experimental N deposition also reduces the number of microarthropods colonizing
litterbags by 41%, and this is associated with a reduction in 13
C mobilization from leaf litter into
fungal biomass. Overall, this study demonstrates that chronic N deposition has a detrimental
effect on soil oribatid mites, and that the negative effect may feed back to influence litter decay
and ecosystem functioning.
Chapter V. The consequences of changes in microarthropod communities under chronic N
deposition for fungal communities and litter decay. Results from Chapter IV demonstrated
that the abundance of microarthropods was significantly reduced and the composition of oribatid
communities was altered under chronic N deposition. Results from Chapter IV also revealed that
the decline in microarthropod abundance in forest floors reduced litter fragmentation. The
159
reduction in litter comminution might reduce the amount of litter surface exposed for microbial
attack, which would ultimately inhibit litter decay. In this study, I was interested in other
mechanisms by which microarthropods influence litter decay, especially the interactions between
microarthropods and saprotrophic fungi.
Overall, results from the microcosm experiment reveal that changes in microarthropod
communities influenced fungal communities but not litter decay. First, the total metabolized C
pool is highest when litter is inoculated with microarthropods of the same origin as the litter, and
is comparable between ambient and experimental N deposition treatments. This suggests that
after 18 years of experimental N deposition, soil microarthropods may have acclimated to
changes in microbial community composition and function, at least for labile organic matter
during the early stages of litter decay. This study also demonstrates that fungal communities are
primarily distinguished by different litter types. However, within each litter type, fungal
communities vary with microarthropod abundance. This suggests that any changes in the
abundance of microarthropods under global environmental change are likely to feed back to
influence fungal communities and possibly the decay of recalcitrant organic matter.
Synthesis. This dissertation has provided insights into the structure and function of soil oribatid
mite communities and how they respond to global environmental change. The first conclusive
finding from this dissertation is that dispersal limitation does not severely affect the overall soil
oribatid mite communities. However, other neutral forces such as demography stochasticity
might be important in the assembly of oribatid mite community in environments with frequent
and unpredictable disturbances (Maraun et al. 2003). While it is important to test these stochastic
forces in community structure, some criticize that it is hard to relate the neutral view of
biodiversity to the real world problems (Clark 2009). Instead, it is of greater importance, to test a
160
set of boarder factors that are actually affecting community structure and ecosystem function,
especially in a world facing increasing rate of loss of biodiversity and other global environmental
changes (Clark 2009).
This dissertation also illustrated that deterministic forces, i.e., environment filtering and
biotic interactions are more important than dispersal limitation in structuring soil oribatid mite
communities. Competition for fungal hyphae and niche differentiation in food resource
utilization may contribute to explain the enigma of soil oribatid diversity. Competition for food
resources as a strong force in shaping oribatid mite community is also demonstrated by
manipulative experiments and other stable isotope studies (Anderson 1978a, Schneider et al.
2004, Pollierer et al. 2009). Other studies further stress the importance of competition for space
and microhabitats among oribatid mite species (Anderson 1978b, Ferreira and Silva 2001).
Furthermore, accumulating evidences suggest that the high diversity of soil animals is in part
contributed to the extremely heterogeneous habitats in soils (Irmler 1998, Bardgett 2002,
Vanbergen et al. 2007, Nielsen et al. 2010). On the other hand, while controls from predators are
important in the community assembly of other groups of soil animals such as nematodes
(Hyvonen and Persson 1998), most oribatid mites are heavily sclerotized to defend against
predators and therefore likely to live in enemy-free space (Peschel et al. 2006). Nevertheless, this
dissertation research, together with the aforementioned studies, indicate that similar to many
animals living aboveground, soil oribatid mites are regulated in a predictable fashion by forces
underlying their niche differentiation.
Caveats and future directions. The results documented in this dissertation strongly support a
central role of deterministic forces, especially competition for food resources, in the structuring
of soil oribatid mite communities. In contrast, there is little evidence for the role of dispersal

161
limitation in shaping overall oribatid communities. However, this dissertation focused on the re-
colonization of soil oribatid mites into deglaciated areas, which has been occurring for over
10,000 years. The lack of dispersal limitation at this time scale does not exclude the possibility of
dispersal limitation at shorter time scales. As a matter of fact, studies have found that the
diversity of soil oribatid mites does not recover over decadal time spans in no-tillage farming or
abandoned old fields (Siepel 1991, Adl et al., 2006). Nevertheless, the recovery of oribatid mite
communities following glacial retreat is notably faster than that of other groups of soil fauna
such as earthworms, which are at the other extreme of body size among soil fauna. It will be
interesting to investigate how dispersal limitation influences the distribution of other groups of
soil fauna with intermediate body sizes (e.g., Isopoda and Enchytraeidae) in deglaciated regions.
The study of the distribution of soil animals at multiple study sites in both deglaciated and ice-
free regions would provide further information regarding refuges during glaciation and the routes
of their re-colonization.
This dissertation also reveals a high degree of stability in the trophic positions of oribatid
mites based on 15
N analysis. However, there are some intrinsic limitations associated with stable
isotope analysis. For example, it is nearly impossible to identify omnivores using solely 15
N data,
because the stable isotope signals can be a mixture from two or more food sources. Also, results
from 15
N analysis did not have sufficient resolution to detect subtle changes in food items that
occur within the same trophic levels (e.g., fungal hyphae from different fungi species). Further
studies should use additional methods such as fatty acid analysis or molecular fingerprints of gut
contents to detect more subtle trophic relationships of soil oribatid mites (Scheu 2002,
Chamberlain et al. 2004).
Strong competition for food resources and feeding specialization among soil oribatid

162
mites suggest that they are likely to respond to global environmental changes in a predictable
manner. This dissertation only addresses how atmospheric N deposition affects the community
structure and functions of soil oribatid mites in hardwood forests. Future studies with
comparative experiments on the responses of soil oribatid mites from contrasting ecosystems
(e.g. grasslands vs. forests) to multiple agents of environmental change (e.g. N deposition &
global warming) will deepen our knowledge of the mechanisms underlying how soil oribatid
mites respond to environmental changes.
Despite these caveats and limitations, the work described in this dissertation adds to our
understanding of the mechanisms underlying the community structure and functions of soil
oribatid mites. The knowledge that soil oribatid mite communities are primarily governed by
deterministic forces helps us to predict the influence of global environmental changes on their
community structure and ecological functions.

163
Literature Cited
Anderson, J. 1975. The enigma of soil animal species diversity. Pages 51-58 in J. Vaněk, editor.
Progress in soil zoology. Academia, Publishing House of the Czechostovak Academy of
Sciences, Prague.
Anderson, J. M. 1978a. Competition between two unrelated species of soil Cryptostigmata
(Acari) in experimental microcosms. Journal of Animal Ecology 47:787-803.
Anderson, J. M. 1978b. Inter- and intra-habitat relationships between woodland Cryptostigmata
species diversity and the diversity of soil and litter microhabitats. Oecologia 32:341-348.
Bardgett, R. D. 2002. Causes and consequences of biological diversity in soil. Zoology 105:367-
375.
Begon, M., C. Townsend, and J. Harper. 2006. Ecology: from individuals to ecosystems. 4
edition. Blackwell Publishing Ltd.
Belyea, L. R. and J. Lancaster. 1999. Assembly rules within a contingent ecology. Oikos 86:402-
416.
Blankinship, J. C., P. A. Niklaus, and B. A. Hungate. 2011. A meta-analysis of responses of soil
biota to global change. Oecologia 165:553-565.
Chamberlain, P., I. Bull, H. J. Black, P. Ineson, and R. Evershed. 2004. Lipid content and carbon
assimilation in Collembola: implications for the use of compound-specific carbon isotope
analysis in animal dietary studies. Oecologia 139:325-335.
Clark, J. S. 2009. Beyond neutral science. Trends in Ecology & Evolution 24:8-15.
Clark, J. S. 2009. Beyond neutral science. Trends in Ecology & Evolution 24:8-15.
Eisenhauer, N., S. Cesarz, R. Koller, K. Worm, and P. B. Reich. 2012. Global change
belowground: impacts of elevated CO2, nitrogen, and summer drought on soil food webs
and biodiversity. Global Change Biology 18:435-447.
Ferreira, L. and M. S. Silva. 2001. Biodiversity under rocks: the role of microhabitats in
structuring invertebrate communities in Brazilian outcrops. Biodiversity and
Conservation 10:1171–1183.
Giller, P. S. 1996. The diversity of soil communities, the ‘poor man's tropical rainforest’.
Biodiversity and Conservation 5:135-168.
Hyvonen, R. and T. Persson. 1998. Effects of fungivorous and predatory arthropods on
nematodes and tardigrades in microcosms with coniferous forest soils. Biology and
Fertility of Soils 21:121-127.
Irmler, U. 1998. Spatial heterogenity of biotic activity in the soil of a beech wood and
consequences for the application of the bait-lamina-test. Pedobiologia 42:102-108.
Leibold, M. A. and M. A. McPeek. 2006. Coexistence of the niche and neutral perspectives in
community ecology. Ecology 87:1399-1410.
Liu, L. and T. L. Greaver. 2010. A global perspective on belowground carbon dynamics under
nitrogen enrichment. Ecology Letters 13:819-828.
Maraun, M., J. A. Salamon, K. Schneider, M. Schaefer, and S. Scheu. 2003. Oribatid mite and
collembolan diversity, density and community structure in a moder beech forest (Fagus
sylvatica): Effects of mechanical disturbances. Soil Biology & Biochemistry 35:1387-
1394.
Nielsen, U. N., G. H. Osler, C. D. Campbell, R. Neilson, D. F. Burslem, and R. van der Wal.
2010. The enigma of soil animal species diversity revisited: the role of small-scale
heterogeneity. Plos One 5:e11567.
Peschel, K., R. A. Norton, S. Scheu, and M. Maraun. 2006. Do oribatid mites live in enemy-free

164
space? Evidence from feeding experiments with the predatory mite Pergamasus
septentrionalis. Soil Biology & Biochemistry 38:2985-2989.
Pollierer, M. M., R. Langel, S. Scheu, and M. Maraun. 2009. Compartmentalization of the soil
animal food web as indicated by dual analysis of stable isotope ratios (N-15/N-14 and C-
13/C-12). Soil Biology & Biochemistry 41:1221-1226.
Scheu, S. 2002. The soil food web: structure and perspectives. European Journal of Soil Biology
38:11-20.
Schneider, K., S. Migge, R. A. Norton, S. Scheu, R. Langel, A. Reineking, and M. Maraun. 2004.
Trophic niche differentiation in soil microarthropods (Oribatida, Acari): evidence from
stable isotope ratios (15
N/14
N). Soil Biology and Biochemistry 36:1769-1774.
Vanbergen, A. J., A. D. Watt, R. Mitchell, A. M. Truscott, S. C. F. Palmer, E. P. Ivits E., T. H.
Jones, and J. P. Sousa. 2007. Scale-specific correlations between habitat heterogeneity
and soil fauna diversity along a landscape structure gradient. Oecologia 153:713-725.