Embed Size (px)
Citation preview

Virginia Commonwealth University Virginia Commonwealth University
VCU Scholars Compass VCU Scholars Compass
Theses and Dissertations Graduate School
2009
ORGAN MOTION AND IMAGE GUIDANCE IN RADIATION THERAPY ORGAN MOTION AND IMAGE GUIDANCE IN RADIATION THERAPY
Jining Zhou Virginia Commonwealth University
Follow this and additional works at: https://scholarscompass.vcu.edu/etd
Part of the Biomedical Engineering and Bioengineering Commons
© The Author
Downloaded from Downloaded from https://scholarscompass.vcu.edu/etd/1681
This Dissertation is brought to you for free and open access by the Graduate School at VCU Scholars Compass. It has been accepted for inclusion in Theses and Dissertations by an authorized administrator of VCU Scholars Compass. For more information, please contact [email protected].

© Copyright by Jining Zhou
2009
All Rights Reserved
ORGAN MOTION AND IMAGE GUIDANCE IN RADIATION THERAPY
A dissertation submitted in partial fulfillment of the requirements for the degree of Doctor of Philosophy at Virginia Commonwealth University.
By
JINING ZHOU M.S., Virginia Commonwealth University, 2001
B.S., Central South University of Science and Technology, China, 1992
Director: DING-YU FEI, PH.D. ASSOCIATE PROFESSOR, DEPARTMENT OF BIOMEDICAL ENGINEERING
VIRGINIA COMMONWEALTH UNIVERSITY RICHMOND, VIRGINIA
May, 2009

ii
Acknowledgement
There are many people I would like to thank for their various contributions to the
research presented in this dissertation.
First of all, I would like to thank my advisor, Dr. Ding-Yu Fei, for his
encouragement, support, and mentoring over the past several years. He guided me to
form the dissertation topic, helped me to keep the research on track, and encouraged me
to solve the technical problems with persistence. I cannot imagine having a better advisor
and mentor for my Ph.D., and without his knowledge and perceptiveness, I would never
have finished this work.
I would like to thank Dr. Steve Jiang and Dr. Lily Wang from the Department of
Radiation Oncology, University of California, San Diego, for sharing their views and
interests on my research topics, and giving their feedback on specific technical details of
4DCT imaging and deformable registration. I would like to thank Dr. Yeh-Chi Lo from
Mount Sinai Medical Center, NYC, for his valuable suggestion on the clinical
implementation of image guidance on tumor margin reduction.
I would like to thank all my colleagues from the Department of Radiation
Oncology, Sharp Grossmont hospital, for their help to obtain the clinical data I needed in
this work.

iii
I would also like to thank my committee members, Dr. Martin L. Lenhardt and
Dr. Ou Bai from School of Engineering, Dr. Kenneth A. Kraft and Dr. Azhar Rafiq from
School of Medicine, for carefully reviewing this manuscript, and for offering criticism
and suggestions.
Finally, I dedicate this dissertation to my husband, Li-ke Gao, for his support in
every respect.

iv
Table of Contents
Page
List of Tables ................................................................................................................... viii
List of Figures ..................................................................................................................... x
List of Abbreviations ....................................................................................................... xiii
Abstract ............................................................................................................................ xvi
CHAPTER 1 Introduction: Image Guided Radiation Therapy and Organ Motion ............ 1
1.1 Background............................................................................................................... 1
1.2 Current Techniques in Image Guided Radiation Therapy ........................................ 4
1.2.1 Electronic Portal Imaging Devices .................................................................... 4
1.2.2 ExacTrac Novalis System .................................................................................. 6
1.2.3 On-Board Imager™ ........................................................................................... 7
1.2.4 Helical TomoTherapy System ......................................................................... 10
1.2.5 Four-Dimensional Computed Tomography..................................................... 17
1.3 Terminology Related to Motion of the Tumor Volume ......................................... 18
1.4 Purpose of the Study............................................................................................... 18
1.5 Roadmap ................................................................................................................. 21
CHAPTER 2 Analysis of Daily Setup Variation with TomoTherapy Mega Voltage
Computed Tomography (MVCT)..................................................................................... 22
2.1 Introduction............................................................................................................. 22

v
2.2 Methods and Materials............................................................................................ 23
2.2.1 Patients and Image Registration between MVCT and KVCT ......................... 23
2.2.2 Inter- and Intrafractional Uncertainties............................................................ 25
2.3 Results and Discussion ........................................................................................... 27
2.4 Conclusions............................................................................................................. 34
CHAPTER 3 Image Guided Stereotactic Body Radiotherapy for Lung Tumors Using
BodyLoc System with TomoTherapy............................................................................... 36
3.1 Introduction............................................................................................................. 36
3.2 MIDCOTM BodyLoc System ................................................................................. 37
3.3 Methods and Materials............................................................................................ 40
3.3.1 Patients Selection, Simulation and Immobilization ......................................... 40
3.3.2 Interfractional and Intrafractional Setup Uncertainties.................................... 42
3.3.3 Verification of System Mechanical Accuracy ................................................. 43
3.4 Results and Discussion ........................................................................................... 43
3.4.1 Hexaphant Accuracy Test ................................................................................ 43
3.4.2 Inter- and Intrafractional Setup Uncertainties.................................................. 45
3.5 Conclusions............................................................................................................. 55
CHAPTER 4 Implementation of 4DCT and Deformable Registration for Accurate
Moving Target Delineation............................................................................................... 56
4.1 Introduction: Motion Artifacts with 3DCT Imaging and Related Problems .......... 56
vi
4.2 Image Acquisition with 4DCT and Delineation of Targets.................................... 59
4.3 Rigid and Deformable Registration ........................................................................ 63
4.4 Deformable Registration Algorithm ....................................................................... 65
4.5 Procedure of Performing Deformable Registration ................................................ 68
4.6 Registration Results Assessment ............................................................................ 69
4.7 Conclusions............................................................................................................. 71
CHAPTER 5 Evaluation of Lung Tumor Mobility and Dosimetric Effects with 4DCT . 73
5.1 Methods and Materials............................................................................................ 73
5.1.1 Target Volume Definition................................................................................ 73
5.1.2 Target Volume Analysis and Dosimetric Evaluation ...................................... 74
5.1.3 Lyman NTCP Model........................................................................................ 76
5.2 Results and Discussion ........................................................................................... 77
5.2.1 Target Volume Analysis .................................................................................. 77
5.2.2 Comparison of Target Volumes from 3DCT and 4DCT ................................. 80
5.2.3 Dosimetric Evaluation of Target Volumes ...................................................... 82
5.3 Conclusions............................................................................................................. 88
CHAPTER 6 Conclusions and Future Work .................................................................... 89
6.1 Conclusions............................................................................................................. 89
6.2 Future Work............................................................................................................ 93
6.2.1 Unresolved Issues in 4DCT ............................................................................. 93
vii
6.2.2 Solving the Problem of Tumor Mobility without 4DCT ................................. 94
6.2.3 Adaptive Planning for Changing Target .......................................................... 96
References....................................................................................................................... 102
Appendix A..................................................................................................................... 120
Appendix B ..................................................................................................................... 122
Vita.................................................................................................................................. 126

viii
List of Tables Page
Table 2.1 Mean and standard deviation of interfractional setup variations...................... 28
Table 2.2 Interfractional uncertainties and maximum displacements for six anatomic
sites. .......................................................................................................................... 28
Table 2.3 Significance (p<0.05) of site-dependent interfractional setup uncertainties. ... 32
Table 2.4 Calculated CTV-to-PTV margins for global margin, interfractional setup
margin and internal motion margin........................................................................... 33
Table 3.1 Hexaphant Accuracy Test (HAT) .................................................................... 45
Table 3.2 Summary of patient disease location, stages and treatment parameters......... 47
Table 3.3 Means, standard deviations, and maximum shifts from inter- and
intrafractional setup uncertainties with BodyLoc immobilization............................ 47
Table 3.4 Comparison of Intrafractional uncertainties with and without BodyLoc
thermoplastic body mask immobilization................................................................. 51
Table 3.5 Pearson’s correlation coefficients between SDs of random displacement and
patient variables including age, weight, sex, treatment time, and GTV volume. ..... 52
Table 5.1 Tumor volume definition for both 3DCT and 4DCT in the study.................... 74
Table 5.2 GTV volume study and GTV center motion during respiratory cycle ............. 78
Table 5.3 Target volume comparisons for six patients ..................................................... 81
Table 5.4 Normal tissue complication probability (NTCP) parameter values.................83

ix
Table 5.5 Dosimetric comparisons between 3D and 4D plans ......................................... 83
Table 5.6 Dosimetric comparisons of OARs between 3D and 4D plans......................... 84
Table 5.7 NTCP comparison between OARs .................................................................. 86
x
List of Figures Page
Figure 1.1 Comparison of traditional conformal 3D planning and IMRT planning........... 3
Figure 1.2 ExacTrac Novalis system (Brain LAB)............................................................. 7
Figure 1.3 Example of Clinical setup with OBI.. ............................................................... 8
Figure 1.4 Illustration of TomoTherapy Hi•ART System components............................ 13
Figure 1.5 Diagram of TomoTherapy mega-voltage CT imaging chain .......................... 14
Figure 1.6 Example of image registration with prostate using TomoTherapy unit ..........16
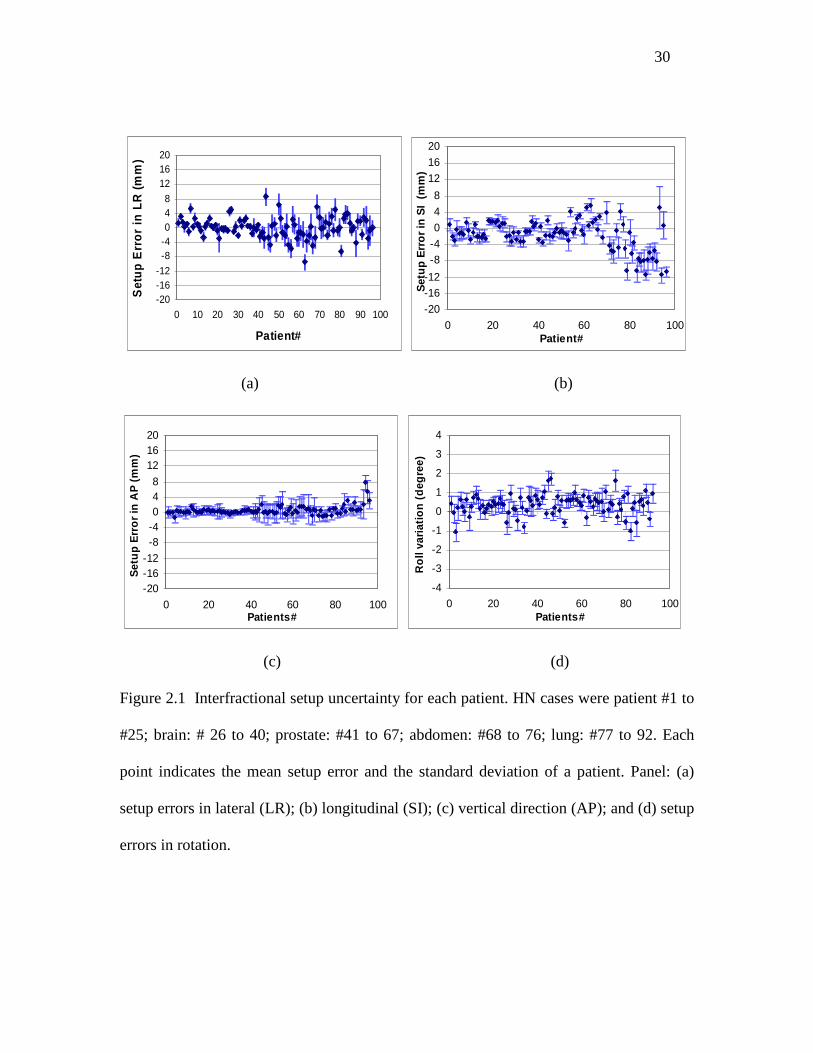
Figure 2.1 Interfractional setup uncertainty for each patient ........................................... 30
Figure 2.2 Comparison of interfractional and intrafractional uncertainties in the case of
HN (1), prostate (2), abdomen (3), and lung (4) ....................................................... 31
Figure 3.1 MIDCOTM BodyLoc system ............................................................................ 39
Figure 3.2 HexaPhant setup with film cassette oriented in sagittal and coronal planes for
positioning accuracy test........................................................................................... 44
Figure 3.3 Resultant profiles from the HAT..................................................................... 44
Figure 3.4 SBRT lung patient CT simulation setup with MIDCO BodyLoc system. ..... 46
Figure 3.5 Comparison of inter- and intrafractional setup variations for eight patients... 49
Figure 3.6 Comparison of the averages and standard deviations of inter- and
intrafractional setup uncertainties. ............................................................................ 50
xi
Figure 3.7 Intrafractional organ motion comparison for patients with and without
BodyLoc immobilization devices ............................................................................. 52
Figure 4.1 Distortion of the dome of the liver at the lung–diaphragm interface observed
from a patient CT scan caused from respiratory motion........................................... 57
Figure 4.2 Different artifacts obtained by periodically moving a rounded subject on a
sliding table during standard axial CT scanning....................................................... 58
Figure 4.3 Tumor movement during (a) exhale, and (b) inhale phase............................. 59
Figure 4.4. Illustration of phase and lung volume changes during a respiratory cycle .... 61
Figure 4.5 Flowchart of obtaining automatic segmentation delineation from 4DCT...... 63
Figure 4.6 Flowchart of performing deformable registration with ITK toolkits ............. 69
Figure 4.7 Image fusion from phase T0 (EOI) to phase T5 (EOE) with image resolution
of 256×256×136........................................................................................................ 70
Figure 4.8 Image fusion results from phase T0 (EOI) to phase T5 (EOE) with different
resolutions ................................................................................................................. 72
Figure 5.1 Volumetric variations of GTV volume over the respiratory cycle for patient #1
and patient #5............................................................................................................ 79
Figure 5.2 GTV volume centroid motion trajectories for patient #1(a) and patient #5 (b)
throughout respiratory cycle in three dimensions. .................................................... 80
Figure 5.3 Comparison of PTV3D (red) and PTV4D (yellow) ........................................... 82
xii
Figure 5.4 Comparison of heart DVHs (a) and ipsilateral lung DVHs (b) between 3D plan
and 4D plan from patient #4 planning data............................................................... 85
Figure 6.1 Example of 4DCT where respiratory cycle irregularities have produced
significant mismatches near the base of the lung...................................................... 94
Figure 6.2 Changes in lung tumor volume and shape during the radiation treatment ..... 97
Figure 6.3 Examples of tumor volume changes in a head and neck cancer patient ......... 99
Figure 6.4 Conceptual flow diagram of adaptive TomoTherapy.................................... 100
xiii
List of Abbreviations
3DCT Three-Dimensional Computed Tomography
4DCT Four-Dimensional Computed Tomography
ACR American College of Radiology
AP Anterior-Posterior (Vertical)
CT Computed Tomography
CBCT Cone Beam CT
CTV Clinical Target Volume
Dmax Maximum Dose to Target
Dmin Minimum Dose to Target
Dmean Mean Dose to Target
DQA Delivery Quality Assurance
DRR Digitally Reconstructed Radiograph
DOF Degree of Freedom
DVH Dose Volume Histogram
EOE End of Exhale
EOI End of Inhale
EPID Electronic Portal Image Device
fx Fraction
GTV Gross Tumor Volume
Gy Gray (A unit of absorbed radiation)
xiv
HAT Hexaphant Accuracy Test
HN Head and Neck
ICRU International Commission on Radiation Units and Measurements
IGRT Image Guided Radiation Therapy
IMRT Intensity Modulated Radiation Therapy
ITK Insight Tool Kit
ITV Internal Target Volume
KVCT Kilo Voltage Computed Tomography
LR Left-Right (Lateral)
M Slope factor in Lyman Normal Tissue Complication Probability model
MVCT Mega Voltage Computed Tomography
N Volume-effect parameter in Lyman Normal Tissue Complication
Probability model
NTCP Normal Tissue Complication Probability
OAR Organ at Risk
PET Positron Emission Tomography
PTV Planning Target Volume
PTV3D Planning Target Volume drawn from 3D CT scan
PTV4D Target Volume drawn from 4D CT scan
RPM Real-time Position Management
SBRT Stereotactic Body Radiation Therapy
SI Superior-Inferior (Longitudinal)
xv
SD Standard Deviation
SPSS Statistical Package for the Social Sciences
TD Tolerance Dose
TD5/5 Tolerance dose that could cause 5% complication within 5 years
TD50/5 Tolerance dose that could cause 50% complication within 5 years
xvi
Abstract
ORGAN MOTION AND IMAGE GUIDANCE IN RADIATION THERAPY
By Jining Zhou, Ph.D.
A dissertation submitted in partial fulfillment of the requirements for the degree of Doctor of Philosophy at Virginia Commonwealth University.
Virginia Commonwealth University, 2009
Major Director: Ding-Yu Fei, Ph.D. Associate Professor, Department of Biomedical Engineering
Organ motion and inaccurate patient positioning may compromise radiation therapy
outcome. With the aid of image guidance, it is possible to allow for a more accurate organ
motion and motion control study, which could lead to the reduction of irradiated healthy
tissues and possible dose escalation to the target volume to achieve better treatment results.
The studies on the organ motion and image guidance were divided into the following four
sections.
xvii
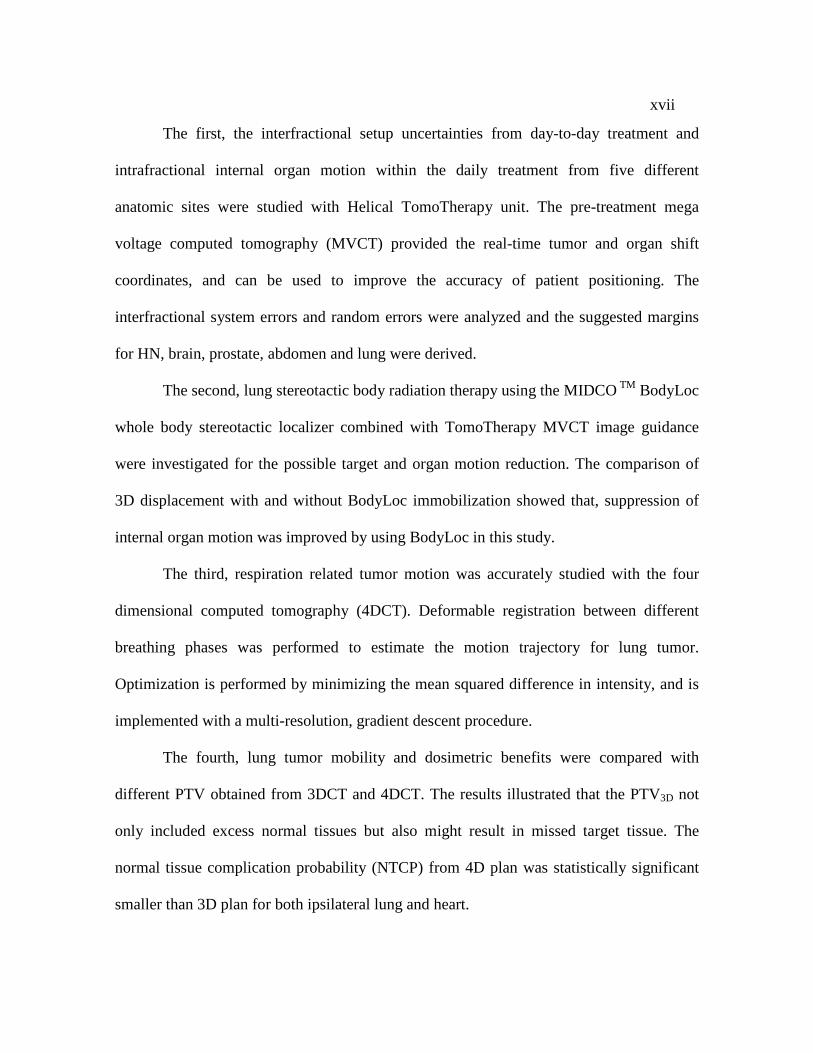
The first, the interfractional setup uncertainties from day-to-day treatment and
intrafractional internal organ motion within the daily treatment from five different
anatomic sites were studied with Helical TomoTherapy unit. The pre-treatment mega
voltage computed tomography (MVCT) provided the real-time tumor and organ shift
coordinates, and can be used to improve the accuracy of patient positioning. The
interfractional system errors and random errors were analyzed and the suggested margins
for HN, brain, prostate, abdomen and lung were derived.
The second, lung stereotactic body radiation therapy using the MIDCO TM BodyLoc
whole body stereotactic localizer combined with TomoTherapy MVCT image guidance
were investigated for the possible target and organ motion reduction. The comparison of
3D displacement with and without BodyLoc immobilization showed that, suppression of
internal organ motion was improved by using BodyLoc in this study.
The third, respiration related tumor motion was accurately studied with the four
dimensional computed tomography (4DCT). Deformable registration between different
breathing phases was performed to estimate the motion trajectory for lung tumor.
Optimization is performed by minimizing the mean squared difference in intensity, and is
implemented with a multi-resolution, gradient descent procedure.
The fourth, lung tumor mobility and dosimetric benefits were compared with
different PTV obtained from 3DCT and 4DCT. The results illustrated that the PTV3D not
only included excess normal tissues but also might result in missed target tissue. The
normal tissue complication probability (NTCP) from 4D plan was statistically significant
smaller than 3D plan for both ipsilateral lung and heart.
1
CHAPTER 1
Introduction: Image Guided Radiation
Therapy and Organ Motion
The patient’s position and anatomy during the course of radiation therapy usually
vary from those used for therapy planning purposes. This is mainly due to patient
movement, inaccurate patient positioning, and organ motion. Consequently, the actual
received dose distribution differs from the planned absorbed dose distribution. This
difference will compromise the clinical treatment results with either insufficient dose
coverage of targeted tumor or overdose to normal tissue. A detailed study needs to be
conducted to determine how much the position related organ motion could exist during
routine clinical treatment, and how much improvement could be reached with the help of
precise patient position systems and rigid immobilization devices. However, even when
the external body is immobilized and rigid, the internal motion of organs due to
physiological processes still remains a challenge which affects the treatment results. With
the usage of the recently developed four dimensional CT scanner, the internal organ
motion could be studied in a more accurate way so better treatment results could be
achieved.
1.1 Background
Radiation therapy plays an important role in multi-modality treatment for cancer
patients. Its effectiveness in controlling a tumor is proportional to the dose of radiation
delivered, and this is traditionally explained in a linear–quadratic model of cell killing.1

2
In this model, the radiation dose to tumor killing levels is limited by the damage caused
to nearby normal tissues, or in other words, the irradiated volume of normal tissue during
the development of radiation-induced toxicity. To lift this limit, one method is to create a
conformal dose distribution that tightly matches the shape of the targeted tumor volume,
without increasing the irradiated volume of nearby normal tissues. Recent technical
advances in planning and delivering intensity-modulated radiation therapy (IMRT)
provide such an unprecedented means that produces exquisitely shaped radiation doses to
treat tumor with conformal high dose and, at the same time, spare normal tissue with
sharp dose gradient.2-4 Figure 1.1 demonstrates the features and advances of IMRT beam
delivery characteristics to target and normal tissues, as compared to traditional 3D
conformal radiation therapy.
By allowing the escalation of the radiation dose, IMRT has increased the tumor
killing levels. It has further improved the outcomes by increasing organ sparing,
providing better local control of disease, and reducing treatment associated morbidity and
toxicity, and thus enhances quality of life.5, 6
During the IMRT treatment, accurate patient setup and reproducible anatomic
motion are essential in minimizing the margin and providing high dose gradient around
tumor. In clinic, large uncertainties exist in tumor motion management, inaccurate patient
positioning, and target localization due to inter- and intrafractional organ motions. (The
definition of these motions will be explained later in this chapter.) Patient’s anatomy and
position during the course of radiation therapy usually vary from those when they
underwent simulation for the purpose of treatment planning. Consequently, the actual
received absorbed dose distribution differs from the planned absorbed dose distribution.
3
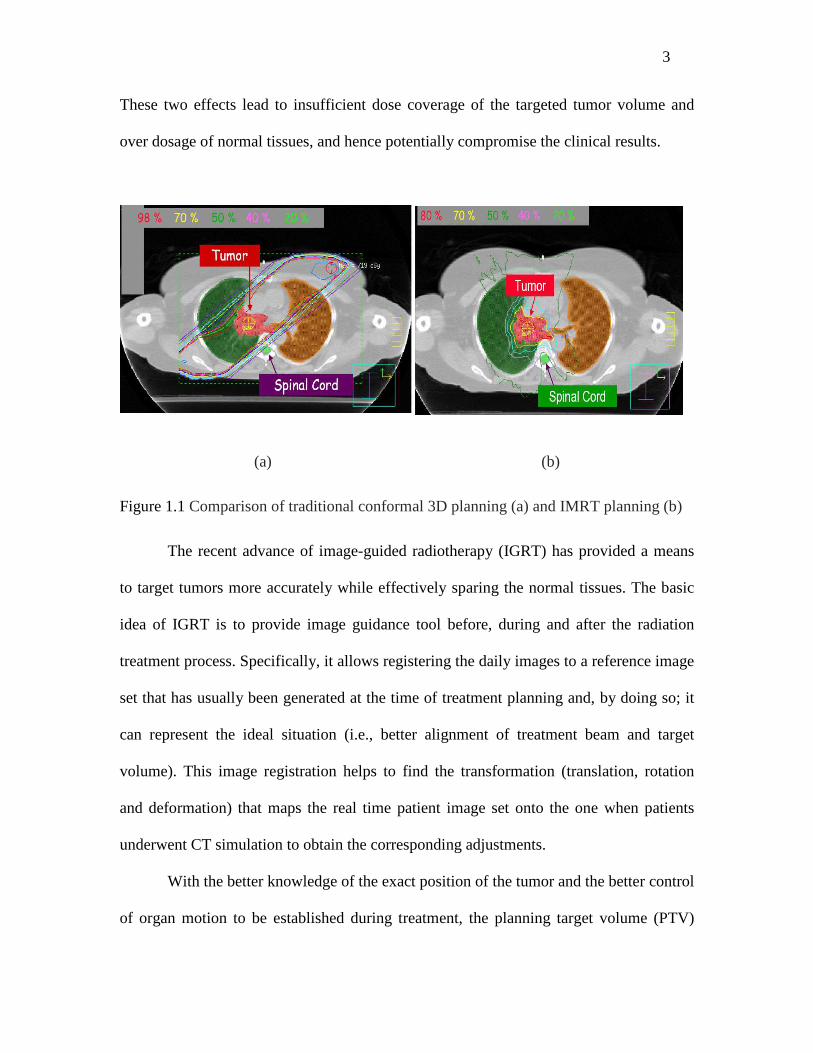
These two effects lead to insufficient dose coverage of the targeted tumor volume and
over dosage of normal tissues, and hence potentially compromise the clinical results.
(a) (b)
Figure 1.1 Comparison of traditional conformal 3D planning (a) and IMRT planning (b)
The recent advance of image-guided radiotherapy (IGRT) has provided a means
to target tumors more accurately while effectively sparing the normal tissues. The basic
idea of IGRT is to provide image guidance tool before, during and after the radiation
treatment process. Specifically, it allows registering the daily images to a reference image
set that has usually been generated at the time of treatment planning and, by doing so; it
can represent the ideal situation (i.e., better alignment of treatment beam and target
volume). This image registration helps to find the transformation (translation, rotation
and deformation) that maps the real time patient image set onto the one when patients
underwent CT simulation to obtain the corresponding adjustments.
With the better knowledge of the exact position of the tumor and the better control
of organ motion to be established during treatment, the planning target volume (PTV)
4
margins of patient set-up can be substantially decreased (e.g., from centimeters to
millimeters). This leads to a substantial reduction in the volume of radiated normal tissue
volume.7-10
1.2 Current Techniques in Image Guided Radiation Therapy
The clinical applications of IGRT for patient set-up verification and correction
can be generally classified as either an off-line or an online approach. The off-line
approach, also known as adaptive radiotherapy (ART), monitors the position of the
patient during a limited number of fractions and adapts the safety margins and the
treatment plan accordingly. The online approach offers the real time observation and
adjustment of patient position, which usually requires automating the quantification and
correction of target localization errors so it can be efficiently used in clinical routine.
IGRT approaches make use of imaging modalities that range from planar imaging
to fluoroscopy to CT based solutions. Currently, the four mostly frequently used IGRT
techniques are electronic portal imaging devices, ExacTrac Novalis system, Varian On-
Board Imager™, and TomoTherapy. The following sections describe each of the first
three techniques, and details the last one, as TomoTherapy is the one main platform
studied in this dissertation. Additionally, this section also presents the recent
breakthrough of IGRT, the four-dimensional CT (4DCT) technique that can generate
spatial and temporal information on mobility in a single investigation.
1.2.1 Electronic Portal Imaging Devices
For the last 30 years, weekly port films have been used as routine clinical
standard for ensuring accurate targeting of external beam radiotherapy.11 The early
5
studies on port films indicated the benefits of portal film verification before the treatment
on the weekly basis. 12, 13 The subsequent studies have characterized the magnitude and
nature of setup errors for a variety of clinical conditions. The importance of geometric
accuracy has driven the development of digital imagers that can monitor treatment
accuracy more effectively than weekly port filming,14 with minimal increase in
workload.15 The modern era of electronic portal imaging devices (EPIDs) began in the
early 1980s with the demonstration of a fluoroscopic system to acquire megavoltage
transmission images.16 The introduction of the scanning liquid ionization chamber system
in 1990 17 was quickly followed by the introduction of camera-based fluoroscopic EPIDs
from other manufacturers.
An EPID can acquire images automatically with near real time display, store them
digitally, and provide quantitative analysis tools. Studies have shown that the increased
portal imaging frequency can reveal daily variations in patient alignment that are not
observed with weekly filming.18, 19 Furthermore, an EPID can provide immediate patient
alignment information, without the delay involved in processing a film. This instant-
image availability enables the development of on-line correction protocols and daily
targeting adjustments.20, 21 In addition to aiding acquisition, the digital nature of EPIDs
can be exploited to enhance the portal review process. Studies have examined the process
of subjective portal image evaluation by clinicians and have found a wide variation
among reviewers in reporting setup deviations in portal images.22, 23 Many EPID systems
offer computer-assisted image review with anatomy-matching routines and quantitative
alignment analysis.
6
However, poor soft tissue contrast and unclear projection of the bony anatomy are
usually observed in this approach. To improve the situation, planar KV x-ray imaging has
been implemented in a variety of systems. Although these systems have shown
significantly increased contrast for bony structure differentiation, observing soft-tissue
detail remains problematic and correcting the daily organ motion is still challenging.
1.2.2 ExacTrac Novalis System
The ExacTrac Novalis system, developed by Brain LAB company, combines a
robotic couch and an infrared tracking system to subtract patient’s anatomy information
on the basis of bony structures or the implanted radio-opaque markers in the tumor, and
superpose the real time two orthogonal images on the planning orthogonal digitally
reconstructed radiographs (DRRs).24-26 In this system, a set of the infrared reflective
markers is placed on the patient’s chest area that allows real-time monitoring of the
patient’s position in space and extraction of a respiratory signal (Figure 1.2). Two flat-
panel detectors mounted to the ceiling and two X-ray tubes embedded in the floor are
used to subtract 3D information of the patient’s anatomy on the basis of bony structures
or implanted radio-opaque markers. Robotic couch is used to adjust translational and
rotational set-up errors before treatment. The beam on–off signal of the linear accelerator
(LINAC) is triggered by the respiratory signal that is obtained from the real-time tracking
of the infrared reflective markers.
7
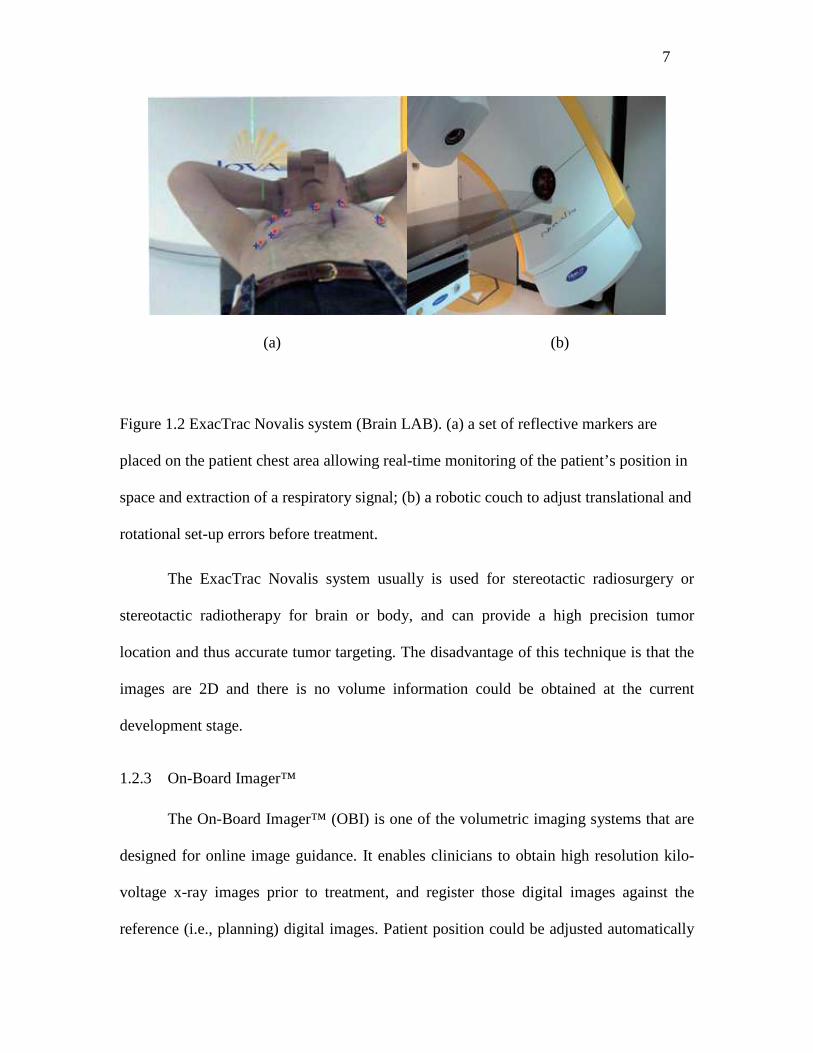
(a) (b)
Figure 1.2 ExacTrac Novalis system (Brain LAB). (a) a set of reflective markers are
placed on the patient chest area allowing real-time monitoring of the patient’s position in
space and extraction of a respiratory signal; (b) a robotic couch to adjust translational and
rotational set-up errors before treatment.
The ExacTrac Novalis system usually is used for stereotactic radiosurgery or
stereotactic radiotherapy for brain or body, and can provide a high precision tumor
location and thus accurate tumor targeting. The disadvantage of this technique is that the
images are 2D and there is no volume information could be obtained at the current
development stage.
1.2.3 On-Board Imager™
The On-Board Imager™ (OBI) is one of the volumetric imaging systems that are
designed for online image guidance. It enables clinicians to obtain high resolution kilo-
voltage x-ray images prior to treatment, and register those digital images against the
reference (i.e., planning) digital images. Patient position could be adjusted automatically
8
when necessary. A kilovoltage x-ray source and large-area flat-panel digital detector on
either the Clinac® or Trilogy™ medical linear accelerators are used for radiography,
volumetric cone-beam CT, or fluoroscopy. In this highly integrated form, the control
system combines imaging and delivery components in a single machine.
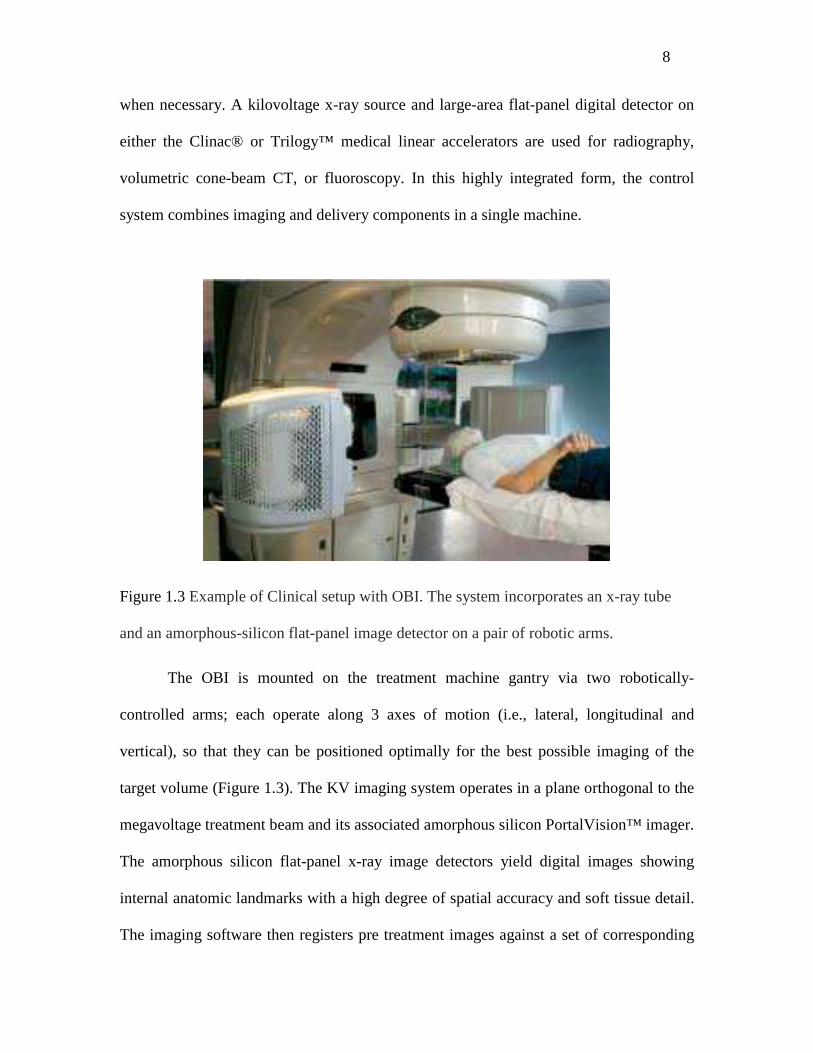
Figure 1.3 Example of Clinical setup with OBI. The system incorporates an x-ray tube
and an amorphous-silicon flat-panel image detector on a pair of robotic arms.
The OBI is mounted on the treatment machine gantry via two robotically-
controlled arms; each operate along 3 axes of motion (i.e., lateral, longitudinal and
vertical), so that they can be positioned optimally for the best possible imaging of the
target volume (Figure 1.3). The KV imaging system operates in a plane orthogonal to the
megavoltage treatment beam and its associated amorphous silicon PortalVision™ imager.
The amorphous silicon flat-panel x-ray image detectors yield digital images showing
internal anatomic landmarks with a high degree of spatial accuracy and soft tissue detail.
The imaging software then registers pre treatment images against a set of corresponding
9
reference images. These reference images can be radiographs acquired on a simulator or
they can be DRR images computed from the volumetric CT data set used in treatment
planning. The matched image sets are then overlaid with registration tools for visual
verification and confirmation. Once the match is accepted, the corrected position offsets
are automatically downloaded to the treatment couch, which can be repositioned remotely
from outside the treatment vault.
The most useful imaging modality in this system is cone beam CT (CBCT). In
this mode, an entire volumetric CT data set is reconstructed with a single gantry rotation,
while the patient and treatment couch remain stationary. The overall CBCT process is
very similar to the radiographic repositioning technique, except that 3D CBCT images,
rather than a pair of radiographs, are acquired. The CBCT operating mode is preferred
when direct visualization of 3D soft-tissue detail is important for patient repositioning
prior to treatment, e.g., prostate, pancreas, liver tumor, etc. CBCT imaging can also be
used when small targets are being treated without fiducial markers, or when a small
number of treatment fractions are being used (e.g., hypofractional radiosurgery), or when
adaptive planning is desired.27-30 In the OBI system, image acquisition, image
registration, image match and verification, and automatic remote repositioning of the
treatment couch are all integrated to optimize efficiency.
The disadvantages of kilo-voltage cone-beam CT are that it is not of diagnostic
quality, and the soft tissue contrast need to be further improved. Another disadvantage is
that the imaging acquisition time is too long for real-time volumetric scanning.
10
1.2.4 Helical TomoTherapy System
Helical TomoTherapy is a volumetric image-guided, fully dynamic, IMRT
delivery system. It was developed at the University of Wisconsin and is now
commercially manufactured as the TomoTherapy Hi·Art System.31, 32 While standard
radiotherapy is delivered using a few static fields, helical TomoTherapy delivers
treatment with a rotating, intensity-modulated fan beam. The beam delivery is similar to
that of helical or spiral computed tomography (CT) and requires slip rings to transmit
power and data. The patient is continuously translated through the ring gantry resulting in
a helical source trajectory about the patient. The ring gantry provides a stable and
accurate platform to perform tomographic verification of both the patient setup and
delivered dose. The design of the helical TomoTherapy unit allows for continuous
delivery over 360 degree beam angles.
In addition to the full integration of IMRT delivery, an important advance with
helical TomoTherapy over the other current systems is the ability to provide accurate
verification of radiation delivery via onboard megavoltage computed tomography
(MVCT). The daily use of its pretreatment MVCT imaging for patient setup verification
allows clinicians to correct for setup errors in a real time manner. In particular, image
guidance using MVCT allows for direct target position verification when the patient is in
the actual treatment position just prior to therapy delivery.
1.2.4.1 Architecture of Helical TomoTherapy System
The TomoTherapy treatment unit has an 85 cm source to axis distance (SAD) and
produces a fan beam with a width of 40 cm and a length of 1.0, 2.5 or 5 cm.
11
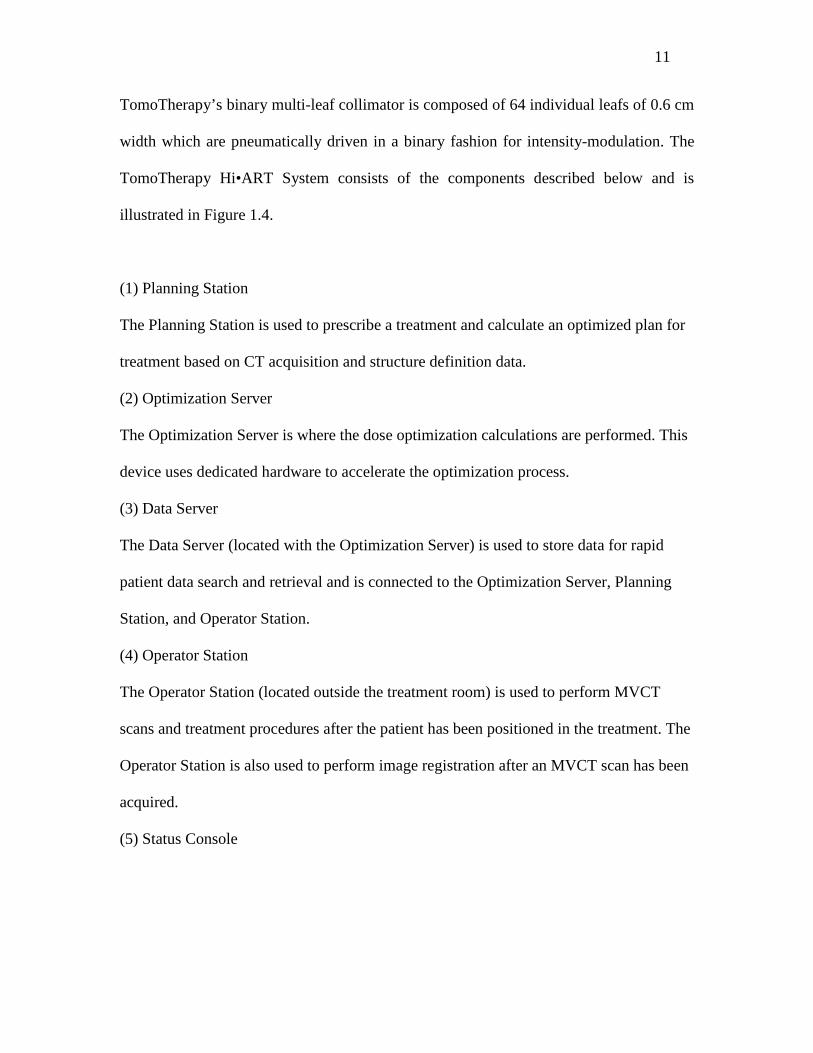
TomoTherapy’s binary multi-leaf collimator is composed of 64 individual leafs of 0.6 cm
width which are pneumatically driven in a binary fashion for intensity-modulation. The
TomoTherapy Hi•ART System consists of the components described below and is
illustrated in Figure 1.4.
(1) Planning Station
The Planning Station is used to prescribe a treatment and calculate an optimized plan for
treatment based on CT acquisition and structure definition data.
(2) Optimization Server
The Optimization Server is where the dose optimization calculations are performed. This
device uses dedicated hardware to accelerate the optimization process.
(3) Data Server
The Data Server (located with the Optimization Server) is used to store data for rapid
patient data search and retrieval and is connected to the Optimization Server, Planning
Station, and Operator Station.
(4) Operator Station
The Operator Station (located outside the treatment room) is used to perform MVCT
scans and treatment procedures after the patient has been positioned in the treatment. The
Operator Station is also used to perform image registration after an MVCT scan has been
acquired.
(5) Status Console

12
The Status Console (located adjacent to the Operator Station) is used to select the
procedure type and start a procedure. It also supports a Stop button and Emergency-stop
button.
(6) Power Control Panel
The Power Control Panel is mounted to the side of the gantry enclosure. It is used
primarily to turn power ON and OFF to the system and indicate the status of the system
during operation.
(7) Positioning Control Panel
A Positioning Control Panel is mounted to the front-left and front-right side of the gantry
enclosures. Each panel is used to manually and automatically move the couch during
patient setup, as well as give the current position of the couch and the moveable lasers.
(8) Rotating Gantry Assembly
The linear accelerator and CT detector subsystems are mounted to a covered Rotating
Gantry Assembly. The temperature control subsystem is also mounted on the rotating
gantry.
(9) Patient Couch
The Patient Couch is a composite flat couch top used to support the patient and move the
patient through the rotating gantry.
(10) Laser System
A Class II laser system (not pictured in Figure 1) is used with the delivery subsystem to
help the operator position the patient for MVCT and treatment procedures.
13
Figure 1.4 Illustration of TomoTherapy Hi•ART System components (picture from
TomoTherapy operation menu)
14
1.2.4.2 MVCT Imaging Chain
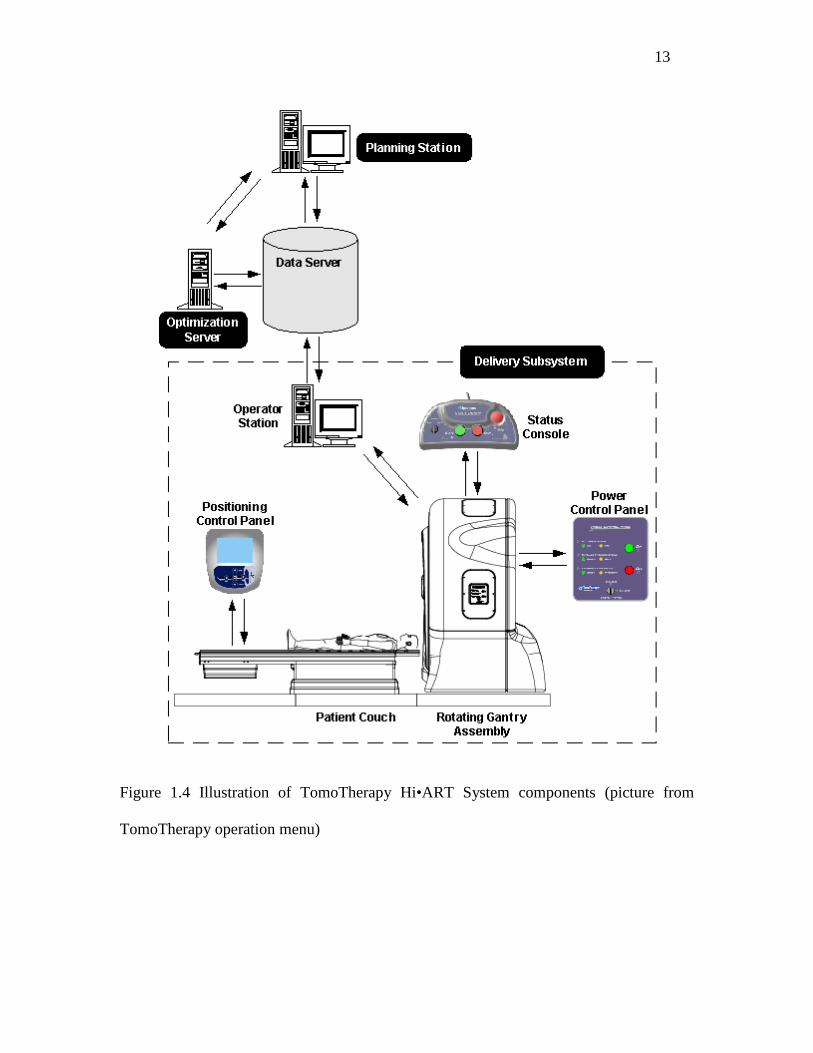
MVCT images system consists of a ring gantry with a xenon ion-chamber array
mounted opposite the radiation source.31 The nominal energy of the incident electron
beam is reduced from 6 MeV to 3.5 MeV 33 for the imaging mode. The source-to-detector
distance is 145 cm and the source-to-axis distance is 85 cm. The imaging field of view
(FOV) is defined by the width of the HI-ART multi-leaf collimator, which projects to 40
cm at isocenter. Figure 1.5 illustrates the Diagram of TomoTherapy mega-voltage CT
imaging chain.
Figure 1.5 Diagram of TomoTherapy mega-voltage CT imaging chain
15
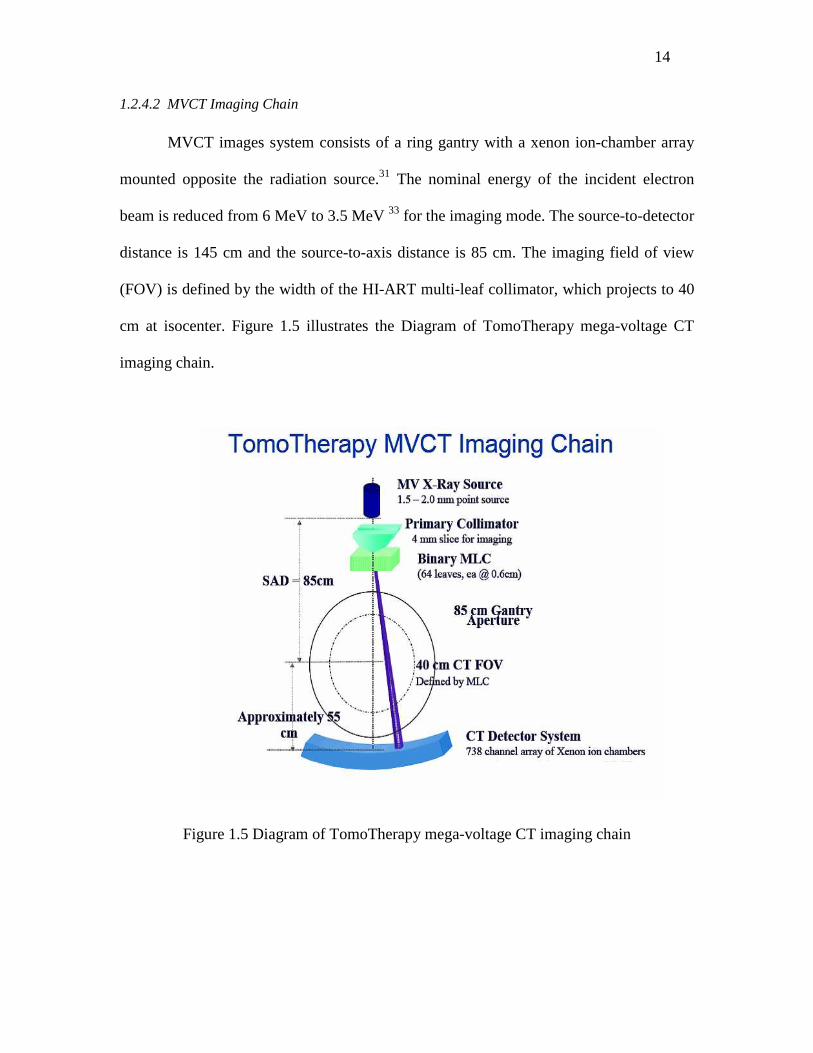
During MVCT acquisition, the beam is collimated to a length of 5 mm and a
width of 400 mm at isocenter. The slice spacing resolution of the MVCT images is
determined by the distance that the couch travels per rotation. MVCT images acquired
with TomoTheapy system have a user-defined axial resolution. There are three clinical
MVCT acquisition modes (fine, normal and coarse) available for clinical use. Each mode
corresponds to pitch ratio of 1, 2 and 3. The pitch is the couch travel distance per gantry
rotation divided by the axial beam width at the axis of rotation for single detector array
scanner (e.g. MVCT scanner). So the couch travels 4mm, 8 mm and 12 mm per rotation
for fine, normal, and coarse respectively. About 180 degrees per slice (the rays back-
projected through angles 0-179 are equivalent to the rays back-projected through angles
180-359) is needed to reconstruct the image, and therefore there are two slices per
rotation (which gives 2mm per slice for fine, 4mm per slice for normal, and 6mm per
slice for coarse). The Axial (or in-plane) resolution is 0.78mm pixel. (400mm/512 =0.78
mm)
Couch increment per rotation (mm) Pitch = Beam collimation (mm)
If pitch <1, implies image overlapping and higher patient dose; if pitch >1, implies
extended imaging and reduced patient dose.
Once the MVCT is reconstructed it is registered with the planning KVCT to
determine if the patient or phantom is positioned correctly for treatment. All MVCT
images that were acquired for this work were registered automatically with the automatic
registration program in TomoTherapy, and visually adjusted by therapists if necessary,
and finally verified by physician. Axial, sagittal and coronal views of the two image sets
16
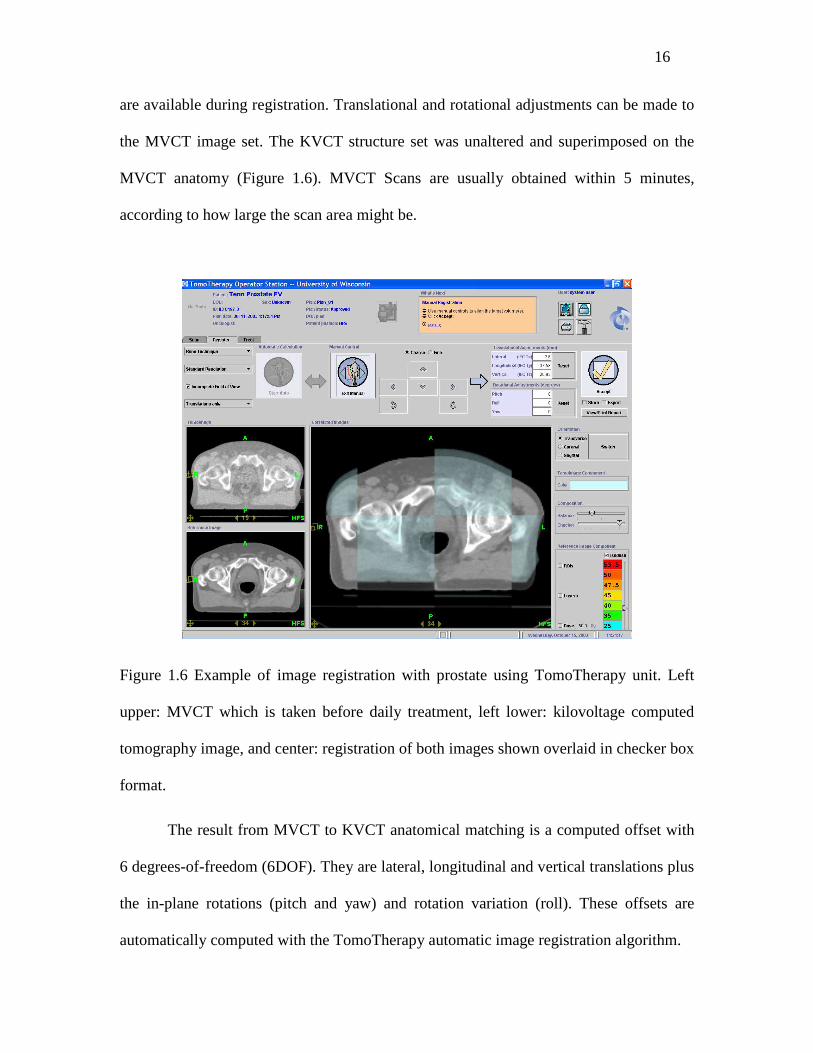
are available during registration. Translational and rotational adjustments can be made to
the MVCT image set. The KVCT structure set was unaltered and superimposed on the
MVCT anatomy (Figure 1.6). MVCT Scans are usually obtained within 5 minutes,
according to how large the scan area might be.
Figure 1.6 Example of image registration with prostate using TomoTherapy unit. Left
upper: MVCT which is taken before daily treatment, left lower: kilovoltage computed
tomography image, and center: registration of both images shown overlaid in checker box
format.
The result from MVCT to KVCT anatomical matching is a computed offset with
6 degrees-of-freedom (6DOF). They are lateral, longitudinal and vertical translations plus
the in-plane rotations (pitch and yaw) and rotation variation (roll). These offsets are
automatically computed with the TomoTherapy automatic image registration algorithm.
17
For TomoTherapy Hi ART MVCT system, the principal interactions during the
image acquisition are Compton scattering and pair production. These interactions are not
as sensitive as regular CT scanner to high atomic number material. As a result, bony
structure (with a higher number of Z) is less distinct from fat and muscle when imaged
with high energy photons. These phenomena cause MVCT to exhibit lower soft tissue
contrast than regular KVCT.
1.2.5 Four-Dimensional Computed Tomography
Recently, a 16-slice CT scanner became available, and it allowed for four-
dimensional (4D) or respiration-correlated CT scans to be performed. 4DCT scans
generate spatial and temporal information on mobility in a single investigation and
represent a major breakthrough in imaging for radiotherapy planning.34 In this technique
described as retrospective gating, the respiratory waveform is synchronously recorded
during CT acquisition, and multiple CT slices are acquired at each table position for at
least the duration of one full respiratory cycle.35 With four-dimensional computed
tomography (4DCT), multiple CT volumes that are consistent in respiratory phase are
reconstructed, each representing a different respiratory state of the patient. 4DCT scans
can capture intrafractional tumor mobility for radiotherapy planning and generate
accurate internal target volume (ITV), which covers the movement range of clinical
tumor volume (CTV). It was recently reported that using 4DCT to determine ITV for
lung cancer could substantially reduce the planning target volume (PTV) while safely
covering the target.36, 37

18
1.3 Terminology Related to Motion of the Tumor Volume
Tumor motion is commonly accounted for by the use of margins that encompass
the tumor volume. ICRU (International Commission on Radiation Units and
Measurements) Reports 50 and 62 38, 39 define the relevant terminology. First, the gross
tumor volume (GTV) is defined as the volume containing demonstrated tumor. Second,
the clinical target volume (CTV) is defined to enclose the GTV plus a margin to account
for suspected tumor involvement. The planning target volume (PTV) is defined as the
CTV plus a margin to allow for geometrical variations such as patient movement,
positioning uncertainties, and organ motion. In ICRU Report 62, this margin is further
divided into two components: (a) internal margin (IM) to account for variations in size,
shape, and position of the CTV; and (b) setup margin (SM) to account for uncertainties in
patient position and beam alignment. For daily radiation therapy treatment, the
uncertainties could be further categorized into inter- and intra- fraction according to
whether the treatment is done within the single treatment day: interfractional setup
uncertainties were defined as the setup error between daily treatments for the whole
course of radiation. Intrafractional organ motion was defined as the shift between the
KVCT and the pre-treatment MVCT scan after the first treatment session and before the
second treatment sessions of a single treatment day.
1.4 Purpose of the Study
Patient motion is inevitably involved in medical imaging and radiation therapy,
producing artifacts and uncertainties in target identification, delineation, localization and
treatment.40, 41 Several factors contribute to the overall treatment accuracy. Among them,
19
the image modality, the treatment setup accuracy and organ motion are the three major
sources of treatment uncertainty:
• The first source is the geometrical uncertainties that are involved during the obtaining
of image modalities, such as the limited image resolution, the characteristic of the
imaging modality, and tumor delineation uncertainties.
• The second source, the setup uncertainties, occurs during the planning simulation and
patient treatment. Specifically, the setup error, which has both a random and
systematic component, arises from the motion between the skin tattoos that are
obtained during simulation and the internal anatomy motion or changes during the
time of daily treatment.
• The third source of the treatment uncertainty is the organ motion, which could arise
from respiratory motion, cardiac motion, digestive motion, muscular motion, etc.
This study chooses TomoTherapy as the clinical platform to analyze the setup
uncertainties and organ motion. It is assumed that the tumor contour is outlined
accurately, i.e., there is no CTV delineation uncertainty in this study. The imaging
techniques focused on assuring the patient is in the proper position prior to treatment, so
individual treatment margins can be used, rather than population-based margins. The
purpose of this study is to investigate how much the error and motions were included in
the daily treatment and how much margin could be given for the specific anatomic sites
in a specific clinic practice, (i.e., daily patient treatment in Grossmont hospital with
TomoTherapy unit). Furthermore, effects of respiration on the organ motion will be
20
investigated with 4DCT. More specifically, this study has investigated the following four
aspects.
Firstly, the interfractional setup uncertainties from day-to-day treatment and
intrafractional internal organ motion within the daily treatment from different anatomic
sites were studied with Helical TomoTherapy unit. The pre-treatment MVCT provided
the real-time tumor and organ shift coordinates, and can be used to improve the accuracy
of patient positioning. The interfractional setup errors, system errors and random errors
were analyzed and the suggested margin for HN, brain, prostate, abdomen and lung in the
direction of lateral, longitudinal and vertical was derived from the study.
Secondly, lung stereotactic body radiation therapy (SBRT) using the MIDCO
BodyLoc whole body stereotactic localizer combined with TomoTherapy megavoltage
CT (MVCT) image guidance were investigated for the possible target and organ motion
reduction. The comparisons of 3D displacement with BodyLoc immobilization and
without BodyLoc immobilization were performed and analyzed.
Thirdly, 4DCT is investigated to accurately describe respiration related tumor
motion. Deformable registration between different breathing phases was performed to
estimate the motion trajectory during the respiratory cycle for lung tumor. Optimization
is realized by minimizing the mean squared difference in intensity, and is implemented
with a multi-resolution, gradient descent procedure.
Finally, lung tumor mobility and dosimetric benefits with 4DCT were
investigated with different planning target volume (PTV) obtained from 3DCT and
4DCT. The PTV4D obtained from 4D image was compared with the PTV3D from 3D
21
images. The normal tissue complication probability (NTCP) from both 3D and 4D plan
was compared for both ipsilateral lung and heart.
1.5 Roadmap
This dissertation was organized in the following chapters: Chapter 2 investigated
the daily interfractional setup uncertainties and intrafractional internal organ motion from
five different anatomic sites; Chapter 3 performed the detailed analysis of how much
improvement could be achieved with proper immobilization devices for stereotactic
radiation therapy; To describe the tumor and organ motion in an accurate way, Chapter 4
presented the 4DCT technique for moving target delineation and deformable registration
that correlates images in different respiratory phases; Chapter 5 analyzed the patient
internal organ motion with 4DCT and the associated dosimetric effects; Finally, Chapter
6 summarized all the studies and directed the future work that could be done from the
studies.
22
CHAPTER 2
Analysis of Daily Setup Variation with TomoTherapy
Mega Voltage Computed Tomography (MVCT)
2.1 Introduction
Intensity-modulated radiation therapy has been shown to benefit the patient by
delivering uniform high doses of radiation to the target while at the same time, reducing
the radiation exposure of surrounding normal tissues. However, it becomes riskier if the
target is partially missed due to miscalculation of the tumor’s location. The ICRU Report
62 39 defines a margin that should be included in the definition of a planning target
volume (PTV), which includes internal margin (IM) to account for variations in size,
shape, and position of clinical target volume (CTV) and setup margin (SM) to account for
uncertainties in the positioning of the patient.
Numerous authors have published setup accuracy studies that explored the use of
different imaging methods for guidance. For example, portal image,42, 43 ultrasound,44, 45
cone-beam CT 46,47 and embedded internal markers 48,49 have been used to study
interfractional setup uncertainties and intrafractional organ displacements and
deformations. Generally, image guidance can be classified into two categories: on-line
and off-line approaches. The on-line approach refers to pre-treatment image guidance,
and has the advantage of being used for real-time patient position verification and
adjustment. The off-line approach involves a retrospective review of patient setup
23
variation to allow for patient position adjustments during the subsequent treatment, and
has the advantage of potentially reducing both treatment time and systematic setup error.
The purpose of this study was to evaluate the setup uncertainties using
TomoTherapy megavoltage computed tomography (MVCT) for five different anatomical
sites. Helical TomoTherapy provides on-line verification of radiation delivery via on-
board MVCT imaging to verify tumor position and shape before treatment. With an
anatomy registration tool, the patient can be repositioned more accurately. In this study,
both pre-treatment and post-treatment MVCT scans were performed to quantify the
interfractional setup error and the intrafractional internal organ displacement.
2.2 Methods and Materials
2.2.1 Patients and Image Registration between MVCT and KVCT
Ninety-two consecutive patients treated between December 2005 and May 2008
with tumors in five different locations (25 HN, 15 brain, 27 prostate, 9 abdomen, and 16
lung patients) were identified from patient database. Their fraction numbers varied
according to tumor site. For example, HN patients were treated with 20-38 fractions,
brain patients with 25-35 fractions, prostate patients with 30-35 fractions, abdomen
patients with 25-30 fractions, and lung patients with 25-35 fractions.
The patients were brought to the CT simulator and immobilized in the supine
position. A Type-S™ head extension board (CIVCO, Orange City, Iowa, USA) with a
thermoplastic facemask was used for HN and brain patients. Vac-Lok™ cushions
(CIVCO) were used to immobilize the lower extremities up to the thighs for prostate
patients. No respiration suppression or immobilization devices were used for lung and

24
abdomen treatments. For each patient, the CT images were taken and transferred to a
commercial planning system (ADAC, Philips) for contouring. The final RT structure sets
and CT images were transferred to TomoTherapy for treatment planning.
The MVCT scans from the TomoTherapy unit for all patients in this study were
performed at a fixed gantry period of 10 seconds per full rotation. MVCT images were
acquired at a rate of one slice per 5 seconds using a 3.5 megavoltage x-ray fan beam.
Before treatment, patients were positioned according to skin tattoos marked during the
CT-simulation (KVCT). A normal slice thickness (4 mm spacing with pitch of 2) was
chosen for all patients. A set of image slices across a region that included the tumor
location was chosen for the subsequent MVCT scan. MVCT images were taken and fused
with the planning KVCT using mutual information/extracted feature fusion algorithm
focused on both soft tissues and bony structures. 3D translational (lateral, longitudinal,
and vertical) and rotational corrections were calculated using the TomoTherapy software.
The operator performed manual adjustment if the automatic image fusion did not match
the KVCT data. Pitch and yaw was reset to zero since there was no automatic couch
adjustment function in the TomoTherapy treatment unit; the lack of such a feature would
make this procedure difficult and tedious for routine daily treatment. Roll adjustment was
performed using automatic gantry rotation if necessary. The system allows for automatic
vertical and longitudinal movements consistent with the registration results. The lateral
shift was manually adjusted by the therapist. Patients were repositioned to the shift
coordinates and treated.
The bony structures or sinuses were used for adjusting the results from automatic
registration for HN and brain tumor patients. The interface between prostate and rectum
25
was used for prostate patients’ image registration. When the tumor was in soft tissue,
such as abdomen and lung, the tumor itself was used to verify that it was centered inside
the prescribed isodose lines in all 3D translational directions. Other anatomic structures,
like the kidney or liver, were also used to assist the registration for the correctness
adjustment.
2.2.2 Inter- and Intrafractional Uncertainties
Interfractional uncertainty was defined as the setup variation and organ
displacement for each fraction of treatment. After matching the setup tattoos and lasers,
the discrepancy between planning KVCT and pre-treatment MVCT was considered the
interfractional uncertainty. The intrafractional uncertainties were derived from the
discrepancy of MVCTs taken immediately before and after a treatment. A total of 2900
recorded daily shift data points were collected and analyzed for interfractional setup
variation analysis. A total of 115 post-treatment MVCTs were performed immediately
after treatment to investigate the intrafractional organ displacements. The intrafractional
variation study was performed for five randomly chosen patients, with five fractions for
each patient.
The systematic and random errors were analyzed according to the method
suggested by Bijhold et al.50 Mean and standard deviations in daily measurements were
first obtained for each patient. The mean and standard deviation of the mean across
treatments for all patients were then calculated. The systematic group mean, µ, is the
mean of all data means. Systematic error Σ is determined from the standard deviation of
the means of the displacements between the planning KVCT scan and the pretreatment
26
MVCT scan. The root mean square of standard deviation from all patient data gives the
random setup error, denoted σ. CTV-to-PTV setup margin were suggested by Stroom51
and Herk:52
CTV-to-PTV margin = 2.0 Σ+0.7 σ (2.1)
Where Σ is systematic error and σ is random error.
Several variables were defined as the following: The position of the tumor center
of mass in relation of the planned position is given by xik , where xik is a vector of the
three spatial dimensions. The subscripts represent the patient number and fractions of
treatment of each patient:
k = 1, …..,P, P is the number of patients;
I = 1, …., Ik, Ik is the number of fractions per patient k.
Group mean =
∑∑
=
==p
kk
p
k kk
k
I
mImM
1
1)( (2.2)
System error = 2
1
1
2 ))((
1
1)( ∑∑ =
=
−−
=∑ p
k kkkp
kk
k mMmI
I
m (2.3)
Random error = ∑∑ =
=
−−
= p
k kkp
k k
sII
RMS1
2
1
2 ))1((1
1 (2.4)
Where sk is the standard deviation of daily treatment ∑∑
=
=
−
−=
k
k
i
i k
i
i
i i
kI
mxs
1
2
12
1
)(.
The CTV-to-PTV margin including both setup error and internal motion (i.e.,
global margin) could be expressed as:
27
CTV-to-PTV margin = setup margin + internal organ motion margin (2.5)
An ANOVA test with Bonferroni post-hoc comparison at a 95% confidence level
(SPSS, V 16.0) was used to analyze the differences among the five anatomy sites. The
three displacement directions were also analyzed with an ANOVA test. The comparisons
between interfractional and intrafractional displacements were analyzed using Student’s
t-test. Correlations between the random setup errors and the patient’s characteristics, e.g.,
age, weight, and sex, were analyzed using Pearson’s correlation coefficient.
2.3 Results and Discussion
The values of mean setup variation and standard deviation for each patient from
the five anatomic sites are shown in Figure 2.1. Group means, standard deviations of
averages, and mean three-dimensional vectors of the setup variations are summarized in
Table 2.1. The mean interfractional 3D displacements for HN (2.2 mm) and brain (2.3
mm) were smaller than the displacements for prostate (3.2 mm), abdomen (4.4 mm), and
lung (7.7 mm). The mean rotational variation ranged from 0.2° to 0.5°, with standard
deviation from 0.7° to 0.9°. The immobilization device (e.g., thermoplastic facemask)
and the rigid anatomy in the intracranial group may contribute to the similar setup
uncertainties for HN and brain patients. The extracranial group showed a larger setup
error than the intracranial group. The largest setup error was found in lung patients in the
longitudinal direction. There was no significant difference in the vertical direction and
roll variation among the five anatomic sites.
28
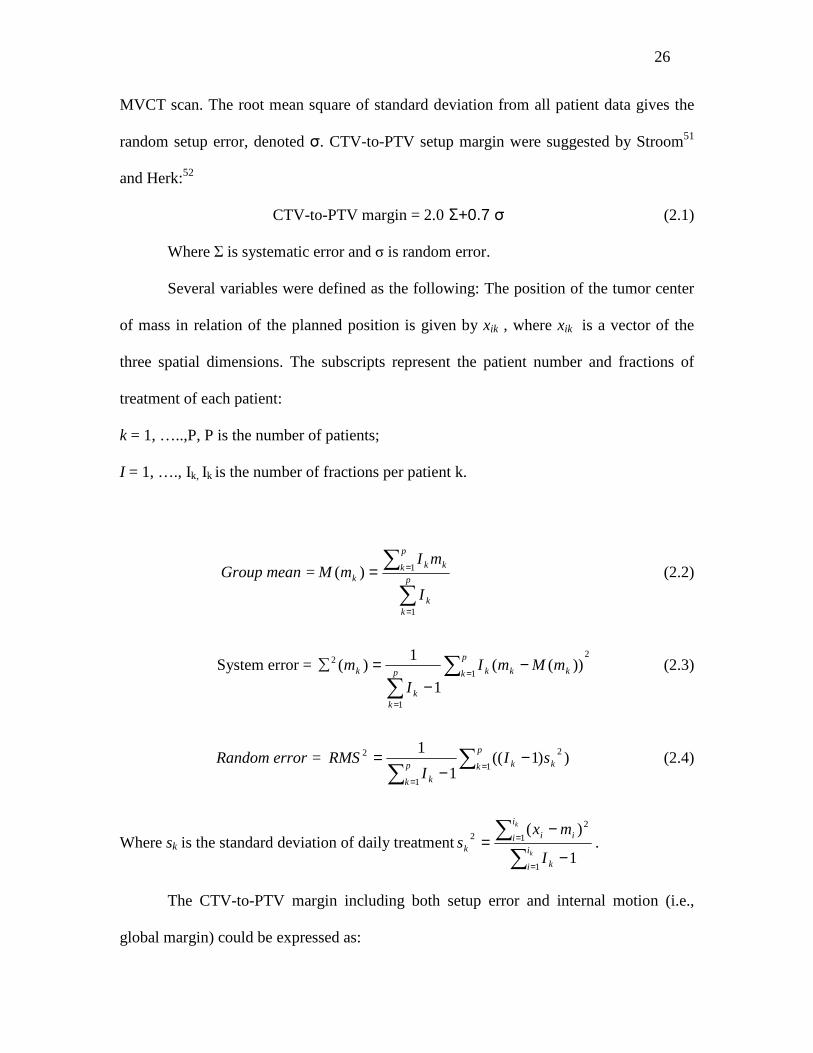
Table 2.1 Mean and standard deviation of interfractional setup variations from 92 patients
in lateral (LR), longitudinal (SI), vertical (AP) and rotational directions across five
different sites.
LR (mm) SI (mm) AP (mm)
Roll
(°)
mean 3D
displacement
Site
# of
patients
Mean S.D. Mean S.D. Mean S.D. Mean S.D. (mm)
HN 25 0.4 1.6 -0.3 2.5 0.3 2.2 0.3 0.9 2.2
Brain 15 0.6 1.7 -0.8 2.4 0.2 1.3 0.2 0.9 2.3
Prostate 27 -1.2 5.1 0.4 2.5 0.6 4.7 0.5 0.7 3.2
Abdomen 9 0.9 4.9 -1.8 5.1 -0.2 3.2 0.5 0.9 4.4
Lung 16 0.5 4.0 -6.0 4.8 1.8 3.3 0.3 0.8 7.7
Abbreviations: LR: left-right (lateral), SI: superior-inferior (longitudinal), AP: anterior-
posterior (vertical). SD: Standard Deviation.
Table 2.2 Interfractional uncertainties and maximum displacements for six anatomic
sites.
systematic error Σ
random error σ
maximum displacement
mm, or degree
Site
X Y Z Roll X Y Z Roll X Y Z roll
HN 1.5 1.6 0.4 0.6 1.7 2.5 2.4 0.9 8.6 8.7 6.0 5.8
Brain 1.5 1.6 0.3 0.6 2.6 2.6 1.3 0.9 8.5 10.1 4.3 2.5
Prostate 1.9 2.4 0.8 0.7 5.2 2.6 5.4 0.7 12.6 12.9 10.3 3.7
Abdomen 2.3 4.0 0.8 0.6 5.1 4.0 3.6 0.9 13.4 18.2 10.9 3.5
Lung 2.7 4.3 1.9 0.6 2.8 4.9 4.3 0.8 14.3 20.2 12.1 5.1
Abbreviations: X: LR (lateral); Y: SI (longitudinal); Z: AP(vertical).
The interfractional systematic errors, random errors, and maximum displacements
for all patients are summarized in Table 2.2. The random error was larger than the
29
systematic error in all directions for all tumor sites. Roll variations were small and no
significant difference among the five sites studied was found.
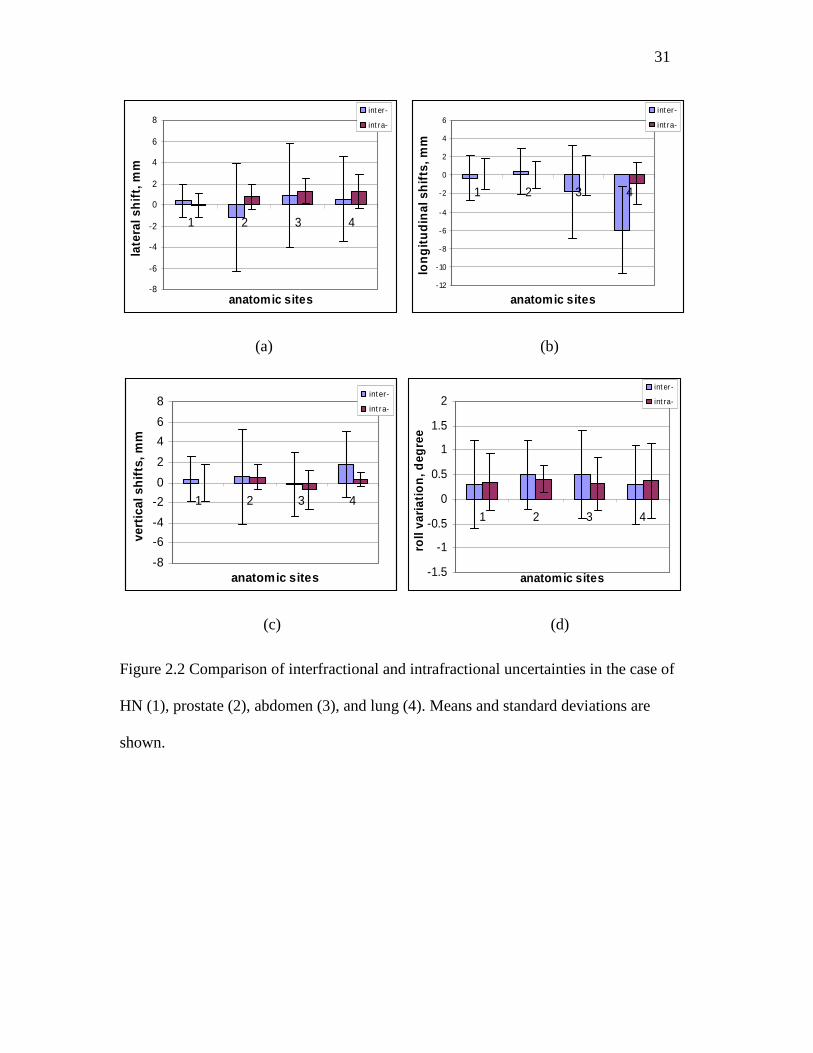
The comparison of inter- and intrafractional shifts is shown in Figure 2.2. Site
numbers 1-4 represent HN, prostate, abdomen, and lung, respectively. The intrafractional
patient and organ movements were generally smaller than the interfractional setup errors.
However, except for lung in the longitudinal direction, the differences were not
statistically significant. The maximum intrafractional displacement for all four sites was
less than 4.5 mm.
The Pearson product-moment correlation coefficient was calculated to analyze
relationship between the standard deviation of random setup error and patient
characteristics, i.e., age, weight, and sex. The significance of the correlation was tested
and no correlation was found.
Setup errors and organ displacements were larger in the extracranial tumor sites.
The lung had the highest shifts in all three directions. Not surprisingly, the longitudinal
shift in the lung was greater than other two directions because of breathing motion. Table
2.3 lists the interfractional setup uncertainties for one site versus the rest using an
ANOVA test with Bonferroni post-hoc methods.
30
-20-16-12
-8-4048
121620
0 10 20 30 40 50 60 70 80 90 100
Patient#
Set
up
Err
or
in L
R (
mm
)
-20
-16-12
-8-4
0
4
8
12
16
20
0 20 40 60 80 100Patient#
Set
up
Err
or
in S
I (m
m)
(a) (b)
-20-16-12
-8-4048
121620
0 20 40 60 80 100Patients#
Set
up
Err
or
in A
P (
mm
)
-4
-3
-2
-1
0
1
2
3
4
0 20 40 60 80 100Patients#
Ro
ll va
riat
ion
(d
egre
e)
(c) (d)
Figure 2.1 Interfractional setup uncertainty for each patient. HN cases were patient #1 to
#25; brain: # 26 to 40; prostate: #41 to 67; abdomen: #68 to 76; lung: #77 to 92. Each
point indicates the mean setup error and the standard deviation of a patient. Panel: (a)
setup errors in lateral (LR); (b) longitudinal (SI); (c) vertical direction (AP); and (d) setup
errors in rotation.
31
-8
-6
-4
-2
0
2
4
6
8
1 2 3 4
anatomic sites
late
ral s
hif
t, m
m
int er-
int ra-
-12
-10
-8
-6
-4
-2
0
2
4
6
1 2 3 4
anatomic sites
lon
git
ud
inal
sh
ifts
, mm
int er-
int ra-
(a) (b)
-8
-6
-4
-2
0
2
4
6
8
1 2 3 4
anatomic sites
vert
ical
sh
ifts
, mm
int er-
int ra-
-1.5
-1
-0.5
0
0.5
1
1.5
2
1 2 3 4
anatomic sites
roll
vari
atio
n, d
egre
e
int er-
int ra-
(c) (d)
Figure 2.2 Comparison of interfractional and intrafractional uncertainties in the case of
HN (1), prostate (2), abdomen (3), and lung (4). Means and standard deviations are
shown.
32
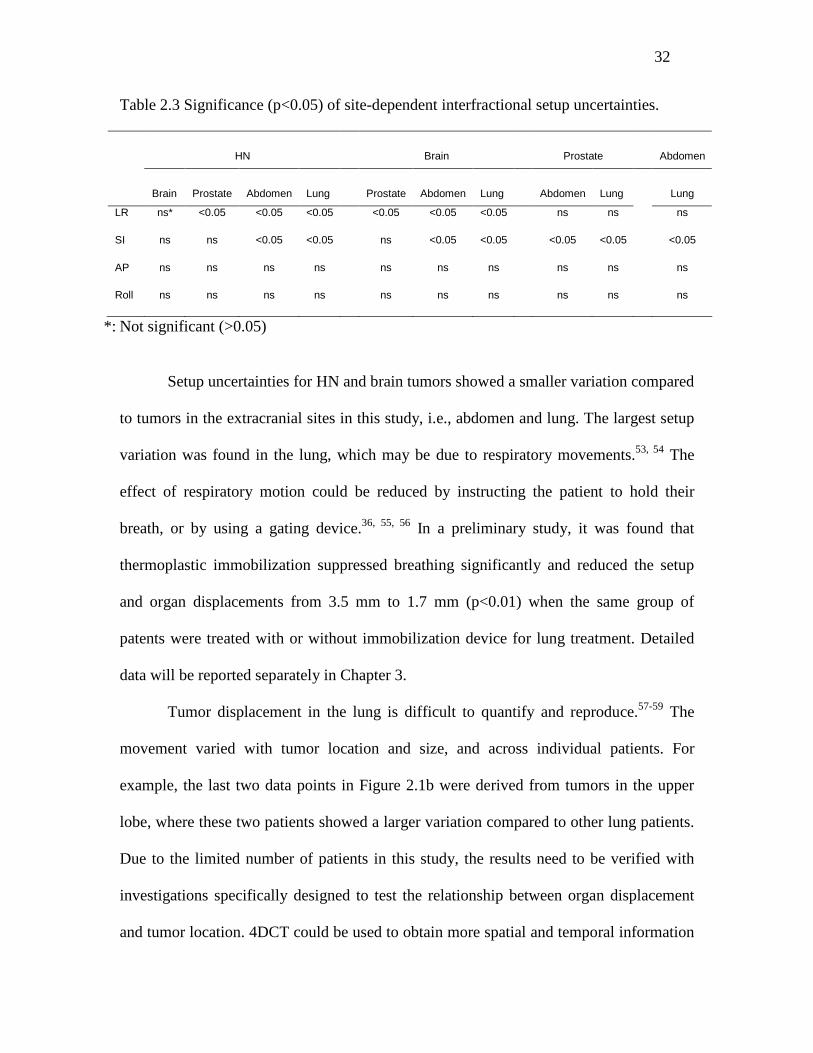
Table 2.3 Significance (p<0.05) of site-dependent interfractional setup uncertainties.
HN
Brain
Prostate
Abdomen
Brain
Prostate
Abdomen
Lung
Prostate
Abdomen
Lung
Abdomen
Lung
Lung
LR ns* <0.05 <0.05 <0.05 <0.05 <0.05 <0.05 ns ns ns
SI ns ns <0.05 <0.05 ns <0.05 <0.05 <0.05 <0.05 <0.05
AP ns ns ns ns ns ns ns ns ns ns
Roll ns ns ns ns ns ns ns ns ns ns
*: Not significant (>0.05)
Setup uncertainties for HN and brain tumors showed a smaller variation compared
to tumors in the extracranial sites in this study, i.e., abdomen and lung. The largest setup
variation was found in the lung, which may be due to respiratory movements.53, 54 The
effect of respiratory motion could be reduced by instructing the patient to hold their
breath, or by using a gating device.36, 55, 56 In a preliminary study, it was found that
thermoplastic immobilization suppressed breathing significantly and reduced the setup
and organ displacements from 3.5 mm to 1.7 mm (p<0.01) when the same group of
patents were treated with or without immobilization device for lung treatment. Detailed
data will be reported separately in Chapter 3.
Tumor displacement in the lung is difficult to quantify and reproduce.57-59 The
movement varied with tumor location and size, and across individual patients. For
example, the last two data points in Figure 2.1b were derived from tumors in the upper
lobe, where these two patients showed a larger variation compared to other lung patients.
Due to the limited number of patients in this study, the results need to be verified with
investigations specifically designed to test the relationship between organ displacement
and tumor location. 4DCT could be used to obtain more spatial and temporal information
33
about the effect of mobility on lung tumors, and this content will be discussed in detail in
Chapter 4 and Chapter 5.
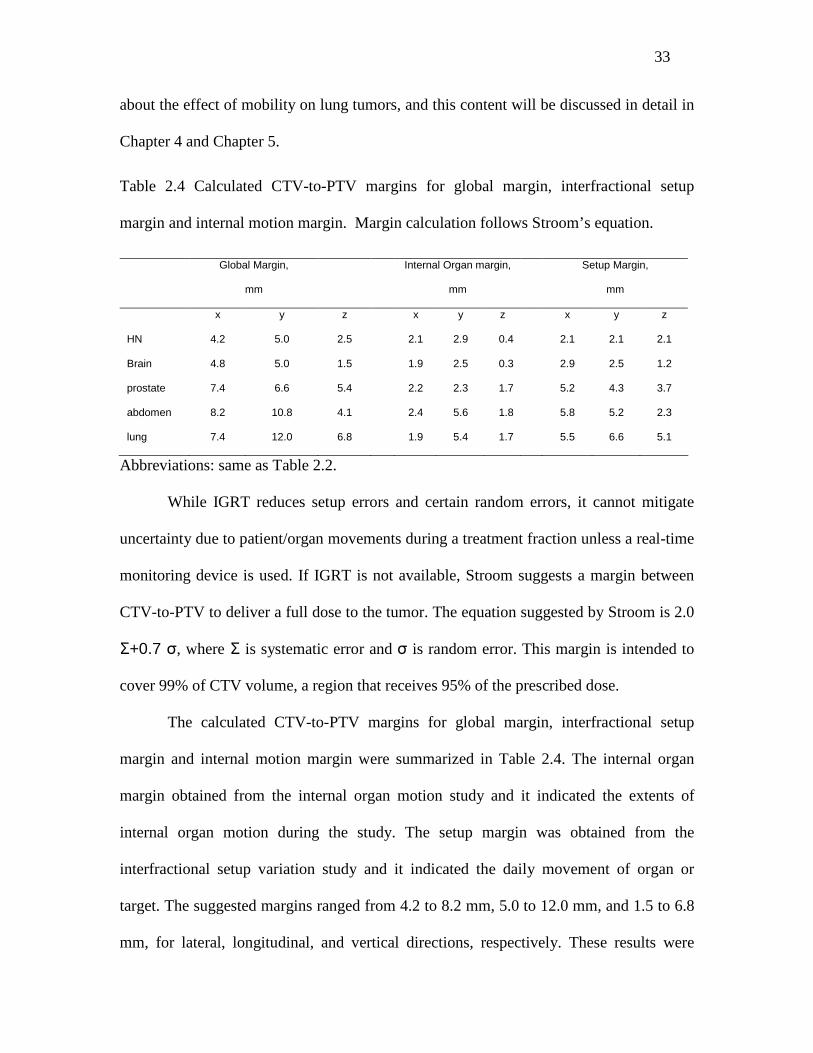
Table 2.4 Calculated CTV-to-PTV margins for global margin, interfractional setup
margin and internal motion margin. Margin calculation follows Stroom’s equation.
Global Margin,
mm
Internal Organ margin,
mm
Setup Margin,
mm
x y z x y z x y z
HN 4.2 5.0 2.5 2.1 2.9 0.4 2.1 2.1 2.1
Brain 4.8 5.0 1.5 1.9 2.5 0.3 2.9 2.5 1.2
prostate 7.4 6.6 5.4 2.2 2.3 1.7 5.2 4.3 3.7
abdomen 8.2 10.8 4.1 2.4 5.6 1.8 5.8 5.2 2.3
lung 7.4 12.0 6.8 1.9 5.4 1.7 5.5 6.6 5.1
Abbreviations: same as Table 2.2.
While IGRT reduces setup errors and certain random errors, it cannot mitigate
uncertainty due to patient/organ movements during a treatment fraction unless a real-time
monitoring device is used. If IGRT is not available, Stroom suggests a margin between
CTV-to-PTV to deliver a full dose to the tumor. The equation suggested by Stroom is 2.0
Σ+0.7 σ, where Σ is systematic error and σ is random error. This margin is intended to
cover 99% of CTV volume, a region that receives 95% of the prescribed dose.
The calculated CTV-to-PTV margins for global margin, interfractional setup
margin and internal motion margin were summarized in Table 2.4. The internal organ
margin obtained from the internal organ motion study and it indicated the extents of
internal organ motion during the study. The setup margin was obtained from the
interfractional setup variation study and it indicated the daily movement of organ or
target. The suggested margins ranged from 4.2 to 8.2 mm, 5.0 to 12.0 mm, and 1.5 to 6.8
mm, for lateral, longitudinal, and vertical directions, respectively. These results were
34
comparable to other studies in the literature evaluating setup variations. For example, the
setup variations for HN and brain were reported between 2-5 mm (lateral), 1-5 mm
(longitudinal), and 1-6 mm (vertical);60 prostate setup variation ranged from 5-8 mm
(lateral), 4-12 mm (longitudinal), and 3-10 mm (vertical);61 and thorax and abdomen
variation ranged from 4-10 mm(lateral), 6-16 mm (longitudinal) and 8-12 mm (vertical).
62-64
Van Herk 52 also published a similar but a slightly larger margin equation: 2.5
Σ+0.7 σ. It is not the goal of this study to verify the equations proposed by Stroom or Van
Herk, because the margin should be determined by multiple factors, including treatment
goals, tumor stages, tumor/normal tissue locations, immobilization technique, and
confidence level. The margin formulas may then be used only for confirmation.
Note that the proposed CTV-to-PTV margins were obtained from the
interfractional setup variation with the use of the immobilization techniques reported in
this study. The overall CTV-to-PTV margin, including both setup uncertainties and
internal organ displacement, should be fully investigated before determining PTV
margin. In addition, IGRT minimizes the interfractional setup errors and the margin
derived from this study should not be used if IGRT is available.
2.4 Conclusions
The setup variations in the lateral, longitudinal, and vertical directions were
randomly distributed. Organ displacement should be taken into account in the PTV,
especially for treatment of the lung. With Stroom’s margin suggestion, the calculated
global CTV-to-PTV margins, which include both interfractional setup error and

35
intrafractional organ motion, ranged from 4.2 to 8.2 mm (lateral), 5.0 mm to 12.0 mm
(longitudinal), and 1.5 mm to 6.8 mm (vertical), for the HN, brain, prostate, abdomen and
lung sites. The use of pre-treatment MVCT reduced the systematical setup error and
showed that the tumor changed during the radiation course. Pre-treatment MVCT can be
used to improve the accuracy of patient positioning.
36
CHAPTER 3
Image Guided Stereotactic Body Radiotherapy for Lung
Tumors Using BodyLoc System with TomoTherapy
3.1 Introduction
Hypofractionated stereotactic body radiotherapy (SBRT) was reported to have a
higher local control rate than conventional fractionated radiotherapy for medically
inoperable non-small cell lung cancer.65-68 Compared to the latter, it uses a higher dose
per fraction to achieve a better tumor control rate. The requirements for SBRT generally
include secured immobilization, accurate patient positioning, ablative dose fractionation,
and minimum normal tissue exposure. However, high toxicity to the surrounding organs,
such as the normal lung, spinal cord, esophagus, skin, and trachea, remains a challenge
and a reduced safety margin and precise target localization are needed to improve dose
delivery.
Consistent and reproducible immobilization devices are usually used in SBRT
delivery. Rigid fixation devices (e.g., a vacuum pillow or vacuum sheet combined with a
thermoplastic body cast) have been used to reduce daily setup uncertainties.69, 70 For
motion-controlled SBRT treatment systems of abdomen compression, the maximum
inspiration breath-hold technique and respiratory gating have been used to minimize
tumor motion.56, 71-73 Recent developments in image-guided therapy, including four-
dimensional computed tomography (4DCT), have been used to accurately delineate
tumor boundaries and reduce the tumor margin.36, 55, 74 Furthermore, a pre-treatment
37
cone-beam CT (CBCT) was recently described for daily use to verify the target
position.27, 28, 75, 76
Helical TomoTherapy provides an innovative way to administer image-guided
SBRT. It enables tumor localization with a CT setup, and allows treatment on the same
machine with automatic adjustment of the patient position. The embedded anatomy
registration tool provides real-time tumor/organ shift coordinates so the patient can be
repositioned to match the planning CT’s orientation and position. Furthermore, the
included TomoTherapy megavoltage CT (MVCT) serves as a volumetric 3D imaging and
registration tool that gives more detailed information regarding tumor shape and position.
This 3D tool is distinct from the 2D tools described in other studies, such as portal film
and implanted fiducial markers, which have been used for target localization.69, 70, 77
This study presents the clinical implementation of the MIDCO TM BodyLoc
system (Whole Body Stereotactic Localizer; MIDCO; San Diego, CA) to reduce patient
motion with a TomoTherapy treatment unit. Additionally, it reports the inter- and
intrafractional setup variations that were observed during the course of stereotactic lung
treatment.
3.2 MIDCOTM BodyLoc System
The BodyLoc system employs a unique imaging resolver, which consists of a pair
of sine wave fiducials coupled with a linear fiducial enabling stereotactic localization in
the Z dimension (or longitudinal direction. Note that the definition of X, Y, Z in the
BodyLoc system is different from TomoTherapy). Because the two sinusoidal fiducials
are out of phase by 90 degrees, the positioning of the three fiducials establishes a unique

38
Z coordinates for each CT slice in the transverse plane. Additional pairs of the linear
fiducials give the position for anterior-posterior and left-right coordinates (Figure 3.1a).
Each fiducial line is made of a non-ferromagnetic fiber optic material that has a high
contrast on both radiographic and CT images. The BodyLoc system has a cross bar with
x-axis and y-axis scales for target localization for its “Body” section localization (b). The
“Head” section of the system employs a targeting box for localization (c). The system
also has sets of QA fiducial markers at Z = 100 mm, 300 mm, 500 mm, 700 mm and 900
mm that are used to verify the accuracy of stereotactic coordinate determination in the Z-
axis (d). The BodyLoc software uses a mathematical algorithm to calculate the 3D
stereotactic coordinates that identify the target point.
(a) (b)
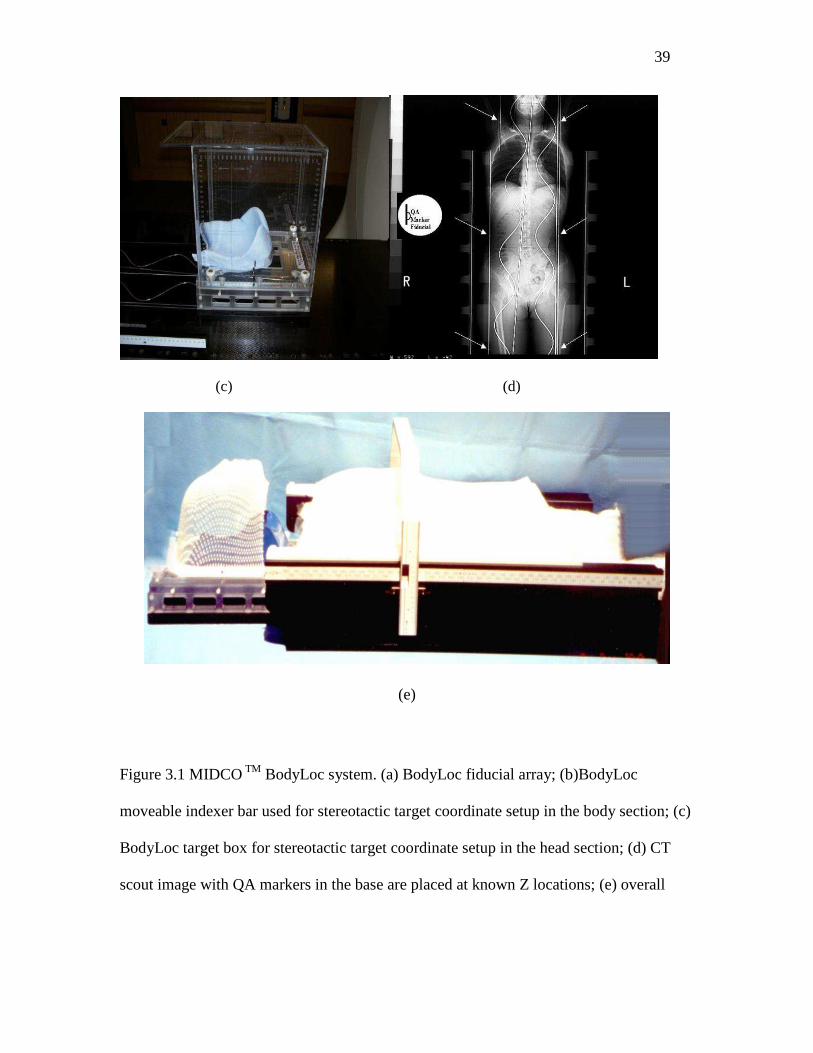
39
(c) (d)
(e)
Figure 3.1 MIDCO TM BodyLoc system. (a) BodyLoc fiducial array; (b)BodyLoc
moveable indexer bar used for stereotactic target coordinate setup in the body section; (c)
BodyLoc target box for stereotactic target coordinate setup in the head section; (d) CT
scout image with QA markers in the base are placed at known Z locations; (e) overall
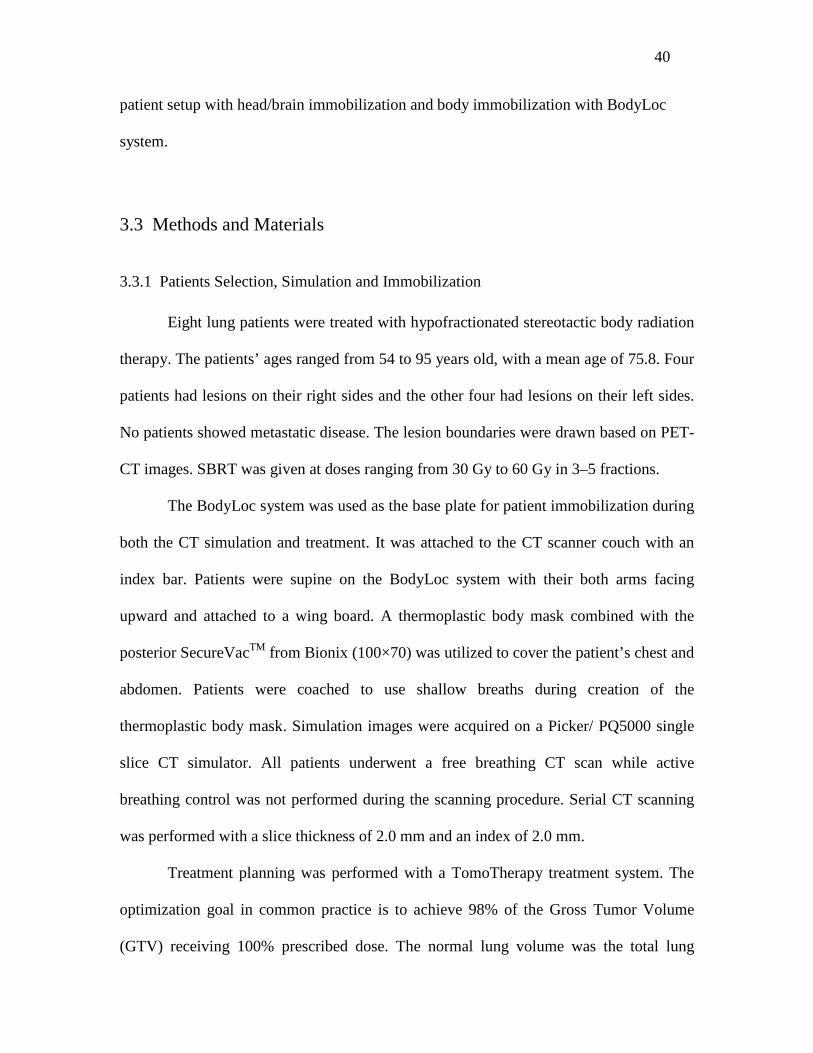
40
patient setup with head/brain immobilization and body immobilization with BodyLoc
system.
3.3 Methods and Materials
3.3.1 Patients Selection, Simulation and Immobilization
Eight lung patients were treated with hypofractionated stereotactic body radiation
therapy. The patients’ ages ranged from 54 to 95 years old, with a mean age of 75.8. Four
patients had lesions on their right sides and the other four had lesions on their left sides.
No patients showed metastatic disease. The lesion boundaries were drawn based on PET-
CT images. SBRT was given at doses ranging from 30 Gy to 60 Gy in 3–5 fractions.
The BodyLoc system was used as the base plate for patient immobilization during
both the CT simulation and treatment. It was attached to the CT scanner couch with an
index bar. Patients were supine on the BodyLoc system with their both arms facing
upward and attached to a wing board. A thermoplastic body mask combined with the
posterior SecureVacTM from Bionix (100×70) was utilized to cover the patient’s chest and
abdomen. Patients were coached to use shallow breaths during creation of the
thermoplastic body mask. Simulation images were acquired on a Picker/ PQ5000 single
slice CT simulator. All patients underwent a free breathing CT scan while active
breathing control was not performed during the scanning procedure. Serial CT scanning
was performed with a slice thickness of 2.0 mm and an index of 2.0 mm.
Treatment planning was performed with a TomoTherapy treatment system. The
optimization goal in common practice is to achieve 98% of the Gross Tumor Volume
(GTV) receiving 100% prescribed dose. The normal lung volume was the total lung
41
volume subtracting the PTV volume, and the dose constraint was that 20% of the total
normal lung volume received less than 18 Gy. A patient-specific margin was determined
for each GTV. An intensity modulation factor of 2.0-2.5 and a pitch of 0.287 were chosen
for most cases; however, for large tumors, an intensity modulation of 2 was chosen to
reduce treatment time.
The TomoTherapy delivery machine was calibrated for a dose rate of 899
mu/min. Large doses or treatment times were divided into two sessions due to delivery
time limitations. All patients in this study underwent a pre-treatment MVCT scan prior to
beam delivery. A fine slice thickness (2 mm slice thickness with a pitch of 1) was chosen
for all patients. MVCT images were acquired and fused with the planning KVCT using
mutual information algorithms that focused on both soft tissue and bony structure.
Patients were repositioned according to the shift coordinates, and the final position was
reviewed and approved by the physician before beam delivery.
Using the BodyLoc software, 3D coordinates for localization were calculated
before treatment. The BodyLoc’s coordinate rulers were used in the initial setup by
matching the setup lasers with the BodyLoc’s indexers. In addition, BodyLoc localizer
was used for cross comparison with the MVCT for patient positioning. Patient’s target
isocenter position was verified using the image fusion between pre-treatment MVCT and
planning KVCT. If there was no setup error, there should be little discrepancy between
the BodyLoc localization and MVCT fusion.
Due to the time limitation in dose delivery from TomoTherapy unit, for the
prescribed doses used in the SBRT, the prescribed dose per fraction needed to be divided
into 2-3 sessions in treatment delivery. For the first few treatments, verification MVCT
42
were repeated before each of the 2-3 session to investigate target motion during the
treatment (i.e., intrafractional error). The deviation between the daily pre-treatment
MVCT and the planning KVCT showed the interfractional errors. From the preliminary
study, it was found that the intrafractional error was small and the use of the BodyLoc arc
indexer bar alone without verification MVCT between two sessions was adequate.
3.3.2 Interfractional and Intrafractional Setup Uncertainties
Stereotactic coordinates were calculated for each patient using the MIDCO
BodyLoc stereotactic software and was used for the patient setup. MVCT was performed
to visualize the target position. The first MVCT scan was taken for patient daily setup
and the second MVCT scan was performed to verify the target position after the first
treatment session and before the second treatment session. Interfractional and
intrafractional setup uncertainties were defined the same as in the Chapter 2. In short, the
interfractional is the setup error between daily treatments over the whole course of
radiation therapy. Intrafractional uncertainties were defined as the shift between the
KVCT scan and the pre-treatment MVCT scan after the first treatment session, but before
the second treatment session on a single treatment day.
The data collected for analysis included tumor volumes, target location, disease
stage, and patient age, sex, and weight. In total, 224 recorded daily shifts from eight
patients were collected and the inter- and intrafractional setup variations were analyzed.
43
3.3.3 Verification of System Mechanical Accuracy
An acrylic hexagonal shaped phantom called the HexaPhant® was developed to
verify the system mechanical accuracy on TomoTherapy unit. The HexaPhant was
designed with a film cassette holder that has six brass pins and accommodates an 85 mm
x 85 mm piece of film. An ion chamber holder can be positioned in place of the film
cassette. The HexaPhant has two test probes that have 8 mm MR compatible gelatin balls
and two probes that contain five 2 mm tungsten balls spaced 3 mm apart that are
radiologically identifiable. The HexaPhant can be mounted to the BodyLoc frame so that
the film cassette or ion chamber can be oriented in either the sagittal or coronal plane.
The location of the center pin within the film cassette is designed to coincide with the
stereotactic target coordinate of a 5 mm cylindrical irradiated volume. MD-55
Radiochromic film was then loaded into the BodyLoc film cassette and punctured with
the six pins. The film was irradiated with the treatment plan. The Delivery Quality
Assurance (DQA) module of the TomoTherapy Planning system was used to analyze the
dose profiles on the exposed film.
3.4 Results and Discussion
3.4.1 Hexaphant Accuracy Test
Figure 3.2 illustrated the setup of the HexaPhant for the accuracy test. Film was
inserted in the cassette in both sagittal and coronal planes. By comparing the centers of
the calculated dose profiles and the measured dose profiles from the film based HAT
results, the coincidence of the planned and delivered center of the irradiated target

44
volume was verified. HAT profile analysis results on the TomoTherapy treatment unit are
shown in Figure 3.3 for sagittal and the coronal dose profiles.
Figure 3.2 HexaPhant setup with film cassette oriented in sagittal and coronal planes for
positioning accuracy test.
Figure 3.3 Resultant profiles from the HAT. The measured dose profile is shown in red
and calculated dose profile in blue. The location of the center pin within the film cassette
is designed to coincide with the stereotactic target coordinate of a 5 mm cylindrical
irradiated volume. X, left–right (lateral); Y, superior-inferior (longitudinal); and Z,
anterior-posterior (vertical).
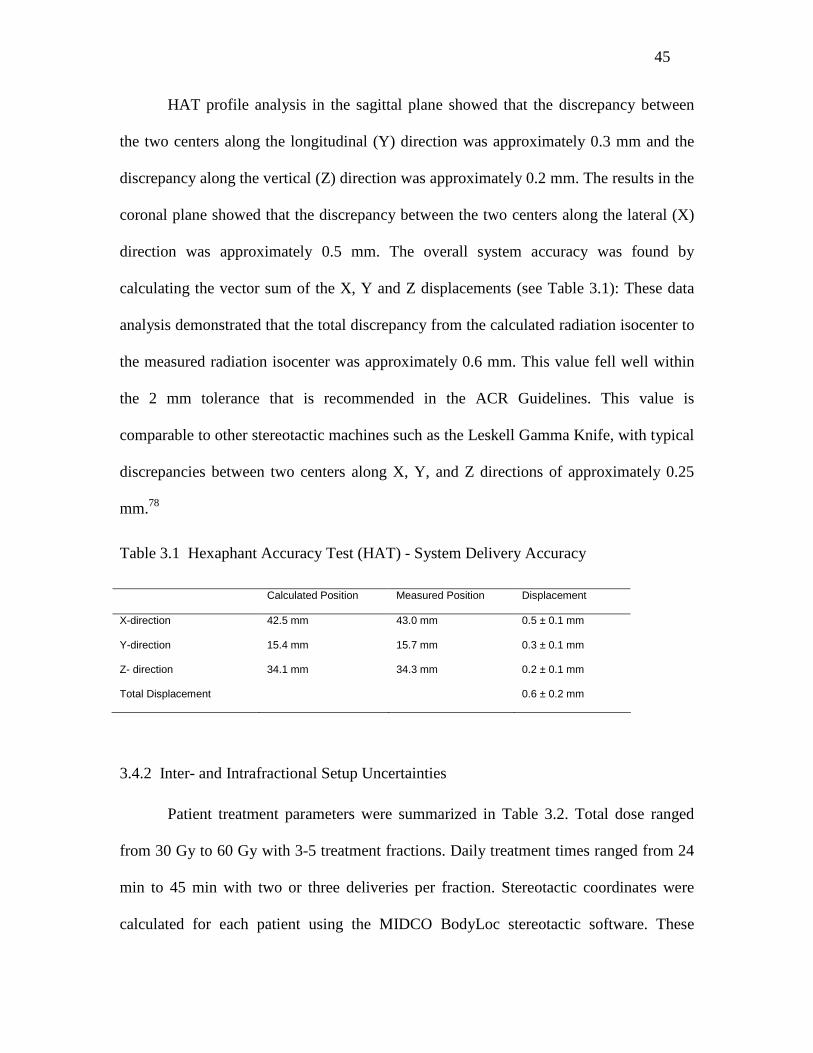
45
HAT profile analysis in the sagittal plane showed that the discrepancy between
the two centers along the longitudinal (Y) direction was approximately 0.3 mm and the
discrepancy along the vertical (Z) direction was approximately 0.2 mm. The results in the
coronal plane showed that the discrepancy between the two centers along the lateral (X)
direction was approximately 0.5 mm. The overall system accuracy was found by
calculating the vector sum of the X, Y and Z displacements (see Table 3.1): These data
analysis demonstrated that the total discrepancy from the calculated radiation isocenter to
the measured radiation isocenter was approximately 0.6 mm. This value fell well within
the 2 mm tolerance that is recommended in the ACR Guidelines. This value is
comparable to other stereotactic machines such as the Leskell Gamma Knife, with typical
discrepancies between two centers along X, Y, and Z directions of approximately 0.25
mm.78
Table 3.1 Hexaphant Accuracy Test (HAT) - System Delivery Accuracy
Calculated Position Measured Position Displacement
X-direction 42.5 mm 43.0 mm 0.5 ± 0.1 mm
Y-direction 15.4 mm 15.7 mm 0.3 ± 0.1 mm
Z- direction 34.1 mm 34.3 mm 0.2 ± 0.1 mm
Total Displacement 0.6 ± 0.2 mm
3.4.2 Inter- and Intrafractional Setup Uncertainties
Patient treatment parameters were summarized in Table 3.2. Total dose ranged
from 30 Gy to 60 Gy with 3-5 treatment fractions. Daily treatment times ranged from 24
min to 45 min with two or three deliveries per fraction. Stereotactic coordinates were
calculated for each patient using the MIDCO BodyLoc stereotactic software. These

46
coordinates were used for patient setup. MVCT was performed to visualize the target
position. The first MVCT scan was used for the daily setup of the patient and the second
MVCT scan was performed to verify the target position after the first, but before the
second treatment delivery during the same day.
(a) (b)
(c)
Figure 3.4 SBRT lung patient CT simulation setup with MIDCO BodyLoc system. (a)
BodyLoc and thermoplastic body mask combined with posterior VacLoc immobilization
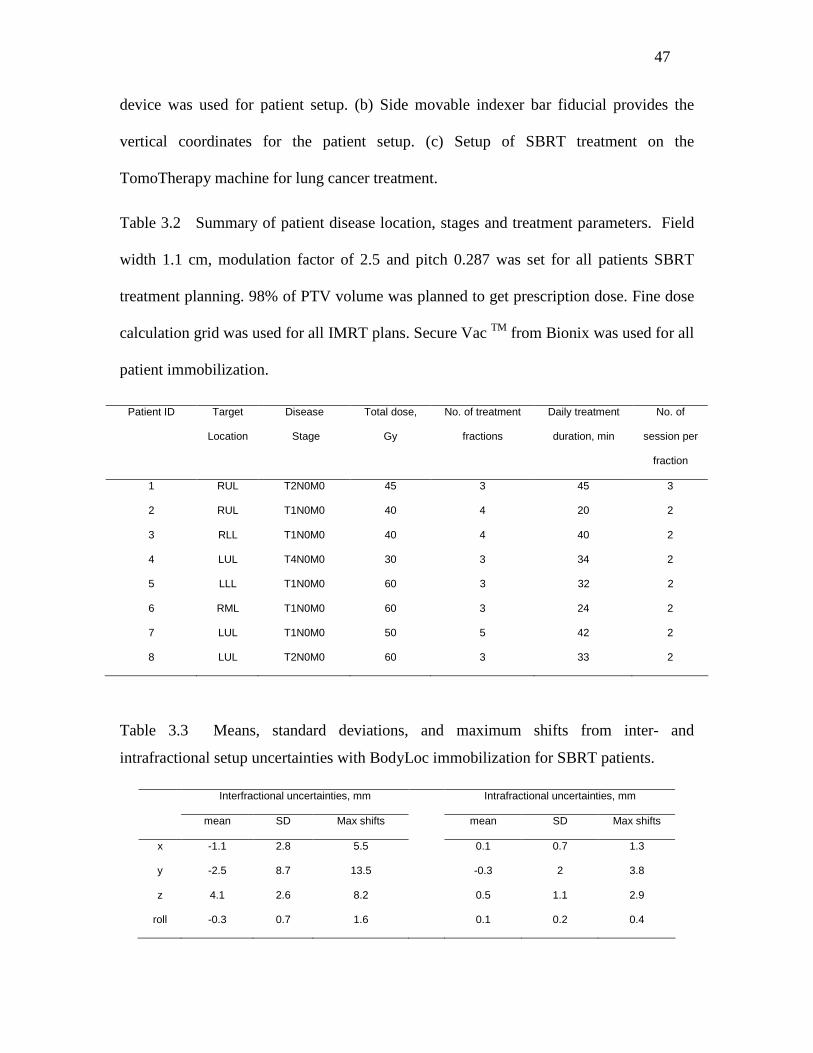
47
device was used for patient setup. (b) Side movable indexer bar fiducial provides the
vertical coordinates for the patient setup. (c) Setup of SBRT treatment on the
TomoTherapy machine for lung cancer treatment.
Table 3.2 Summary of patient disease location, stages and treatment parameters. Field
width 1.1 cm, modulation factor of 2.5 and pitch 0.287 was set for all patients SBRT
treatment planning. 98% of PTV volume was planned to get prescription dose. Fine dose
calculation grid was used for all IMRT plans. Secure Vac TM from Bionix was used for all
patient immobilization.
Patient ID Target
Location
Disease
Stage
Total dose,
Gy
No. of treatment
fractions
Daily treatment
duration, min
No. of
session per
fraction
1 RUL T2N0M0 45 3 45 3
2 RUL T1N0M0 40 4 20 2
3 RLL T1N0M0 40 4 40 2
4 LUL T4N0M0 30 3 34 2
5 LLL T1N0M0 60 3 32 2
6 RML T1N0M0 60 3 24 2
7 LUL T1N0M0 50 5 42 2
8 LUL T2N0M0 60 3 33 2
Table 3.3 Means, standard deviations, and maximum shifts from inter- and
intrafractional setup uncertainties with BodyLoc immobilization for SBRT patients.
Interfractional uncertainties, mm Intrafractional uncertainties, mm
mean SD Max shifts mean SD Max shifts
x -1.1 2.8 5.5 0.1 0.7 1.3
y -2.5 8.7 13.5 -0.3 2 3.8
z 4.1 2.6 8.2 0.5 1.1 2.9
roll -0.3 0.7 1.6 0.1 0.2 0.4
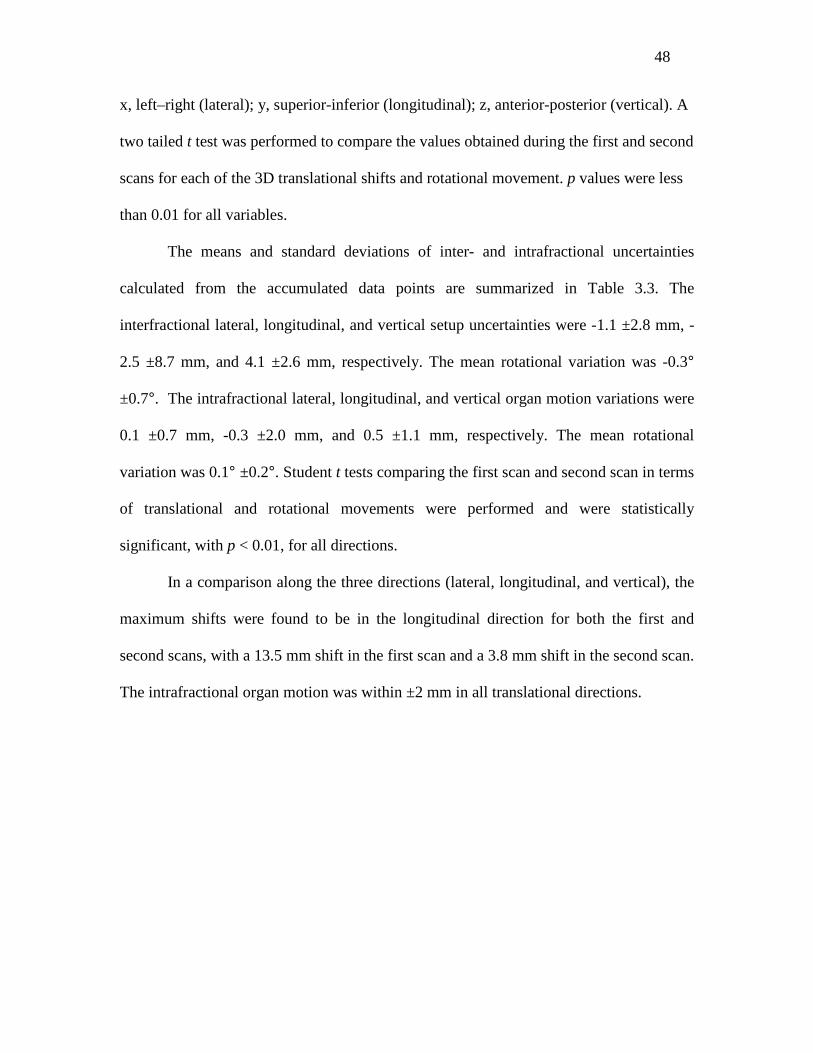
48
x, left–right (lateral); y, superior-inferior (longitudinal); z, anterior-posterior (vertical). A
two tailed t test was performed to compare the values obtained during the first and second
scans for each of the 3D translational shifts and rotational movement. p values were less
than 0.01 for all variables.
The means and standard deviations of inter- and intrafractional uncertainties
calculated from the accumulated data points are summarized in Table 3.3. The
interfractional lateral, longitudinal, and vertical setup uncertainties were -1.1 ±2.8 mm, -
2.5 ±8.7 mm, and 4.1 ±2.6 mm, respectively. The mean rotational variation was -0.3°
±0.7°. The intrafractional lateral, longitudinal, and vertical organ motion variations were
0.1 ±0.7 mm, -0.3 ±2.0 mm, and 0.5 ±1.1 mm, respectively. The mean rotational
variation was 0.1° ±0.2°. Student t tests comparing the first scan and second scan in terms
of translational and rotational movements were performed and were statistically
significant, with p < 0.01, for all directions.
In a comparison along the three directions (lateral, longitudinal, and vertical), the
maximum shifts were found to be in the longitudinal direction for both the first and
second scans, with a 13.5 mm shift in the first scan and a 3.8 mm shift in the second scan.
The intrafractional organ motion was within ±2 mm in all translational directions.
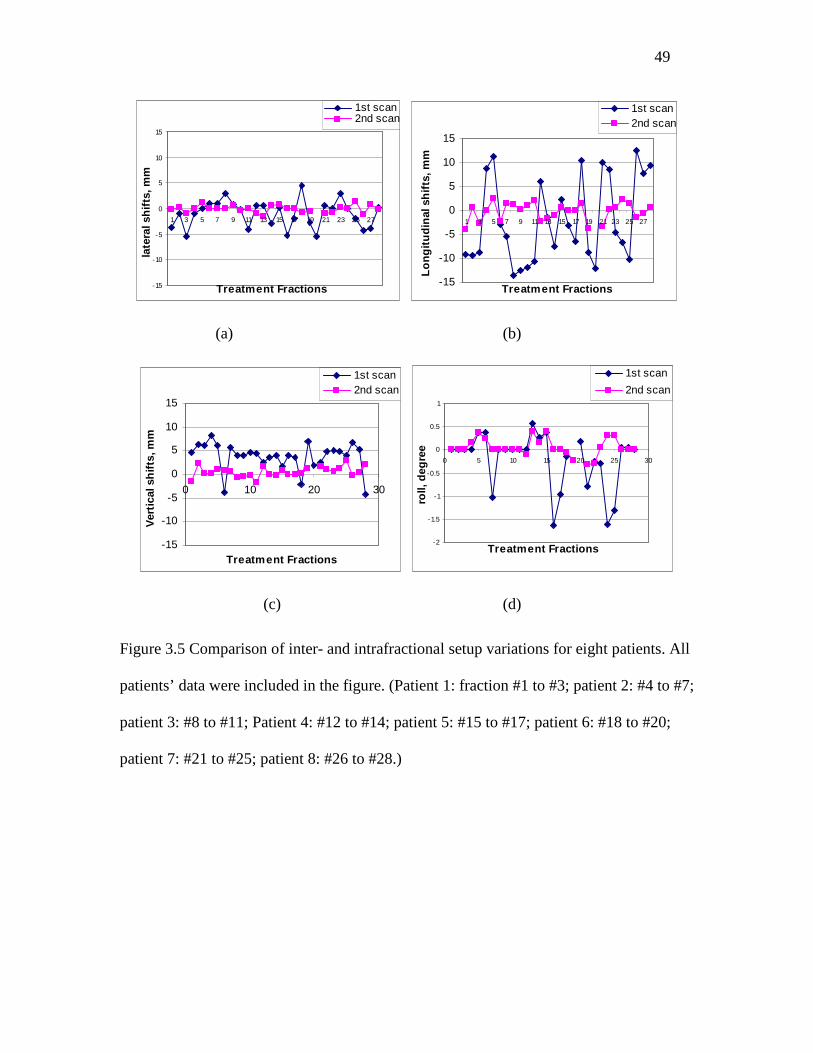
49
-15
-10
-5
0
5
10
15
1 3 5 7 9 11 13 15 17 19 21 23 25 27
Treatment Fractions
late
ral s
hif
ts, m
m
1st scan2nd scan
-15
-10
-5
0
5
10
15
1 3 5 7 9 11 13 15 17 19 21 23 25 27
Treatment Fractions
Lo
ng
itu
din
al s
hif
ts, m
m
1st scan2nd scan
(a) (b)
-15
-10
-5
0
5
10
15
0 10 20 30
Treatment Fractions
Ver
tica
l sh
ifts
, mm
1st scan2nd scan
-2
-1.5
-1
-0.5
0
0.5
1
0 5 10 15 20 25 30
Treatment Fractions
roll,
deg
ree
1st scan
2nd scan
(c) (d)
Figure 3.5 Comparison of inter- and intrafractional setup variations for eight patients. All
patients’ data were included in the figure. (Patient 1: fraction #1 to #3; patient 2: #4 to #7;
patient 3: #8 to #11; Patient 4: #12 to #14; patient 5: #15 to #17; patient 6: #18 to #20;
patient 7: #21 to #25; patient 8: #26 to #28.)
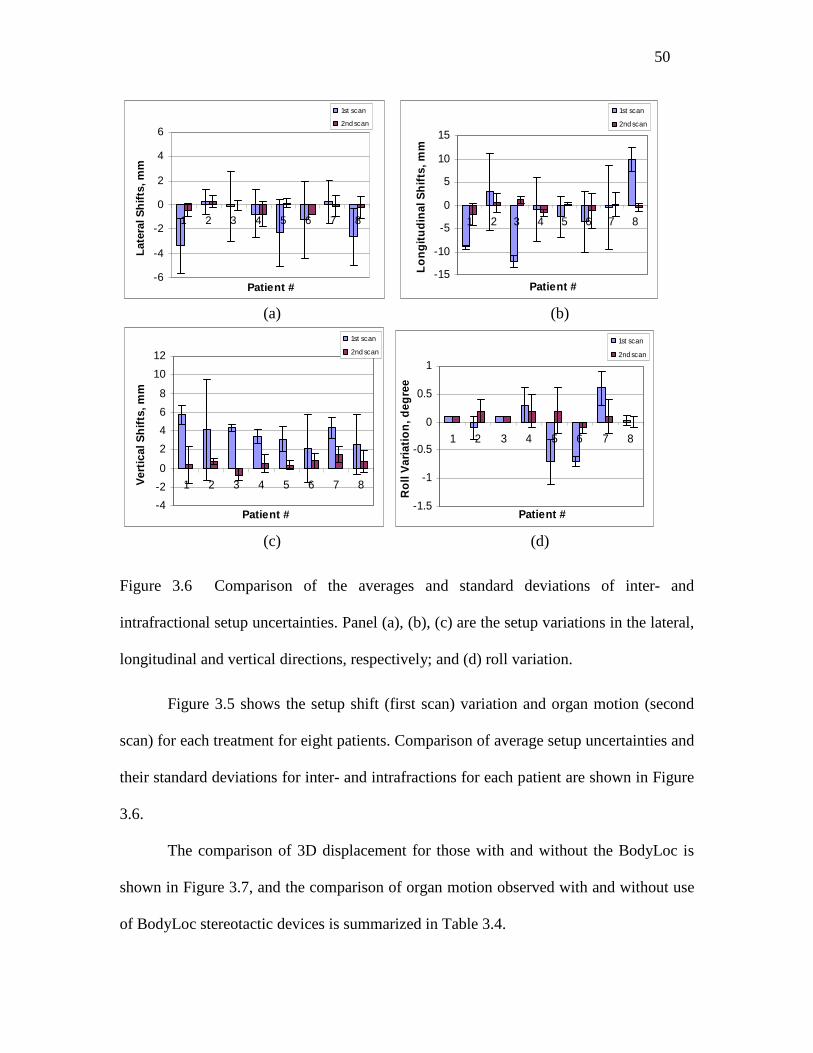
50
-6
-4
-2
0
2
4
6
1 2 3 4 5 6 7 8
Patient #
Lat
eral
Sh
ifts
, mm
1st scan
2nd scan
-15
-10
-5
0
5
10
15
1 2 3 4 5 6 7 8
Patient #
Lo
ng
itu
din
al S
hif
ts, m
m
1st scan
2nd scan
(a) (b)
-4
-2
0
2
4
6
8
10
12
1 2 3 4 5 6 7 8
Patient #
Ver
tica
l Sh
ifts
, mm
1st scan
2nd scan
-1.5
-1
-0.5
0
0.5
1
1 2 3 4 5 6 7 8
Patient #
Ro
ll V
aria
tio
n, d
egre
e
1st scan
2nd scan
(c) (d)
Figure 3.6 Comparison of the averages and standard deviations of inter- and
intrafractional setup uncertainties. Panel (a), (b), (c) are the setup variations in the lateral,
longitudinal and vertical directions, respectively; and (d) roll variation.
Figure 3.5 shows the setup shift (first scan) variation and organ motion (second
scan) for each treatment for eight patients. Comparison of average setup uncertainties and
their standard deviations for inter- and intrafractions for each patient are shown in Figure
3.6.
The comparison of 3D displacement for those with and without the BodyLoc is
shown in Figure 3.7, and the comparison of organ motion observed with and without use
of BodyLoc stereotactic devices is summarized in Table 3.4.
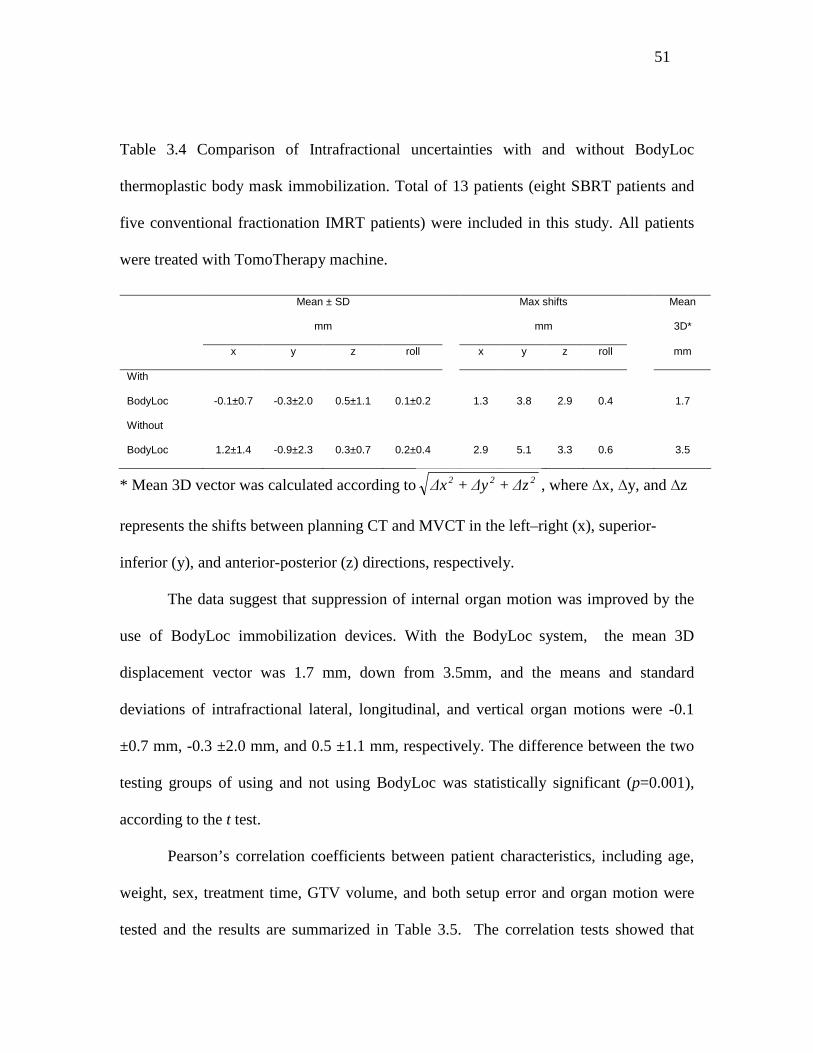
51
Table 3.4 Comparison of Intrafractional uncertainties with and without BodyLoc
thermoplastic body mask immobilization. Total of 13 patients (eight SBRT patients and
five conventional fractionation IMRT patients) were included in this study. All patients
were treated with TomoTherapy machine.
Mean ± SD
mm
Max shifts
mm
Mean
3D*
x y z roll x y z roll mm
With
BodyLoc
-0.1±0.7
-0.3±2.0
0.5±1.1
0.1±0.2
1.3
3.8
2.9
0.4
1.7
Without
BodyLoc
1.2±1.4
-0.9±2.3
0.3±0.7
0.2±0.4
2.9
5.1
3.3
0.6
3.5
* Mean 3D vector was calculated according to 222 ∆z+∆y+∆x , where ∆x, ∆y, and ∆z
represents the shifts between planning CT and MVCT in the left–right (x), superior-
inferior (y), and anterior-posterior (z) directions, respectively.
The data suggest that suppression of internal organ motion was improved by the
use of BodyLoc immobilization devices. With the BodyLoc system, the mean 3D
displacement vector was 1.7 mm, down from 3.5mm, and the means and standard
deviations of intrafractional lateral, longitudinal, and vertical organ motions were -0.1
±0.7 mm, -0.3 ±2.0 mm, and 0.5 ±1.1 mm, respectively. The difference between the two
testing groups of using and not using BodyLoc was statistically significant (p=0.001),
according to the t test.
Pearson’s correlation coefficients between patient characteristics, including age,
weight, sex, treatment time, GTV volume, and both setup error and organ motion were
tested and the results are summarized in Table 3.5. The correlation tests showed that
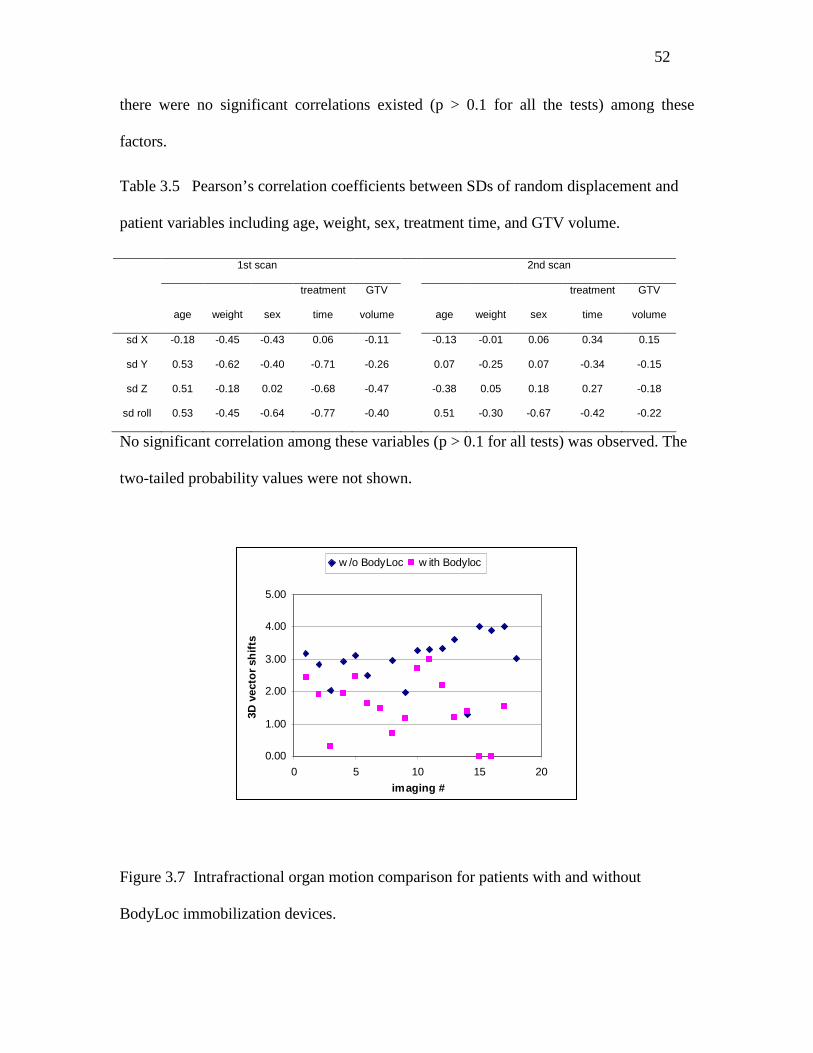
52
there were no significant correlations existed (p > 0.1 for all the tests) among these
factors.
Table 3.5 Pearson’s correlation coefficients between SDs of random displacement and
patient variables including age, weight, sex, treatment time, and GTV volume.
1st scan 2nd scan
age weight sex
treatment
time
GTV
volume age weight sex
treatment
time
GTV
volume
sd X -0.18 -0.45 -0.43 0.06 -0.11 -0.13 -0.01 0.06 0.34 0.15
sd Y 0.53 -0.62 -0.40 -0.71 -0.26 0.07 -0.25 0.07 -0.34 -0.15
sd Z 0.51 -0.18 0.02 -0.68 -0.47 -0.38 0.05 0.18 0.27 -0.18
sd roll 0.53 -0.45 -0.64 -0.77 -0.40 0.51 -0.30 -0.67 -0.42 -0.22
No significant correlation among these variables (p > 0.1 for all tests) was observed. The
two-tailed probability values were not shown.
0.00
1.00
2.00
3.00
4.00
5.00
0 5 10 15 20
imaging #
3D v
ecto
r sh
ifts
w /o BodyLoc w ith Bodyloc
Figure 3.7 Intrafractional organ motion comparison for patients with and without
BodyLoc immobilization devices.

53
Accurate target positioning with proper patient immobilization is essential for
external beam radiation, especially for hypofractionated SBRT. However, accurate and
reproducible patient setup is difficult to achieve due to respiratory motion and other
factors that might affect accuracy, e.g., elongated treatment and verification times, and
the use of a skin tattoo versus stereotactic coordinates as a reference in the setup method.
Several studies have reported on the accuracy of stereotactic frames and patient
setup uncertainties. Grills et al reported on the stereotactic body radiotherapy setup error
with CBCT image guidance.27 Their calculated population margins were 9–13 mm pre-
correction, 1–2 mm post-correction, and 2–4 mm post-treatment (including setup error
and internal drift). Hodge et al. 65 reported the average positional shifts and the associated
standard deviations for each of 9 patients treated by TomoTherapy SBRT with definition
of tumor volume by 4DCT envelope. The maximum lateral, longitudinal, and vertical
shifts in their studies were 6.79±2.9 mm, -9.89±2.6 mm and -9.19±3.8 mm, respectively.
Another group utilized a commercially available stereotactic whole body immobilization
system (BodyFIX, Medical Intelligence, Schwabmuenchen, Germany) for a study of 36
patients treated by hypofractionated stereotactic body radiation therapy. They reported
median and mean magnitude vectors of target isocenter displacement of 4.9 mm and 5.7
±3.7 mm, respectively.69
Similarly, relatively large interfractional setup uncertainties for patient setup (first
scan) were observed in this study. The largest motion was in the longitudinal direction
compared to vertical and lateral movements. These larger uncertainties might result from
the image acquisition and registration technique or random patient setup error that was
observed on a daily basis. Because of the slow gantry rotation of the MVCT scanner on
54
TomoTherapy (5 s per image slice), the motion pattern of the target is encoded into the
pretreatment MVCT-scan, which yields a motion-encoded treatment target.79,80 However,
since the GTV/CTV volumes were obtained from a conventional CT simulator (scan time
~4 s), the stereotactic coordinates obtained from this study were related to the breathing
phase for a given CT slice during the simulation CT scan. The differences in respiratory
phases between the planning CT and MVCT scans may be a major factor that contributes
to setup uncertainty.
The daily beam-on-time of the patient involved in this study ranged from 24 min
to 45 min, and the average treatment time in this study, including patient setup,
pretreatment imaging, and beam delivery, was about 60 min. The interval time between
localization and the repeated second MVCT scan was usually between 15 and 30 min. In
contrast to Purdie 81, who reported a significant intrafractional tumor position difference
when the time interval exceeded 34 min, no obvious correlation was observed between
elongated treatment time and intrafraction motion in this study.
The organ motion caused by respiratory motion was greatly reduced by the use of
BodyLoc immobilization devices. The thermoplastic body mask combined with the
SecureVacTM covered patients from the thoracic wall to the abdomen. Patients were told
to take shallow breaths during the mask making process. If heavy breathing was
observed, more abdominal pressure would be added. This was an efficient approach for
motion suppression. The data in this study are similar to those reported by Negoro,70 who
utilized an abdomen suppression method. Briefly, they reported that application of the
abdominal pressure method greatly reduced tumor movement from a range of 8–20 mm
to a range of 2–11 mm.
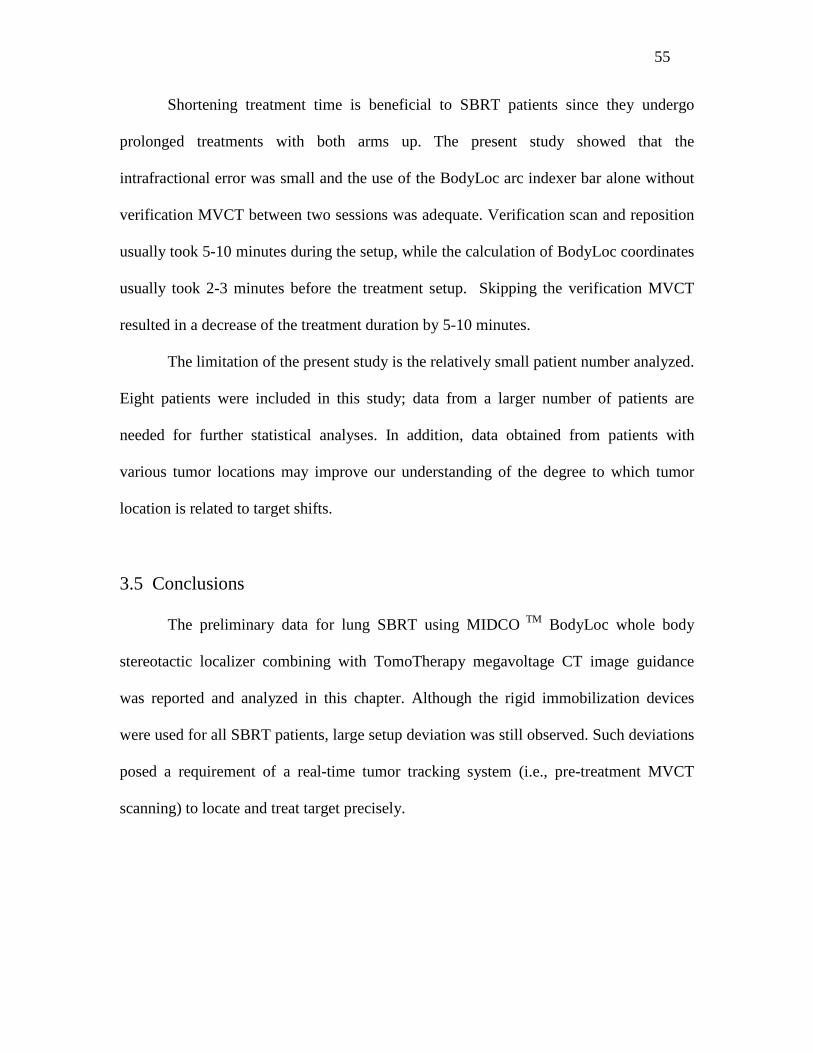
55
Shortening treatment time is beneficial to SBRT patients since they undergo
prolonged treatments with both arms up. The present study showed that the
intrafractional error was small and the use of the BodyLoc arc indexer bar alone without
verification MVCT between two sessions was adequate. Verification scan and reposition
usually took 5-10 minutes during the setup, while the calculation of BodyLoc coordinates
usually took 2-3 minutes before the treatment setup. Skipping the verification MVCT
resulted in a decrease of the treatment duration by 5-10 minutes.
The limitation of the present study is the relatively small patient number analyzed.
Eight patients were included in this study; data from a larger number of patients are
needed for further statistical analyses. In addition, data obtained from patients with
various tumor locations may improve our understanding of the degree to which tumor
location is related to target shifts.
3.5 Conclusions
The preliminary data for lung SBRT using MIDCO TM BodyLoc whole body
stereotactic localizer combining with TomoTherapy megavoltage CT image guidance
was reported and analyzed in this chapter. Although the rigid immobilization devices
were used for all SBRT patients, large setup deviation was still observed. Such deviations
posed a requirement of a real-time tumor tracking system (i.e., pre-treatment MVCT
scanning) to locate and treat target precisely.

56
CHAPTER 4
Implementation of 4DCT and Deformable Registration
for Accurate Moving Target Delineation
4.1 Introduction: Motion Artifacts with 3DCT Imaging and Related Problems
Lung cancer is the leading cause of cancer death in the industrial countries. In
2006, there were over 170,000 cases of new lung cancer arising in US, and among them,
over 50,000 patients had unresectable tumors. Radiation therapy is one of the few
curative options for these patients. With traditional radiation dose and fractionation,
radiation therapy achieves local control in less than 20% of the patients. Though clinical
study suggested that a higher curative rate is possible if the treatment dose is further
increased,82-87 the safety margin around the tumor sets the limit for further dose
escalation. Since the tumor motion is related with respiration, this safety margin is
specifically enlarged to account for the uncertainty in target delineation and treatment
delivery. To better target the tumor with minimal normal tissue exposure in the radiation
field, accurate tumor delineation is one of the critical issues in lung cancer treatment.
It has been recognized that severe artifacts can be introduced if organ motion is
present during CT data acquisition.88-94 The major cause of these artifacts is the dynamic
interaction between trans-axial image acquisition and the asynchronous motion of tumor
and normal organs. A commonly observed artifact is the distortion of the dome of the
liver at the lung–diaphragm interface (Figure 4.1). In other instances, a lesion may be
imaged as two distinct parts, and the axial slices may be shuffled out of order. Such

57
artifacts incorrectly characterize the geometric shape and extent of the organ. Figure 4.2
illustrates the severe distortions of the sphere when a rounded object was moving on a
sliding table during a CT scan. Different artifacts are obtained when CT data acquisition
starts at different positions of the motion cycle. The variations in artifacts shown in
Figure 4.2 illustrate the unpredictability of motion artifacts in CT scanning if information
about the motion during data acquisition is not available.
Figure 4.1 Distortion of the dome of the liver at the lung–diaphragm interface observed
from a patient CT scan caused from respiratory motion. A fast imaging technique, such as
single slice CT results in image deformation artifacts.
Tumor
Artifacts
58
Figure 4.2 Different artifacts obtained by periodically moving a rounded subject on a
sliding table during standard axial CT scanning.
Respiratory motion artifacts can be minimized if scanning is performed during
breath hold,95 or with thermoplastic immobilization to suppress breathing, e.g., the
stereotactic body immobilization method studied in Chapter 3. Under these
circumstances, however, the patients have to endure a prolonged respiratory holding,
which is difficult for the lung disease patients, and more importantly, no information on
organ motion will be obtained. Without explicitly considering the pattern and degree of
organ motion, it is very hard to precisely deliver radiotherapy. To overcome this, some
investigators chose the approach of using the scans acquired during breath hold at tidal
exhale and tidal inhale to estimate the maximum extent of tumor motion.56, 72, 96, 97
Organ motion could also be assessed by visualization during fluoroscopy at the
time of conventional simulation. This approach provides information useful in designing
an aperture that geometrically covers the target, by assuming that the target position
changes with inhale and exhale, and these two extreme conditions could provide the
target motion envelope which generally covers the target motion trajectory (Figure 4.3).
However, fluoroscopic data are limited to 2D projections, while respiratory motion in

59
general is three-dimensional. Furthermore, without the aid of implanted radio-opaque
fiducial markers, soft tissue and lung tumors cannot easily be visualized through
fluoroscopy, and hence it is hard to obtain the complete volumetric information of organ
motion.
(a) (b)
Figure 4.3 Tumor movement during (a) exhale, and (b) inhale phase. A motion encoded
volume was derived by assuming the target position changes with inhale and exhale, and
these two extreme conditions could provide the target motion envelope which generally
covers the target motion trajectory.
4.2 Image Acquisition with 4DCT and Delineation of Targets
Four dimensional radiation therapy (4DRT) is a recent advance in radiation
therapy to investigate the motion caused by respiratory movement. The 4th dimension
beyond the 3D space is time, in which patient motion and anatomy changes could be
Tumor Tumor
Motion encoded volume
60
recorded in time frames. 4DCT scans have been utilized as one of the clinically valuable
tools for assessment of respiration and tumor movement.98, 99 A respiration-correlated
4DCT is usually performed with 16-slice CT scanner (Lightspeed 16, GE Medical
System, Waukesha, WI) and the real-time position management system (RPM, Varian
Medical system, Palo Alto, CA) under uncoached quiet respiration. The imaging protocol
consists of obtaining both the free breathing CT scans and the respiratory phase related
CT scans.
The 4DCT process is briefly described as the following: Patients are scanned in
supine position with both arms up. Two kinds of scans are acquired to complete the
imaging process. One is a regular CT scan, with no respiratory information included. The
other is the cine mode scan, with couch stationary during scanning. During the cine mode
scanning, a commercial respiratory monitoring system (e.g., RPM system from Varian)
was placed on the top of patient’s abdomen near the umbilicus, to acquire the respiratory
pattern with the CT scan. There are 12-16 scans acquired at the first couch position. In
each scan, images acquired are over several respiratory cycles, typically every 4 or 5
seconds. Then radiation is turned off before the couch is moved to adjacent position to
start another scan. This process is automatically repeated until the entire thorax is
scanned (about 16 to 19 couch positions). It’s recommended that total of about 2500
images per patient should be obtained.
After the image acquisition is done, a resorting software (e.g., Advantage 4D: GE
Healthcare) is used to resort and recombine all the obtained CT images according to each
respiratory phase recorded by RPM system. The resorting software assigns a specific
respiratory phase to each reconstructed image, and then sorts all the images into 10
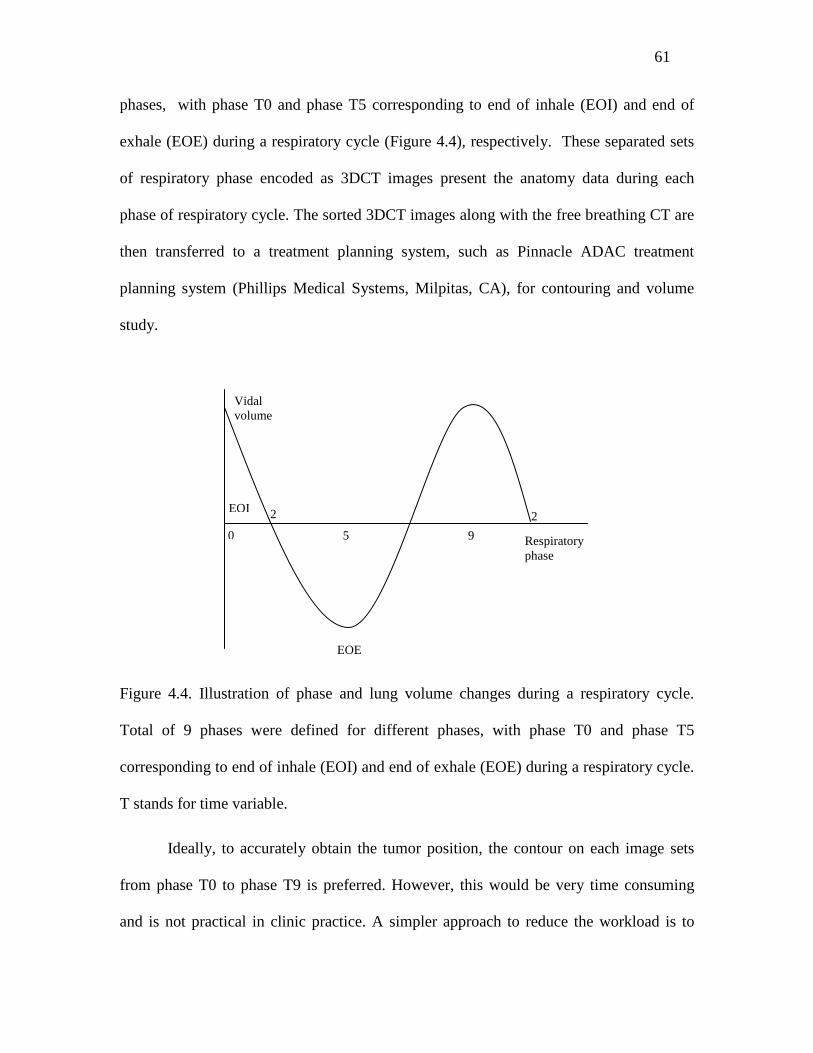
61
phases, with phase T0 and phase T5 corresponding to end of inhale (EOI) and end of
exhale (EOE) during a respiratory cycle (Figure 4.4), respectively. These separated sets
of respiratory phase encoded as 3DCT images present the anatomy data during each
phase of respiratory cycle. The sorted 3DCT images along with the free breathing CT are
then transferred to a treatment planning system, such as Pinnacle ADAC treatment
planning system (Phillips Medical Systems, Milpitas, CA), for contouring and volume
study.
Figure 4.4. Illustration of phase and lung volume changes during a respiratory cycle.
Total of 9 phases were defined for different phases, with phase T0 and phase T5
corresponding to end of inhale (EOI) and end of exhale (EOE) during a respiratory cycle.
T stands for time variable.
Ideally, to accurately obtain the tumor position, the contour on each image sets
from phase T0 to phase T9 is preferred. However, this would be very time consuming
and is not practical in clinic practice. A simpler approach to reduce the workload is to
Vidal volume
EOI 2 2
0 5 9 Respiratory phase
EOE

62
perform an automatic contouring based on the deformable registration from one phase to
others in 4DCT image sets. For example, in clinic physicians could draw contours on
phase T0, T5 and on the free breathing CT images, and then perform auto-contouring for
all other phases to obtain contours on all the 10 phase image sets.100-103
The purpose of auto-contouring is to obtain the target delineation from one
respiratory phase to the corresponding points in other phases. The first step of auto-
contouring was to calculate the displacement vector between two phases. The source
phase was chosen so that it has the smallest variation during different respiratory cycle.
Here T0 was chosen as the source phase or the moving object for deformable registration.
The displacement vector was calculated in several iterations from coarser voxel scales to
finer scales until convergence was reached. The second step was to apply the
transformation vector to the manual contour on the source CT and to obtain the deformed
contour on the target CT set. The ROI masks on T0 images (or source images), Ms, were
transformed onto the other images according to
))(()( xuxMxM st
ρρϖρ += (4.1)
Where Mt is the target ROI masks on T1-T9 phases; Ms is the source image ROI marks
on T0 phase.
A Pinnacle script is used to generate binary masks of reference ROIs. The
reference ROI masks were transformed onto target images using displacement maps from
deformable image registration. As a consequence, target images were segmented
automatically. A custom-developed algorithm is used to convert the ROI masks into
Pinnacle’s ROI file format so that the ROIs can be displayed in Pinnacle.
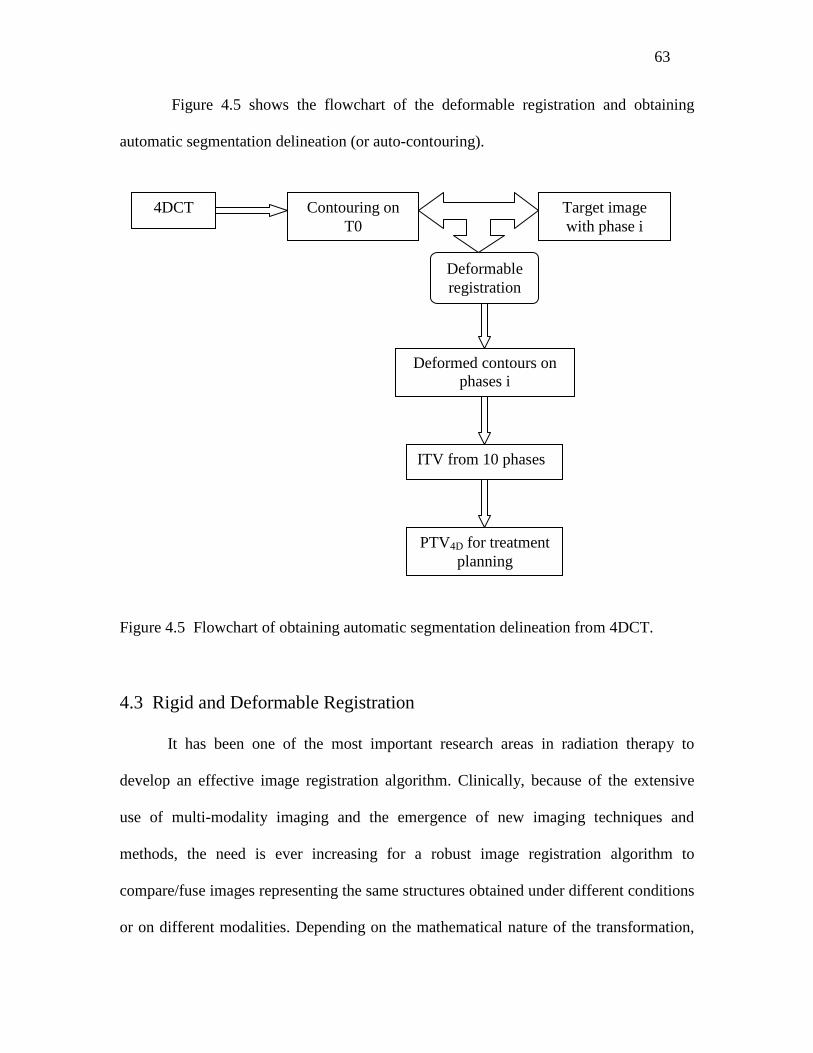
63
Figure 4.5 shows the flowchart of the deformable registration and obtaining
automatic segmentation delineation (or auto-contouring).
Figure 4.5 Flowchart of obtaining automatic segmentation delineation from 4DCT.
4.3 Rigid and Deformable Registration
It has been one of the most important research areas in radiation therapy to
develop an effective image registration algorithm. Clinically, because of the extensive
use of multi-modality imaging and the emergence of new imaging techniques and
methods, the need is ever increasing for a robust image registration algorithm to
compare/fuse images representing the same structures obtained under different conditions
or on different modalities. Depending on the mathematical nature of the transformation,
4DCT
Contouring on T0
Deformable registration
PTV4D for treatment planning
ITV from 10 phases
Deformed contours on phases i
Target image with phase i
64
image registration is divided into two categories: rigid registration and deformable
registration. In rigid transformations, it is assumed that the geometry of the object is
identical in the two input images and no distortion occurs in the image acquisition
process. A rigid transformation consists of six degrees of freedom: three displacement
parameters and three rotational parameters. On the other hand, deformable registration,
which is the key part in obtaining target delineation from 4DCT (Figure 4.5), is more
complicated and entails the modeling of voxel dependent distortion.
Computer-based rigid image registration has gained widespread popularity in the
last decade and is mostly used in routine clinical practice. In this approach, the matching
of the two input images is formulated into an optimization problem and the best
registration of the two images is obtained by iteratively comparing various possible
matches until no better registration can be found. The search for the optimal match of the
two input images is usually performed by a scoring function constructed based on some
physical considerations.
Deformable registration methods have been studied recently by several authors,
and a variety of deformable registration tools have been developed. 104-107 These tools
match each point in one of the 3DCT scans with the corresponding point in the 3DCT
scan of another breathing phase. Popular deformable registration algorithms include
empirical B-spline deformation model, demons registration model, optical flow, or finite
element methods (FEM).
Bharath et al.108 and Brock et al.109 proposed a finite element model, in which
images are described as blocks of elastic materials on which forces apply. In this
approach, the parameters that control the behavior of the elastic material and are
65
responsible for the conversion of forces into local deformations of the elastic material are
Young’s elastic modulus and Poisson’s ratio. However, the drawback of this method is
that values of the elasticity and density constant for various tissues are not readily
available and have to be found by a trial and error procedure. This method also relies on
using complicated software to generate an FEM mesh and masks of the involved
structures.
Schreibmann and Xing have proposed a general narrow-band approach for
deformable registration. 110 Depending on the problem, modeling of individual voxel
movement can also be made using either B-splines,100 thin plate splines,111 optical flow
algorithms,112 or fluid flow algorithms.113 Spline interpolation is a relatively simple
approach and the free-form registration is stable and accurate for dealing with IGRT
image registration problems. An improvement to this method can be achieved by using a
spline model with the smoothness of the deformation field assured by the interpolation
between grids of fixed control points. A simple method along this line is to deduce the
spline coefficients from a set of user-defined control points in warping and registration of
MR volumes, as was done by Fei et al.114 and Lian et al.115 in warping and registration of
MRI volumes. Coselmon et al.101 used a similar technique to study the accuracy of
mutual-information-based CT registration of the lung at exhale and inhale respiratory
states.
4.4 Deformable Registration Algorithm
Although 4DCT contains a complete description of the patient geometry for each
breathing phase, it does not describe how the tissues move and deform from phase to
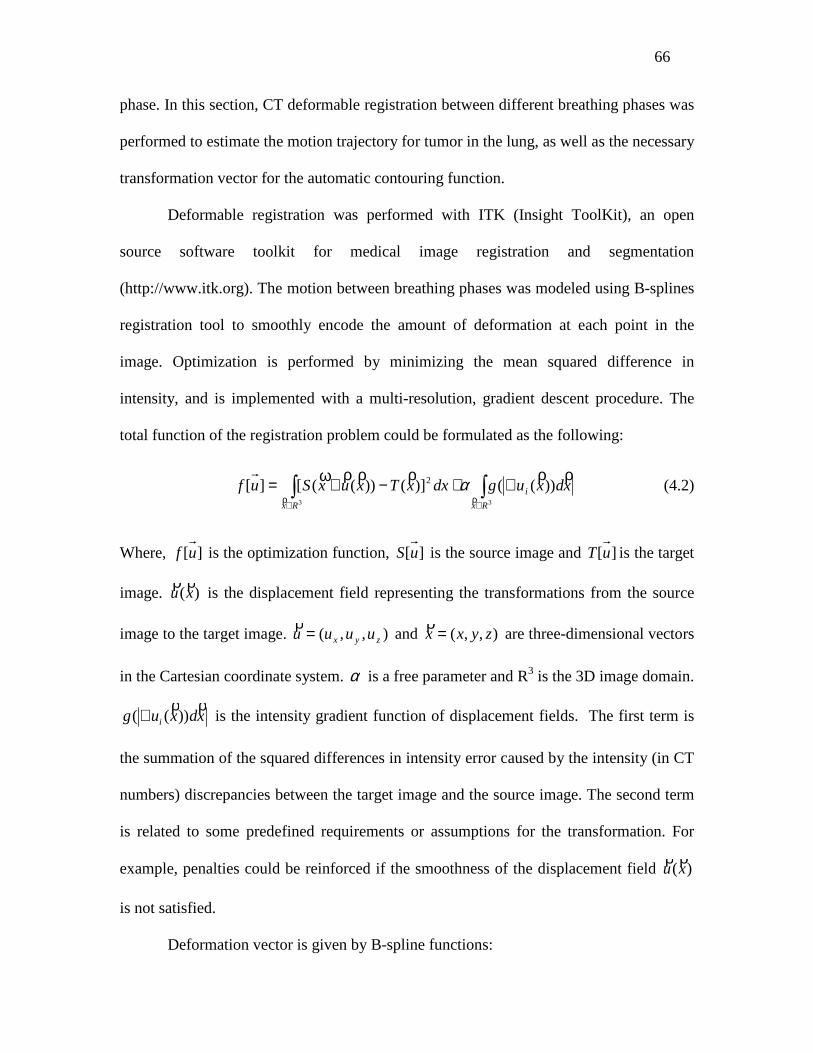
66
phase. In this section, CT deformable registration between different breathing phases was
performed to estimate the motion trajectory for tumor in the lung, as well as the necessary
transformation vector for the automatic contouring function.
Deformable registration was performed with ITK (Insight ToolKit), an open
source software toolkit for medical image registration and segmentation
(http://www.itk.org). The motion between breathing phases was modeled using B-splines
registration tool to smoothly encode the amount of deformation at each point in the
image. Optimization is performed by minimizing the mean squared difference in
intensity, and is implemented with a multi-resolution, gradient descent procedure. The
total function of the registration problem could be formulated as the following:
∫∫∈∈
∇+−+=33
))(()]())(([][ 2
Rx
i
Rx
xdxugdxxTxuxSufρρ
ρρρρρϖ α (4.2)
Where, ][uf is the optimization function, ][uS is the source image and ][uT is the target
image. )(xuρρ
is the displacement field representing the transformations from the source
image to the target image. ),,( zyx uuuu =ρ and ),,( zyxx =ρ
are three-dimensional vectors
in the Cartesian coordinate system. α is a free parameter and R3 is the 3D image domain.
xdxug i
ρρ))((∇ is the intensity gradient function of displacement fields. The first term is
the summation of the squared differences in intensity error caused by the intensity (in CT
numbers) discrepancies between the target image and the source image. The second term
is related to some predefined requirements or assumptions for the transformation. For
example, penalties could be reinforced if the smoothness of the displacement field )(xuρρ
is not satisfied.
Deformation vector is given by B-spline functions:

67
)/( )/()/(),,( 3,,
3,,
3,,
,,,, kzkjijykjiixkji
kjikji zzByyBxxBczyxu −×−×−= ∑
ℵ∈
δδδρρ (4.3)
Where zyx δδδ ,, is the B-spline grid size defined by the user, kjic ,,
ρ is the vector
of coefficient at grid (i,j,k); and kjiB ,,3 is third order B-spline basis function.
The basic steps of the multi-grid method are as follows: (1) convert the original
fine grid problem to multiple hierarchical coarser levels. (2) interpolate the solutions
from the coarsest level to the next finer level using tri-linear interpolation, and recycle the
results at the coarse level as the initial guess for the next level of iterations. (3) Repeat
step (2) until the finest level is reached. This process is efficient because the iterations at
the coarse grid levels are calculated fast and converge quickly. In addition, the smoothing
error appears to be higher in frequency and thus can be naturally fixed in the next finer
grid.
The software determines the 3D nonlinear deformation field required to register
the two volumes by sequentially stepping through the source volume on a 3D cubic
lattice and estimating at each node the displacement vector required to maximize the
correlation coefficient of image intensities in the neighborhood of the node. The
algorithm was applied iteratively in a multi-scale hierarchy on data at different
resolutions, beginning with very blurred data (using an isotropic Gaussian kernel with
full width at half maximum equal to 16 times the image resolution) so that gross features
drive the fit first. In this study, the initial image resolution of 64×64×34
(6.71875×6.71875×10mm3) was chosen as the beginning stage of the deformable
registration. The resulting deformation field was used as a starting point for the next scale
step, where less blurred data (image blurring and lattice grid spacing were reduced after
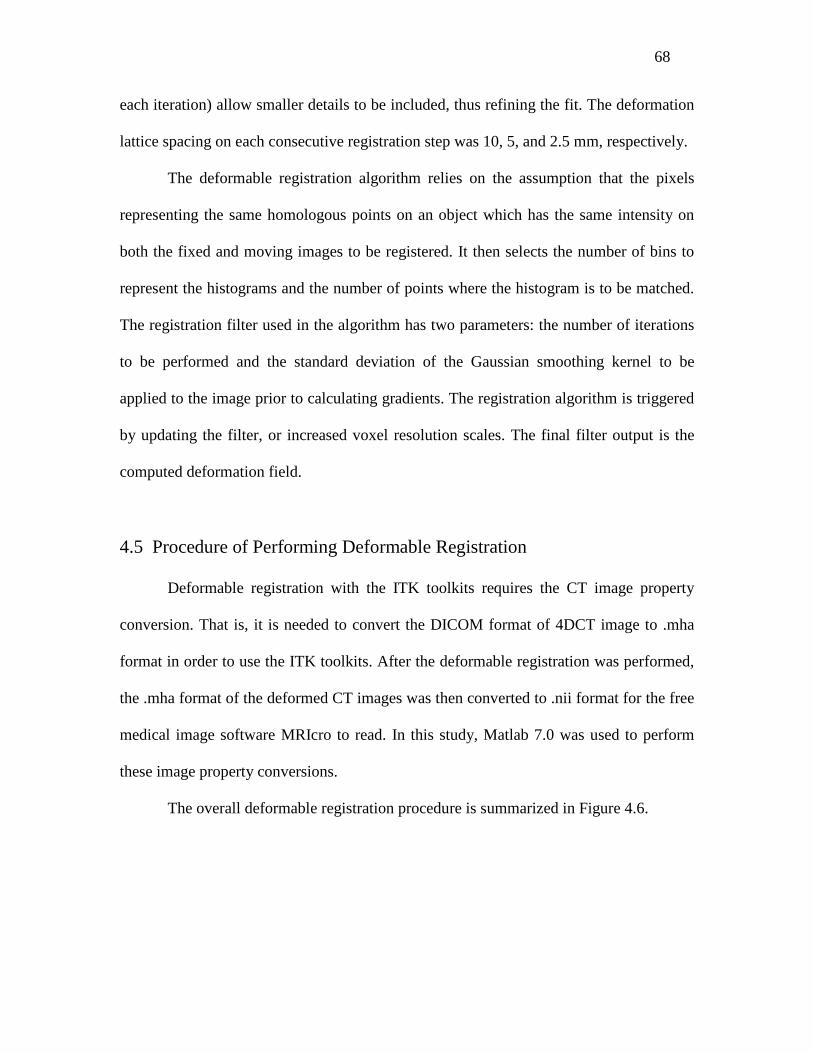
68
each iteration) allow smaller details to be included, thus refining the fit. The deformation
lattice spacing on each consecutive registration step was 10, 5, and 2.5 mm, respectively.
The deformable registration algorithm relies on the assumption that the pixels
representing the same homologous points on an object which has the same intensity on
both the fixed and moving images to be registered. It then selects the number of bins to
represent the histograms and the number of points where the histogram is to be matched.
The registration filter used in the algorithm has two parameters: the number of iterations
to be performed and the standard deviation of the Gaussian smoothing kernel to be
applied to the image prior to calculating gradients. The registration algorithm is triggered
by updating the filter, or increased voxel resolution scales. The final filter output is the
computed deformation field.
4.5 Procedure of Performing Deformable Registration
Deformable registration with the ITK toolkits requires the CT image property
conversion. That is, it is needed to convert the DICOM format of 4DCT image to .mha
format in order to use the ITK toolkits. After the deformable registration was performed,
the .mha format of the deformed CT images was then converted to .nii format for the free
medical image software MRIcro to read. In this study, Matlab 7.0 was used to perform
these image property conversions.
The overall deformable registration procedure is summarized in Figure 4.6.
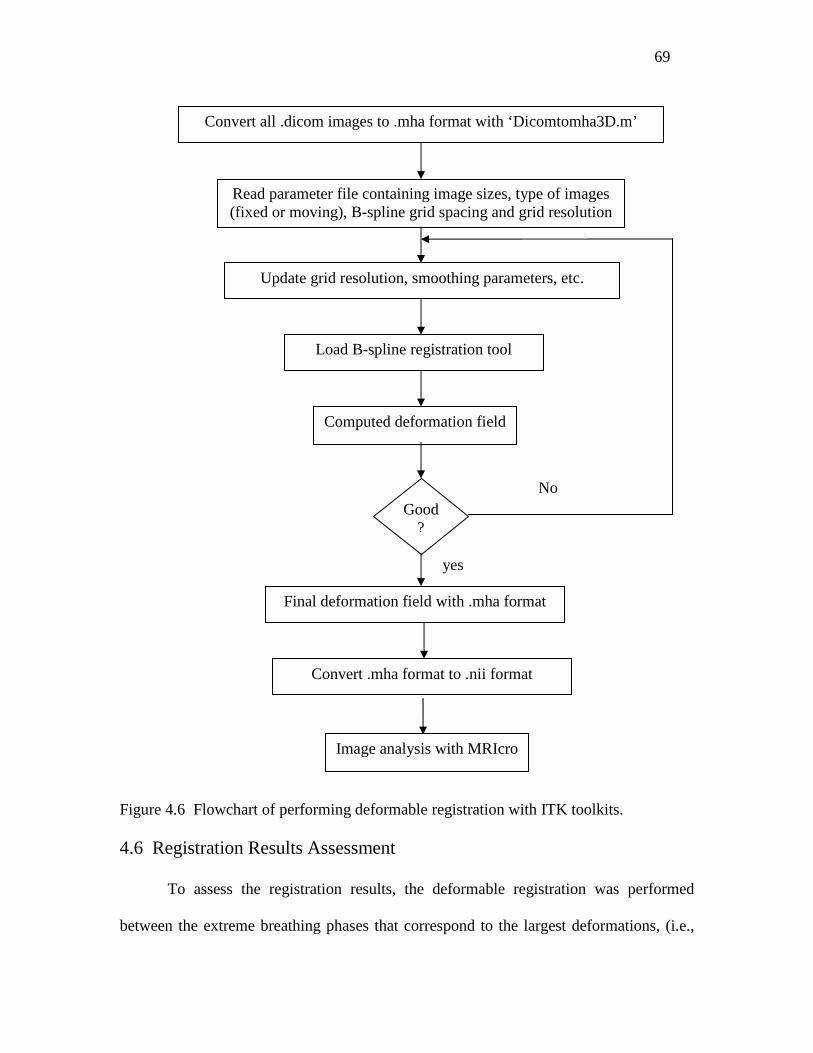
69
Figure 4.6 Flowchart of performing deformable registration with ITK toolkits.
4.6 Registration Results Assessment
To assess the registration results, the deformable registration was performed
between the extreme breathing phases that correspond to the largest deformations, (i.e.,
Convert all .dicom images to .mha format with ‘Dicomtomha3D.m’
Read parameter file containing image sizes, type of images (fixed or moving), B-spline grid spacing and grid resolution
Load B-spline registration tool
Update grid resolution, smoothing parameters, etc.
Computed deformation field
Good ?
Final deformation field with .mha format
No
yes
Convert .mha format to .nii format
Image analysis with MRIcro
70
end of inhale T0 and end of exhale T5). This allows the largest registration error to be
checked.
Figure 4.7 (a) shows the overlaid image of EOI (T0) to EOE (T5) before
deformable registration, and (b) the overlaid image of the final registered T0-to-T5
images and T5 at a specific slice after registration. The CT image of T5 was in grey color
for both image fusion, T0 was in red in (a), and the registered T0-to-T5 images were in
red in (b). The visual inspection of the overlaid images showed a good performance of
the B-spline registration algorithm. Using image fusion tool provided by MRIcro,
deviations can be clearly distinguished from matched regions.
(a) (b)
Figure 4.7 Image fusion from phase T0 (EOI) to phase T5 (EOE) with image resolution
of 256×256×136. (a) Before B-spline deformable registration, T5 in grey color and T0 in
red color; and (b) after deformable registration, T5 in grey color and registered T0-to-T5
images in red color.
71
The registration results of three different image resolution are shown in Figure
4.8: (a) 256×256×136; (b) 128×128×136; and (c) 128×128×68. Visually, there was a
larger error if the resolution is coarser than 128×128×136. If the resolution is finer than
256×256×136, there was no further improvement of registration results, but CPU running
time was doubled. In this study, the resolution of 256×256×136 was chosen for all
deformable registration.
It should be pointed out that, the B-spline deformable registration for the
automated delineation can work well on images with higher contrast, e.g., thoracic CT
images.116, 117 However, some artifacts such as zigzag or irregularly shaped contours can
still exit in low-contrast regions because of image noise and artifacts. Therefore contour
smoothing and manual editing could be necessary as the next step of this study.
4.7 Conclusions
4DCT could give a more accurate description on respiratory related tumor
motion. The extreme breathing phases that correspond to the largest deformations could
be matched with a reasonable accuracy with the B-spline deformable registration with
ITK toolkit and the developed in-house custom software. The automatic contouring tool
could significantly save time for the target delineation from all phases of the respiratory
cycle. The image resolution used during the deformable registration (i.e., 256×256×136)
could bring the registration accuracy to the clinical image resolution level.
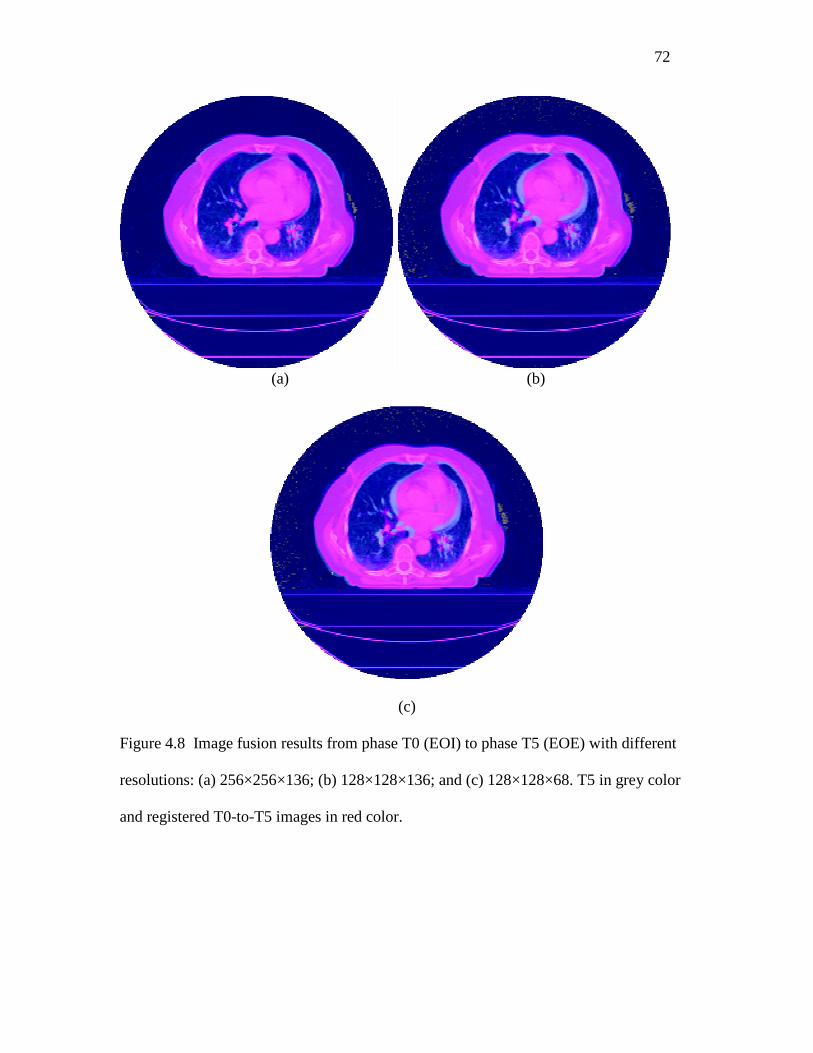
72
(a) (b)
(c)
Figure 4.8 Image fusion results from phase T0 (EOI) to phase T5 (EOE) with different
resolutions: (a) 256×256×136; (b) 128×128×136; and (c) 128×128×68. T5 in grey color
and registered T0-to-T5 images in red color.
73
CHAPTER 5
Evaluation of Lung Tumor Mobility and
Dosimetric Effects with 4DCT
5.1 Methods and Materials
5.1.1 Target Volume Definition
Target volumes were defined as follows in this study: gross tumor volume (GTV)
represents the primary lesion that can be visualized on the CT images; clinical target
volume (CTV) is the GTV volume plus certain margin to account for possible positive
disease. When the treatment target is constantly moving caused by involuntary or
voluntary organ motion, an adequate margin must be applied to the CTV to compensate
this motion. This forms the planning target volume (PTV) upon which the treatment plan
is based. Internal target volume (ITV) is defined as the tumor volume includes the motion
trajectory of the gross target volume (GTV) and possible invasive lesions from each
phase of the 4DCT image scans.
In this Chapter, the tumor volumes were defined both in 3D and 4D. The 3D
volumes were taken from the free breathing helical CT scanner, and 4D volumes were
drawn based on 4DCT scanner with different respiratory phases (e.g., phase 0 to phase 9).
In detail, the 3D target volumes were derived from CTV plus global margin which
include internal organ motion and setup margins. The GTV to CTV margin was set to be
74
8.0 mm to account for possible positive disease.118 The margin for the PTV3D was defined
as another 7.4 mm in lateral (x), 12 mm in longitudinal (y), and 6.8 mm in vertical (z)
direction from the previous clinical experience of lung patient treatment shown in Table
2.4. In total, the GTV to PTV margin is 15.4 mm, 20 mm, and 14.8 mm for lateral,
longitudinal and vertical direction.
The internal target volume ITV from 4DCT encompassed all 10 phase GTV
volumes with the margin of 8.0 mm to account for possible positive disease. Planning
target volume PTV4D was the ITV plus the setup margin (SM). From the previous study
for lung patients in Table 2.4, SM was chosen 5.5 mm, 6.6 mm, and 5.1 mm for lateral
(x), longitudinal (y), and vertical (z) respectively. The final GTV to PTV margin is 13.5
mm, 14.6 mm and 13.1 mm for lateral, longitudinal and vertical directions.
The definition of tumor volume is summarized in Table 5.1.
Table 5.1 Tumor volume definition for both 3DCT and 4DCT in the study
GTV3D From free breathing CT scan
CTV3D GTV3D + 8.0 mm
3D tumor volume
PTV3D CTV3D + (7. 4 mm, 12 mm, 6.8 mm in x, y,
z respectively)
GTV4D From phase 0 to phase 9
ITV4D GTV4D + 8.0 mm
4D tumor volume
PTV4D ITV4D + (5.5 mm, 6.6 mm, 5.1 mm in x, y, z
respectively)
x, y and z stands for lateral, longitudinal, and vertical direction respectively.
5.1.2 Target Volume Analysis and Dosimetric Evaluation
Total of six patients were involved in the tumor mobility study with 4DCT images
in this Chapter. Three patients had left lesion and the other three had right lesion in the
75
lung. Patients’ characters such as disease stage, weight and ages were not included since
this study only investigates the magnitude of tumor motion during different respiratory
phase at this point. The GTV volumes were calculated for each patient from each phase
of respiratory cycle. The GTV percent volume change relative to respiratory phase 2 was
calculated. Phase 2 was chosen as a reference because it is in the middle of EOI (T0) and
EOE (T5) and could be used to check the volume change from the extreme phases. The
definition of respiratory phase was previously defined in Figure 4.4.
The motion of GTV mass center was used to assess the tumor motion during the
ten respiratory phases. The coefficient of variation (standard deviation divided by
average) of GTV was used to evaluate the percentage change of GTV volume during
different respiratory phase. GTV centroid motion trajectories were investigated
throughout respiratory cycle.
The tumor volumes including CTV3D, PTV3D and ITV4D, PTV4D from 3D and 4D
were calculated and compared according to the tumor definition in previous section.
To compare the dosimetric results from with PTV3D and PTV4D, and ensure that
PTV4D could accurately provide sufficient tumor coverage and spare more normal tissue,
two IMRT treatment plans were performed to investigate the dosimetric and biological
effects. The 3D and 4D treatment plans were designed for each patient with different
PTVs: PTV3D and PTV4D. Both of the plans were designed at the free-breathing CT
image. The dose was prescribed so that 95% of PTV volume would receive the full
prescription dose. Five equal spaced beam angles (0°, 72°, 144°, 216°, 288°) with energy
18X were chosen for both plans. The total dose was 66 Gy with 30 fractions.
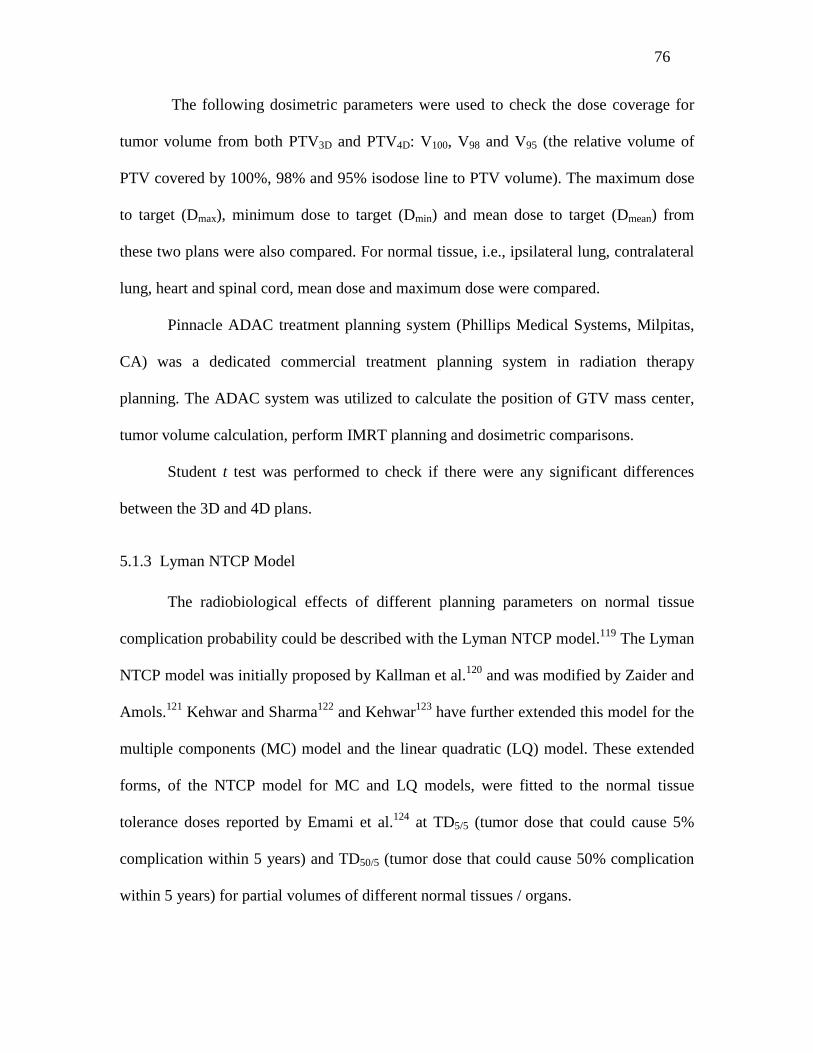
76
The following dosimetric parameters were used to check the dose coverage for
tumor volume from both PTV3D and PTV4D: V100, V98 and V95 (the relative volume of
PTV covered by 100%, 98% and 95% isodose line to PTV volume). The maximum dose
to target (Dmax), minimum dose to target (Dmin) and mean dose to target (Dmean) from
these two plans were also compared. For normal tissue, i.e., ipsilateral lung, contralateral
lung, heart and spinal cord, mean dose and maximum dose were compared.
Pinnacle ADAC treatment planning system (Phillips Medical Systems, Milpitas,
CA) was a dedicated commercial treatment planning system in radiation therapy
planning. The ADAC system was utilized to calculate the position of GTV mass center,
tumor volume calculation, perform IMRT planning and dosimetric comparisons.
Student t test was performed to check if there were any significant differences
between the 3D and 4D plans.
5.1.3 Lyman NTCP Model
The radiobiological effects of different planning parameters on normal tissue
complication probability could be described with the Lyman NTCP model.119 The Lyman
NTCP model was initially proposed by Kallman et al.120 and was modified by Zaider and
Amols.121 Kehwar and Sharma122 and Kehwar123 have further extended this model for the
multiple components (MC) model and the linear quadratic (LQ) model. These extended
forms, of the NTCP model for MC and LQ models, were fitted to the normal tissue
tolerance doses reported by Emami et al.124 at TD5/5 (tumor dose that could cause 5%
complication within 5 years) and TD50/5 (tumor dose that could cause 50% complication
within 5 years) for partial volumes of different normal tissues / organs.
77
The Lyman NTCP model assumes a sigmoid dose–response relationship with no
threshold, and could be depicted as in Equation (5.1):
∫ ∞−
−==t x dxetNTCP 2/2
2
1)(
πφ (5.1)
Where
)(
)(
50
50
vTDm
vTDDt
⋅−
=
TD50(v) represents the tolerances doses associated with a 50% chance of complications
for uniform partial normal tissue irradiation. TD50(v) is related to the whole organ (v =1)
tolerance through the power law relationship:
nvTDvTD −⋅= )1()( 5050 (5.2)
TD50(1) represents the tolerance dose of the whole organ to irradiation, m characterizes
the steepness of the dose– response at TD50(1), and n represents the volume effect, which
relates the tolerance doses of uniform whole organ irradiation to uniform partial organ
irradiation. When n is near 1, the volume effect is large and when it is near 0, the volume
effect is small.
5.2 Results and Discussion
5.2.1 Target Volume Analysis
The comparison of GTV volumes from different respiratory phases on the 4DCT
of six patients and results of GTV motion amplitudes for each patient over the whole
respiratory cycle were summarized in Table 5.2. The average GTV volume ranged from
78
4.5±0.1 cc to 67.9±2.1 cc. The mean GTV volume was 26.4 cc from these six patients.
The coefficient of variation (standard deviation divided by average) of GTV ranged from
2.4% to 4.8% with an average of 3.4% during a respiratory cycle. The 3D centroid
motion peak-to-peak amplitude of the GTVs caused by respiration ranged from 3.0 mm
to 10.4 mm with average of 5.8 mm and standard deviation of 2.5 mm. Patient #1 has
largest mass center deviation and patient #5 has the smallest deviation.
Table 5.2 GTV volume study and GTV center motion during respiratory cycle for six
patients.
GTV volume, cc GTV center motion, mm
Patient Location average SD SD/avg (%) x y z 3D
1 RUL 29.3 0.8 2.9 5.7 8.5 2.1 10.5
2 LLL 18.5 0.5 2.9 1.2 4.7 0.9 4.9
3 LUL 5.8 0.3 4.8 1.5 4.2 1.9 4.9
4 RLL 67.9 2.1 3.1 3.6 3.8 2.1 5.6
5 RUL 4.5 0.1 2.4 0.7 2.9 0.3 3.0
6 LLL 32.2 1.3 4.0 3.1 4.3 2.2 5.7
Mean 26.4 0.9 3.4 2.6 4.7 1.6 5.8
SD 23.4 0.7 0.9 1.9 1.9 0.8 2.5
Max 67.9 2.1 4.8 5.7 8.5 2.2 10.4
Min 4.5 0.1 2.4 0.7 2.9 0.3 3.0
Abbreviations: RUL = right upper lung; LLL = left lower lung, LUL = left upper lung,
SD = standard deviation; x = lateral; y = longitudinal; z = vertical; 3D = three
dimensional vector.
The mean GTV center motion from the 4D studies were 5.8 mm, which is similar
to the 3D vector obtained from previous intrafractional organ motion study
( 97.57.14.59.1 222 =++ mm, Table 2.4). This shows that the 4DCT data gave a
relative accurate description about the real intrafractional organ motion.
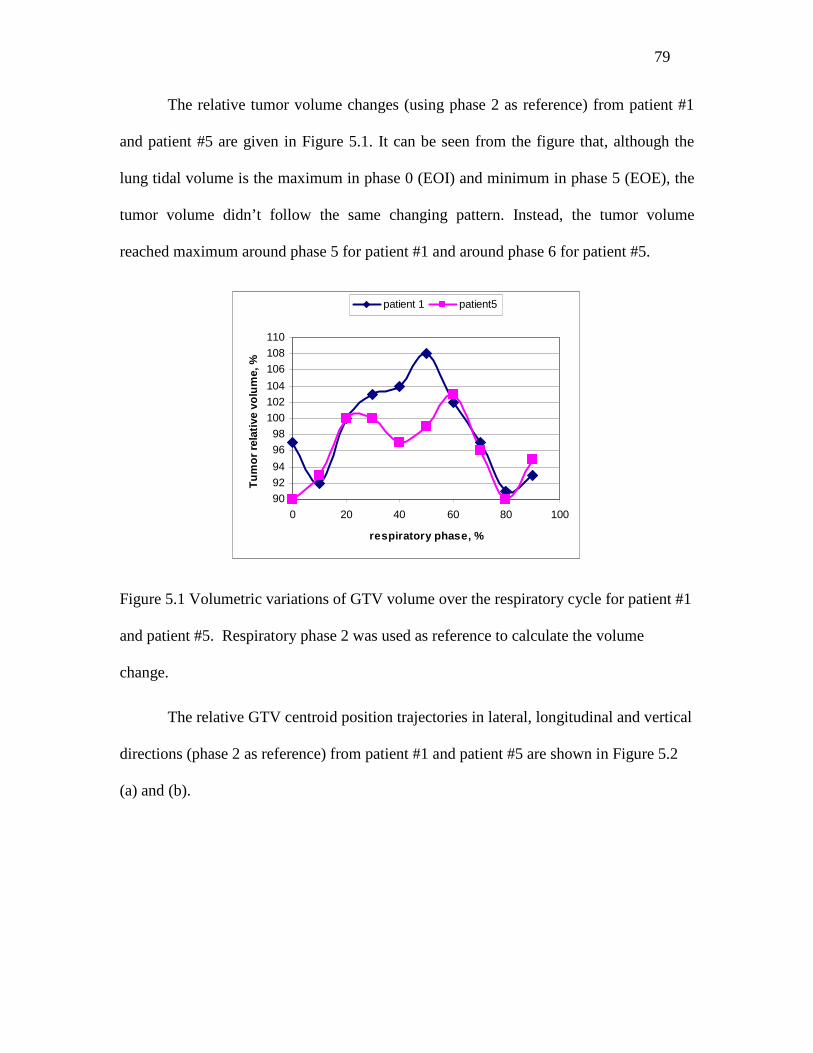
79
The relative tumor volume changes (using phase 2 as reference) from patient #1
and patient #5 are given in Figure 5.1. It can be seen from the figure that, although the
lung tidal volume is the maximum in phase 0 (EOI) and minimum in phase 5 (EOE), the
tumor volume didn’t follow the same changing pattern. Instead, the tumor volume
reached maximum around phase 5 for patient #1 and around phase 6 for patient #5.
90
92
94
96
98
100
102
104
106
108
110
0 20 40 60 80 100
respiratory phase, %
Tu
mo
r re
lati
ve v
olu
me,
%
patient 1 patient5
Figure 5.1 Volumetric variations of GTV volume over the respiratory cycle for patient #1
and patient #5. Respiratory phase 2 was used as reference to calculate the volume
change.
The relative GTV centroid position trajectories in lateral, longitudinal and vertical
directions (phase 2 as reference) from patient #1 and patient #5 are shown in Figure 5.2
(a) and (b).

80
-4
-2
0
2
4
6
0 20 40 60 80 100
respiratory phase, %
rela
tive
po
siti
on
, mm
lateral longitudinal vertical
-6
-4
-2
0
2
4
6
0 20 40 60 80 100
respiratory phase, %
rela
tive
po
siti
on
, m
m
lateral longitudinal vertical
(a) (b)
Figure 5.2 GTV volume centroid motion trajectories for patient #1(a) and patient #5 (b)
throughout respiratory cycle in three dimensions.
Patient #1 showed a larger displacement in all the three directions compared to
Patient #5. There was no similar motion pattern in the direction between these two
patients, although the tumors were located in the similar position, i.e., RUL from these
two patients. The relative position of each of the three directions was also independent in
the lateral, longitudinal and vertical direction for both patients.
5.2.2 Comparison of Target Volumes from 3DCT and 4DCT
The tumor volumes including CTV3D, PTV3D and ITV4D, PTV4D were calculated
and compared for each patient using the ADAC treatment planning system. The tumor
volumes from 3D and 4D are summarized in Table 5.3. The average PTV volume in the
4D was 304.2 cc, and average PTV volume in 3D was 367.0 cc. The PTV4D was 18.7%
(range 11.2–26.8%) less than the 3D plans. Although the tumor was located in different
position, the PTV4D volumes were smaller than PTV3D in all 6 patients.
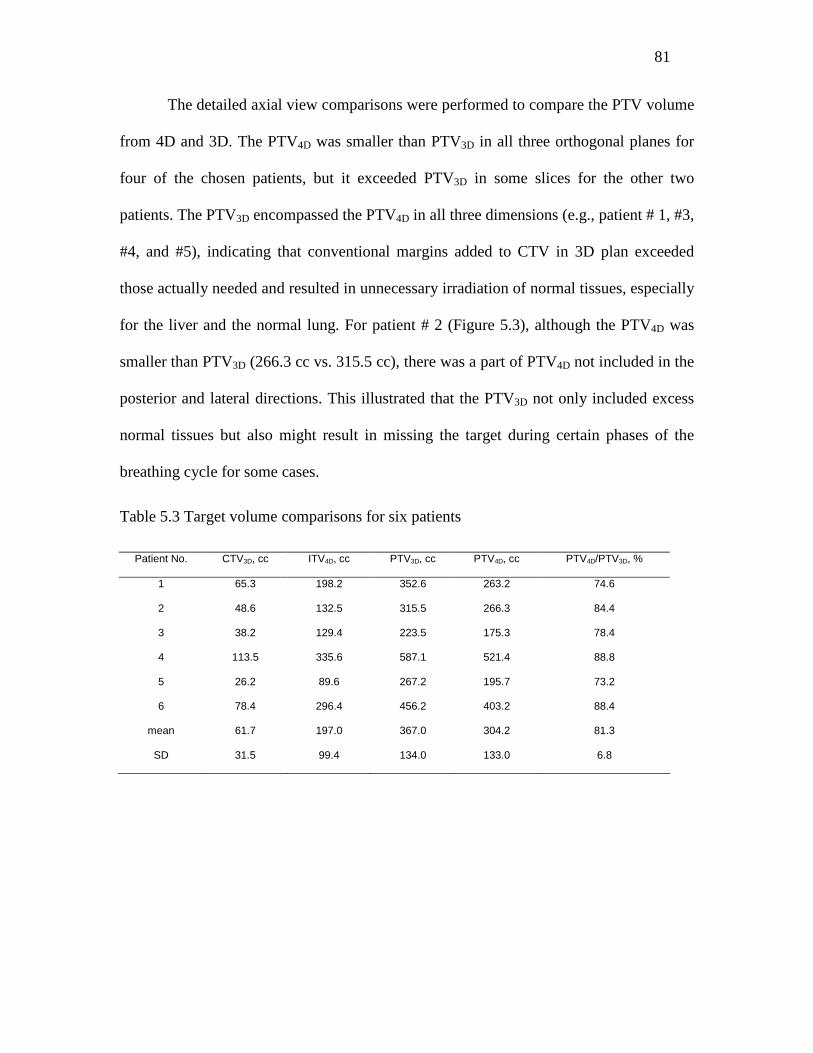
81
The detailed axial view comparisons were performed to compare the PTV volume
from 4D and 3D. The PTV4D was smaller than PTV3D in all three orthogonal planes for
four of the chosen patients, but it exceeded PTV3D in some slices for the other two
patients. The PTV3D encompassed the PTV4D in all three dimensions (e.g., patient # 1, #3,
#4, and #5), indicating that conventional margins added to CTV in 3D plan exceeded
those actually needed and resulted in unnecessary irradiation of normal tissues, especially
for the liver and the normal lung. For patient # 2 (Figure 5.3), although the PTV4D was
smaller than PTV3D (266.3 cc vs. 315.5 cc), there was a part of PTV4D not included in the
posterior and lateral directions. This illustrated that the PTV3D not only included excess
normal tissues but also might result in missing the target during certain phases of the
breathing cycle for some cases.
Table 5.3 Target volume comparisons for six patients
Patient No. CTV3D, cc ITV4D, cc PTV3D, cc PTV4D, cc PTV4D/PTV3D, %
1 65.3 198.2 352.6 263.2 74.6
2 48.6 132.5 315.5 266.3 84.4
3 38.2 129.4 223.5 175.3 78.4
4 113.5 335.6 587.1 521.4 88.8
5 26.2 89.6 267.2 195.7 73.2
6 78.4 296.4 456.2 403.2 88.4
mean 61.7 197.0 367.0 304.2 81.3
SD 31.5 99.4 134.0 133.0 6.8
82
Figure 5.3 Comparison of PTV3D (red) and PTV4D (yellow). This figure illustrated that
the volume of PTV4D was not covered by PTV3D in the posterior and right direction on
the selected slice. Top: transverse views; Bottom-left: sagittal views; Bottom-right:
coronal views.
5.2.3 Dosimetric Evaluation of Target Volumes
The parameters of the Lyman NTCP (Normal tissue complication probability)
model for lung, heart and spinal cord, TD50, n, and m are summarized in Table 5.4. These
parameters were derived from the studies by Burman et al.125
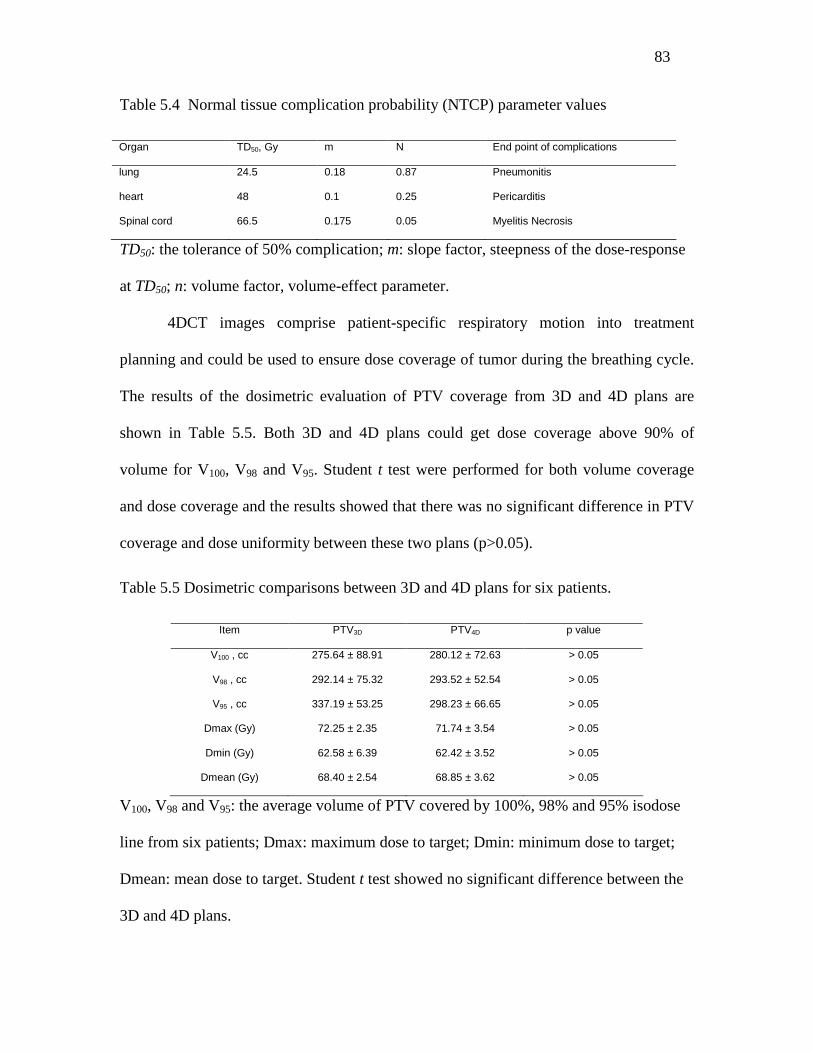
83
Table 5.4 Normal tissue complication probability (NTCP) parameter values
Organ TD50, Gy m N End point of complications
lung 24.5 0.18 0.87 Pneumonitis
heart 48 0.1 0.25 Pericarditis
Spinal cord 66.5 0.175 0.05 Myelitis Necrosis
TD50: the tolerance of 50% complication; m: slope factor, steepness of the dose-response
at TD50; n: volume factor, volume-effect parameter.
4DCT images comprise patient-specific respiratory motion into treatment
planning and could be used to ensure dose coverage of tumor during the breathing cycle.
The results of the dosimetric evaluation of PTV coverage from 3D and 4D plans are
shown in Table 5.5. Both 3D and 4D plans could get dose coverage above 90% of
volume for V100, V98 and V95. Student t test were performed for both volume coverage
and dose coverage and the results showed that there was no significant difference in PTV
coverage and dose uniformity between these two plans (p>0.05).
Table 5.5 Dosimetric comparisons between 3D and 4D plans for six patients.
Item PTV3D PTV4D p value
V100 , cc 275.64 ± 88.91 280.12 ± 72.63 > 0.05
V98 , cc 292.14 ± 75.32 293.52 ± 52.54 > 0.05
V95 , cc 337.19 ± 53.25 298.23 ± 66.65 > 0.05
Dmax (Gy) 72.25 ± 2.35 71.74 ± 3.54 > 0.05
Dmin (Gy) 62.58 ± 6.39 62.42 ± 3.52 > 0.05
Dmean (Gy) 68.40 ± 2.54 68.85 ± 3.62 > 0.05
V100, V98 and V95: the average volume of PTV covered by 100%, 98% and 95% isodose
line from six patients; Dmax: maximum dose to target; Dmin: minimum dose to target;
Dmean: mean dose to target. Student t test showed no significant difference between the
3D and 4D plans.
84
The ipsilateral lung was defined as the contoured ipsilateral lung volume minus
the PTV. Table 5.6 summarizes the dosimetric comparison between 3D plan and 4D plan
for all OARs in six patients. Figure 5.4 illustrates an example of the dose volume
histogram (DVH) comparison for heart and ipsilateral lung between the two plans for
patient #4. The 4D plan spared more ipsilateral lung and heart than 3D plan. The mean
dose for ipsilateral lung and heart were reduced from 19.74 ± 4.21 Gy and 11.87 ± 3.35
Gy to 6.16 ± 3.26 Gy and 6.08 ± 1.28 Gy (p<0.001). There were no statistical
significance for contralateral lung and heart between 3D and 4D plans. This is because
these two OARs were relatively far away from the PTV and there is no overlapping area
between these organs and PTVs.
Table 5.6 Dosimetric comparisons of OARs between 3D and 4D plans for six patients
OARs Doses PTV3D PTV4D p value
Ipsilateral lung Mean dose (Gy) 19.74 ±4.21 6.16± 3.26 <0.001
Max dose (Gy) 71.93 ± 12.41 52.35 ± 19.54 <0.001
Contralateral lung Mean dose (Gy) 1.14 ± 0.82 1.10 ± 0.68 ns
Max dose (Gy) 18.41 ± 7.23 16.28 ± 8.52 ns
Heart Mean dose (Gy) 11.87 ± 3.35 6.08 ±1.28 <0.001
Max dose (Gy) 55.41 ± 19.52 32.11 ± 18.96 <0.001
Spinal Cord Mean dose (Gy) 2.10 ± 1.01 1.95 ± 2.14 ns
Max dose (Gy) 25.74 ± 3.45 24.61 ± 5.43 ns
Student t test showed that there was no significant difference in contralateral lung and
spinal cord between the 3D and 4D plans. ns: not significant.
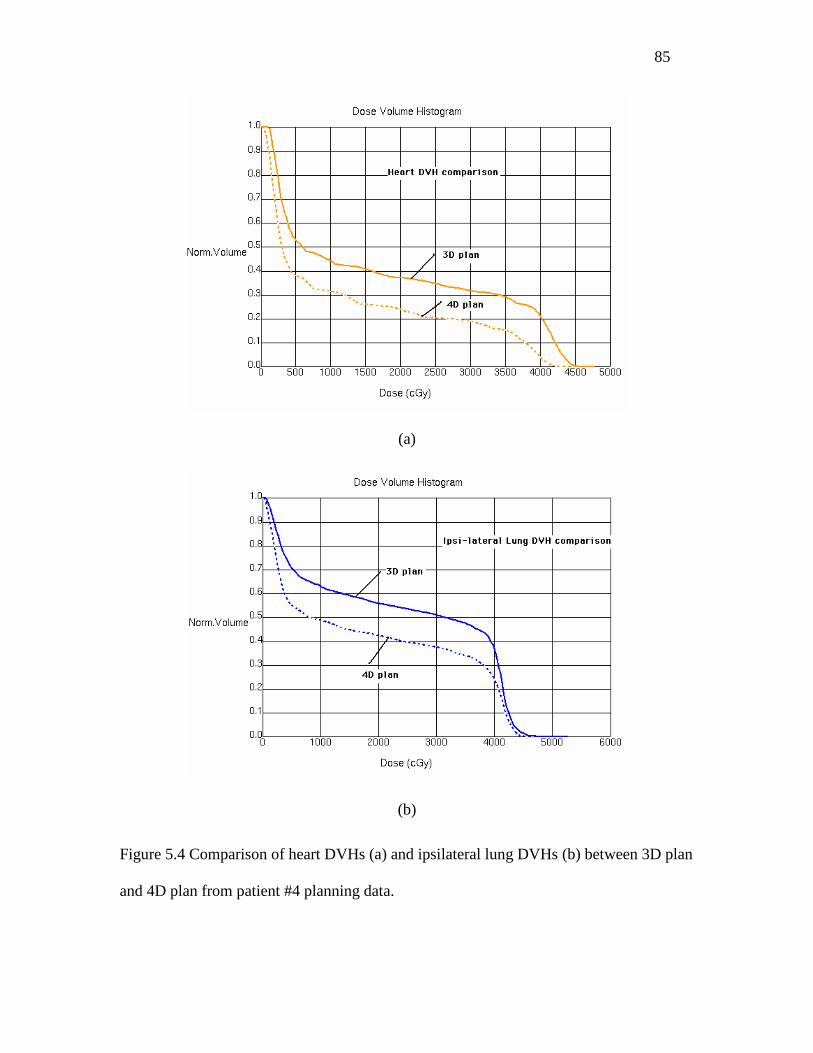
85
(a)
(b)
Figure 5.4 Comparison of heart DVHs (a) and ipsilateral lung DVHs (b) between 3D plan
and 4D plan from patient #4 planning data.

86
Normal tissue complication probability (NTCP) comparison between 3D and 4D
plans for ipsilateral lung, contralateral lung, cord and heart for six patients are
summarized in Table 5.7. The NTCP from 4D plan was smaller than 3D plan for both
ipsilateral lung and heart, and the differences were statistically significant. Since there
was no biologically significant dose given to contralateral lung and spinal cord, these two
OARs showed zero NTCP in this study.
Table 5.7 NTCP comparison between OARs for six patients.
NTCP values
3D plan (%)
NTCP values
4D plan (%)
P value
Ipsilateral lung 5.64 ± 2.85 2.15 ± 1.54 <0.001
Contralateral lung 0* 0* na
Spinal cord 0* 0* na
heart 12.53 ± 9.87 5.45 ± 4.22 <0.001
*NTCP for contralateral lung and spinal cord was zero because there was no biologically
significant dose given to them. Student t test showed that there was a significant
difference for ipsilateral lung and heart between the 3D and 4D plans.
The study on target volume obtained from both 3D and 4D plans showed that the
PTV4D was smaller than PTV3D (81.3% ± 6.8%) for all patients. This indicated that tumor
motion was smaller than 3D plan estimation, so there could be unnecessary normal tissue
being irradiated. However, for some cases, PTV4D was smaller than PTV3D (e.g., Patient
#2), and there was some part of PTV4D not included in the PTV3D. If the margins were
chosen according to the current conventional experience (i.e., 7.4 mm lateral, 12 mm
longitudinal and 6.8 mm vertical), both geometric miss of target and overdose of normal
tissue could happen.
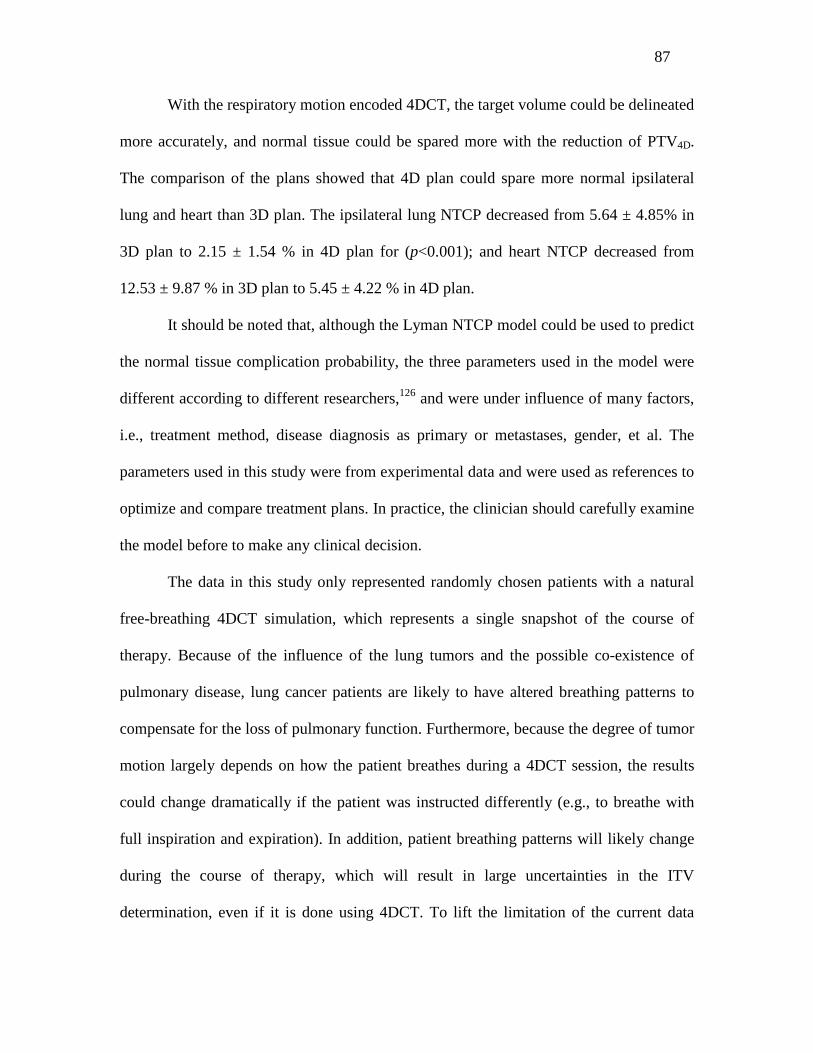
87
With the respiratory motion encoded 4DCT, the target volume could be delineated
more accurately, and normal tissue could be spared more with the reduction of PTV4D.
The comparison of the plans showed that 4D plan could spare more normal ipsilateral
lung and heart than 3D plan. The ipsilateral lung NTCP decreased from 5.64 ± 4.85% in
3D plan to 2.15 ± 1.54 % in 4D plan for (p<0.001); and heart NTCP decreased from
12.53 ± 9.87 % in 3D plan to 5.45 ± 4.22 % in 4D plan.
It should be noted that, although the Lyman NTCP model could be used to predict
the normal tissue complication probability, the three parameters used in the model were
different according to different researchers,126 and were under influence of many factors,
i.e., treatment method, disease diagnosis as primary or metastases, gender, et al. The
parameters used in this study were from experimental data and were used as references to
optimize and compare treatment plans. In practice, the clinician should carefully examine
the model before to make any clinical decision.
The data in this study only represented randomly chosen patients with a natural
free-breathing 4DCT simulation, which represents a single snapshot of the course of
therapy. Because of the influence of the lung tumors and the possible co-existence of
pulmonary disease, lung cancer patients are likely to have altered breathing patterns to
compensate for the loss of pulmonary function. Furthermore, because the degree of tumor
motion largely depends on how the patient breathes during a 4DCT session, the results
could change dramatically if the patient was instructed differently (e.g., to breathe with
full inspiration and expiration). In addition, patient breathing patterns will likely change
during the course of therapy, which will result in large uncertainties in the ITV
determination, even if it is done using 4DCT. To lift the limitation of the current data
88
sets, further studies should be pursued to prospectively assess the effects of changes in
breathing patterns and tumor anatomy during the course of therapy by performing
multiple 4DCT sessions in lung cancer patients.
5.3 Conclusions
Tumor motion trajectory does not necessary change with respiratory phases. For
example, although the lung tidal volume is the maximum in phase 0 and minimum in
phase 5, the tumor volume didn’t follow the same pattern. Instead, the tumor volume
reached maximum around phase 5 for patient #1 and around phase 6 for patient #5.
The PTV4D volumes were smaller than PTV3D in all six patients, no matter where
the tumor was located in the lung. The dosimetric studies of PTV volume comparison
between 3D and 4D plans showed that conventional margins added to CTV in 3D plan
exceeded those actually needed and resulted in unnecessary irradiation of normal tissue.
Detailed transverse view comparison showed that PTV3D not only included excess
normal tissues, but also might result in missing the target during certain phases of the
breathing cycle in some cases.
4DCT images comprise patient-specific respiratory motion into treatment
planning and could be used to ensure dose coverage of tumor during the breathing cycle.
The IMRT planning comparison demonstrated that the 4D plan spared more normal
tissue, e.g., ipsilateral lung and heart than 3D plan.
89
CHAPTER 6
Conclusions and Future Work
6.1 Conclusions
This study focused on using imaging guidance techniques to investigate organ
motion which includes positional organ motion (or setup uncertainties) and internal organ
motion during the daily radiation therapy treatment.
In Chapter 2, the interfractional setup uncertainties and intrafractional internal
organ motion from different anatomic sites were studied with Helical TomoTherapy unit.
The pre-treatment MVCT, which provides the real-time tumor and organ shift
coordinates, was used to improve the accuracy of patient positioning. The setup errors of
the five sites: HN, brain, prostate, abdomen and lung, were analyzed in this chapter.
Among them, the mean interfractional setup errors for HN and brain were the smallest.
The mean setup errors in the 3D translational for the five sites were 2.2 mm, 2.3 mm, 3.2
mm, 4.4 mm and 7.7 mm, respectively. The largest motion in lung was in the longitudinal
direction, with mean error of 6.0 mm and standard deviation of 4.8 mm. The mean
rotational variation for the five sites ranged from 0.2° to 0.5°, with the standard deviation
from 0.7° to 0.9°. The maximum three dimensional intrafractional displacements were
within 4.5mm. The observed overall variation from interfractional setup uncertainties was
larger than the intrafractional organ motion. The setup variations from lateral,
longitudinal and vertical were randomly distributed. The interfractional system errors and
random errors were analyzed and the suggested margin for the five sites ranged from 4.2
90
to 8.2 mm, 5.0 mm to 12.0 mm, and 1.5 mm to 6.8 mm, in the direction of lateral,
longitudinal and vertical, respectively.
In Chapter 3, preliminary data for lung SBRT using the MIDCO BodyLoc whole
body stereotactic localizer, combined with TomoTherapy MVCT image guidance, were
studied. In this chapter, eight lung cancer cases where the patients were treated with
SBRT were retrospectively analyzed, and in total, 224 tumor shifts were recorded and
analyzed to assess inter- and intrafractional tumor motion. For interfraction, the mean
setup errors and standard deviations averaged across all patients were -1.1 ±2.8 mm, -2.5
±8.7 mm, and 4.1 ±2.6 mm for lateral, longitudinal, and vertical variation, respectively;
the mean setup rotational variation was -0.3° ±0.7°; and the maximum motion was 13.5
mm in the longitudinal direction. For intrafraction, the mean setup errors and standard
deviations averaged across all patients were 0.1 ±0.7 mm, -0.3 ±2.0 mm, and 0.5 ±1.1
mm for the lateral, longitudinal, and vertical displacements, respectively; the mean
rotational variation was 0.1° ±0.2°; and the maximum motion was 3.8 mm in the
longitudinal direction. By comparing 3D displacement in the patient group with and
without BodyLoc immobilization, the results showed that internal organ motion was
reduced effectively by the BodyLoc immobilization devices. With the use of BodyLoc
immobilization devices, the mean 3D displacement was reduced from 3.5mm to 1.7mm.
Furthermore, no significant correlation was observed among patient characteristics, setup
uncertainties and organ motion; and the interfractional setup uncertainties were higher
than the observed intrafractional organ motion. These results suggest that image-guided
stereotactic body radiotherapy using the BodyLoc system with TomoTherapy is a safe
and reliable treatment method and can provide highly accurate target localization.
91
The application of B-spline deformable registration for four dimensional radiation
therapy (4DRT) was investigated in Chapter 4. 4DCT is one of the clinically valuable
tools for assessing respiration and tumor movement. Deformable registration between
different breathing phases was performed with an algorithm to estimate the motion
trajectory of the tumor. In this algorithm, the optimization is performed by minimizing
the mean squared difference in intensity, and is implemented with a multi-resolution,
gradient descent procedure. This algorithm saves clinician time for target delineation on
only certain respiratory phases of the respiratory cycle in stead of all phases. The
deformable registration was performed and tested between the extreme breathing phases
and gives reasonably good results.
Chapter 5 described a lung tumor mobility evaluation study and compared
dosimetric effects from 4DCT and traditional helical 3D CT scan. Respiratory GTV
motion was characterized by assessing the GTV mass center in three dimensions with
4DCT. The coefficient of variation (standard deviation divided by average) of GTV
ranged from 2.4% to 4.8% with an average of 3.4% during a respiratory cycle. The 3D
centroid motion peak-to-peak amplitude of the GTVs caused by respiratory ranged from
3.0 mm to 10.4 mm, with an average of 5.8 mm and standard deviation of 2.5 mm. The
averaged PTV volume for the selected six patients in the 4D (PTV4D) was 304.2 cc and
the averaged PTV volume in 3D (PTV3D) was 367.0 cc. On average, the PTV4D was
18.7% (range 11.2–26.8%) less than the PTV3D. For some patients, although PTV4D was
smaller than PTV3D (e.g., 266.3 cc vs. 315.5 cc), there was a part of PTV4D not included
in the posterior and lateral directions. This illustrated that PTV3D not only included
excess normal tissues in SI direction but also might result in missing the target during
92
certain phases of the breathing cycle. Statistically, the normal tissue complication
probability (NTCP) from 4D plan was significantly smaller than 3D plan for both
ipsilateral lung and heart.
In summary, this study has the following significance for both clinical and
research purposes:
Firstly, a large patient population is involved in this positional organ motion
study. Although there have been some publications on the similar research, this is one of
the few studies that include five anatomy sites with a systematic study. The analytic
results of interfractional setup uncertainties and intrafractional internal organ motion on
these sites showed that the use of pre-treatment MVCT reduced the systematical setup
error and hence can be used to improve the accuracy of patient positioning.
Secondly, this is the first study reported on the benefits of BodyLoc
immobilization devices. The BodyLoc device is developed in-house with a neurosurgeon
who worked very closely with the author. This device is under the application of FDA
approval and ready for clinical application. The preliminary data for lung SBRT using
this device, combining with TomoTherapy MVCT image guidance, showed significant
improvement on tracking patient positional and organ motions and hence can produce a
much better treatment outcome.
Thirdly, other than the usual clinical practice of using manual contour on each of
the phases on 4DCT images to obtain ITV, this study attempts a real-time automatic
segmentation delineation. This work significantly reduces radiation oncologist’s time and
has the potential of helping tracking anatomic changes and evaluating daily treatments in
the future.
93
6.2 Future Work
6.2.1 Unresolved Issues in 4DCT
Although 4DCT is capable of providing accurate information on target and organ
motion, there are some inherent issues that need to be further investigated. Among them,
the first is that 4DCT uses phase rather than amplitude to sort data. If the breathing were
perfectly regular from cycle to cycle, then phase- and amplitude-based sorting would give
very similar results. However, inconsistent results arise when there is a variation in
amplitude, period, or in baseline, or when the onset of end-expiration does not occur at
the same point of each cycle. Under these circumstances, the sorted CT images may
contain mismatch artifacts at the interface between bed positions (see Figure 6.1). Recent
studies have investigated amplitude-based binning as an alternative to the phase-based
approach, which may improve image quality in many cases.127 Other researchers have
matched adjacent CT slices without using a respiratory trace, by maximizing the
continuity of CT units integrated over regions of interest.35 The second issue with 4DCT
is that there is a correlation between external fiducial movement and tumor and organ
motion. Amplitude ratios between fiducial and tumor displacement may vary from cycle
to cycle, and thoracic and abdominal points may involve relative phase shifts.128 These
shifts may be especially crucial for tumors near the lung, where hysteresis is prevalent.
The third issue is that larger organs such as the liver can experience substantial
deformation during inspiration and expiration, which may not be adequately captured by
rigid-body interpolation between points in the respiratory cycle.
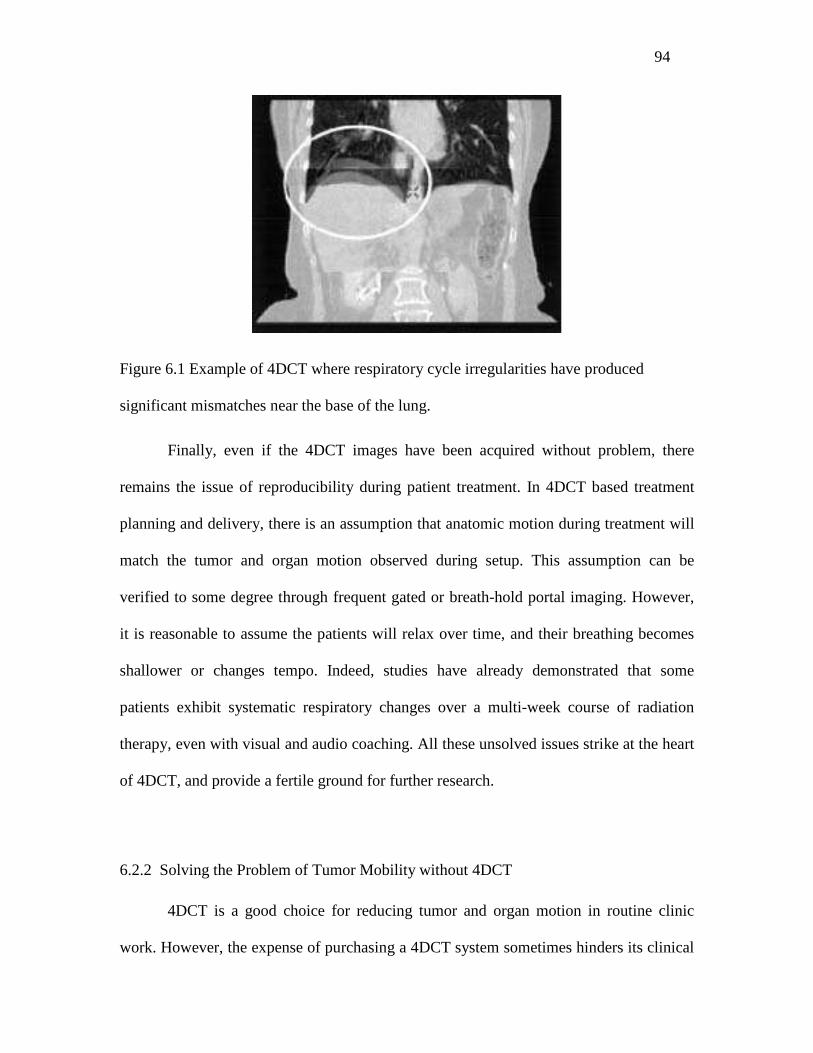
94
Figure 6.1 Example of 4DCT where respiratory cycle irregularities have produced
significant mismatches near the base of the lung.
Finally, even if the 4DCT images have been acquired without problem, there
remains the issue of reproducibility during patient treatment. In 4DCT based treatment
planning and delivery, there is an assumption that anatomic motion during treatment will
match the tumor and organ motion observed during setup. This assumption can be
verified to some degree through frequent gated or breath-hold portal imaging. However,
it is reasonable to assume the patients will relax over time, and their breathing becomes
shallower or changes tempo. Indeed, studies have already demonstrated that some
patients exhibit systematic respiratory changes over a multi-week course of radiation
therapy, even with visual and audio coaching. All these unsolved issues strike at the heart
of 4DCT, and provide a fertile ground for further research.
6.2.2 Solving the Problem of Tumor Mobility without 4DCT
4DCT is a good choice for reducing tumor and organ motion in routine clinic
work. However, the expense of purchasing a 4DCT system sometimes hinders its clinical

95
implementation. For a clinic with limited budget, other non-4DCT approaches to reduce
the tumor and organ motion need to be considered. Currently, there are several ways to
handle the problem of tumor mobility in radiotherapy planning without using 4DCT. One
approach is to use breath hold devices to immobilize the patient,129 which shows a
significant reduction of target motion. Another approach is to use respiratory gating130
that does not directly compensate for breathing motion, so the radiation beam is switched
off whenever the target is outside a predefined window. In clinic, a combination of both
approaches is often applied, and the commercial systems based on them are currently
available, e.g., deep inspiration breath hold131 or active breath control132. Breath-holding
techniques have the potential to reduce the effects of breathing motion,58 however, in
practice they are limited by the fact that many patients cannot tolerate holding their
breath. On the other hand, gating techniques significantly increase the expense of time for
the patient and the physician. There are some attempts to explicitly account for free
breathing but these efforts suffer from little existing knowledge regarding the spatial-
temporal behavior of anatomical and pathological structures involved. In a current study,
the tracking of the tumor motion is done by a combination of external infrared emitters
on the patient's surface and implanted gold fiducials. The position of the gold fiducials is
then computed repeatedly by x-ray imaging. Although this may solve the technical
problems arising for motion adaptive radiation therapy, an accurate non-invasive tracking
method for following the tumor motion is still needed.
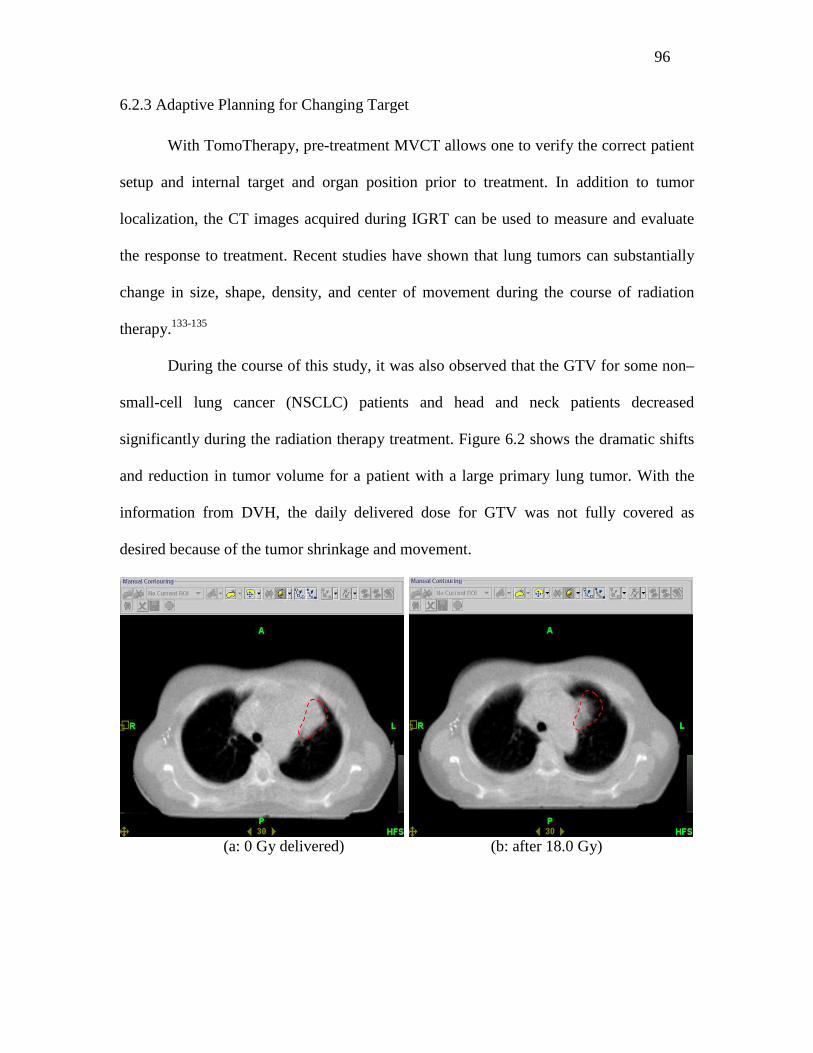
96
6.2.3 Adaptive Planning for Changing Target
With TomoTherapy, pre-treatment MVCT allows one to verify the correct patient
setup and internal target and organ position prior to treatment. In addition to tumor
localization, the CT images acquired during IGRT can be used to measure and evaluate
the response to treatment. Recent studies have shown that lung tumors can substantially
change in size, shape, density, and center of movement during the course of radiation
therapy.133-135
During the course of this study, it was also observed that the GTV for some non–
small-cell lung cancer (NSCLC) patients and head and neck patients decreased
significantly during the radiation therapy treatment. Figure 6.2 shows the dramatic shifts
and reduction in tumor volume for a patient with a large primary lung tumor. With the
information from DVH, the daily delivered dose for GTV was not fully covered as
desired because of the tumor shrinkage and movement.
(a: 0 Gy delivered) (b: after 18.0 Gy)

97
(c: after 64 Gy)
Figure 6.2 Changes in lung tumor volume and shape during the radiation treatment.
Panel (a-c): comparison of a lung patient taken at the 1st (a), after 18.0 Gy (b), and after
64 Gy (c) using a daily dose of 2.0 Gy/fx.
Tumor volume changes also occur to other anatomic sites such as head and neck.
Figure 6.3 shows the obvious response of one head and neck patient to radiation from
treatment day #1 to day #10 and day #20. The DVHs in the figure were obtained by
overlaying the initial treatment planning on the original tumor and OARs.
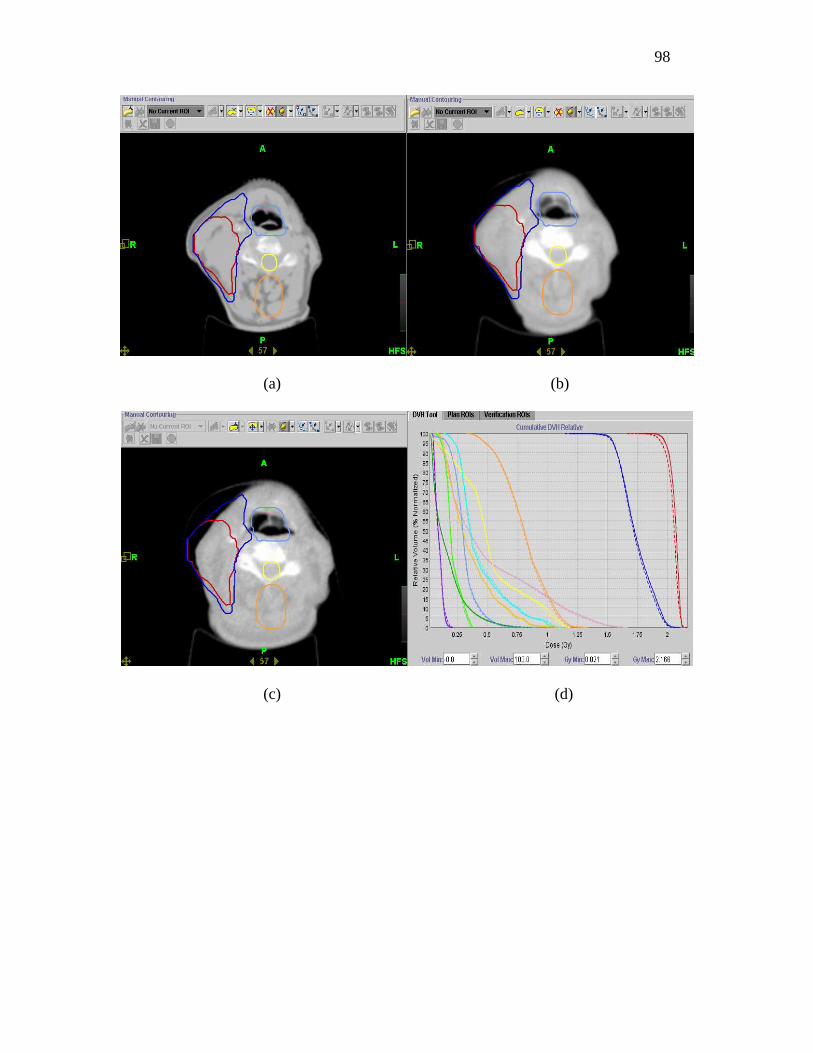
98
(a) (b)
(c) (d)

99
(e) (f)
Figure 6.3 Examples of tumor volume changes in a head and neck cancer patient.
Contours outlined from pre-treatment KVCT projected on the on-the-treatment MVCTs
taken at the 1st (a), 10th(b), and 20th (c)treatment using daily dose of 1.8 Gy/fx. The color
codes are: red: GTV, blue: PTV, light blue: larynx, yellow: spinal cord, and orange for
the avoidance structure for planning; Panel (d-f): DHV of all organs including GTV and
PTV for treatment day #1, #10, and #20 respectively. The DVHs were obtained using the
initial treatment planning and initial definitions of tumor and OARs.
Based on these observations, a retrospective treatment planning study can be
developed to evaluate the potential for adaptive radiation therapy. Adaptive radiation
therapy is the next step in image-guided radiation therapy, where treatment delivery is
modified to compensate for changes in patient anatomy. The specific goal of this
treatment planning study is to give more accurate dose coverage for tumor and to spare
normal tissue on a weekly or biweekly basis to compensate for reduction in GTV volume.
The conceptual flow diagram of adaptive TomoTherapy is illustrated in Figure 6.4.
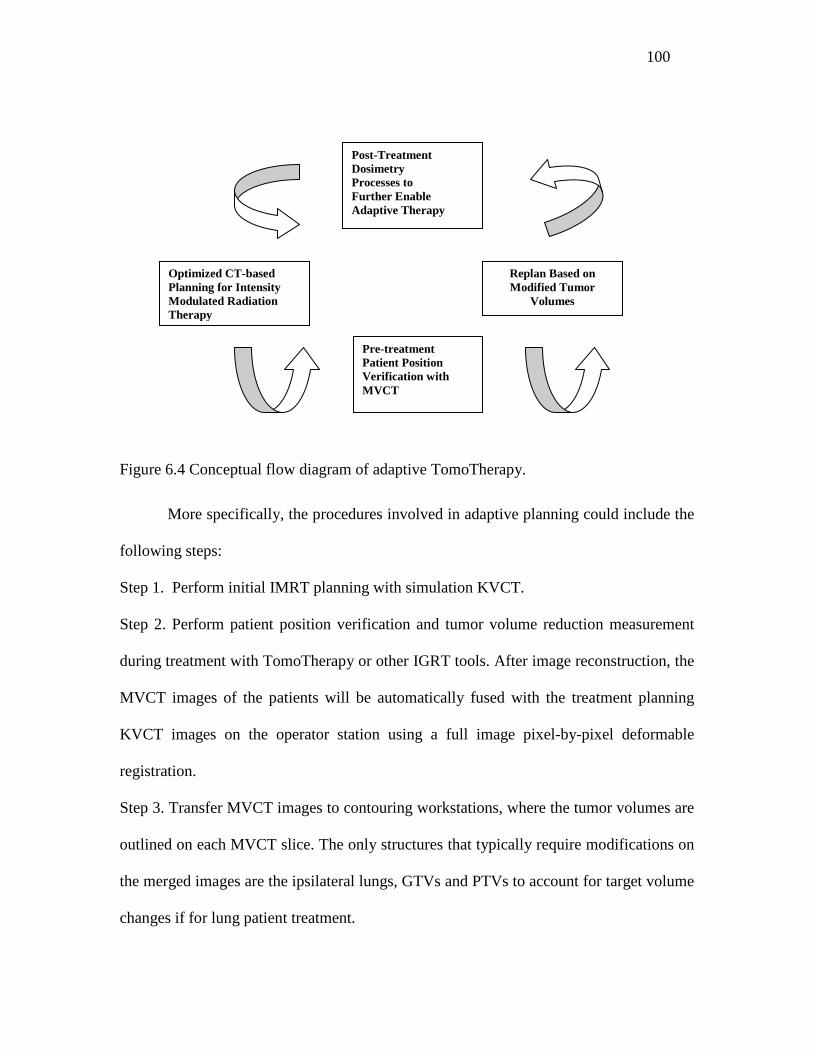
100
Figure 6.4 Conceptual flow diagram of adaptive TomoTherapy.
More specifically, the procedures involved in adaptive planning could include the
following steps:
Step 1. Perform initial IMRT planning with simulation KVCT.
Step 2. Perform patient position verification and tumor volume reduction measurement
during treatment with TomoTherapy or other IGRT tools. After image reconstruction, the
MVCT images of the patients will be automatically fused with the treatment planning
KVCT images on the operator station using a full image pixel-by-pixel deformable
registration.
Step 3. Transfer MVCT images to contouring workstations, where the tumor volumes are
outlined on each MVCT slice. The only structures that typically require modifications on
the merged images are the ipsilateral lungs, GTVs and PTVs to account for target volume
changes if for lung patient treatment.
Optimized CT-based Planning for Intensity Modulated Radiation Therapy
Pre-treatment Patient Position Verification with MVCT
Replan Based on Modified Tumor
Volumes
Post-Treatment Dosimetry Processes to Further Enable Adaptive Therapy
101
Step 4. Overlay the initial treatment planning on the modified volumes if there is no need
to change the plan. If there is a dramatic volume change, a new plan could be created
based on the new structures.
Step 5. Summarize the total Dose Volume Histogram (DVH) for each patient underwent
adaptive planning, and perform the post treatment dosimetry evaluation for further
adaptive therapy.
102
References
1. Brenner, DJ; Hlatky, LR; Hahnfeldt, PJ; Huang, Y; et al. The linear-quadratic
model and most other common radiobiological models result in similar
predictions of time-dose relationships. Radiat. Res. 150:83-91; 1998.
2. IMRT Collaborative Working Group. Intensity-modulated radiotherapy: Current
status and issues of interest. Int. J. Radiat. Oncol. Biol. Phys. 51:880 –914; 2001.
3. AAPM IMRT Sub-Committee. Guidance document on delivery, treatment
planning, and clinical implementation of IMRT: Report of the IMRT
Subcommittee of the AAPM Radiation Therapy Committee. Med. Phys. 30:2089
–2115; 2003.
4. Galvin, JM; Ezzell, G.; Eisbrauch, A.; et al. Implementing IMRT in clinical
practice: A joint document of the American Society for Therapeutic Radiology
and Oncology and the American Association of Physicists in Medicine. Int. J.
Radiat. Oncol.Biol. Phys. 58:1616–1634; 2004.
5. Zelefsky, MJ; Fuks, Z; Hunt, M. High-dose intensity modulated radiation therapy
for prostate cancer: Early toxicity and biochemical outcome in 772 patients. Int. J.
Radiat. Oncol. Biol. Phys. 53:111-116; 2002.
6. Hunt, MA; Zelefsky, MJ; Wolden, S. Treatment planning and delivery of
intensity-modulated radiation therapy for primary nasopharynx cancer. Int. J.
Radiat. Oncol. Biol. Phys. 49:623–632; 2001.
103
7. Bel, A; Van Herk, M.; Lebesque, JV; et al. Target margins for random
geometrical treatment uncertainties in conformal radiotherapy. Med. Phys.
23:1537–1545; 1996.
8. Van Herk, M. Quantification of organ motion during conformal radiotherapy of
the prostate by three dimensional image registration. Int. J. Radiat. Oncol. Biol.
Phys. 33:1311-1320; 1995.
9. Yan, D.; Wong; JW; Gustafson, G.; Martinez, A. . A new model for ‘accept or
reject’ strategies in off-line and on-line megavoltage treatment evaluation. Int. J.
Radiat. Oncol. Biol.Phys. . 31:943–952; 1995.
10. Alasti, H; Petric, MP; Catton, CN; Warde, PR. Portal imaging for evaluation of
daily on-line setup errors and off-line organ motion during conformal irradiation
of carcinoma of the prostate. Int. J. Radiat. Oncol. Biol. Phys. 49:869–884; 2001.
11. Byhardt, RW; Cox, JD; Hornburg, A. Weekly localization films and detection of
field placement errors. Int. J. Radiat. Oncol. Biol. Phys. 4:881–887; 1978.
12. Rabinowitz, I; Broomberg, J; Goitein, M. Accuracy of radiation field alignment in
clinical practice. Int. J. Radiat. Oncol. Biol. Phys. 11:1857–1867; 1985.
13. Rosenthal, SA; Galvin, JM; Goldwein, JW. Improved methods for determination
of variability in patient positioning for radiation therapy using simulation and
serial portal film measurements. Int. J. Radiat. Oncol. Biol. Phys. . 23:621–625;
1992.
14. Boyer, AL; Antonuk, L; Fenster, A. A review of electronic portal imaging devices
(EPIDs). Med. Phys. 19:1-16; 1992.
104
15. Michalski, JM; Graham, MV; Bosch, WR. Prospective clinical evaluation of an
electronic portal imaging device. Int. J. Radiat. Oncol. Biol. Phys. 34:943–951;
1996.
16. Baily, NA; Horn, RA; Kampp, TD. Fluoroscopic visualization of megavoltage
therapeutic x-0ray beams. Int. J. Radiat. Oncol. Biol. Phys. 6:935–939; 1980.
17. Meertens, H; Van Herk M.; Bijhold, J. First clinical experience with a newly
developed electronic portal imaging device. Int. J. Radiat. Oncol. Biol. Phys.
18:1173–1181; 1990.
18. Valicenti, RK; Michalski, JM; Bosch, WR. Is weekly port filming adequate for
verifying patient position in modern radiation therapy? . Int. J. Radiat. Oncol.
Biol. Phys. 30:431–438; 1994.
19. Herman, MG; Abrams, R; Mayer, RR. Clinical use of on-line portal imaging for
daily patient treatment verification. Int. J. Radiat. Oncol. Biol. Phys. 28:1017–
1023; 1994.
20. Balter, JM; Chen, GT; Pelizzari, CA. Online repositioning during treatment of the
prostate: A study of potential limits and gains. Int. J. Radiat. Oncol. Biol. Phys. .
27:137–143; 1993.
21. Bel, A; Van Herk, M; Bartelink, H. A verification procedure to improve patient
set-up accuracy using portal images. Radiother. Oncol. 29:253–260; 1993.
22. Bissett, R; Boyko, S; Leszczynski, K. Radiotherapy portal verification: An
observer study. Br. J. Radiol. 68:165–174; 1995.
23. Perera, T; Moseley, J; Munro, P. Subjectivity in interpretation of portal films. Int.
J. Radiat. Oncol. Biol. Phys. 45:529–534; 1999.
105
24. Chen, JC. Novalis stereotactic radiosurgery and radiotherapy. Foreword.
Neurosurgery. 62:A1; 2008.
25. Lee, SW; Jin, JY; Guan, H; Martin, F; et al. Clinical assessment and
characterization of a dual tube kilovoltage X-ray localization system in the
radiotherapy treatment room. J Appl Clin Med Phys. 9:2318; 2008.
26. Wurm, RE; Erbel, S; Schwenkert, I; Gum, F; et al. Novalis frameless image-
guided noninvasive radiosurgery: initial experience. Neurosurgery. 62:A11-17;
discussion A17-18; 2008.
27. Grills, IS; Hugo, G; Kestin, LL; Galerani, AP; et al. Image-guided radiotherapy
via daily online cone-beam CT substantially reduces margin requirements for
stereotactic lung radiotherapy. Int J Radiat Oncol Biol Phys. 70:1045-1056; 2008.
28. Thilmann, C; Nill, S; Tucking, T; Hoss, A; et al. Correction of patient positioning
errors based on in-line cone beam CTs: clinical implementation and first
experiences. Radiat Oncol. 1:16; 2006.
29. Yin, FF; Wang, Z; Yoo, S; Jackie, Q; et al. Integration of Cone-Beam CT in
Stereotactic Body Radiation Therapy. Technol Cancer Res Treat. 7:133-140;
2008.
30. Grills, IS; Hugo, G; Kestin, LL; Galerani, AP; et al. Image-Guided Radiotherapy
Via Daily Online Cone-Beam CT Substantially Reduces Margin Requirements for
Stereotactic Lung Radiotherapy. Int J Radiat Oncol Biol Phys. 70: 1045-562007.
31. Mackie, T; Olivera, G; Kapatoes, J. Helical Tomotherapy; Intensity-Modulated
Radiation Therapy – The State of the Art. Medical Physics Publishing. 247–284;
2003.
106
32. Welsh, JS; Patel, RR; Ritter, MA, Harari, P; Mackie, T R; Mehta, M P. Helical
Tomotherapy: An Innovative Technology and Approach to Radiation Therapy.
Technol. Canc. Res. Treat. . 1:55-63; 2002.
33. Jeraj, R; Mackie, TR; Balog, J; Olivera, G; et al. Radiation characteristics of
helical Tomotherapy. Med. Phys. 31:396–404; 2004.
34. Ford, EC; Mageras, GS; Yorke, E. Respiration-correlated spiral CT: A method of
measuring respiratory-induced anatomic motion for radiation treatment planning.
Med Phys. 30:88 –97; 2003.
35. Pan, T; Lee, T; Rietzel, ER. 4D-CT imaging of a volume influenced by
respiratory motion on multi-slice CT. Med Phys. 31:333–340; 2004.
36. Underberg, RW; Lagerwaard, FJ; Slotman, BJ; Cuijpers, JP; et al. Benefit of
respiration-gated stereotactic radiotherapy for stage I lung cancer: an analysis of
4DCT datasets. Int J Radiat Oncol Biol Phys. 62:554-560; 2005.
37. Vander Geld, YG; Senan, S; JR., Van Sornsen de Koste JR. Evaluating mobility
for radiotherapy planning of lung tumors: a comparison of virtual fluoroscopy and
4DCT. Lung Cancer. 53:31–37; 2006.
38. ICRU Report 50. International Commission on Radiation Units and
Measurements. Prescribing, recording and reporting photon beam therapy.1993.
39. ICRU Report 62. International Commission on Radiation Units and
measurements. Prescribing, Recording and Reporting Photon Beam Therapy, .
1999.
40. Mayo, JR; M¨uller, NL; Henkelman, RM. The double-fissure sign: a motion
artifact on thin-section CT scans Radiology. 165:580–581; 1987.
107
41. Ritchie, CJ; Hseih, J; Gard, MF; Godwin, JD; et al. Predictive respiratory gating:
a new method to reduce motion artifacts on CT scans Radiology. 190:847–852.
1994.
42. Giraud, P; De Rycke, Y; Rosenwald, JC; Cosset, JM. Conformal radiotherapy
planning for lung cancer: analysis of set-up uncertainties. Cancer Invest. 25:38-
46; 2007.
43. Smith, RP; Bloch, P; Harris, EE; McDonough, J; et al. Analysis of interfraction
and intrafraction variation during tangential breast irradiation with an electronic
portal imaging device. Int J Radiat Oncol Biol Phys. 62:373-378; 2005.
44. Little, DJ; Dong, L; Levy, LB; Chandra, A; et al. Use of portal images and BAT
ultrasonography to measure setup error and organ motion for prostate IMRT:
implications for treatment margins. Int J Radiat Oncol Biol Phys. 56:1218-1224;
2003.
45. Trichter, F; Ennis, RD. Prostate localization using transabdominal ultrasound
imaging. Int J Radiat Oncol Biol Phys. 56:1225-1233; 2003.
46. Ghilezan, M; Yan, D; Liang, J; Jaffray, D; et al. Online image-guided intensity-
modulated radiotherapy for prostate cancer: How much improvement can we
expect? A theoretical assessment of clinical benefits and potential dose escalation
by improving precision and accuracy of radiation delivery. Int J Radiat Oncol
Biol Phys. 60:1602-1610; 2004.
47. Letourneau, D; Martinez, AA; Lockman, D; Yan, D; et al. Assessment of residual
error for online cone-beam CT-guided treatment of prostate cancer patients. Int J
Radiat Oncol Biol Phys. 62:1239-1246; 2005.
108
48. Oita, M; Ohmori, K; Obinata, K; Kinoshita, R; et al. Uncertainty in treatment of
head-and-neck tumors by use of intraoral mouthpiece and embedded fiducials. Int
J Radiat Oncol Biol Phys. 64:1581-1588; 2006.
49. Xu, T; Wong, JT; Shikhaliev, PM; Ducote, JL; et al. Real-time tumor tracking
using implanted positron emission markers: concept and simulation study. Med
Phys. 33:2598-2609; 2006.
50. Bijhold, J; Lebesque, JV; Hart, AA; Vijlbrief, RE. Maximizing setup accuracy
using portal images as applied to a conformal boost technique for prostatic cancer.
Radiother Oncol. 24:261-271; 1992.
51. Stroom, JC; Koper, PC; Korevaar, GA; Van Os, M; et al. Internal organ motion in
prostate cancer patients treated in prone and supine treatment position. Radiother
Oncol. 51:237-248; 1999.
52. Van Herk, M. Errors and margins in radiotherapy. Semin Radiat Oncol. 14:52-64;
2004.
53. Keall, PJ; Mageras, GS; Balter, JM. The management of respiratory motion in
radiation oncology. report of AAPM Task Group 76. Med Phys. 33:3874 –3900;
2006.
54. Li, XA; Stepaniak, C; Gore, E. Technical and dosimetric aspects of respiratory
gating using a pressure-sensor motion monitoring system. Med Phys. 33:145–154;
2006.
55. Jin, JY; Ajlouni, M; Chen, Q; Yin, FF; et al. A technique of using gated-CT
images to determine internal target volume (ITV) for fractionated stereotactic
lung radiotherapy. Radiother Oncol. 78:177-184; 2006.
109
56. Wurm, RE; Gum, F; Erbel, S; Schlenger, L; et al. Image guided respiratory gated
hypofractionated Stereotactic Body Radiation Therapy (H-SBRT) for liver and
lung tumors: Initial experience. Acta Oncol. 45:881-889; 2006.
57. Mechalakos, J; Yorke, E; Mageras, GS; Hertanto, A; et al. Dosimetric effect of
respiratory motion in external beam radiotherapy of the lung. Radiother Oncol.
71:191-200; 2004.
58. Shirato, H; Seppenwoolde, Y; Kitamura, K; Onimura, R; et al. Intrafractional
tumor motion: lung and liver. Semin Radiat Oncol. 14:10-18; 2004.
59. Van de Steene, J; Van den Heuvel, F; Bel, A; Verellen, D; et al. Electronic portal
imaging with on-line correction of setup error in thoracic irradiation: clinical
evaluation. Int J Radiat Oncol Biol Phys. 40:967-976; 1998.
60. Drabik, DM; MacKenzie, MA; Fallone, GB. Quantifying appropriate PTV setup
margins: analysis of patient setup fidelity and intrafraction motion using post-
treatment megavoltage computed tomography scans. Int J Radiat Oncol Biol
Phys. 68:1222-1228; 2007.
61. Beltran, C; Herman, MG; Davis, BJ. Planning target margin calculations for
prostate radiotherapy based on intrafraction and interfraction motion using four
localization methods. Int J Radiat Oncol Biol Phys. 70:289-295; 2008.
62. Hugo, GD; Yan, D; Liang, J. Population and patient-specific target margins for
4D adaptive radiotherapy to account for intra- and inter-fraction variation in lung
tumour position. Phys Med Biol. 52:257-274; 2007.
63. Perkins, CL; Fox, T; Elder, E; Kooby, DA; et al. Image-guided radiation therapy
(IGRT) in gastrointestinal tumors. Jop. 7:372-381; 2006.
110
64. Shimizu, S; Shirato, H; Ogura, S; Akita-Dosaka, H; et al. Detection of lung tumor
movement in real-time tumor-tracking radiotherapy. Int J Radiat Oncol Biol Phys.
51:304-310; 2001.
65. Hodge, W; Tome, WA; Jaradat, HA; Orton, NP; et al. Feasibility report of image
guided stereotactic body radiotherapy (IG-SBRT) with tomotherapy for early
stage medically inoperable lung cancer using extreme hypofractionation. Acta
Oncol. 45:890-896; 2006.
66. Lee, SW; Choi, EK; Park, HJ; Ahn, SD; et al. Stereotactic body frame based
fractionated radiosurgery on consecutive days for primary or metastatic tumors in
the lung. Lung Cancer. 40:309-315; 2003.
67. Ng, AW; Tung, SY; Wong, VY. Hypofractionated stereotactic radiotherapy for
medically inoperable stage I non-small cell lung cancer - report on clinical
outcome and dose to critical organs. Radiother Oncol. 87:24-28; 2008.
68. Timmerman, R; Papiez, L; McGarry, R; Likes, L; et al. Extracranial stereotactic
radioablation: results of a phase I study in medically inoperable stage I non-small
cell lung cancer. Chest. 124:1946-1955; 2003.
69. Fuss, M; Salter, BJ; Rassiah, P; Cheek, D; et al. Repositioning accuracy of a
commercially available double-vacuum whole body immobilization system for
stereotactic body radiation therapy. Technol Cancer Res Treat. 3:59-67; 2004.
70. Negoro, Y; Nagata, Y; Aoki, T; Mizowaki, T; et al. The effectiveness of an
immobilization device in conformal radiotherapy for lung tumor: reduction of
respiratory tumor movement and evaluation of the daily setup accuracy. Int J
Radiat Oncol Biol Phys. 50:889-898; 2001.
111
71. Kimura, T; Hirokawa, Y; Murakami, Y; Tsujimura, M; et al. Reproducibility of
organ position using voluntary breath-hold method with spirometer for
extracranial stereotactic radiotherapy. Int J Radiat Oncol Biol Phys. 60:1307-
1313; 2004.
72. Stock, M; Kontrisova, K; Dieckmann, K; Bogner, J; et al. Development and
application of a real-time monitoring and feedback system for deep inspiration
breath hold based on external marker tracking. Med Phys. 33:2868-2877; 2006.
73. Wang, L; Feigenberg, S; Chen, L; Pasklev, K; et al. Benefit of three-dimensional
image-guided stereotactic localization in the hypofractionated treatment of lung
cancer. Int J Radiat Oncol Biol Phys. 66:738-747; 2006.
74. Slotman, BJ; Lagerwaard, FJ; Senan, S. 4D imaging for target definition in
stereotactic radiotherapy for lung cancer. Acta Oncol. 45:966-972; 2006.
75. Guckenberger, M; Meyer, J; Wilbert, J; Baier, K; et al. Cone-beam CT based
image-guidance for extracranial stereotactic radiotherapy of intrapulmonary
tumors. Acta Oncol. 45:897-906; 2006.
76. Purdie, TG; Moseley, DJ; Bissonnette, JP; Sharpe, MB; et al. Respiration
correlated cone-beam computed tomography and 4DCT for evaluating target
motion in Stereotactic Lung Radiation Therapy. Acta Oncol. 45:915-922; 2006.
77. Hinson, WH; Kearns, WT; Ellis, TL; Sprinkle, D; et al. Reducing set-up
uncertainty in the Elekta Stereotactic Body Frame using Stealthstation software.
Technol Cancer Res Treat. 6:181-186; 2007.
78. AAPM Report 54. Stereotactic radiosurgery. New York: Radiation therapy
committee; 1995.
112
79. Lagerwaard, FJ; Van Sornsen de Koste, JR; Nijssen-Visser, MR; Schuchhard-
Schipper, RH; et al. Multiple "slow" CT scans for incorporating lung tumor
mobility in radiotherapy planning. Int J Radiat Oncol Biol Phys. 51:932-937;
2001.
80. Smeenk, C; Gaede, S; Battista, JJ. Delineation of moving targets with slow
MVCT scans: implications for adaptive non-gated lung tomotherapy. Phys Med
Biol. 52:1119-1134; 2007.
81. Purdie, TG; Bissonnette, JP; Franks, K; Bezjak, A; et al. Cone-beam computed
tomography for on-line image guidance of lung stereotactic radiotherapy:
localization, verification, and intrafraction tumor position. Int J Radiat Oncol Biol
Phys. 68:243-252; 2007.
82. Le, QT; Loo, BW; Ho, A; Cotrutz, C; et al. Results of a phase I dose-escalation
study using single-fraction stereotactic radiotherapy for lung tumors. J Thorac
Oncol. 1:802-809; 2006.
83. Nelson, C; Starkschall, G; Chang, JY. The potential for dose escalation in lung
cancer as a result of systematically reducing margins used to generate planning
target volume. Int J Radiat Oncol Biol Phys. 65:573-586; 2006.
84. Kong, FM; Ten Haken, RK; Schipper, MJ; Sullivan, MA; et al. High-dose
radiation improved local tumor control and overall survival in patients with
inoperable/unresectable non-small-cell lung cancer: long-term results of a
radiation dose escalation study. Int J Radiat Oncol Biol Phys. 63:324-333; 2005.
113
85. Bradley, J. A review of radiation dose escalation trials for non-small cell lung
cancer within the Radiation Therapy Oncology Group. Semin Oncol. 32:S111-
113; 2005.
86. Schild, SE; Korte, SM; Wong, WW; Vora, SA; et al. Treatment planning for dose
escalation in non-small cell lung cancer (NSCLC). Med Dosim. 29:196-203;
2004.
87. Wu, KL; Jiang, GL; Liao, Y; Qian, H; et al. Three-dimensional conformal
radiation therapy for non-small-cell lung cancer: a phase I/II dose escalation
clinical trial. Int J Radiat Oncol Biol Phys. 57:1336-1344; 2003.
88. Allen, AM; Siracuse, KM; Hayman, JA; Balter, JM. Evaluation of the influence
of breathing on the movement and modeling of lung tumors. Int J Radiat Oncol
Biol Phys. 58:1251–1257; 2004.
89. Ekberg L; HO, Wittgren L; Bjelkengren G;Landberg T. What margins should be
added to the clinical target volume in radiotherapy treatment planning for lung
cancer? Radiother Oncol. . 48:71–77; 1998.
90. Aruga, T; Itami, J; Aruga, M. Target volume definition for upper abdominal
irradiation using CT scans obtained during inhale and exhale phases. Int J Radiat
Oncol Biol Phys. 48:465–469; 2000.
91. Gagne, I; Robinson, D. The impact of tumor motion upon CT image integrity and
target delineation. Med Phys. . 12:3378–3392; 2004.
92. Chen, G; Kung, J; Beaudette, K. Artifacts in computed tomography scanning of
moving objects. Geriatr. Nephrol. Urol. 14:19–26; 2004.
114
93. Balter, J; Ten Haken, R; Lawrence, T; LamL, K; et al. Uncertainties in CT-based
radiation therapy planning associated with patient breathing. Int. J. Radiat.
Oncol., Biol., Phys. 36:167–174; 1996.
94. Shimizu, S; Shirato, H; Kagei, K; Nishioka, T; et al. Impact of respiratory
movement on the computed tomographic images of small lung tumors in three-
dimensional radiotherapy. Int. J. Radiat. Oncol., Biol., Phys. 46:1127-1133; 2000.
95. Balter, J; Lam, K; McGinn, C; Lawrence, T; et al. Improvement of CT-based
treatment planning model of abdominal targets using static exhale imaging. Int. J.
Radiat. Oncol., Biol., Phys. 41:939–943; 1998.
96. Remouchamps, VM; Letts, N; Yan, D; Vicini, FA; et al. Three-dimensional
evaluation of intra- and interfraction immobilization of lung and chest wall using
active breathing control: a reproducibility study with breast cancer patients. Int J
Radiat Oncol Biol Phys. 57:968-978; 2003.
97. Wilson, EM; Williams, FJ; Lyn, BE; Wong, JW; et al. Validation of active
breathing control in patients with non-small-cell lung cancer to be treated with
CHARTWEL. Int J Radiat Oncol Biol Phys. 57:864-874; 2003.
98. Mageras, G; Pevsner, A; York, E. Measurement of lung tumor motion using
respiration-correlated CT. Int J Radiat Oncol Biol Phys. 60:933–941; 2004.
99. Underberg, RW; Lagerwaard, FJ; Cuijpers, JP; Slotman, BJ; et al. Four-
dimensional CT scans for treatment planning in stereotactic radiotherapy for stage
I lung cancer. Int J Radiat Oncol Biol Phys. 60:1283-1290; 2004.
115
100. Schreibmann, E; Chen, GT; Xing, L. Image interpolation in 4D CT using a
BSpline deformable registration model. Int J Radiat Oncol Biol Phys. . 1:1537-
1550; 2006.
101. Coselmon, MMB, J.M.; McShan, D.L.; et al. . Mutual information based CT
registration of the lung at exhale and inhale breathing states using thin-plate
splines. Med. Phys. 31:2942–2948; 2004.
102. Luo, G; Heng, PA. LV shape and motion: B-spline-based deformable model and
sequential motion decomposition. IEEE Trans Inf Technol Biomed. 9:430-446;
2005.
103. Klein, AK; Lee, F; Amini, AA. Quantitative coronary angiography with
deformable spline models. IEEE Trans Med Imaging. 16:468-482; 1997.
104. Lu, W; Chen, ML; Olivera, GH; Ruchala K, J; et al. Fast free-form deformable
registration via calculus of variations. Phys. Med. Biol. . 49:3067–3087; 2004.
105. Hawkes, DJ; Barratt, D; Blackall, JM; Chan, C; et al. Tissue deformation and
shape models in image-guided interventions: a discussion paper. Med. Image
Anal. 9:163–175; 2005.
106. Ragan, D; Starkschall, G; McNutt, T; Kaus, M; et al. Semiautomated four-
dimensional computed tomography segmentation using deformable models. Med.
Phys. . 32:2254–2261; 2005.
107. Wang, H; Dong, L; O’Daniel, J; Mohan, R; et al. Validation of an accelerated
‘demons’ algorithm for deformable image registration in radiation therapy. Phys.
Med. Biol. . 50:2887–2905; 2005.
116
108. Bharath, A; Hirose, M; Hata, N. Evaluation of threedimensional finite element-
based deformable registration of preand intraoperative prostate imaging. Med.
Phys. 28:2551–2560; 2001.
109. Brock, KK; McShan, DL; Balter, JM. A comparison of computer- controlled
versus manual on-line patient setup adjustment. J. Appl. Clin. Med. Phys. 3:241–
247; 2002.
110. Schreibmann, E; Xing, L. Narrow band deformable registration of prostate
MRI/MRSI and CT studies. Int. J. Radiat. Oncol. Biol. Phys. 62:595–605; 2005.
111. Bookstein, FL. Thin plate splines and the decomposition of deformations. IEEE
Trans. Pattern Anal. Mach. Intell. . 11:567– 585; 1989.
112. Guerrero, T; Zhang, G; Huang, TC. Intrathoracic tumor motion estimation from
CT imaging using the 3D optical flow method. . Phys. Med. Biol. 49:4147–4161;
2004.
113. Mageras, GS; Pevsner, A; Yorke, ED. Measurement of lung tumor motion using
respiration-correlated CT. Int. J. Radiat. Oncol. Biol. Phys. . 60:933–941; 2004.
114. Fei, B; Wheaton, A; Lee, Z; Duerk, JL; et al. Automatic MR volume registration
and its evaluation for the pelvis and prostate. Phys Med Biol. 47:823-838; 2002.
115. Lian, JX, L.; Hunjan, S.; et al. Mapping of the prostate in endorectal coil-based
MRI/MRSI and CT: A deformable registration and validation study. Med. Phys. .
31:3087–3094; 2004.
116. Rietzel, E; Chen, GT; Choi, NC; Willet, CG. Four-dimensional image-based
treatment planning: Target volume segmentation and dose calculation in the

117
presence of respiratory motion. Int J Radiat Oncol Biol Phys. 61:1535-1550;
2005.
117. Zhang, T; Orton, NP; Tome, WA. On the automated definition of mobile target
volumes from 4D-CT images for stereotactic body radiotherapy. Med Phys.
32:3493-3502; 2005.
118. Rietzel, E; Chen, GT; Choi, NC. Four-dimensional image based treatment
planning: Target volume segmentation and dose calculation in the presence of
respiratory motion. Int J Radiat Oncol Biol Phys. 61:1535–1550; 2005.
119. Lyman, JT. Complication probability as assessed from dose volume histograms.
Radiat Res. 8:S13–S19; 1985.
120. Kallman, P; Agren, A; Brahme, A. Tumour and normal tissue responses to
fractionated non-uniform dose delivery. Int J Radiat Biol. 62:249-262; 1992.
121. Zaider, M; Amols, HI. Practical considerations in using calculated healthy - tissue
complication probabilities for treatment - plan optimization. . Int J Radiat Oncol
Biol Phys. 44:439– 447; 1999.
122. Kehwar, TS; Sharma, SC. The best fit of the normal tissue tolerance data to the
multiple component model. Polish J Med Phys Eng. 9:239– 269; 2003.
123. Kehwar, TS. Analytical approach to estimate normal tissue complication
probability using best fit of normal tissue tolerance doses into the NTCP equation
of the linear quadratic model. J Cancer Res Ther. 1:168–179; 2005.
124. Emami, B; Lyman, J; Brown, A. Tolerance of normal tissue to therapeutic
radiation. Int J Radiat Oncol Biol Phys. 21:109– 122; 1991.
118
125. Burman, CM; Kutcher, GJ; Emami, B; Goitein, M. Fitting of normal tissue
tolerance data to an analytic function. Int J Radiat Oncol Biol Phys. 21:123-135;
1991.
126. Webb, T; Nahum, AE. A model for calculating tumour control probability in
radiotherapy including the effects of inhomogeneous distributions of dose and
clonogenic cell density. Phys. Med. Biol. . 38:653– 666; 1993.
127. Starkschall, GH, S.; Keall, P.J.; et al. . XIVth International Conference on the Use
of Computers in Radiation Therapy, 2004, pp 53. Displacement based binning of
4-D CT image data sets. XIVth International Conference on the Use of Computers
in Radiation Therapy; 2004.
128. Seppenwoolde, YS, H.; Kitamura, K. Precise and real-time measurement of 3D
tumor motion in lung due to breathing and heartbeat, measured during
radiotherapy. Int. J. Radiat. Oncol. Biol. Phys. . 53:822-834; 2002.
129. Lax, I; Blomgren, H; Naslund, I; Svanstrom, R. Stereotactic radiotherapy of
malignancies in the abdomen. Methodological aspects. Acta Oncol 33:677–683;
1994.
130. Kubo, HD; Hill, BC. Respiration gated radiotherapy treatment: a technical study.
Phys Med Biol. 41:83-91; 1996.
131. Rosenzweig, K; Hanley, J; Mah, D. The deep inspiration breath-hold technique in
the treatment of inoperable non-small-cell lung cancer. Int J Radiat Oncol Biol
Phys 48:81–87; 2000.
119
132. Wong, JW; Sharpe, MB; Jaffray, DA; Kini, VR; et al. The use of active breathing
control (ABC) to reduce margin for breathing motion. Int J Radiat Oncol Biol
Phys. 44:911-919; 1999.
133. Ramsey, CR; Langen, KM; Kupelian, PA. A technique for adaptive image-guided
helical tomotherapy for lung cancer. Int J Radiat Oncol Biol Phys. 64:1237–1244;
2006.
134. Underberg, WM; Lagerwaard, FJ; Tinteren, HV. Time trends in target volumes
for stage I non-small-cell lung cancer after stereotactic radiotherapy. Int J Radiat
Oncol Biol Phys. 64:1221–1228; 2006.
135. Kupelian, PA; Ramsey, CR; Meeks, SL. Serial megavoltage CT imaging during
external beam radiotherapy for non–small-cell lung cancer: Observations on
tumor regression during treatment. Int J Radiat Oncol Biol Phys 63:1024–1028;
2005.
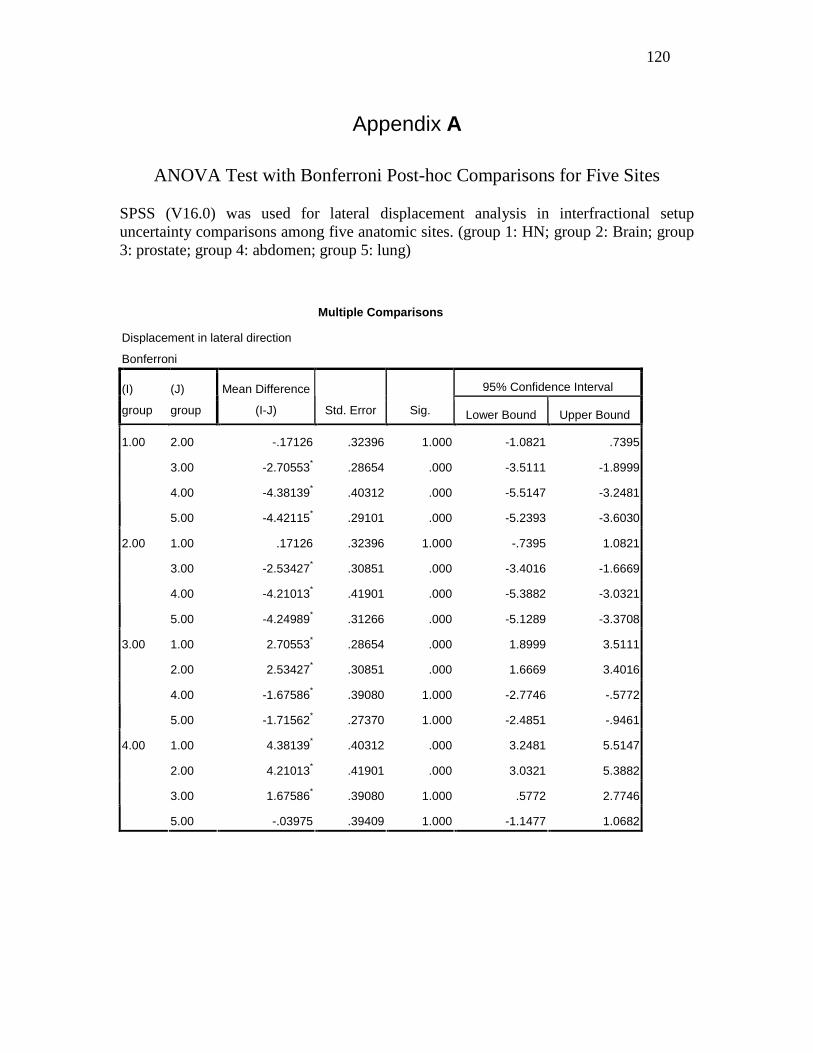
120
Appendix A
ANOVA Test with Bonferroni Post-hoc Comparisons for Five Sites SPSS (V16.0) was used for lateral displacement analysis in interfractional setup uncertainty comparisons among five anatomic sites. (group 1: HN; group 2: Brain; group 3: prostate; group 4: abdomen; group 5: lung)
Multiple Comparisons
Displacement in lateral direction
Bonferroni
95% Confidence Interval (I)
group
(J)
group
Mean Difference
(I-J) Std. Error Sig. Lower Bound Upper Bound
2.00 -.17126 .32396 1.000 -1.0821 .7395
3.00 -2.70553* .28654 .000 -3.5111 -1.8999
4.00 -4.38139* .40312 .000 -5.5147 -3.2481
1.00
5.00 -4.42115* .29101 .000 -5.2393 -3.6030
1.00 .17126 .32396 1.000 -.7395 1.0821
3.00 -2.53427* .30851 .000 -3.4016 -1.6669
4.00 -4.21013* .41901 .000 -5.3882 -3.0321
2.00
5.00 -4.24989* .31266 .000 -5.1289 -3.3708
1.00 2.70553* .28654 .000 1.8999 3.5111
2.00 2.53427* .30851 .000 1.6669 3.4016
4.00 -1.67586* .39080 1.000 -2.7746 -.5772
3.00
5.00 -1.71562* .27370 1.000 -2.4851 -.9461
1.00 4.38139* .40312 .000 3.2481 5.5147
2.00 4.21013* .41901 .000 3.0321 5.3882
3.00 1.67586* .39080 1.000 .5772 2.7746
4.00
5.00 -.03975 .39409 1.000 -1.1477 1.0682
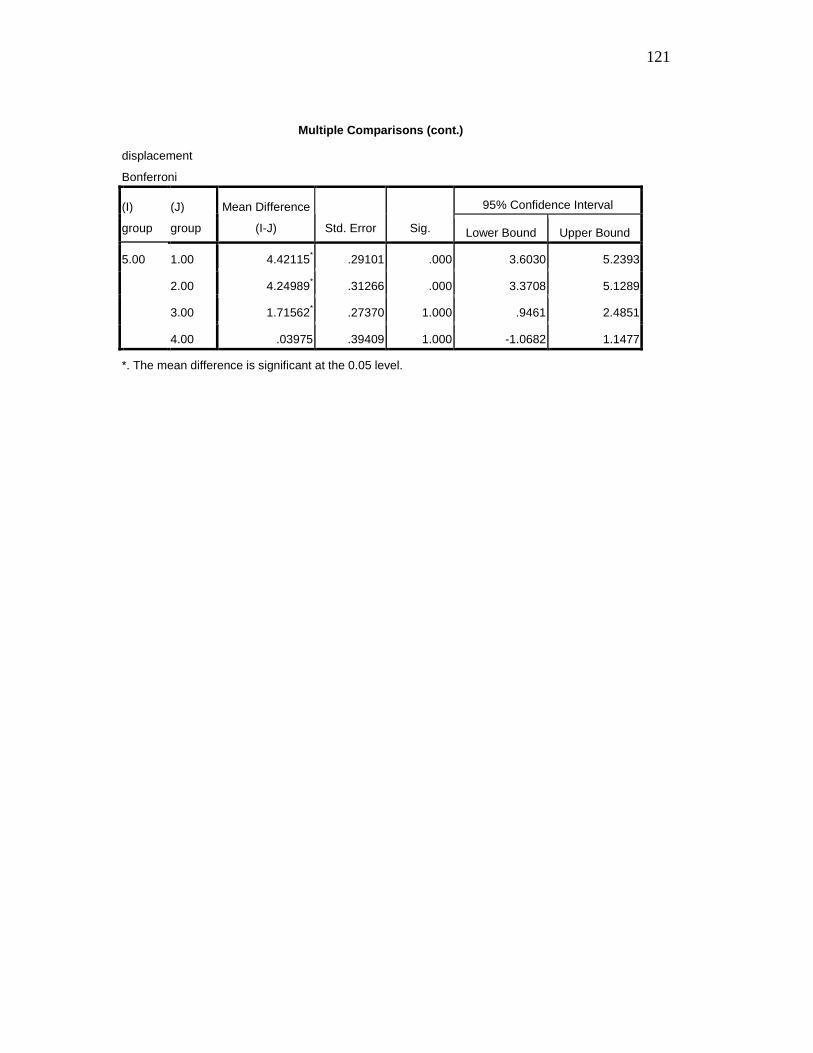
121
Multiple Comparisons (cont.)
displacement
Bonferroni
95% Confidence Interval (I)
group
(J)
group
Mean Difference
(I-J) Std. Error Sig. Lower Bound Upper Bound
1.00 4.42115* .29101 .000 3.6030 5.2393
2.00 4.24989* .31266 .000 3.3708 5.1289
3.00 1.71562* .27370 1.000 .9461 2.4851
5.00
4.00 .03975 .39409 1.000 -1.0682 1.1477
*. The mean difference is significant at the 0.05 level.
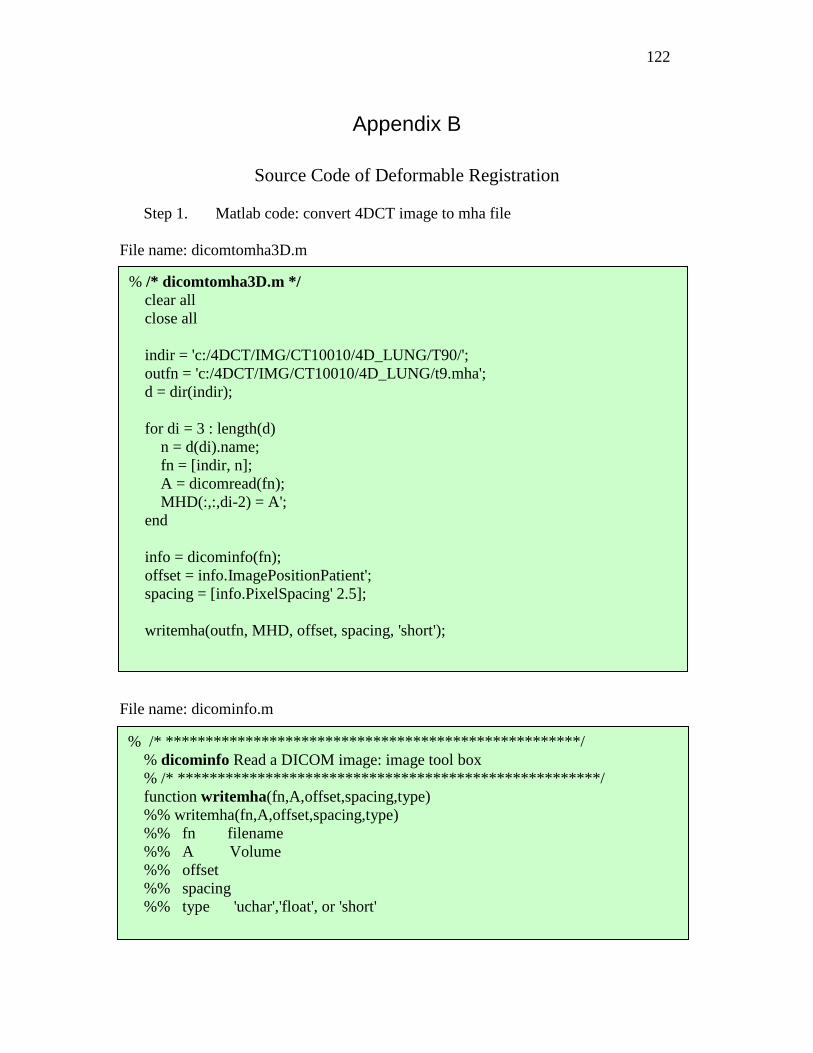
122
Appendix B
Source Code of Deformable Registration
Step 1. Matlab code: convert 4DCT image to mha file File name: dicomtomha3D.m File name: dicominfo.m
% /* dicomtomha3D.m */ clear all close all indir = 'c:/4DCT/IMG/CT10010/4D_LUNG/T90/'; outfn = 'c:/4DCT/IMG/CT10010/4D_LUNG/t9.mha'; d = dir(indir); for di = 3 : length(d) n = d(di).name; fn = [indir, n]; A = dicomread(fn); MHD(:,:,di-2) = A'; end info = dicominfo(fn); offset = info.ImagePositionPatient'; spacing = [info.PixelSpacing' 2.5];
writemha(outfn, MHD, offset, spacing, 'short');
% /* ********************************************* *******/ % dicominfo Read a DICOM image: image tool box % /* ********************************************** *******/ function writemha(fn,A,offset,spacing,type) %% writemha(fn,A,offset,spacing,type) %% fn filename %% A Volume %% offset %% spacing %% type 'uchar','float', or 'short'
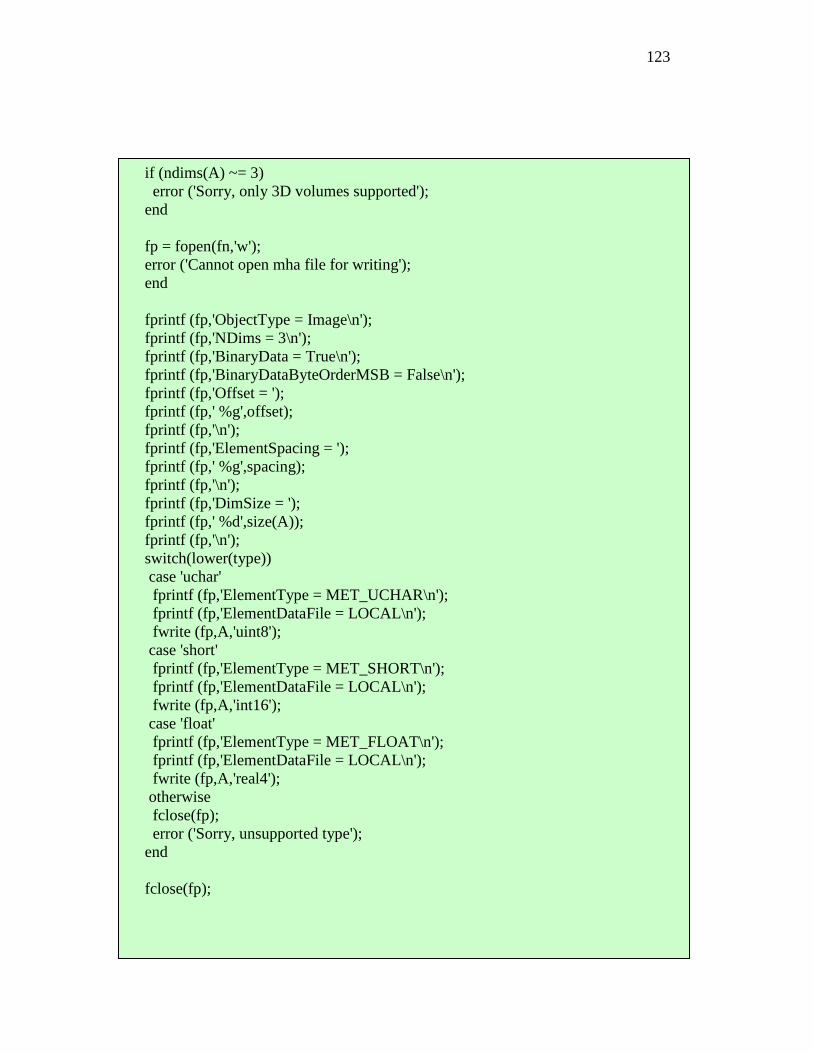
123
if (ndims(A) ~= 3) error ('Sorry, only 3D volumes supported'); end fp = fopen(fn,'w'); error ('Cannot open mha file for writing'); end fprintf (fp,'ObjectType = Image\n'); fprintf (fp,'NDims = 3\n'); fprintf (fp,'BinaryData = True\n'); fprintf (fp,'BinaryDataByteOrderMSB = False\n'); fprintf (fp,'Offset = '); fprintf (fp,' %g',offset); fprintf (fp,'\n'); fprintf (fp,'ElementSpacing = '); fprintf (fp,' %g',spacing); fprintf (fp,'\n'); fprintf (fp,'DimSize = '); fprintf (fp,' %d',size(A)); fprintf (fp,'\n'); switch(lower(type)) case 'uchar' fprintf (fp,'ElementType = MET_UCHAR\n'); fprintf (fp,'ElementDataFile = LOCAL\n'); fwrite (fp,A,'uint8'); case 'short' fprintf (fp,'ElementType = MET_SHORT\n'); fprintf (fp,'ElementDataFile = LOCAL\n'); fwrite (fp,A,'int16'); case 'float' fprintf (fp,'ElementType = MET_FLOAT\n'); fprintf (fp,'ElementDataFile = LOCAL\n'); fwrite (fp,A,'real4'); otherwise fclose(fp); error ('Sorry, unsupported type'); end fclose(fp);
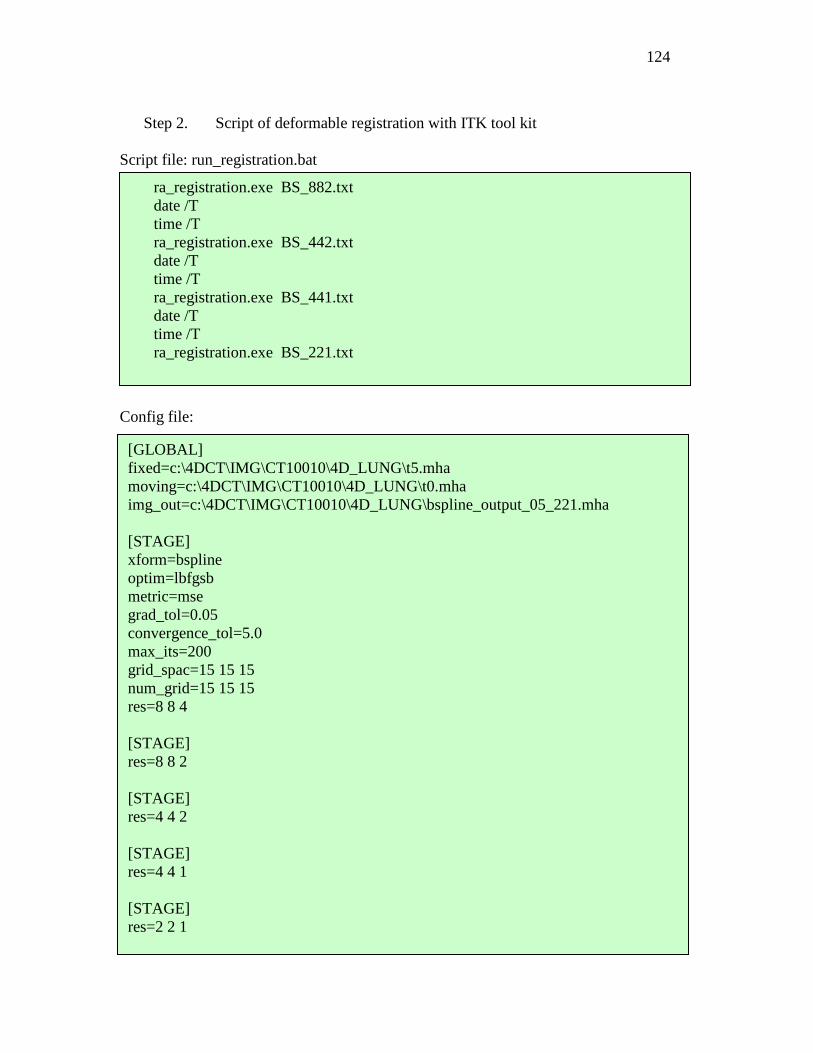
124
Step 2. Script of deformable registration with ITK tool kit
Script file: run_registration.bat Config file:
ra_registration.exe BS_882.txt date /T time /T ra_registration.exe BS_442.txt date /T time /T ra_registration.exe BS_441.txt date /T time /T ra_registration.exe BS_221.txt
[GLOBAL] fixed=c:\4DCT\IMG\CT10010\4D_LUNG\t5.mha moving=c:\4DCT\IMG\CT10010\4D_LUNG\t0.mha img_out=c:\4DCT\IMG\CT10010\4D_LUNG\bspline_output_05_221.mha [STAGE] xform=bspline optim=lbfgsb metric=mse grad_tol=0.05 convergence_tol=5.0 max_its=200 grid_spac=15 15 15 num_grid=15 15 15 res=8 8 4 [STAGE] res=8 8 2 [STAGE] res=4 4 2 [STAGE] res=4 4 1 [STAGE] res=2 2 1
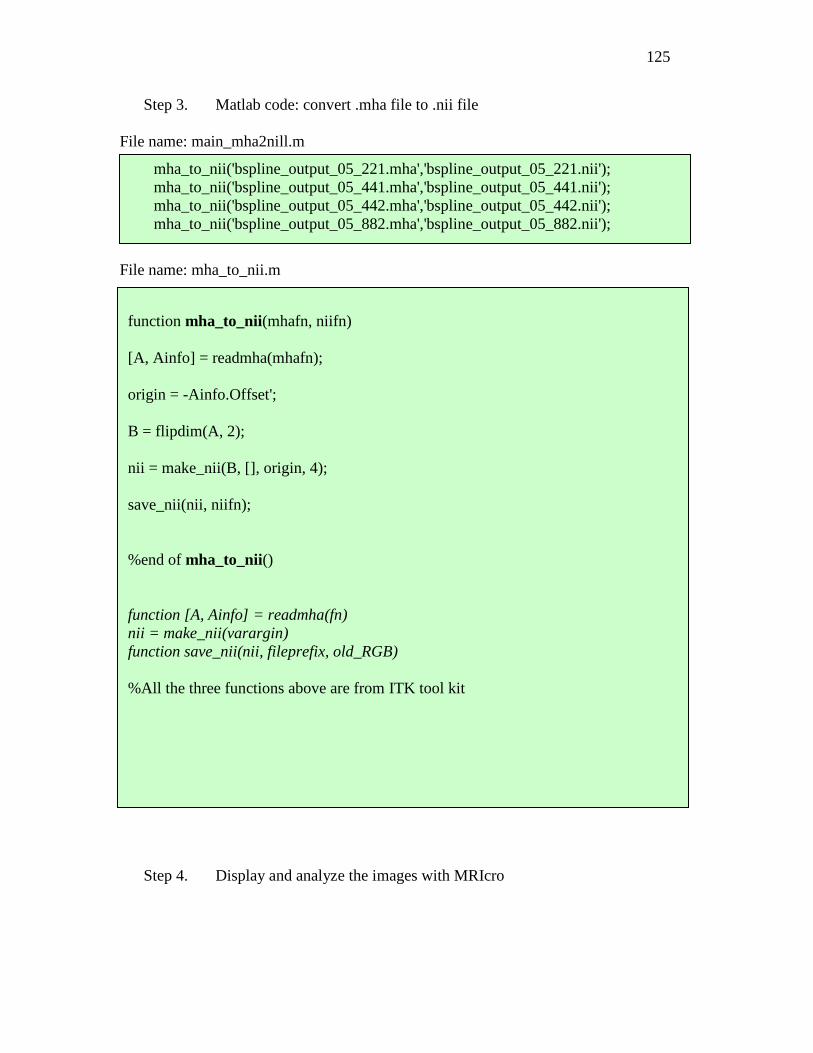
125
Step 3. Matlab code: convert .mha file to .nii file File name: main_mha2nill.m File name: mha_to_nii.m
Step 4. Display and analyze the images with MRIcro
mha_to_nii('bspline_output_05_221.mha','bspline_output_05_221.nii'); mha_to_nii('bspline_output_05_441.mha','bspline_output_05_441.nii'); mha_to_nii('bspline_output_05_442.mha','bspline_output_05_442.nii'); mha_to_nii('bspline_output_05_882.mha','bspline_output_05_882.nii');
function mha_to_nii(mhafn, niifn) [A, Ainfo] = readmha(mhafn); origin = -Ainfo.Offset'; B = flipdim(A, 2); nii = make_nii(B, [], origin, 4); save_nii(nii, niifn); %end of mha_to_nii() function [A, Ainfo] = readmha(fn) nii = make_nii(varargin) function save_nii(nii, fileprefix, old_RGB) %All the three functions above are from ITK tool kit
126
Vita
Jining Zhou was born on September, 1970 in Nantong, Jiangsu, China. She earned
her Bachelor of Engineering degree with a major in Chemistry at Central South
University of Technology, China, in 1992. She received her Master’s degree in Chemical
Engineering at Guangxi University in 1995, and worked as a research associate in the
Biochemistry Department in East China University of Science and Technology,
Shanghai, China, from 1995 to 1998. In 1999 she was admitted to Virginia
Commonwealth University, and received her Master’s degree in Biomedical Engineering
in 2001. She has been working as a clinical medical physicist in the Department of
Radiation Oncology, at Mount Sinai Medical Center, New York, from 2002 to 2006, and
at Sharp Grossmont Hospital, San Diego, since 2007.