Embed Size (px)
Citation preview

Oregon’s Property Tax
Legislative Revenue OfficeJanuary 2009
2
Overview of Oregon’s Property Tax
• History and Significance• Measure 5 and Measure 50• Statistics and Trends
– By type of tax– By type of district
• Property Assessment – Properties subject to taxation– Exemptions and special assessments– Compression due to Measure 5 limits
• Urban Renewal – Division of Tax and Special Levy
3
Property Taxes and Oregon
• Oregon’s property tax system is one of the most important sources of revenue for the public sector in Oregon
• This source raised $4.470 billion for local governments in fiscal year 2007-08
• Only state personal income tax collections exceed property tax collections as a source of state and local tax revenue
4
Useful Definitions
• Real Market Value (RMV) - the amount in cash which could reasonably be expected by an informed seller acting without compulsion, from an informed buyer acting without compulsion, in an “arms-length” transaction during the period for which the property is taxed
• Assessed Value (AV) – Value of property subject to taxation

5
Measure 5 (M5)
• The structure of the property tax changed very little until the 1990s, when two statewide ballot measures dramatically altered the system
• Measure 5, which introduced property tax rate limits, was passed in 1990 and became effective starting in the 1991-92 tax year
• When fully implemented in 1995-96, Measure 5 cut property tax rates an average of 51 percent from their 1990-91 levels

6
Measure 50 (M50)
• Measure 50, passed in 1997, Cut property taxes, Introduced assessed value (AV) growth limits, and Replaced most tax levies with permanent tax rates*
• It transformed the system from one primarily based on levies to one primarily based on rates
• When implemented in 1997-98, Measure 50 cut effective tax rates an average of 11 percent from their 1996-97 levels
*permanent rate = maximum rate without voter approval

7
A Quick Cheat Sheet on Limits• Measure 5 (M5 limits)
$5 per $1,000 real market value (RMV) for schools$10 per $1,000 RMV for general government taxes Applied only to operating taxes, not bondsFor each property, school taxes and general government taxes compared to their limits respectively
• Measure 50 (M50 limit)Assessed value (AV) for 1997-98 was set (at 90% of 1995-96 AV for each property) and permanent rates were established for taxing districtsAnnual growth of AV limited to 3% for existing propertyFor new property, AV = (RMV) times (AV/RMV of similar property)

8
Summary of Oregon Property Values and Taxes Imposed
2006-07 2007-08Percent Change
434,293.4 501,124.9 15.4%265,218.9 280,453.8 5.7%257,373.8 271,199.8 5.4%
3,314.9 3,582.9 8.1%597.7 696.1 16.5%
3,912.6 4,279.0 9.4%
164.8 191.4 16.1%
4,077.4 4,470.4 9.6%
Exhibit 1Summary of Oregon Property Values and Taxes Imposed
($ million)
Real Market ValueTotal Assessed ValueNet Assessed Value
Urban Renewal Taxes
Total all Taxes
Operating TaxesBond TaxesTotal District Taxes
9
AV and Taxes Imposed• Total AV has been increasing substantially more
than 3% annually when limited to 3% growth3% growth limit applies to Individual property’s AV New construction, property improvement, etc. add AV
• Operating taxesTaxes from permanent rates fund general operating budgets
• M5 limits – depending on type of taxesSubject to limit – permanent rate, local option, gap bond, pension levy, urban renewal plan taxesNot subject to limit – bond levies for capital construction

10
District• A local government entity that imposes property
taxes• A district can include multiple taxing districts -
e.g., City of Salem includes taxing districts representing the portions of the city located in Marion and Polk counties
• School (K-12), Education Service District (ESD), city, county, community college, special district
• Special district includes service, port, fire, park, water control, library, transit, public utility, etc.

11
Property Taxes by Type of District
Exhibit 2a 2007-08 Property Taxes Imposed by Type of District
($ Million)
K-12 & ESDs1,817.3
42%
Special Districts493.712%Community
Colleges165.64%
Counties832.719%
Cities969.523%
12
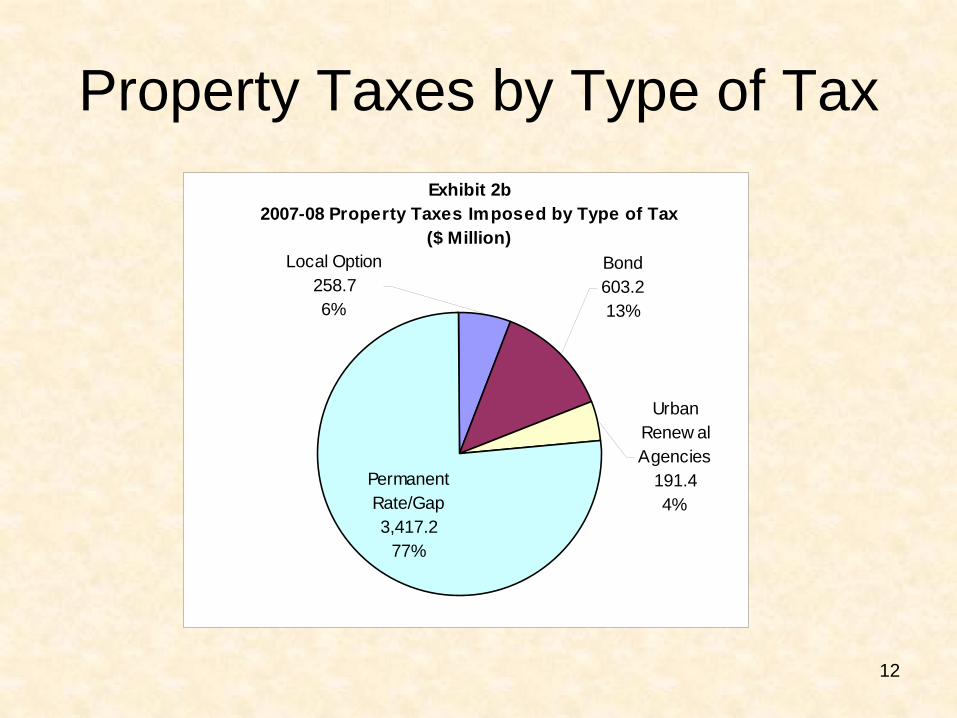
Property Taxes by Type of TaxExhibit 2b
2007-08 Property Taxes Imposed by Type of Tax ($ Million)
Urban Renew al Agencies
191.44%
Bond603.213%
Permanent Rate/Gap3,417.2
77%
Local Option258.76%

13
Type of Property Taxes Imposed by Type of District (2006-07 and 2007-08)
Type of District 2006-07 2007-08 % CH 2006-07 2007-08 % CH 2006-07 2007-08 % CH 2006-07 2007-08 % CH
Counties 639.5 695.7 8.8% 64.6 93.1 44.2% 42.4 44.0 3.7% 746.5 832.7 11.5%Cities 803.4 854.5 6.4% 65.4 56.4 -13.7% 51.7 58.6 13.4% 920.5 969.5 5.3%K-12 & ESDs 1,278.5 1,349.1 5.5% 35.7 80.6 125.9% 325.9 387.6 18.9% 1,640.0 1,817.3 10.8%Community Colleges 117.2 123.8 5.7% 0.0 0.0 NA 44.1 41.8 -5.3% 161.3 165.6 2.7%Special Districts 367.6 394.1 7.2% 27.3 28.5 4.3% 49.3 71.2 44.4% 444.2 493.7 11.1%
Total District Taxes 3,206.3 3,417.2 6.6% 193.0 258.7 34.0% 513.4 603.2 17.5% 3,912.6 4,279.0 9.4%
Urban Renewal Agencies 164.8 191.4 16.1%
Total 4,077.4 4,470.0 9.6%
Exhibit 3Type of Property Taxes Imposed, 2006-07 and 2007-08
By Type of District (Millions of Dollars)
Permanent Rate/Gap Local Option Bond Total

14
Assessed and Real Market Value of Property in Oregon
Exhibit 4Assessed and Real Market Values of Property in Oregon
$0$100$200$300$400$500$600
1983-84 1986-87 1989-90 1992-93 1995-96 1998-99 2001-02 2004-05 2007-08
Valu
e ($
Bill
ion)
Real Market Value Assessed Value

15
Property Taxes Imposed 1967-68 to 2007-08 ($ million)
Exhibit 5 Property Taxes Imposed 1967-68 to 2007-08
($ million)
$-$500
$1,000$1,500$2,000$2,500$3,000$3,500$4,000$4,500$5,000
1967-68 1971-72 1975-76 1979-80 1983-84 1987-88 1991-92 1995-96 1999-00 2003-04 2007-08
Measure 5 Fully Phased In
Measure 5 Begins
First Year Measure 50

16
Property Values and Tax Rate
0
100
200
300
400
500
600
1985
1986
1987
1988
1989
1990
1991
1992
1993
1994
1995
1996
1997
1998
1999
2000
2001
2002
2003
2004
2005
2006
2007
Assessment Year
Val
ue (B
illio
ns o
f Dol
l
0
5
10
15
20
25
30
Tax
Rate
($/1
,000
of V
al
Market Value
Assessed Value
Average Tax Rate
Average Tax Rate= Property Tax / AV

17
Property Taxes as Share of Oregon Personal Income
Exhibit 6Property Taxes as Share of Oregon Personal Income*
0.0%1.0%2.0%3.0%4.0%5.0%6.0%7.0%
1967-68 1971-72 1975-76 1979-80 1983-84 1987-88 1991-92 1995-96 1999-00 2003-04 2007-08
*Personal Income from U.S. Bureau of Economic Analysis

18
Relative Property Tax Burden (Fiscal Year 2005-06)
Note: The higher the rank is, the higher the relative burden is among states.
RANK AMONG THE
STATES
TOTAL TAXES $3,360 34 PERSONAL INCOME TAX $1,500 5 CORPORATE INCOME TAX $133 32 PROPERTY TAX $998 30 GENERAL SALES TAX 0 47* SELECTIVE SALES TAXES $292 45 OTHER TAXES $437 13
REVENUE CATEGORIES $ PER PERSON

19
Property Assessment• Appraisal – the process of identifying and
assigning a value to it• Who does appraisal?
County assessors – most property in OregonOregon Department of Revenue (DOR) – Certain large industrial sites and utility property
• Property subject to taxationAll privately owned real property (e.g., land, buildings, fixed machinery and equipment)Manufactured homesPersonal property used in business

20
Property Assessment - continued
• Property not subject to taxationHousehold furnishings, personal belongings and automobiles, crops, orchards, business inventoriesCertain intangible property (stocks, bonds, bank accounts, etc.)
• Exemptions and Reduced assessment (examples)
Exempted - Most property used for religious, fraternal, and governmental purposesReduced assessments in
Open space, farmland, forestland, historical buildingsProperties owned by disabled veterans

21
Tax Expenditure FY 2009-11 Exemptions and Special Assessments
• Full exemption – e.g., Intangible personal property $12.426 billion, Federal, state, local property $3.352 billion, Personal property for personal use $0.913 billion, Motor vehicles and trailers $0.884 billion, Business inventory $0.640 billion, etc.
• Partial exemption – e.g., Strategic Investment Program (SIP) $103.9 mil, Properties owned by disabled veterans $24.0 mil, Historical property $19.8 mil, Nonprofit low income rental housing $11.7 mil, etc.
• Special assessment – e.g., Farmland $262.4 mil, Private forestland $57.1 mil, etc.

22
Property Tax Compression• Compression – process used to reduce property taxes to
the M5 limits, $5/$1000 RMV for school, $10/$1000 RMV for non-school general government
For each property, school taxes and general government taxes compared to their limits respectively
• Limits apply to operating taxes, not bonds• If exceeding M5 limits, compression starts in a specific
order, beginning with local option taxes• Compression loss
Wide range across countiesState total = $53.2 mil for 2007-08, up from $48.8 mil in 2006-07

23
Urban Renewal Agency• Oregon Revised Statute (ORS) Chapter 457 gives each
city and county the ability to activate an urban renewal (UR) agency
• UR agency has power to propose, and act on plans to eliminate/remedy/prevent/conserve/ rehabilitate “blighted areas” when approved by the city or the county
• Substantial funding of most UR plans comes from portions taken out of local government property tax levies (they are called division of tax revenue) – for 2007-08, $158.6 mil out of $191.4 mil total UR revenue were division of tax revenue

24
Urban Renewal Revenue Division of Tax vs. Special Levy
• On top of division of tax revenue, many UR plans adopted before December 6, 1996 may raise revenue via UR levy (called special levy revenue)
• Division of tax is calculated by splitting local government property taxes between local governments and the UR agency
• The split is recalculated every year based on value growth within the plan area
• Both division of tax and UR special levy are subject to the general government tax limitation (that is, M5 limits)


![n]Rmv/Jg jm](https://img.pdfslide.us/doc/110x75/61bd4f9861276e740b118413/nrmvjg-jm.jpg)