Embed Size (px)
Citation preview
OREGON FOREST FACTS
2017-18 EDITION
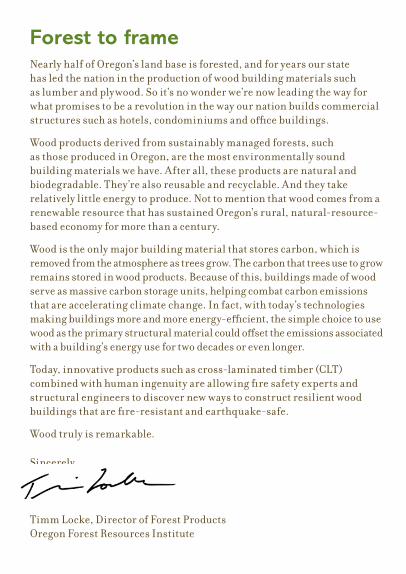
Forest to frameNearly half of Oregon’s land base is forested, and for years our state has led the nation in the production of wood building materials such as lumber and plywood. So it’s no wonder we’re now leading the way for what promises to be a revolution in the way our nation builds commercial structures such as hotels, condominiums and office buildings.
Wood products derived from sustainably managed forests, such as those produced in Oregon, are the most environmentally sound building materials we have. After all, these products are natural and biodegradable. They’re also reusable and recyclable. And they take relatively little energy to produce. Not to mention that wood comes from a renewable resource that has sustained Oregon’s rural, natural-resource-based economy for more than a century.
Wood is the only major building material that stores carbon, which is removed from the atmosphere as trees grow. The carbon that trees use to grow remains stored in wood products. Because of this, buildings made of wood serve as massive carbon storage units, helping combat carbon emissions that are accelerating climate change. In fact, with today’s technologies making buildings more and more energy-efficient, the simple choice to use wood as the primary structural material could offset the emissions associated with a building’s energy use for two decades or even longer.
Today, innovative products such as cross-laminated timber (CLT) combined with human ingenuity are allowing fire safety experts and structural engineers to discover new ways to construct resilient wood buildings that are fire-resistant and earthquake-safe.
Wood truly is remarkable.
Sincerely,
Timm Locke, Director of Forest Products Oregon Forest Resources Institute
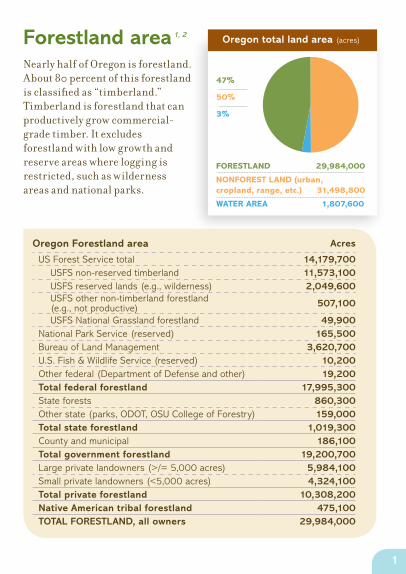
Forestland area 1, 2 Nearly half of Oregon is forestland. About 80 percent of this forestland is classified as “timberland.” Timberland is forestland that can productively grow commercial-grade timber. It excludes forestland with low growth and reserve areas where logging is restricted, such as wilderness areas and national parks.
Oregon Forestland area Acres
US Forest Service total 14,179,700 USFS non-reserved timberland 11,573,100 USFS reserved lands (e.g., wilderness) 2,049,600 USFS other non-timberland forestland (e.g., not productive) 507,100
USFS National Grassland forestland 49,900 National Park Service (reserved) 165,500
Bureau of Land Management 3,620,700U.S. Fish & Wildlife Service (reserved) 10,200Other federal (Department of Defense and other) 19,200Total federal forestland 17,995,300State forests 860,300 Other state (parks, ODOT, OSU College of Forestry) 159,000 Total state forestland 1,019,300County and municipal 186,100Total government forestland 19,200,700Large private landowners (>/= 5,000 acres) 5,984,100Small private landowners (<5,000 acres) 4,324,100Total private forestland 10,308,200Native American tribal forestland 475,100 TOTAL FORESTLAND, all owners 29,984,000
Oregon total land area (acres)
FORESTLAND 29,984,000
NONFOREST LAND (urban, cropland, range, etc.) 31,498,800
WATER AREA 1,807,600
47%
50%
3%
1
FEDERAL GOVERNMENT
LARGE PRIVATE
SMALL PRIVATE
STATE & OTHER PUBLIC
TRIBAL
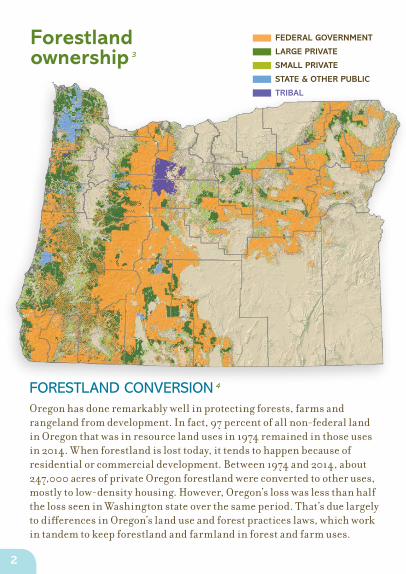
Forestland ownership 3
FORESTLAND CONVERSION 4 Oregon has done remarkably well in protecting forests, farms and rangeland from development. In fact, 97 percent of all non-federal land in Oregon that was in resource land uses in 1974 remained in those uses in 2014. When forestland is lost today, it tends to happen because of residential or commercial development. Between 1974 and 2014, about 247,000 acres of private Oregon forestland were converted to other uses, mostly to low-density housing. However, Oregon’s loss was less than half the loss seen in Washington state over the same period. That’s due largely to differences in Oregon’s land use and forest practices laws, which work in tandem to keep forestland and farmland in forest and farm uses.
2
0
5
10
15
20
25
30
1953
1963
1977
1987
1997
2007
2012
MIL
LIO
NS O
F A
CRES
Oregon forestland acreage
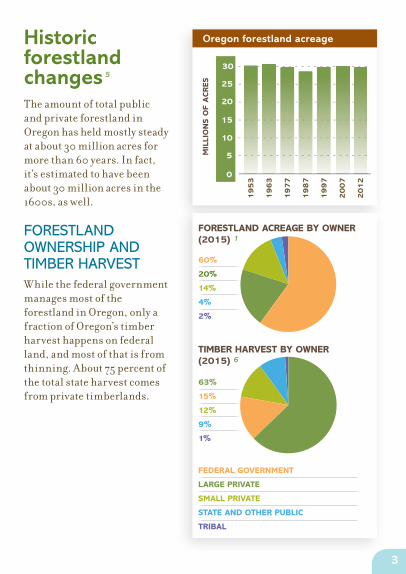
60%
20%
14%
4%
2%
FEDERAL GOVERNMENT
LARGE PRIVATE
SMALL PRIVATE
STATE AND OTHER PUBLIC
TRIBAL
FORESTLAND ACREAGE BY OWNER (2015) 1
TIMBER HARVEST BY OWNER (2015) 6
63%
15%
12%
9%
1%
Historic forestland changes 5 The amount of total public and private forestland in Oregon has held mostly steady at about 30 million acres for more than 60 years. In fact, it’s estimated to have been about 30 million acres in the 1600s, as well.
FORESTLAND OWNERSHIP AND TIMBER HARVESTWhile the federal government manages most of the forestland in Oregon, only a fraction of Oregon’s timber harvest happens on federal land, and most of that is from thinning. About 75 percent of the total state harvest comes from private timberlands.
3
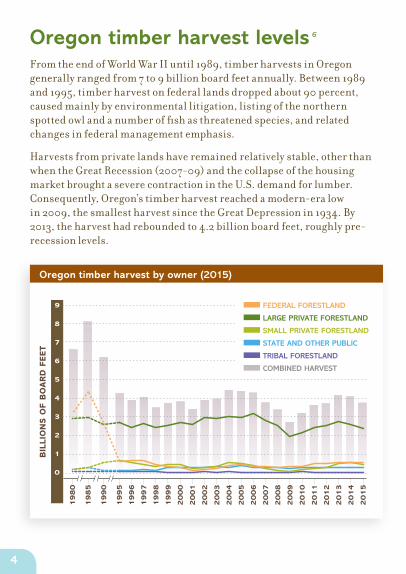
Oregon timber harvest levels 6 From the end of World War II until 1989, timber harvests in Oregon generally ranged from 7 to 9 billion board feet annually. Between 1989 and 1995, timber harvest on federal lands dropped about 90 percent, caused mainly by environmental litigation, listing of the northern spotted owl and a number of fish as threatened species, and related changes in federal management emphasis.
Harvests from private lands have remained relatively stable, other than when the Great Recession (2007-09) and the collapse of the housing market brought a severe contraction in the U.S. demand for lumber. Consequently, Oregon’s timber harvest reached a modern-era low in 2009, the smallest harvest since the Great Depression in 1934. By 2013, the harvest had rebounded to 4.2 billion board feet, roughly pre-recession levels.
19
80
19
85
19
90
19
95
19
96
19
97
19
98
19
99
20
00
20
01
20
02
20
03
20
04
20
05
20
06
20
07
20
08
20
09
20
10
20
11
20
12
20
13
20
14
20
15
9
8
7
6
5
4
3
2
1
0
BIL
LIO
NS O
F B
OA
RD
FEET
FEDERAL FORESTLAND
LARGE PRIVATE FORESTLAND
SMALL PRIVATE FORESTLAND
STATE AND OTHER PUBLIC
TRIBAL FORESTLAND
COMBINED HARVEST
0
2000
4000
6000
8000
10000
0
2000
4000
6000
8000
10000
0
2000
4000
6000
8000
10000
Oregon timber harvest by owner (2015)
4
Sustainability of Oregon’s timber harvest
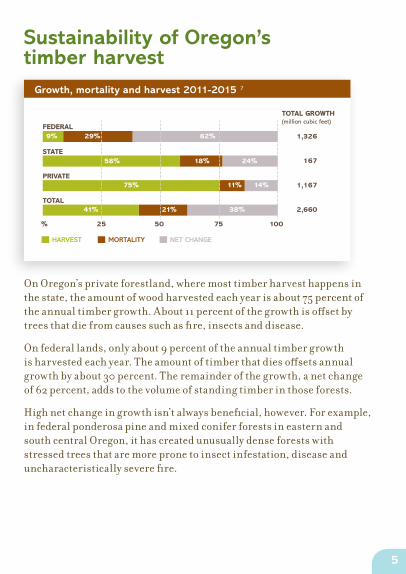
Growth, mortality and harvest 2011-2015 7
0 20 40 60 80 100
0 20 40 60 80 100
-20 0 20 40 60 80 100
MORTALITY
REMOVALS
CHANGE IN NET GROWTH
USFS
65% 8% 27%
ANNUAL GROWTH
STATE
19% 56% 25%
PRIVATE
12% 99%-11%
HARVEST MORTALITY NET CHANGE
-0.5 0.0 0.5 1.0 1.5 2.0 2.5 3.0
0 20 40 60 80 100
0.0 0.5 1.0 1.5 2.0 2.5 3.0 3.5
% 25 50 75 100
ANNUAL GROWTH
STATE
FEDERAL
PRIVATE
TOTAL
HARVEST MORTALITY NET CHANGE
% 25 50 75 100
STATE
FEDERAL
PRIVATE
TOTAL
.16.13.88
1.02.551.09
.03.10 .04
.39.11 .82
14%11%75%
38%21%41%
18%58% 24%
29%9% 62%
Lorem ipsum
TOTAL GROWTH(million cubic feet)
1,326
167
1,167
2,660
On Oregon’s private forestland, where most timber harvest happens in the state, the amount of wood harvested each year is about 75 percent of the annual timber growth. About 11 percent of the growth is offset by trees that die from causes such as fire, insects and disease.
On federal lands, only about 9 percent of the annual timber growth is harvested each year. The amount of timber that dies offsets annual growth by about 30 percent. The remainder of the growth, a net change of 62 percent, adds to the volume of standing timber in those forests.
High net change in growth isn’t always beneficial, however. For example, in federal ponderosa pine and mixed conifer forests in eastern and south central Oregon, it has created unusually dense forests with stressed trees that are more prone to insect infestation, disease and uncharacteristically severe fire.
5
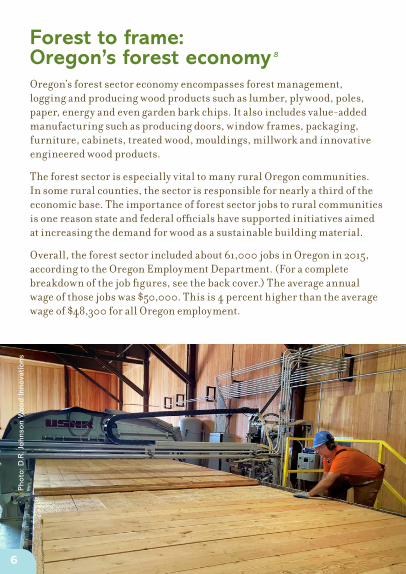
Forest to frame: Oregon’s forest economy 8 Oregon’s forest sector economy encompasses forest management, logging and producing wood products such as lumber, plywood, poles, paper, energy and even garden bark chips. It also includes value-added manufacturing such as producing doors, window frames, packaging, furniture, cabinets, treated wood, mouldings, millwork and innovative engineered wood products.
The forest sector is especially vital to many rural Oregon communities. In some rural counties, the sector is responsible for nearly a third of the economic base. The importance of forest sector jobs to rural communities is one reason state and federal officials have supported initiatives aimed at increasing the demand for wood as a sustainable building material.
Overall, the forest sector included about 61,000 jobs in Oregon in 2015, according to the Oregon Employment Department. (For a complete breakdown of the job figures, see the back cover.) The average annual wage of those jobs was $50,000. This is 4 percent higher than the average wage of $48,300 for all Oregon employment.
Pho
to: D
.R. J
ohn
son
Wood
Inno
vations
6
0
5000
10000
15000
20000
25000
30000
35000
0
5000
10000
15000
20000
25000
30000
35000
0
10000
20000
30000
40000
50000
19
90
19
92
19
94
19
96
19
98
20
00
20
02
20
04
20
06
20
08
20
10
20
12
20
14
1990
1991
1992
1993
1994
1995
1996
1997
1998
1999
2000
2001
2002
2003
2004
2005
2006
2007
2008
2009
2010
2011
2012
2013
2014
2015
40K
30K
20K
10K
OTHER WOOD PRODUCTS
PLYWOOD AND ENGINEERED
SAWMILLS AND WOOD PRESERVATION
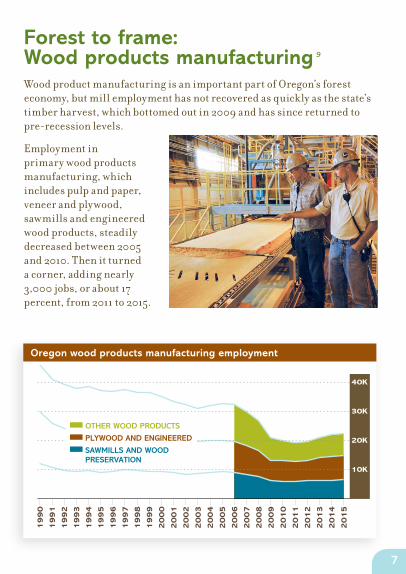
Oregon wood products manufacturing employment
Forest to frame: Wood products manufacturing 9 Wood product manufacturing is an important part of Oregon’s forest economy, but mill employment has not recovered as quickly as the state’s timber harvest, which bottomed out in 2009 and has since returned to pre-recession levels.
Employment in primary wood products manufacturing, which includes pulp and paper, veneer and plywood, sawmills and engineered wood products, steadily decreased between 2005 and 2010. Then it turned a corner, adding nearly 3,000 jobs, or about 17 percent, from 2011 to 2015.
7
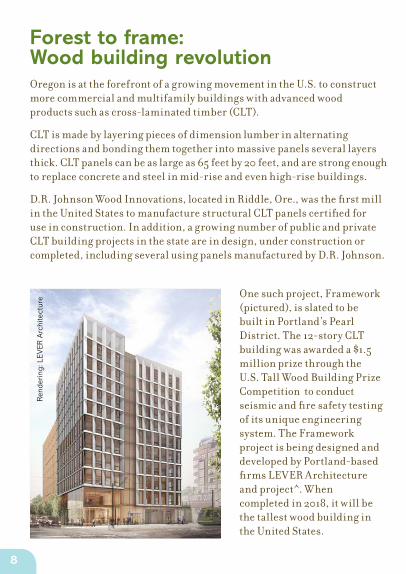
Forest to frame: Wood building revolution Oregon is at the forefront of a growing movement in the U.S. to construct more commercial and multifamily buildings with advanced wood products such as cross-laminated timber (CLT).
CLT is made by layering pieces of dimension lumber in alternating directions and bonding them together into massive panels several layers thick. CLT panels can be as large as 65 feet by 20 feet, and are strong enough to replace concrete and steel in mid-rise and even high-rise buildings.
D.R. Johnson Wood Innovations, located in Riddle, Ore., was the first mill in the United States to manufacture structural CLT panels certified for use in construction. In addition, a growing number of public and private CLT building projects in the state are in design, under construction or completed, including several using panels manufactured by D.R. Johnson.
One such project, Framework (pictured), is slated to be built in Portland’s Pearl District. The 12-story CLT building was awarded a $1.5 million prize through the U.S. Tall Wood Building Prize Competition to conduct seismic and fire safety testing of its unique engineering system. The Framework project is being designed and developed by Portland-based firms LEVER Architecture and project .̂ When completed in 2018, it will be the tallest wood building in the United States.
Ren
dering
: LEV
ER A
rchi
tect
ure
8
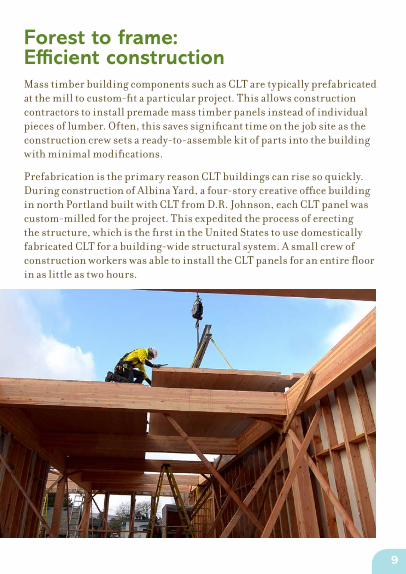
Forest to frame: Efficient construction Mass timber building components such as CLT are typically prefabricated at the mill to custom-fit a particular project. This allows construction contractors to install premade mass timber panels instead of individual pieces of lumber. Often, this saves significant time on the job site as the construction crew sets a ready-to-assemble kit of parts into the building with minimal modifications.
Prefabrication is the primary reason CLT buildings can rise so quickly. During construction of Albina Yard, a four-story creative office building in north Portland built with CLT from D.R. Johnson, each CLT panel was custom-milled for the project. This expedited the process of erecting the structure, which is the first in the United States to use domestically fabricated CLT for a building-wide structural system. A small crew of construction workers was able to install the CLT panels for an entire floor in as little as two hours.
9
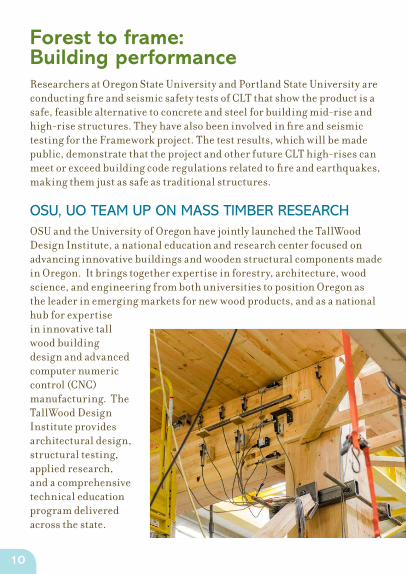
Forest to frame: Building performance Researchers at Oregon State University and Portland State University are conducting fire and seismic safety tests of CLT that show the product is a safe, feasible alternative to concrete and steel for building mid-rise and high-rise structures. They have also been involved in fire and seismic testing for the Framework project. The test results, which will be made public, demonstrate that the project and other future CLT high-rises can meet or exceed building code regulations related to fire and earthquakes, making them just as safe as traditional structures.
OSU, UO TEAM UP ON MASS TIMBER RESEARCH OSU and the University of Oregon have jointly launched the TallWood Design Institute, a national education and research center focused on advancing innovative buildings and wooden structural components made in Oregon. It brings together expertise in forestry, architecture, wood science, and engineering from both universities to position Oregon as the leader in emerging markets for new wood products, and as a national hub for expertise in innovative tall wood building design and advanced computer numeric control (CNC) manufacturing. The TallWood Design Institute provides architectural design, structural testing, applied research, and a comprehensive technical education program delivered across the state.
10
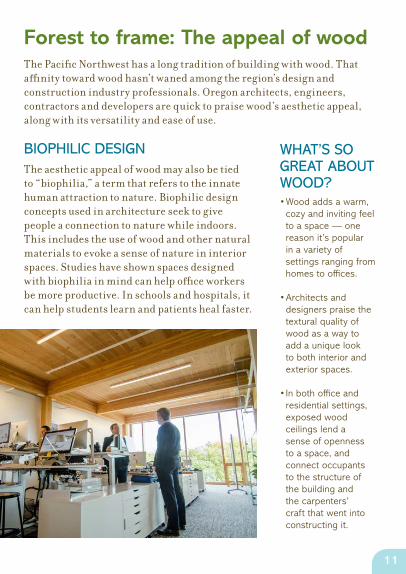
Forest to frame: The appeal of wood The Pacific Northwest has a long tradition of building with wood. That affinity toward wood hasn’t waned among the region’s design and construction industry professionals. Oregon architects, engineers, contractors and developers are quick to praise wood’s aesthetic appeal, along with its versatility and ease of use.
BIOPHILIC DESIGN The aesthetic appeal of wood may also be tied to “biophilia,” a term that refers to the innate human attraction to nature. Biophilic design concepts used in architecture seek to give people a connection to nature while indoors. This includes the use of wood and other natural materials to evoke a sense of nature in interior spaces. Studies have shown spaces designed with biophilia in mind can help office workers be more productive. In schools and hospitals, it can help students learn and patients heal faster.
WHAT’S SO GREAT ABOUT WOOD?• Wood adds a warm,
cozy and inviting feel to a space — one reason it’s popular in a variety of settings ranging from homes to offices.
• Architects and designers praise the textural quality of wood as a way to add a unique look to both interior and exterior spaces.
• In both office and residential settings, exposed wood ceilings lend a sense of openness to a space, and connect occupants to the structure of the building and the carpenters’ craft that went into constructing it.
11
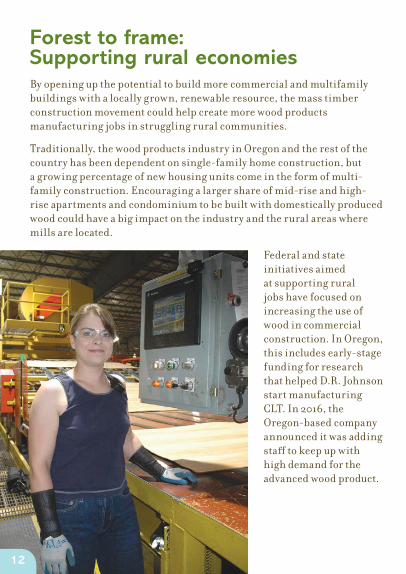
Forest to frame: Supporting rural economies By opening up the potential to build more commercial and multifamily buildings with a locally grown, renewable resource, the mass timber construction movement could help create more wood products manufacturing jobs in struggling rural communities.
Traditionally, the wood products industry in Oregon and the rest of the country has been dependent on single-family home construction, but a growing percentage of new housing units come in the form of multi-family construction. Encouraging a larger share of mid-rise and high-rise apartments and condominium to be built with domestically produced wood could have a big impact on the industry and the rural areas where mills are located.
Federal and state initiatives aimed at supporting rural jobs have focused on increasing the use of wood in commercial construction. In Oregon, this includes early-stage funding for research that helped D.R. Johnson start manufacturing CLT. In 2016, the Oregon-based company announced it was adding staff to keep up with high demand for the advanced wood product.
12
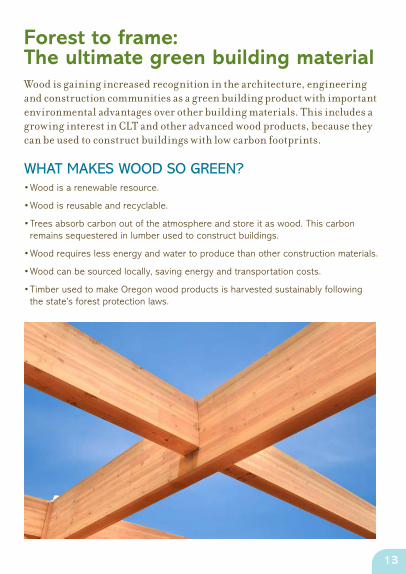
Forest to frame: The ultimate green building material Wood is gaining increased recognition in the architecture, engineering and construction communities as a green building product with important environmental advantages over other building materials. This includes a growing interest in CLT and other advanced wood products, because they can be used to construct buildings with low carbon footprints.
WHAT MAKES WOOD SO GREEN? • Wood is a renewable resource.
• Wood is reusable and recyclable.
• Trees absorb carbon out of the atmosphere and store it as wood. This carbon remains sequestered in lumber used to construct buildings.
• Wood requires less energy and water to produce than other construction materials.
• Wood can be sourced locally, saving energy and transportation costs.
• Timber used to make Oregon wood products is harvested sustainably following the state’s forest protection laws.
13
A range of forest productsOregon’s wood products industry is a traded sector, with close to 75 percent of all products made here sold outside the state. This generates revenue that supports mill jobs in Oregon timber towns.
Here are some of the many different types of products that can be made from trees harvested in Oregon:
• Softwood lumber such as dimension lumber, beams, studs, wood paneling, siding, flooring, decking, moulding and millwork, door and window frames, and furniture parts (see page 15)
• Plywood from softwood veneer (see page 16)
• Hardwood lumber and plywood used in cabinetry, millwork, furniture and flooring
• Engineered wood products, such as laminated veneer lumber, glulam beams and columns, finger-jointed lumber, I-beams, cross-laminated timber (CLT) and other products (see page 17)
• Composite wood products, such as particleboard, hardboard and fiberboard; made largely from residuals generated by sawmills and plywood mills
• Posts, poles and timbers, such as utility poles, fence posts, pilings, treated timbers, cross-arms and railroad ties
• Pulp and paper products from wood fiber, including packaging, printing paper, newsprint, tissue, toweling, absorbents, adhesives and fluff pulp
• Millwork, including products such as cabinets, furniture and fencing
• Biomass energy from mills burning wood waste to generate heat and electricity for manufacturing, or power plants replacing coal with timber harvest waste
• Heating uses such as wood pellets and bricks made from sawdust and mill residue
• Other wood products, including shipping pallets, pencils and musical instruments as well as products that contain cellulose and other substances that come from trees, such as rayon, cellophane, toothpaste, chewing gum, nail polish, hairspray, and food additives and flavorings
14
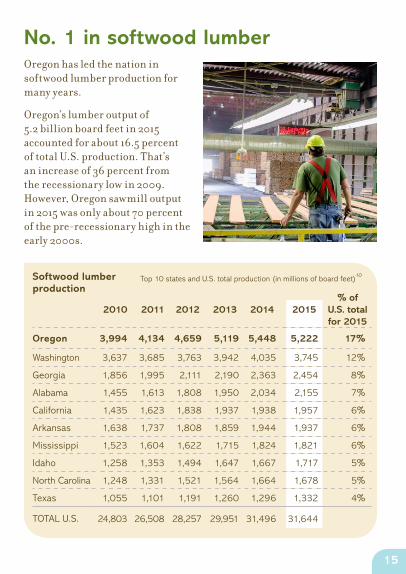
No. 1 in softwood lumberOregon has led the nation in softwood lumber production for many years.
Oregon’s lumber output of 5.2 billion board feet in 2015 accounted for about 16.5 percent of total U.S. production. That’s an increase of 36 percent from the recessionary low in 2009. However, Oregon sawmill output in 2015 was only about 70 percent of the pre-recessionary high in the early 2000s.
Top 10 states and U.S. total production (in millions of board feet)10
2010 2011 2012 2013 2014 2015 % of
U.S. total for 2015
Oregon 3,994 4,134 4,659 5,119 5,448 5,222 17%
Washington 3,637 3,685 3,763 3,942 4,035 3,745 12%
Georgia 1,856 1,995 2,111 2,190 2,363 2,454 8%
Alabama 1,455 1,613 1,808 1,950 2,034 2,155 7%
California 1,435 1,623 1,838 1,937 1,938 1,957 6%
Arkansas 1,638 1,737 1,808 1,859 1,944 1,937 6%
Mississippi 1,523 1,604 1,622 1,715 1,824 1,821 6%
Idaho 1,258 1,353 1,494 1,647 1,667 1,717 5%
North Carolina 1,248 1,331 1,521 1,564 1,664 1,678 5%
Texas 1,055 1,101 1,191 1,260 1,296 1,332 4%
TOTAL U.S. 24,803 26,508 28,257 29,951 31,496 31,644
Softwood lumber production
15
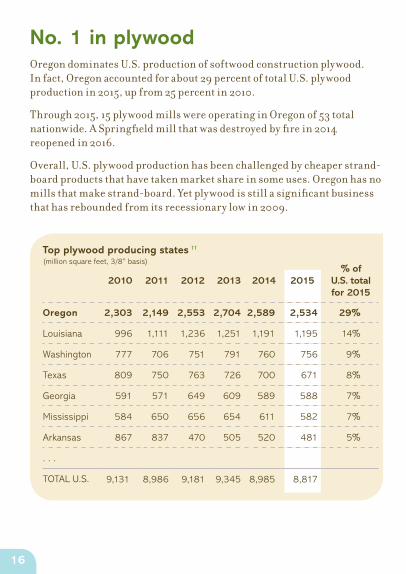
No. 1 in plywoodOregon dominates U.S. production of softwood construction plywood. In fact, Oregon accounted for about 29 percent of total U.S. plywood production in 2015, up from 25 percent in 2010.
Through 2015, 15 plywood mills were operating in Oregon of 53 total nationwide. A Springfield mill that was destroyed by fire in 2014 reopened in 2016.
Overall, U.S. plywood production has been challenged by cheaper strand-board products that have taken market share in some uses. Oregon has no mills that make strand-board. Yet plywood is still a significant business that has rebounded from its recessionary low in 2009.
2010 2011 2012 2013 2014 2015 % of
U.S. total for 2015
Oregon 2,303 2,149 2,553 2,704 2,589 2,534 29%
Louisiana 996 1,111 1,236 1,251 1,191 1,195 14%
Washington 777 706 751 791 760 756 9%
Texas 809 750 763 726 700 671 8%
Georgia 591 571 649 609 589 588 7%
Mississippi 584 650 656 654 611 582 7%
Arkansas 867 837 470 505 520 481 5%
. . .
TOTAL U.S. 9,131 8,986 9,181 9,345 8,985 8,817
Top plywood producing states 11 (million square feet, 3/8” basis)
16
A leader in engineered woodSome Oregon companies are using innovative techniques to turn raw timber or lumber into value-added engineered wood products.
Here are some examples of engineered wood products:
• Cross-Laminated Timber (CLT) is made by adhering dimension lumber into large panels several layers thick, with each layer’s wood fibers running perpendicular to the adjacent layers. Currently, the largest CLT panels produced in the world are about 65 feet long and 20 feet wide. CLT panels typically range in thickness from 5 to 16 inches and are used to build walls, floors and roofs. Panels can be prefabricated with cutouts for windows, plumbing, electrical wiring and ventilation, and assembled into large, multistory buildings that otherwise might be built from steel or concrete.
• Glued-Laminated Timber (Glulam) is a stress-rated engineered wood product made up of wood laminations or “lams” that are bonded together with strong, waterproof adhesives. Glulam is used in commercial and residential applications, ranging from simple garage door headers and floor beams to huge, dramatic, curving beams that are an architectural focal point.
• Laminated Veneer Lumber (LVL) is the most widely used structural composite lumber product. It is produced by bonding thin wood veneers together into a large board called a billet. The LVL billet is then sawed to desired dimensions depending on the construction application. The many uses of LVL include headers and beams, rafters, rim board, scaffold planking, studs and flange material for prefabricated wood I-joists and truss components.
• Mass Plywood Panel (MPP) is a veneer-based engineered wood product that is similar to plywood, but at a massive scale. Finished panels can be up to 12 feet wide, 48 feet long and 24 inches thick. The panels can be used as an alternative to CLT in similar applications, including constructing multistory buildings.
• Nail-Laminated Timber (NLT) is created by nailing together dimension lumber stacked on edge into a single structural element. NLT is used in floors, decks and roofs, as well as elevator and stair shafts.
• Parallel Strand Lumber (PSL), Laminated Strand Lumber (LSL) and Oriented Strand Lumber (OSL) are all structural composite lumber products made from flakes of wood (strands) that are combined with adhesive and used for studs, headers or beams.
17
The Oregon Forest Practices Act In 1971, Oregon became the first state to pass a comprehensive law to regulate forest practices and safeguard water, fish and wildlife habitat, soil and air. The rules of the Oregon Forest Practices Act are continually reviewed and updated to keep pace with the most current scientific research. Here are some of the key requirements.
IMPORTANT RULES• Reforestation: Landowners must complete replanting within two years after a
timber harvest, with at least 200 tree seedlings per acre. Within six years, the harvest area must contain healthy trees that can outgrow competing grass and brush on their own.
• Water and stream protection: Timber harvesting, road building and the use of chemicals are restricted close to streams to protect fish and safeguard the source of much of Oregon’s drinking water.
• Wildlife habitat protection: Live trees, standing dead trees (snags) and fallen logs must be left after a timber harvest to provide wildlife habitat.
• Limits on clearcutting: Clearcuts cannot exceed 120 acres within a single ownership, including the combined acreage of any clearcuts within 300 feet of each other.
• Chemical application: Forest protection laws limit the use of chemicals. Foresters must follow a variety of state and federal regulations when using herbicides to slow down the growth of invasive plants and other vegetation that compete with newly planted tree seedlings for water, sunlight and nutrients. This helps the young trees survive and become established enough that herbicides are no longer needed until the next replanting.
18
Water quality in Oregon’s forestsStreams originating on forestlands supply water for Oregonians to drink, use in their homes and businesses, irrigate their fields and run industrial processes. Forest soils provide natural filtration to keep streams clean and water quality high. Some 35 municipal water systems in Oregon source their drinking water supply from forested watersheds. More than 30 of those watersheds include actively managed lands that employ modern timber harvest and resource protection methods.
OREGON WATER QUALITY INDEX 12 According to a statewide index, the highest water quality in Oregon occurs in forested watersheds.
The Oregon Department of Environmental Quality regularly measures water quality in major rivers and streams throughout the state. DEQ developed the Oregon Water Quality Index using eight measures to express water quality as a number between 10 (worst) and 100 (ideal). There are currently 160 monitoring sites in the DEQ network. Among all land uses, the highest water quality generally occurs in forested watersheds, including those that have significant active management.
According to the index, 64 percent of the forestland test sites had a good or excellent water quality rating, compared to 51 percent of all the sites statewide, which include range, agricultural and urban areas.
See more about the OWQI at www.deq.state.or.us/lab/wqm/wqimain.htm.
19
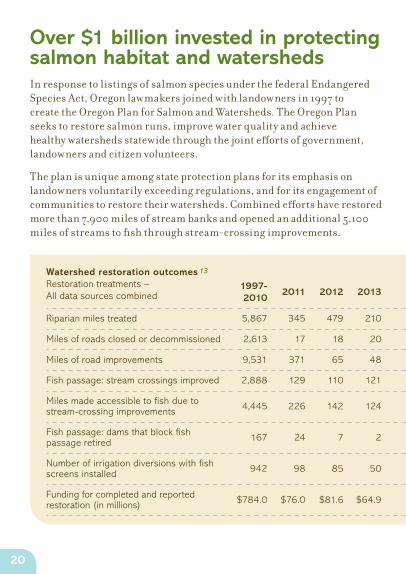
Over $1 billion invested in protecting salmon habitat and watershedsIn response to listings of salmon species under the federal Endangered Species Act, Oregon lawmakers joined with landowners in 1997 to create the Oregon Plan for Salmon and Watersheds. The Oregon Plan seeks to restore salmon runs, improve water quality and achieve healthy watersheds statewide through the joint efforts of government, landowners and citizen volunteers.
The plan is unique among state protection plans for its emphasis on landowners voluntarily exceeding regulations, and for its engagement of communities to restore their watersheds. Combined efforts have restored more than 7,900 miles of stream banks and opened an additional 5,100 miles of streams to fish through stream-crossing improvements.
1997-2010
2011 2012 2013 2014 2015 Total
Riparian miles treated 5,867 345 479 210 616 386 7,904
Miles of roads closed or decommissioned 2,613 17 18 20 16 6 2,690
Miles of road improvements 9,531 371 65 48 388 22 10,425
Fish passage: stream crossings improved 2,888 129 110 121 114 50 3,412
Miles made accessible to fish due to stream-crossing improvements 4,445 226 142 124 131 57 5,125
Fish passage: dams that block fish passage retired 167 24 7 2 6 12 218
Number of irrigation diversions with fish screens installed 942 98 85 50 35 27 1,237
Funding for completed and reported restoration (in millions) $784.0 $76.0 $81.6 $64.9 $49.6 $32.0 $1,088.1
Watershed restoration outcomes 13
Restoration treatments –All data sources combined
20
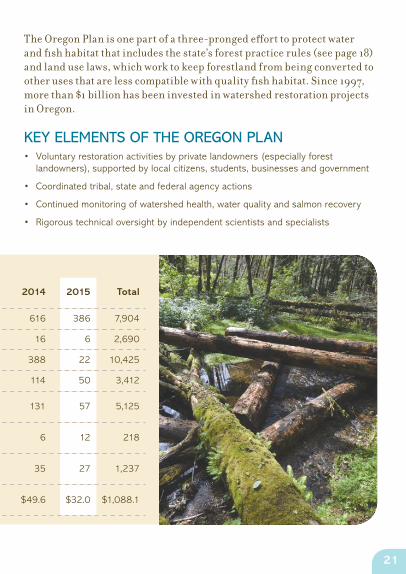
1997-2010
2011 2012 2013 2014 2015 Total
Riparian miles treated 5,867 345 479 210 616 386 7,904
Miles of roads closed or decommissioned 2,613 17 18 20 16 6 2,690
Miles of road improvements 9,531 371 65 48 388 22 10,425
Fish passage: stream crossings improved 2,888 129 110 121 114 50 3,412
Miles made accessible to fish due to stream-crossing improvements 4,445 226 142 124 131 57 5,125
Fish passage: dams that block fish passage retired 167 24 7 2 6 12 218
Number of irrigation diversions with fish screens installed 942 98 85 50 35 27 1,237
Funding for completed and reported restoration (in millions) $784.0 $76.0 $81.6 $64.9 $49.6 $32.0 $1,088.1
The Oregon Plan is one part of a three-pronged effort to protect water and fish habitat that includes the state’s forest practice rules (see page 18) and land use laws, which work to keep forestland from being converted to other uses that are less compatible with quality fish habitat. Since 1997, more than $1 billion has been invested in watershed restoration projects in Oregon.
KEY ELEMENTS OF THE OREGON PLAN• Voluntary restoration activities by private landowners (especially forest
landowners), supported by local citizens, students, businesses and government
• Coordinated tribal, state and federal agency actions
• Continued monitoring of watershed health, water quality and salmon recovery
• Rigorous technical oversight by independent scientists and specialists
21
A balanced approach: Three classes of forest management 14
Forestland management classifications
TIMBER PRODUCTION
MULTI-RESOURCE
RESERVE
91.76%
8.24%
91.76%
91.76%
NET GROWTH
MORTALITY
WESTERN OREGON
Forestland Management Classi�cations
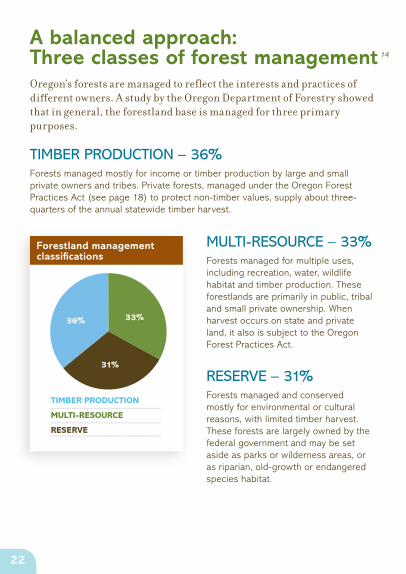
36% 33%
31%
MULTI-RESOURCE – 33%Forests managed for multiple uses, including recreation, water, wildlife habitat and timber production. These forestlands are primarily in public, tribal and small private ownership. When harvest occurs on state and private land, it also is subject to the Oregon Forest Practices Act.
RESERVE – 31%Forests managed and conserved mostly for environmental or cultural reasons, with limited timber harvest. These forests are largely owned by the federal government and may be set aside as parks or wilderness areas, or as riparian, old-growth or endangered species habitat.
Oregon’s forests are managed to reflect the interests and practices of different owners. A study by the Oregon Department of Forestry showed that in general, the forestland base is managed for three primary purposes.
TIMBER PRODUCTION – 36%Forests managed mostly for income or timber production by large and small private owners and tribes. Private forests, managed under the Oregon Forest Practices Act (see page 18) to protect non-timber values, supply about three-quarters of the annual statewide timber harvest.
22
Sustainable forestry Oregon forest landowners meet some of the strictest environmental standards in the world through compliance with the Oregon Forest Practices Act (see page 18). Yet they may choose to meet additional standards to gain recognition from independent, third-party forest sustainability certification systems.
America’s three largest certification systems are the American Tree Farm System (ATFS), Forest Stewardship Council (FSC), and the Sustainable Forestry Initiative (SFI).
Forest certification gives wood product consumers, architects, engineers and builders an added level of assurance that the products were produced using responsible and sustainable forestry practices.
Certification system Acres
American Tree Farm System 15 795,100
Forest Stewardship Council 16 195,196
Sustainable Forestry Initiative 17 3,969,803
TOTAL 4,960,099
Oregon acres certified by the three major forest certification systems (October 2016)
OREGON WOOD AND LEED 18 Wood from Oregon forestland regulated by the state’s forest protection laws can count toward Leadership in Energy & Environmental Design (LEED) certification of sustainable building projects. An independent third-party audit commissioned by the Oregon Department of Forestry found that Oregon-grown wood meets the LEED credit for wood use in a project if it comes from timberland subject to the Oregon Forest Practices Act (see page 18). The audit showed the provisions of the law meet an international standard for responsible forestry.
23
Fire in Oregon’s forestsFire has always been part of the forest ecosystem, although Oregon has different kinds of forests that have been shaped by different kinds of fires.19
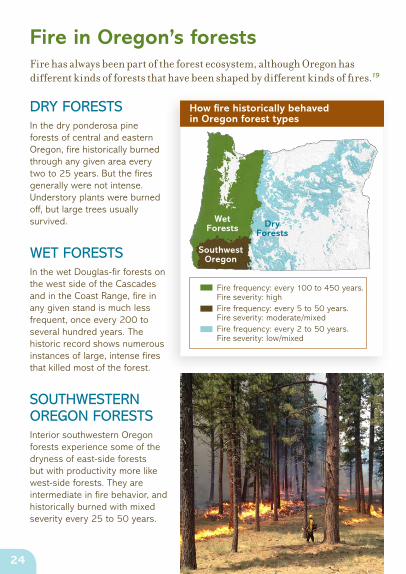
DRY FORESTSIn the dry ponderosa pine forests of central and eastern Oregon, fire historically burned through any given area every two to 25 years. But the fires generally were not intense. Understory plants were burned off, but large trees usually survived.
WET FORESTSIn the wet Douglas-fir forests on the west side of the Cascades and in the Coast Range, fire in any given stand is much less frequent, once every 200 to several hundred years. The historic record shows numerous instances of large, intense fires that killed most of the forest.
SOUTHWESTERN OREGON FORESTSInterior southwestern Oregon forests experience some of the dryness of east-side forests but with productivity more like west-side forests. They are intermediate in fire behavior, and historically burned with mixed severity every 25 to 50 years.
How fire historically behaved in Oregon forest types
Wet Forests
Southwest Oregon
Dry Forests
Fire frequency: every 100 to 450 years. Fire severity: highFire frequency: every 5 to 50 years. Fire severity: moderate/mixedFire frequency: every 2 to 50 years. Fire severity: low/mixed
24
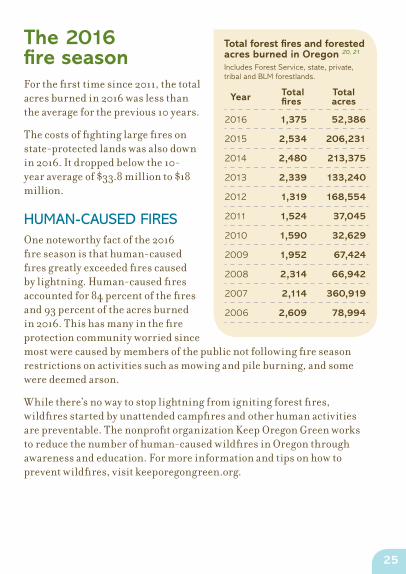
The 2016 fire season For the first time since 2011, the total acres burned in 2016 was less than the average for the previous 10 years.
The costs of fighting large fires on state-protected lands was also down in 2016. It dropped below the 10-year average of $33.8 million to $18 million.
HUMAN-CAUSED FIRESOne noteworthy fact of the 2016 fire season is that human-caused fires greatly exceeded fires caused by lightning. Human-caused fires accounted for 84 percent of the fires and 93 percent of the acres burned in 2016. This has many in the fire protection community worried since most were caused by members of the public not following fire season restrictions on activities such as mowing and pile burning, and some were deemed arson.
While there’s no way to stop lightning from igniting forest fires, wildfires started by unattended campfires and other human activities are preventable. The nonprofit organization Keep Oregon Green works to reduce the number of human-caused wildfires in Oregon through awareness and education. For more information and tips on how to prevent wildfires, visit keeporegongreen.org.
Year Total fires
Total acres
2016 1,375 52,386
2015 2,534 206,231
2014 2,480 213,375
2013 2,339 133,240
2012 1,319 168,554
2011 1,524 37,045
2010 1,590 32,629
2009 1,952 67,424
2008 2,314 66,942
2007 2,114 360,919
2006 2,609 78,994
Total forest fires and forested acres burned in Oregon 20, 21
Includes Forest Service, state, private, tribal and BLM forestlands.
25
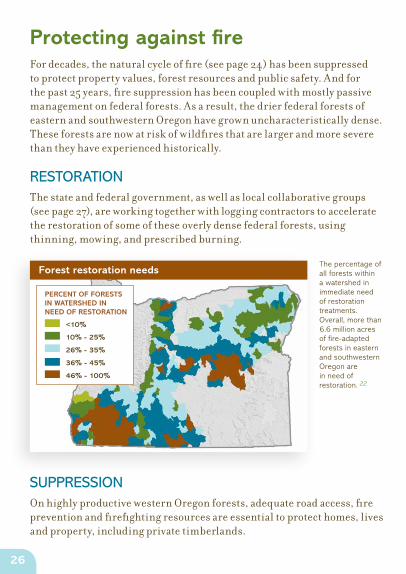
Protecting against fireFor decades, the natural cycle of fire (see page 24) has been suppressed to protect property values, forest resources and public safety. And for the past 25 years, fire suppression has been coupled with mostly passive management on federal forests. As a result, the drier federal forests of eastern and southwestern Oregon have grown uncharacteristically dense. These forests are now at risk of wildfires that are larger and more severe than they have experienced historically.
RESTORATIONThe state and federal government, as well as local collaborative groups (see page 27), are working together with logging contractors to accelerate the restoration of some of these overly dense federal forests, using thinning, mowing, and prescribed burning.
The percentage of all forests within a watershed in immediate need of restoration treatments. Overall, more than 6.6 million acres of fire-adapted forests in eastern and southwestern Oregon are in need of restoration. 22
SUPPRESSIONOn highly productive western Oregon forests, adequate road access, fire prevention and firefighting resources are essential to protect homes, lives and property, including private timberlands.
PERCENT OF FORESTS IN WATERSHED IN NEED OF RESTORATION
<10%
10% - 25%
26% - 35%
36% - 45%
46% - 100%
Forest restoration needs
26
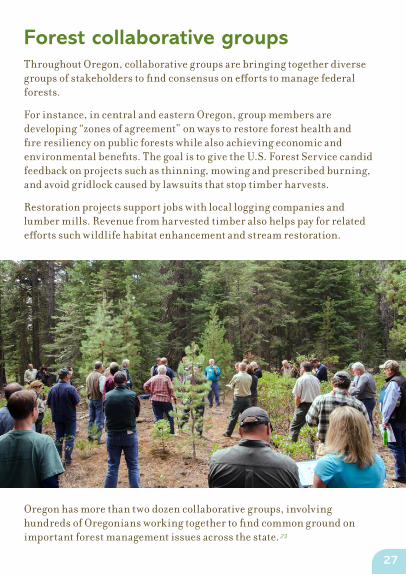
Forest collaborative groups Throughout Oregon, collaborative groups are bringing together diverse groups of stakeholders to find consensus on efforts to manage federal forests.
For instance, in central and eastern Oregon, group members are developing “zones of agreement” on ways to restore forest health and fire resiliency on public forests while also achieving economic and environmental benefits. The goal is to give the U.S. Forest Service candid feedback on projects such as thinning, mowing and prescribed burning, and avoid gridlock caused by lawsuits that stop timber harvests.
Restoration projects support jobs with local logging companies and lumber mills. Revenue from harvested timber also helps pay for related efforts such wildlife habitat enhancement and stream restoration.
Oregon has more than two dozen collaborative groups, involving hundreds of Oregonians working together to find common ground on important forest management issues across the state. 23
27
1. Pacific Northwest Forest Inventory and Analysis database (PNW-FIADB), 2004-2013. Resource Monitoring and Assessment Program, USDA Forest Service, Pacific Northwest Research Station, Portland, Ore.
2. Oregon Department of Forestry Resources Planning Program. (Additional information on tribal lands and state lands, including an adjustment for the sale of some parcels of the Elliot State Forest in 2014.)
3. Oregon Department of Forestry, “About Oregon’s Forests.” www.oregon.gov/ODF/ForestBenefits/Pages/default.aspx/AboutOregonsForests.
4. Gray, Andrew N.; Hubner, Dan; Lettman, Gary J.; McKay, Neil; Thompson, Joel L., “Forests, farms & people: Land use change on non-federal land in Oregon 1974-2014.” Oregon Department of Forestry. June 2016. http://hdl.handle.net/1957/58941.
5. Oswalt, Sonja N.; Smith, W. Brad; Miles, Patrick D.; Pugh, Scott A., “Forest Resources of the United States, 2012.” General Technical Report WO-91. USDA Forest Service, Washington, D.C. 2014. srs.fs.usda.gov/pubs/47322.
6. Oregon Department of Forestry Forest Resources Planning Program, Harvest Reports. data.oregon.gov/Natural-Resources/Timber-Harvest-Data-1942-2015/v7yh-3r7a.
7. Montzka, Thomas A., Straight Arrow Consulting. Personal communication. Based on USDA Forest Service, Forest Inventory and Analysis 2011-2015 data. www.fs.fed.us/pnw/rma/index.php.
8. Oregon Employment Department, based on North American Industry Classification System (NAICS) and U.S. Census data, in cooperation with the Oregon Department of Forestry and the Oregon Forest Resources Institute. October 2016.
9. Rooney, Brian. “Oregon’s wood products manufacturing industry is still important, especially in rural areas.” Oregon Employment Department. September 2016.
10. Forest Economic Advisors LLC. Personal communication. October 2014. www.getfea.com.
11. Elling, Joe, “Structural Panel and Engineered Wood Yearbook.” APA – The Engineered Wood Association. Tacoma, Wash. April 2016.
ENDNOTES – SOURCES OF INFORMATION
28
12. Coffeen, Greg, and Mulvey, Michael, “Oregon Water Quality Index Summary Report: Water Years 2004-2013.” Oregon Department of Environmental Quality. June 2014. www.deq.state.or.us/lab/wqm/docs/wqiAnnualRep2014.pdf.
13. Oregon Watershed Enhancement Board, “Oregon Watershed Restoration Inventory. Oregon Plan Biennial Report Watershed Outcomes Summary (1999-2015).” 2016. www.oregon.gov/OWEB/Pages/BiennialReport.aspx.
14. Oregon Forest Resources Institute, “Protecting Oregon’s Forestlands: A Graphical View – How Oregon Is Protecting and Enhancing the Diverse Values of Its Forestlands.” 2002.
15. American Tree Farm System. www.treefarmsystem.org.
16. Forest Stewardship Council. www.us.fsc.org.
17. Sustainable Forestry Initiative, as of October 2014. www.sfiprogram.org.
18. Nelson, J. Robert, P.E., “Independent Third-Party Assessment of the Oregon Forest Practices Act in Accordance with ASTM D7612.” Prepared for the Oregon Department of Forestry by PFS Corporation and Rob Brooks and Associates LLC. September 2015.
19. Oregon Forest Resources Institute, “State of Fire.” 2014.
20. Powell, Mike. Northwest Coordination Center, U.S. Bureau of Land Management, Predictive Services Unit, Portland, Ore. gacc.nifc.gov/nwcc/admin/publications.
21. Oregon Department of Forestry, fire reports: http://www.oregon.gov/odf/fire/Pages/default.aspx (Annual Fire Season Reports)
22. Haugo, Ryan; Zanger, Chris; DeMeo, Tom; Ringo, Chris; Shlisky, Ayn; Blankenship, Kori; Simpson, Mike; Mellen-McLean, Kim; Kertis, Jane; Stern, Mark, “A New Approach to Evaluate Forest Structure Restoration Needs across Oregon and Washington, USA.” Forest Ecology and Management, Volume 335, pages 37-50. Jan. 1, 2015. Also at: www.sciencedirect.com/science/article/pii/S0378112714005519.
23. Davis, Emily Jane, “Oregon forest collaborative groups.” Oregon State University and Ecosystem Workforce Program, University of Oregon. December 2015. http://ewp.uoregon.edu/sites/ewp.uoregon.edu/files/CollaborativesMap20151228_LR.pdf.
29
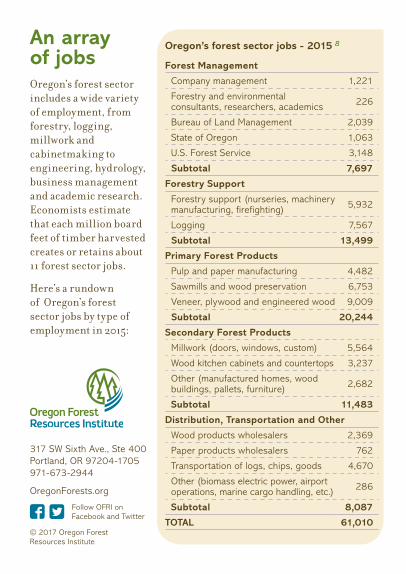
An array of jobsOregon’s forest sector includes a wide variety of employment, from forestry, logging, millwork and cabinetmaking to engineering, hydrology, business management and academic research. Economists estimate that each million board feet of timber harvested creates or retains about 11 forest sector jobs.
Here’s a rundown of Oregon’s forest sector jobs by type of employment in 2015:
Forest Management
Company management 1,221
Forestry and environmental consultants, researchers, academics 226
Bureau of Land Management 2,039
State of Oregon 1,063
U.S. Forest Service 3,148
Subtotal 7,697
Forestry Support
Forestry support (nurseries, machinery manufacturing, firefighting) 5,932
Logging 7,567
Subtotal 13,499
Primary Forest Products
Pulp and paper manufacturing 4,482
Sawmills and wood preservation 6,753
Veneer, plywood and engineered wood 9,009
Subtotal 20,244
Secondary Forest Products
Millwork (doors, windows, custom) 5,564
Wood kitchen cabinets and countertops 3,237
Other (manufactured homes, wood buildings, pallets, furniture) 2,682
Subtotal 11,483
Distribution, Transportation and Other
Wood products wholesalers 2,369
Paper products wholesalers 762
Transportation of logs, chips, goods 4,670
Other (biomass electric power, airport operations, marine cargo handling, etc.) 286
Subtotal 8,087
TOTAL 61,010
Oregon’s forest sector jobs - 2015 8
317 SW Sixth Ave., Ste 400 Portland, OR 97204-1705 971-673-2944
OregonForests.org
Follow OFRI on Facebook and Twitter
© 2017 Oregon Forest Resources Institute