Embed Size (px)
Citation preview
Oregon Basin Outlook Report April 1, 2017
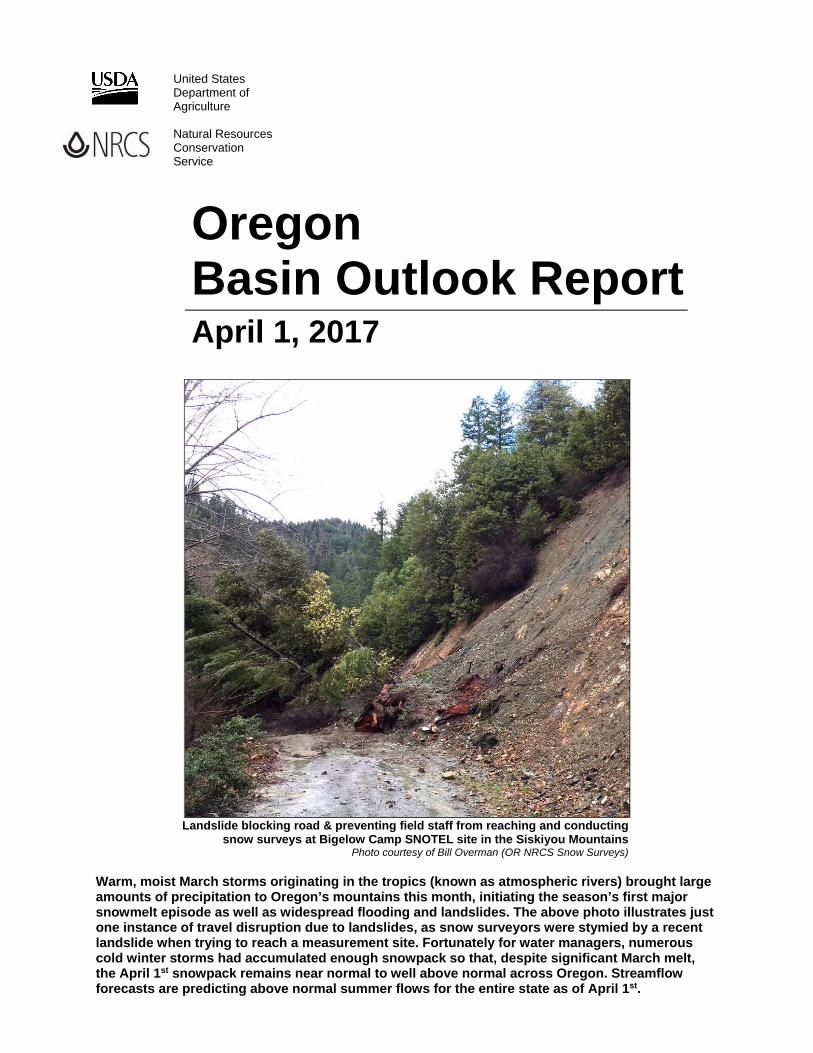
Landslide blocking road & preventing field staff from reaching and conducting snow surveys at Bigelow Camp SNOTEL site in the Siskiyou Mountains
Photo courtesy of Bill Overman (OR NRCS Snow Surveys)
Warm, moist March storms originating in the tropics (known as atmospheric rivers) brought large amounts of precipitation to Oregon’s mountains this month, initiating the season’s first major snowmelt episode as well as widespread flooding and landslides. The above photo illustrates just one instance of travel disruption due to landslides, as snow surveyors were stymied by a recent landslide when trying to reach a measurement site. Fortunately for water managers, numerous cold winter storms had accumulated enough snowpack so that, despite significant March melt, the April 1st snowpack remains near normal to well above normal across Oregon. Streamflow forecasts are predicting above normal summer flows for the entire state as of April 1st.
United States Department of Agriculture Natural Resources Conservation Service
In accordance with Federal civil rights law and U.S. Department of Agriculture (USDA) civil rights regulations and policies, the USDA, its Agencies, offices, and employees, and institutions participating in or administering USDA programs are prohibited from discriminating based on race, color, national origin, religion, sex, gender identity (including gender expression), sexual orientation, disability, age, marital status, family/parental status, income derived from a public assistance program, political beliefs, or reprisal or retaliation for prior civil rights activity, in any program or activity conducted or funded by USDA (not all bases apply to all programs). Remedies and complaint filing deadlines vary by program or incident. Persons with disabilities who require alternative means of communication for program information (e.g., Braille, large print, audiotape, American Sign Language, etc.) should contact the responsible Agency or USDA's TARGET Center at (202) 720-2600 (voice and TTY) or contact USDA through the Federal Relay Service at (800) 877-8339. Additionally, program information may be made available in languages other than English. USDA is an equal opportunity provider and employer.
Contents
General Outlook .......................................................................................................................... 1
Owyhee and Malheur Basins ..................................................................................................... 4
Grande Ronde, Powder, Burnt and Imnaha Basins ................................................................. 7
Umatilla, Walla Walla, and Willow Basins ............................................................................... 10
John Day Basin ......................................................................................................................... 12
Upper Deschutes and Crooked Basins ................................................................................... 14
Hood, Sandy, and Lower Deschutes Basins .......................................................................... 17
Willamette Basin ....................................................................................................................... 19
Rogue and Umpqua Basins ..................................................................................................... 22
Klamath Basin ........................................................................................................................... 25
Lake County and Goose Lake .................................................................................................. 28
Harney Basin ............................................................................................................................. 30
Recession Forecasts for Oregon ............................................................................................ 32
Basin Outlook Reports: How Forecasts Are Made ................................................................ 34
Interpreting Water Supply Forecasts ...................................................................................... 35
Interpreting Snowpack Plots ................................................................................................... 36
General Outlook April 1st, 2017
SUMMARY
Oregon’s wintry weather pivoted abruptly to spring conditions during March. The middle of
March brought warm mountain temperatures and heavy rainfall that instigated significant
snowmelt throughout all but the highest elevations of Oregon. Precipitation for the month was
above average throughout the state, and for the first time this winter, significant amounts fell as
rain instead of snow in the mountains. However, the abundant snowpack provided by previous
winter storms proved its resilience, and as of April 1st, snowpack conditions remain near normal
in southeastern Oregon and well above normal throughout the rest of the state.
Given current snowpack conditions, streamflow forecasts across the state are calling for above
average to well above average streamflows for the summer water supply season. Most of
Oregon’s major irrigation reservoirs are storing average to above average amounts of water as
of the end of March. As long as abnormally warm temperatures and rapid snowmelt are kept at
bay, Oregon will be in store for a good water year. Additionally, the drought monitor is showing
Oregon in a drought-free status for the first time since 2011: http://droughtmonitor.unl.edu/.
SNOWPACK
Significant snowmelt was the dominant story for most snowpack measurement sites this month.
While snowmelt is normal during March, especially in the lower elevations, the warm mountain
rainfall accelerated snowmelt rates. The most notable amounts of snowmelt occurred in eastern
Oregon, where some sites lost over twice the normal amount during the month. The heavy rain
in the mountains and warm temperatures were in stark contrast to the previous three months of
cold temperatures and above normal snow accumulation. Prior to recent snowmelt, most
Oregon SNOTEL sites had surpassed (or well surpassed) their normal annual peak snow
amounts and were recording a well above normal snowpack. Winter’s surplus of snow
compensated for the snowmelt and has left behind an above normal statewide snowpack as of
April 1st.
While winter brought a consistent snow accumulation trend to Oregon, springtime has unveiled
the variable snowpack conditions within each basin. In eastern Oregon, the snow at many of the
lower elevation sites has melted quickly and levels have dipped slightly below normal as of April
1st, while snowpacks in a few places like the Wallowa, Ochoco, and Elkhorn Mountains are
holding onto significantly higher than normal amounts of snow. By contrast, in western Oregon,
many sites in the lower elevations of the Cascade Mountains are hanging on to a higher percent
of normal snowpack than the higher elevation sites. Even with the variable snow conditions, the
snowpack in the state ranges from 99% of normal in the Owyhee and Malheur basins to 137%
of normal in the Willamette basin on April 1st. Grouping together all 81 SNOTEL sites in the
state, the April 1st snowpack for Oregon is 126% of normal, which is significantly higher than last
year at this time when it was only 101% of normal. The statewide snowpack conditions haven’t
been well above normal since 2012 when the April 1st snowpack for Oregon was 120% of
normal.
PRECIPITATION While the last few winter months brought mostly cold, wintry storms to the mountains, mid-March brought several warm and moisture-laden atmospheric river storm events which originated in the tropics. While not the first of their kind this winter, these particular storms caused the first significant statewide snowmelt of the season. Precipitation for the entire month was well above average and brought double the usual amount at some sites. Eleven SNOTEL sites broke records for the highest or second highest March precipitation. The lowest amounts of March precipitation fell in southeastern Oregon at 136% of average in the Owyhee and Malheur basins and in the Lake County region. The wettest region in March was in the Hood, Sandy and Lower Deschutes, where 186% of average amounts fell.
It has no doubt been a wet winter and all basins have experienced well above average precipitation since the water year began on October 1st. Sixteen SNOTEL sites broke records for the highest or second highest water year-to-date precipitation. Basin precipitation totals for the water year range from 121% of average in the Hood, Sandy and Lower Deschutes basins up to 151% of average for the Rogue and Umpqua basins. The Rogue, Umpqua, Klamath and Goose Lake basins have already surpassed the usual amount of precipitation that falls in an entire water year and the rest of the state is not too far behind.
RESERVOIRS A wetter than normal March in all basins compounded by low elevation snowmelt across much of the state provided reservoir operators with ample amounts of water to manage. As of the end of March, reservoir storage in almost all basins in Oregon is at or above normal levels for this time of year. The largest reservoir in the state, Lake Owyhee, is storing 136% of average amounts of water as of the end of March, which is the first time since 2012 the lake has been above normal on April 1st.
STREAMFLOW The flush of snowmelt and heavy rainfall caused Oregon’s streams and rivers to flow well above average for the month. Many rivers crested above the flood stage as a result of too much water all at once. With no shortage of recent precipitation and the mountains hanging on to near normal to above normal snowpack as of April 1st, all streamflow forecasts in Oregon are calling for above average to well above average streamflows for the water supply season. The final determining factors will be springtime temperatures and snowmelt rates. Ideally, temperatures will remain cool in the mountains to preserve and slowly melt the snowpack, naturally sustaining streamflows throughout the season.
To accompany the new forecast summary graphic, here are some helpful reminders about interpreting streamflow forecasts published in this document. For each forecast point, 5 possible streamflow volumes are predicted. Where the observed streamflow occurs within this spectrum depends on the range of future weather conditions. If water users wish to plan conservatively, they may lean toward using the 70% chance of exceedance forecast, or the drier forecast (which may be below average depending on the region). Conversely, if a water user believes future conditions will provide more water to the system, they could choose to use the 30% chance of exceedance forecast (the wetter forecast). These arrays of forecasts are shown in the chart on the following page and explained in more detail on page 35.
2
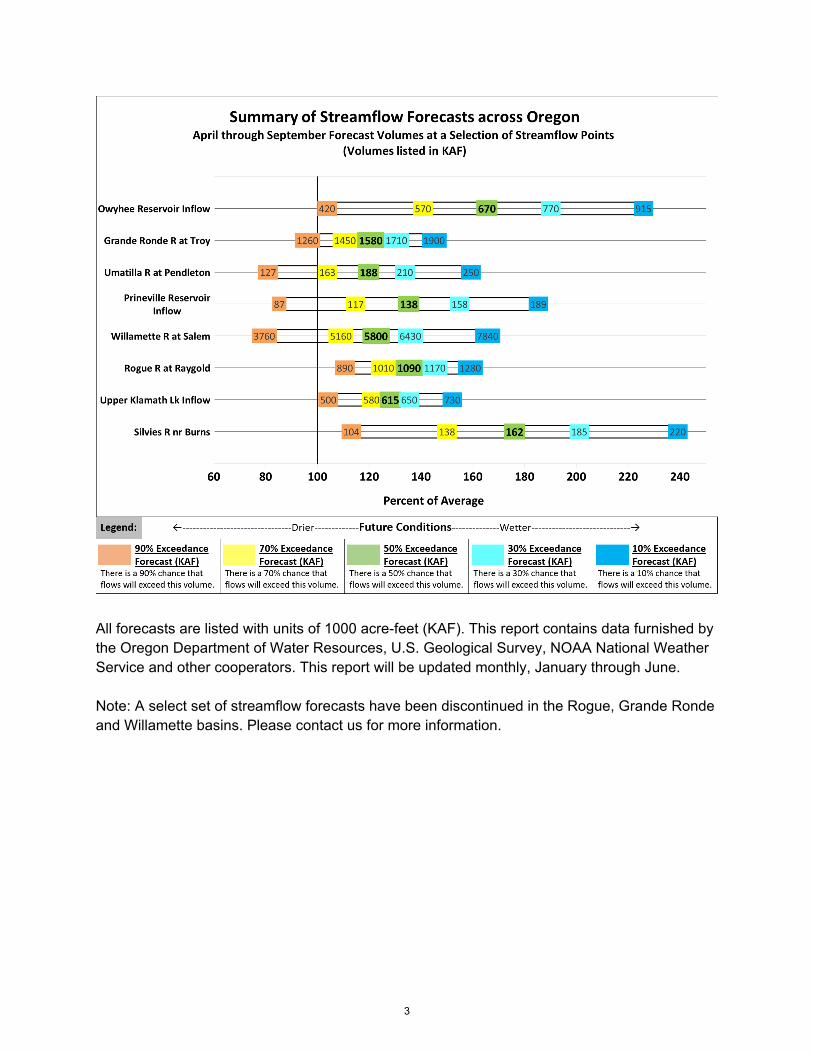
All forecasts are listed with units of 1000 acre-feet (KAF). This report contains data furnished by the Oregon Department of Water Resources, U.S. Geological Survey, NOAA National Weather Service and other cooperators. This report will be updated monthly, January through June.
Note: A select set of streamflow forecasts have been discontinued in the Rogue, Grande Ronde and Willamette basins. Please contact us for more information.
3
Owyhee and Malheur BasinsApril 1, 2017
Summary of Water Supply Conditions
SNOWPACK
PRECIPITATION
RESERVOIR
STREAMFLOW FORECAST
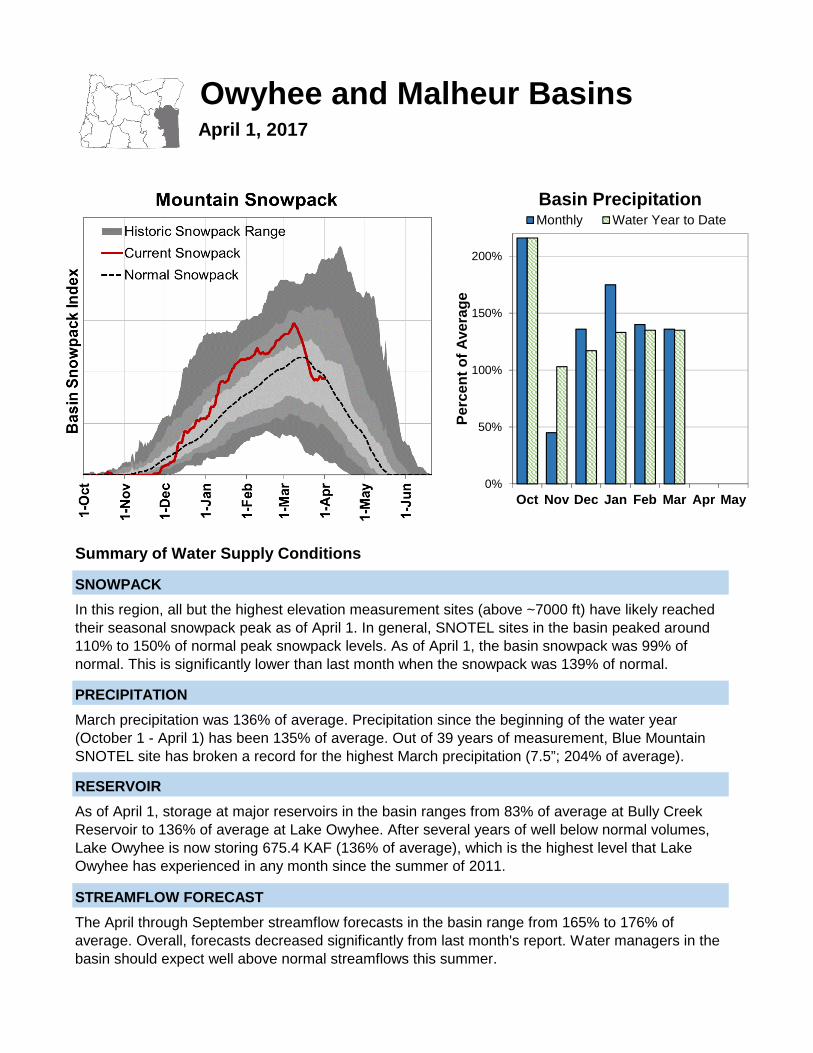
In this region, all but the highest elevation measurement sites (above ~7000 ft) have likely reached
their seasonal snowpack peak as of April 1. In general, SNOTEL sites in the basin peaked around
110% to 150% of normal peak snowpack levels. As of April 1, the basin snowpack was 99% of
normal. This is significantly lower than last month when the snowpack was 139% of normal.
March precipitation was 136% of average. Precipitation since the beginning of the water year
(October 1 - April 1) has been 135% of average. Out of 39 years of measurement, Blue Mountain
SNOTEL site has broken a record for the highest March precipitation (7.5”; 204% of average).
As of April 1, storage at major reservoirs in the basin ranges from 83% of average at Bully Creek
Reservoir to 136% of average at Lake Owyhee. After several years of well below normal volumes,
Lake Owyhee is now storing 675.4 KAF (136% of average), which is the highest level that Lake
Owyhee has experienced in any month since the summer of 2011.
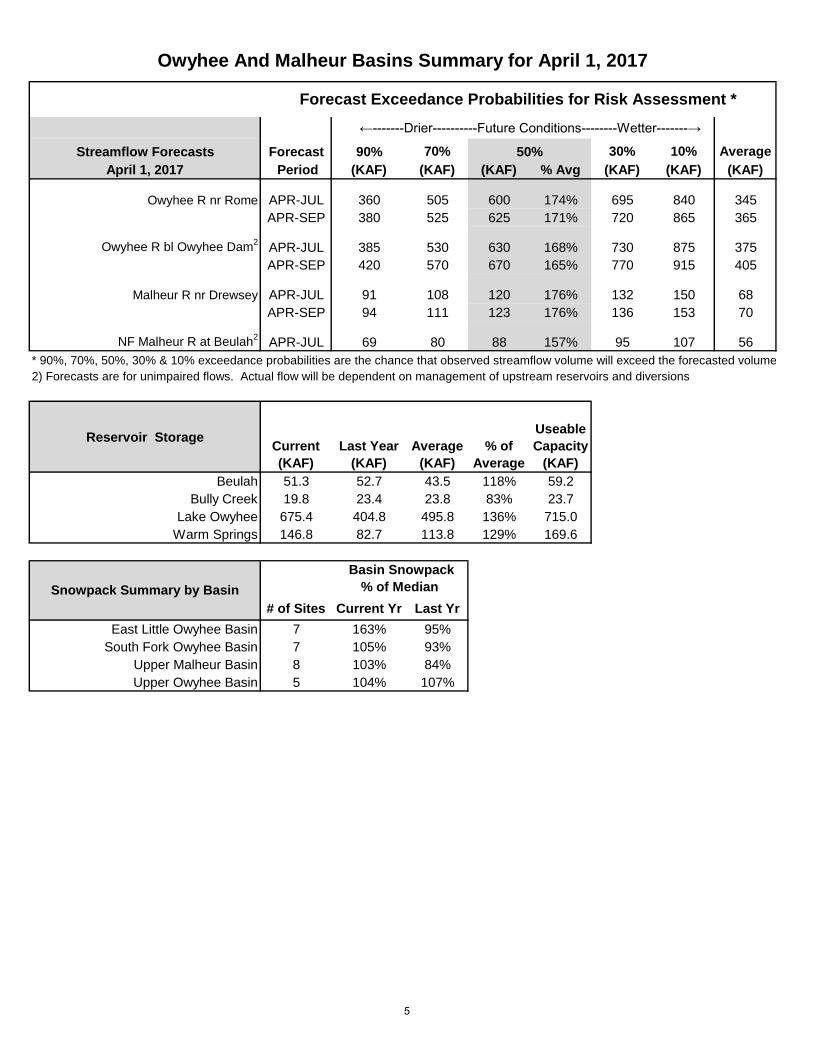
The April through September streamflow forecasts in the basin range from 165% to 176% of
average. Overall, forecasts decreased significantly from last month's report. Water managers in the
basin should expect well above normal streamflows this summer.
0%
50%
100%
150%
200%
Oct Nov Dec Jan Feb Mar Apr May
Perc
en
t o
f A
vera
ge
Basin PrecipitationMonthly Water Year to Date
←-------Drier----------Future Conditions--------Wetter-------→
Streamflow Forecasts Forecast 90% 70% 30% 10% Average
April 1, 2017 Period (KAF) (KAF) (KAF) % Avg (KAF) (KAF) (KAF)
Owyhee R nr Rome APR-JUL 360 505 600 174% 695 840 345
APR-SEP 380 525 625 171% 720 865 365
Owyhee R bl Owyhee Dam2
APR-JUL 385 530 630 168% 730 875 375
APR-SEP 420 570 670 165% 770 915 405
Malheur R nr Drewsey APR-JUL 91 108 120 176% 132 150 68
APR-SEP 94 111 123 176% 136 153 70
NF Malheur R at Beulah2
APR-JUL 69 80 88 157% 95 107 56
* 90%, 70%, 50%, 30% & 10% exceedance probabilities are the chance that observed streamflow volume will exceed the forecasted volume
2) Forecasts are for unimpaired flows. Actual flow will be dependent on management of upstream reservoirs and diversions
Reservoir StorageCurrent
(KAF)
Last Year
(KAF)
Average
(KAF)
% of
Average
Useable
Capacity
(KAF)
Beulah 51.3 52.7 43.5 118% 59.2
Bully Creek 19.8 23.4 23.8 83% 23.7
Lake Owyhee 675.4 404.8 495.8 136% 715.0
Warm Springs 146.8 82.7 113.8 129% 169.6
# of Sites Current Yr Last Yr
East Little Owyhee Basin 7 163% 95%
South Fork Owyhee Basin 7 105% 93%
Upper Malheur Basin 8 103% 84%
Upper Owyhee Basin 5 104% 107%
Owyhee And Malheur Basins Summary for April 1, 2017
Forecast Exceedance Probabilities for Risk Assessment *
50%
Snowpack Summary by Basin
Basin Snowpack
% of Median
5
Elevation
(ft)
Date
Measured
Snow
Depth
(in)
Current
SWE
Last Yr
SWE Median
% of
Median
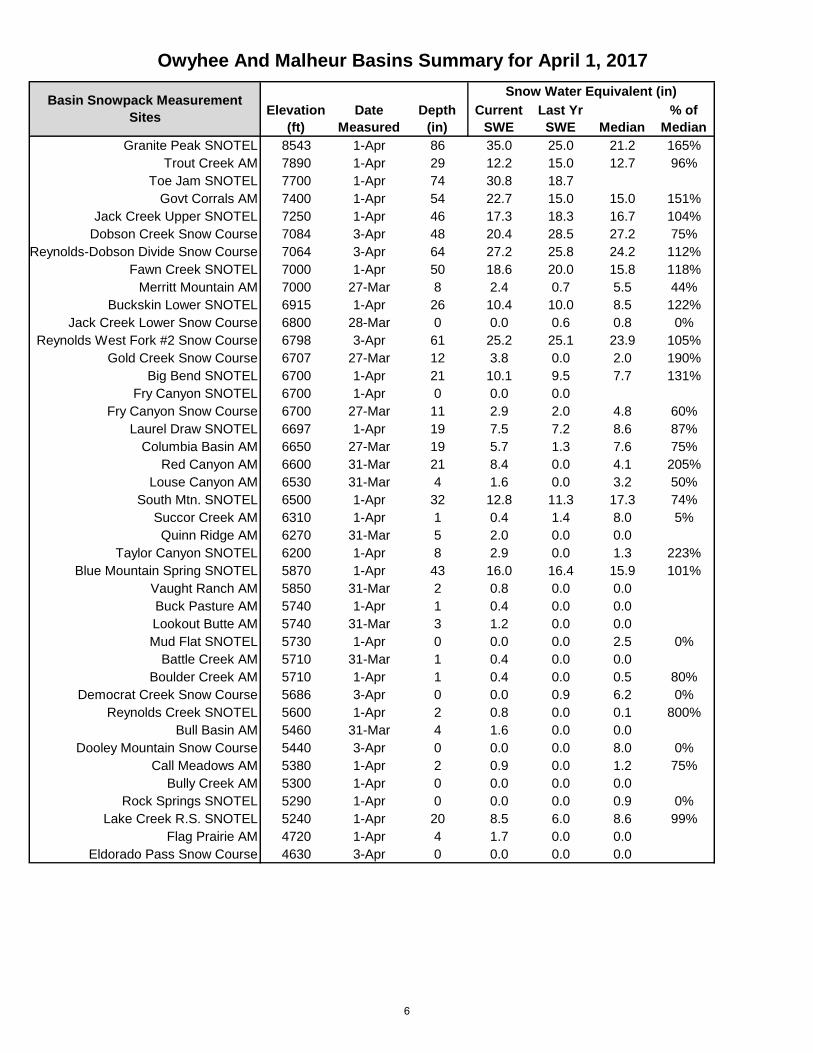
Granite Peak SNOTEL 8543 1-Apr 86 35.0 25.0 21.2 165%
Trout Creek AM 7890 1-Apr 29 12.2 15.0 12.7 96%
Toe Jam SNOTEL 7700 1-Apr 74 30.8 18.7
Govt Corrals AM 7400 1-Apr 54 22.7 15.0 15.0 151%
Jack Creek Upper SNOTEL 7250 1-Apr 46 17.3 18.3 16.7 104%
Dobson Creek Snow Course 7084 3-Apr 48 20.4 28.5 27.2 75%
Reynolds-Dobson Divide Snow Course 7064 3-Apr 64 27.2 25.8 24.2 112%
Fawn Creek SNOTEL 7000 1-Apr 50 18.6 20.0 15.8 118%
Merritt Mountain AM 7000 27-Mar 8 2.4 0.7 5.5 44%
Buckskin Lower SNOTEL 6915 1-Apr 26 10.4 10.0 8.5 122%
Jack Creek Lower Snow Course 6800 28-Mar 0 0.0 0.6 0.8 0%
Reynolds West Fork #2 Snow Course 6798 3-Apr 61 25.2 25.1 23.9 105%
Gold Creek Snow Course 6707 27-Mar 12 3.8 0.0 2.0 190%
Big Bend SNOTEL 6700 1-Apr 21 10.1 9.5 7.7 131%
Fry Canyon SNOTEL 6700 1-Apr 0 0.0 0.0
Fry Canyon Snow Course 6700 27-Mar 11 2.9 2.0 4.8 60%
Laurel Draw SNOTEL 6697 1-Apr 19 7.5 7.2 8.6 87%
Columbia Basin AM 6650 27-Mar 19 5.7 1.3 7.6 75%
Red Canyon AM 6600 31-Mar 21 8.4 0.0 4.1 205%
Louse Canyon AM 6530 31-Mar 4 1.6 0.0 3.2 50%
South Mtn. SNOTEL 6500 1-Apr 32 12.8 11.3 17.3 74%
Succor Creek AM 6310 1-Apr 1 0.4 1.4 8.0 5%
Quinn Ridge AM 6270 31-Mar 5 2.0 0.0 0.0
Taylor Canyon SNOTEL 6200 1-Apr 8 2.9 0.0 1.3 223%
Blue Mountain Spring SNOTEL 5870 1-Apr 43 16.0 16.4 15.9 101%
Vaught Ranch AM 5850 31-Mar 2 0.8 0.0 0.0
Buck Pasture AM 5740 1-Apr 1 0.4 0.0 0.0
Lookout Butte AM 5740 31-Mar 3 1.2 0.0 0.0
Mud Flat SNOTEL 5730 1-Apr 0 0.0 0.0 2.5 0%
Battle Creek AM 5710 31-Mar 1 0.4 0.0 0.0
Boulder Creek AM 5710 1-Apr 1 0.4 0.0 0.5 80%
Democrat Creek Snow Course 5686 3-Apr 0 0.0 0.9 6.2 0%
Reynolds Creek SNOTEL 5600 1-Apr 2 0.8 0.0 0.1 800%
Bull Basin AM 5460 31-Mar 4 1.6 0.0 0.0
Dooley Mountain Snow Course 5440 3-Apr 0 0.0 0.0 8.0 0%
Call Meadows AM 5380 1-Apr 2 0.9 0.0 1.2 75%
Bully Creek AM 5300 1-Apr 0 0.0 0.0 0.0
Rock Springs SNOTEL 5290 1-Apr 0 0.0 0.0 0.9 0%
Lake Creek R.S. SNOTEL 5240 1-Apr 20 8.5 6.0 8.6 99%
Flag Prairie AM 4720 1-Apr 4 1.7 0.0 0.0
Eldorado Pass Snow Course 4630 3-Apr 0 0.0 0.0 0.0
Basin Snowpack Measurement
Sites
Snow Water Equivalent (in)
Owyhee And Malheur Basins Summary for April 1, 2017
6
April 1, 2017
Summary of Water Supply Conditions
SNOWPACK
PRECIPITATION
RESERVOIR
STREAMFLOW FORECAST
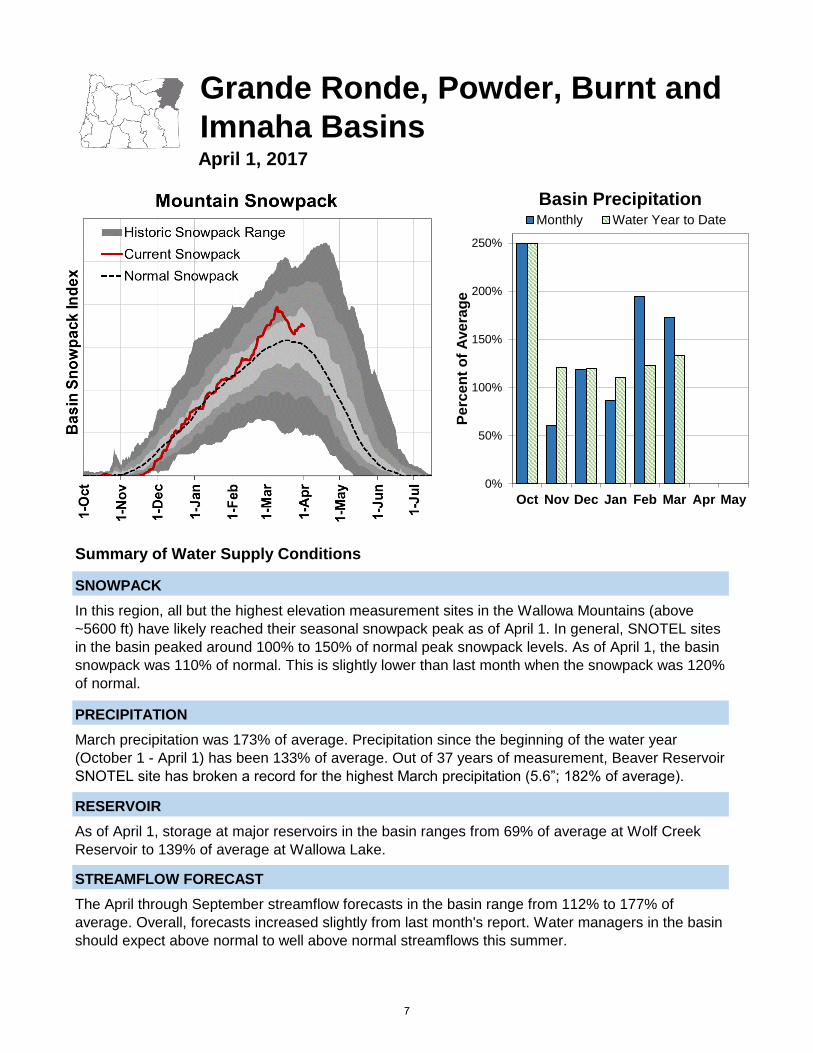
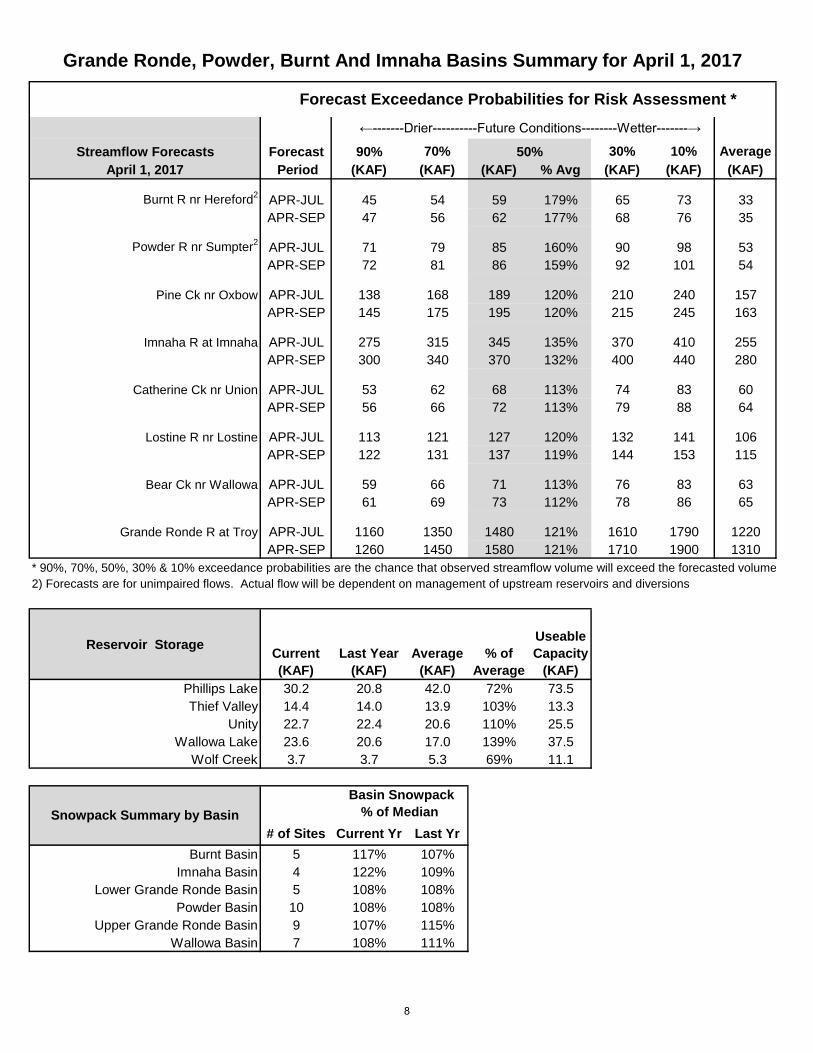
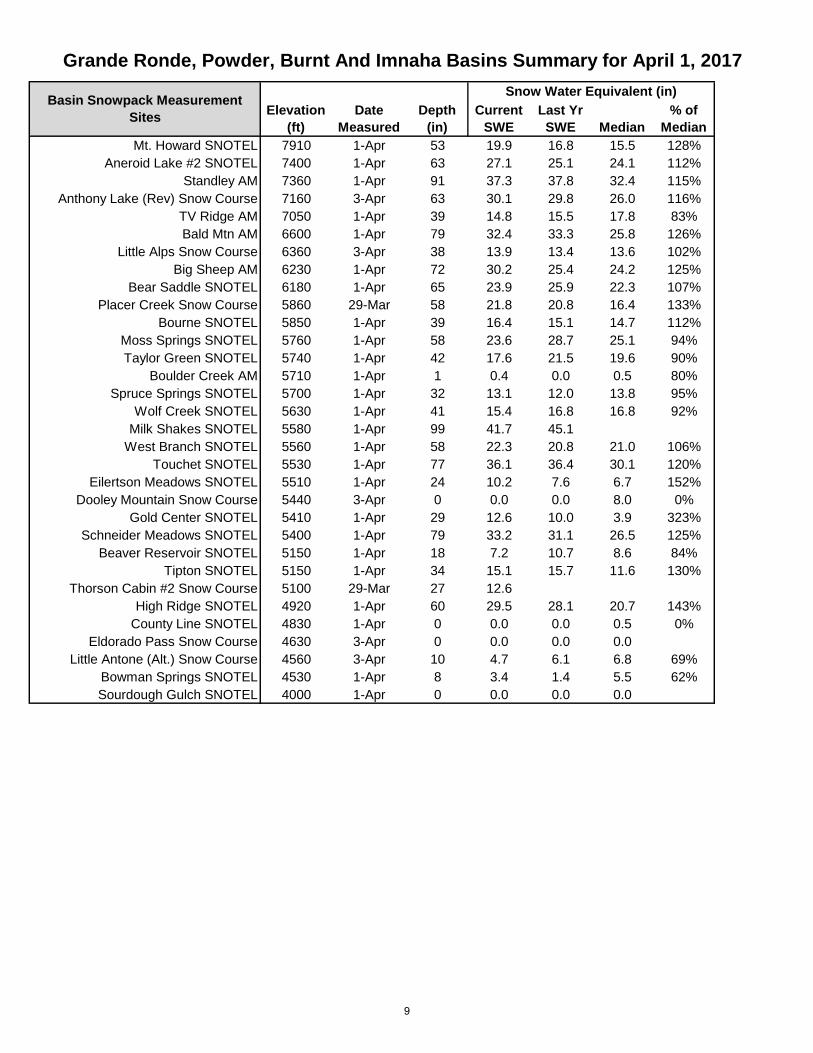
In this region, all but the highest elevation measurement sites in the Wallowa Mountains (above
~5600 ft) have likely reached their seasonal snowpack peak as of April 1. In general, SNOTEL sites
in the basin peaked around 100% to 150% of normal peak snowpack levels. As of April 1, the basin
snowpack was 110% of normal. This is slightly lower than last month when the snowpack was 120%
of normal.
March precipitation was 173% of average. Precipitation since the beginning of the water year
(October 1 - April 1) has been 133% of average. Out of 37 years of measurement, Beaver Reservoir
SNOTEL site has broken a record for the highest March precipitation (5.6”; 182% of average).
As of April 1, storage at major reservoirs in the basin ranges from 69% of average at Wolf Creek
Reservoir to 139% of average at Wallowa Lake.
The April through September streamflow forecasts in the basin range from 112% to 177% of
average. Overall, forecasts increased slightly from last month's report. Water managers in the basin
should expect above normal to well above normal streamflows this summer.
Grande Ronde, Powder, Burnt and
Imnaha Basins
0%
50%
100%
150%
200%
250%
Oct Nov Dec Jan Feb Mar Apr May
Pe
rce
nt
of
Ave
rag
e
Basin PrecipitationMonthly Water Year to Date
7
←-------Drier----------Future Conditions--------Wetter-------→
Streamflow Forecasts Forecast 90% 70% 30% 10% Average
April 1, 2017 Period (KAF) (KAF) (KAF) % Avg (KAF) (KAF) (KAF)
Burnt R nr Hereford2
APR-JUL 45 54 59 179% 65 73 33
APR-SEP 47 56 62 177% 68 76 35
Powder R nr Sumpter2
APR-JUL 71 79 85 160% 90 98 53
APR-SEP 72 81 86 159% 92 101 54
Pine Ck nr Oxbow APR-JUL 138 168 189 120% 210 240 157
APR-SEP 145 175 195 120% 215 245 163
Imnaha R at Imnaha APR-JUL 275 315 345 135% 370 410 255
APR-SEP 300 340 370 132% 400 440 280
Catherine Ck nr Union APR-JUL 53 62 68 113% 74 83 60
APR-SEP 56 66 72 113% 79 88 64
Lostine R nr Lostine APR-JUL 113 121 127 120% 132 141 106
APR-SEP 122 131 137 119% 144 153 115
Bear Ck nr Wallowa APR-JUL 59 66 71 113% 76 83 63
APR-SEP 61 69 73 112% 78 86 65
Grande Ronde R at Troy APR-JUL 1160 1350 1480 121% 1610 1790 1220
APR-SEP 1260 1450 1580 121% 1710 1900 1310
* 90%, 70%, 50%, 30% & 10% exceedance probabilities are the chance that observed streamflow volume will exceed the forecasted volume
2) Forecasts are for unimpaired flows. Actual flow will be dependent on management of upstream reservoirs and diversions
Reservoir StorageCurrent
(KAF)
Last Year
(KAF)
Average
(KAF)
% of
Average
Useable
Capacity
(KAF)
Phillips Lake 30.2 20.8 42.0 72% 73.5
Thief Valley 14.4 14.0 13.9 103% 13.3
Unity 22.7 22.4 20.6 110% 25.5
Wallowa Lake 23.6 20.6 17.0 139% 37.5
Wolf Creek 3.7 3.7 5.3 69% 11.1
# of Sites Current Yr Last Yr
Burnt Basin 5 117% 107%
Imnaha Basin 4 122% 109%
Lower Grande Ronde Basin 5 108% 108%
Powder Basin 10 108% 108%
Upper Grande Ronde Basin 9 107% 115%
Wallowa Basin 7 108% 111%
Grande Ronde, Powder, Burnt And Imnaha Basins Summary for April 1, 2017
Forecast Exceedance Probabilities for Risk Assessment *
50%
Snowpack Summary by Basin
Basin Snowpack
% of Median
8
Elevation
(ft)
Date
Measured
Snow
Depth
(in)
Current
SWE
Last Yr
SWE Median
% of
Median
Mt. Howard SNOTEL 7910 1-Apr 53 19.9 16.8 15.5 128%
Aneroid Lake #2 SNOTEL 7400 1-Apr 63 27.1 25.1 24.1 112%
Standley AM 7360 1-Apr 91 37.3 37.8 32.4 115%
Anthony Lake (Rev) Snow Course 7160 3-Apr 63 30.1 29.8 26.0 116%
TV Ridge AM 7050 1-Apr 39 14.8 15.5 17.8 83%
Bald Mtn AM 6600 1-Apr 79 32.4 33.3 25.8 126%
Little Alps Snow Course 6360 3-Apr 38 13.9 13.4 13.6 102%
Big Sheep AM 6230 1-Apr 72 30.2 25.4 24.2 125%
Bear Saddle SNOTEL 6180 1-Apr 65 23.9 25.9 22.3 107%
Placer Creek Snow Course 5860 29-Mar 58 21.8 20.8 16.4 133%
Bourne SNOTEL 5850 1-Apr 39 16.4 15.1 14.7 112%
Moss Springs SNOTEL 5760 1-Apr 58 23.6 28.7 25.1 94%
Taylor Green SNOTEL 5740 1-Apr 42 17.6 21.5 19.6 90%
Boulder Creek AM 5710 1-Apr 1 0.4 0.0 0.5 80%
Spruce Springs SNOTEL 5700 1-Apr 32 13.1 12.0 13.8 95%
Wolf Creek SNOTEL 5630 1-Apr 41 15.4 16.8 16.8 92%
Milk Shakes SNOTEL 5580 1-Apr 99 41.7 45.1
West Branch SNOTEL 5560 1-Apr 58 22.3 20.8 21.0 106%
Touchet SNOTEL 5530 1-Apr 77 36.1 36.4 30.1 120%
Eilertson Meadows SNOTEL 5510 1-Apr 24 10.2 7.6 6.7 152%
Dooley Mountain Snow Course 5440 3-Apr 0 0.0 0.0 8.0 0%
Gold Center SNOTEL 5410 1-Apr 29 12.6 10.0 3.9 323%
Schneider Meadows SNOTEL 5400 1-Apr 79 33.2 31.1 26.5 125%
Beaver Reservoir SNOTEL 5150 1-Apr 18 7.2 10.7 8.6 84%
Tipton SNOTEL 5150 1-Apr 34 15.1 15.7 11.6 130%
Thorson Cabin #2 Snow Course 5100 29-Mar 27 12.6
High Ridge SNOTEL 4920 1-Apr 60 29.5 28.1 20.7 143%
County Line SNOTEL 4830 1-Apr 0 0.0 0.0 0.5 0%
Eldorado Pass Snow Course 4630 3-Apr 0 0.0 0.0 0.0
Little Antone (Alt.) Snow Course 4560 3-Apr 10 4.7 6.1 6.8 69%
Bowman Springs SNOTEL 4530 1-Apr 8 3.4 1.4 5.5 62%
Sourdough Gulch SNOTEL 4000 1-Apr 0 0.0 0.0 0.0
Basin Snowpack Measurement
Sites
Snow Water Equivalent (in)
Grande Ronde, Powder, Burnt And Imnaha Basins Summary for April 1, 2017
9
April 1, 2017
Summary of Water Supply Conditions
SNOWPACK
PRECIPITATION
RESERVOIR
STREAMFLOW FORECAST
Umatilla, Walla Walla and Willow
Basins
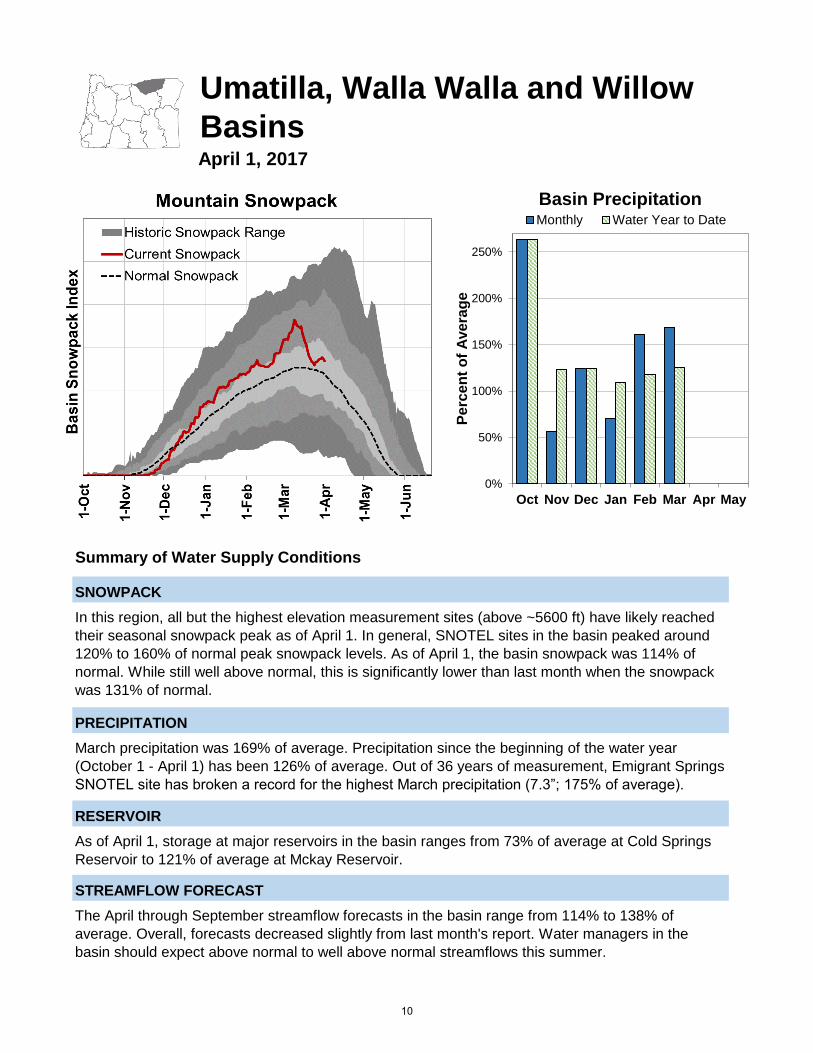
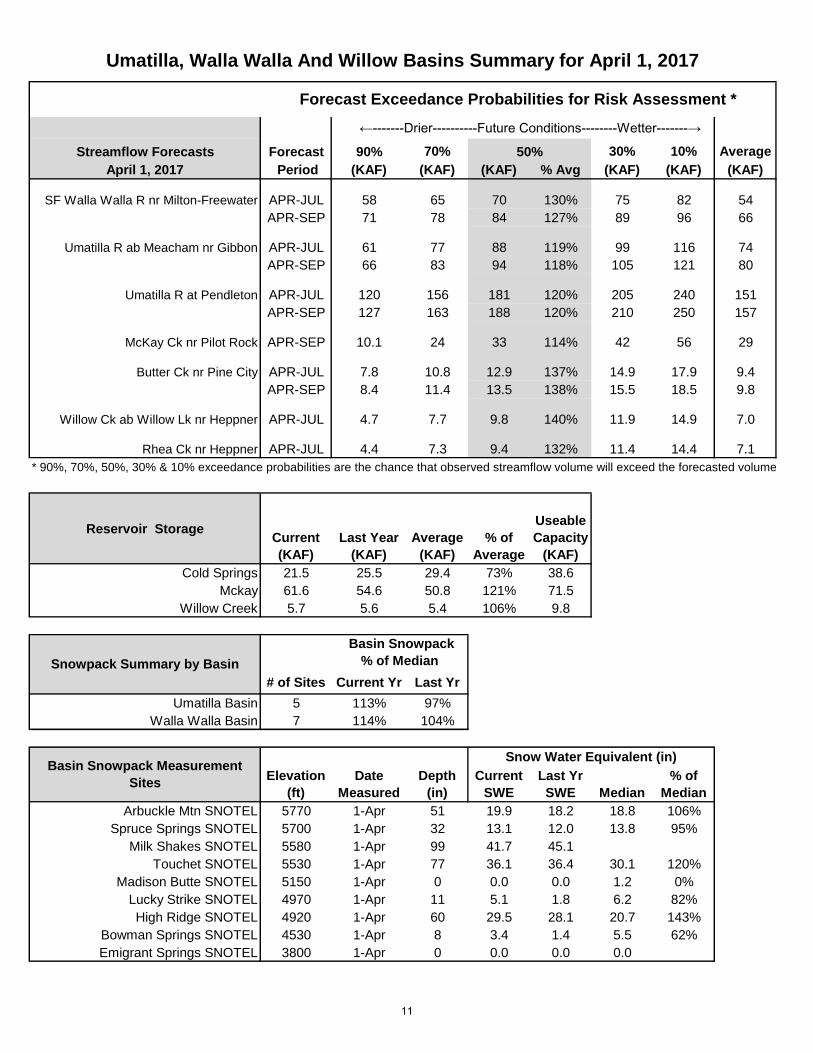
In this region, all but the highest elevation measurement sites (above ~5600 ft) have likely reached
their seasonal snowpack peak as of April 1. In general, SNOTEL sites in the basin peaked around
120% to 160% of normal peak snowpack levels. As of April 1, the basin snowpack was 114% of
normal. While still well above normal, this is significantly lower than last month when the snowpack
was 131% of normal.
March precipitation was 169% of average. Precipitation since the beginning of the water year
(October 1 - April 1) has been 126% of average. Out of 36 years of measurement, Emigrant Springs
SNOTEL site has broken a record for the highest March precipitation (7.3”; 175% of average).
As of April 1, storage at major reservoirs in the basin ranges from 73% of average at Cold Springs
Reservoir to 121% of average at Mckay Reservoir.
The April through September streamflow forecasts in the basin range from 114% to 138% of
average. Overall, forecasts decreased slightly from last month's report. Water managers in the
basin should expect above normal to well above normal streamflows this summer.
0%
50%
100%
150%
200%
250%
Oct Nov Dec Jan Feb Mar Apr May
Pe
rce
nt
of
Ave
rag
e
Basin PrecipitationMonthly Water Year to Date
10
←-------Drier----------Future Conditions--------Wetter-------→
Streamflow Forecasts Forecast 90% 70% 30% 10% Average
April 1, 2017 Period (KAF) (KAF) (KAF) % Avg (KAF) (KAF) (KAF)
SF Walla Walla R nr Milton-Freewater APR-JUL 58 65 70 130% 75 82 54
APR-SEP 71 78 84 127% 89 96 66
Umatilla R ab Meacham nr Gibbon APR-JUL 61 77 88 119% 99 116 74
APR-SEP 66 83 94 118% 105 121 80
Umatilla R at Pendleton APR-JUL 120 156 181 120% 205 240 151
APR-SEP 127 163 188 120% 210 250 157
McKay Ck nr Pilot Rock APR-SEP 10.1 24 33 114% 42 56 29
Butter Ck nr Pine City APR-JUL 7.8 10.8 12.9 137% 14.9 17.9 9.4
APR-SEP 8.4 11.4 13.5 138% 15.5 18.5 9.8
Willow Ck ab Willow Lk nr Heppner APR-JUL 4.7 7.7 9.8 140% 11.9 14.9 7.0
Rhea Ck nr Heppner APR-JUL 4.4 7.3 9.4 132% 11.4 14.4 7.1
* 90%, 70%, 50%, 30% & 10% exceedance probabilities are the chance that observed streamflow volume will exceed the forecasted volume
Reservoir StorageCurrent
(KAF)
Last Year
(KAF)
Average
(KAF)
% of
Average
Useable
Capacity
(KAF)
Cold Springs 21.5 25.5 29.4 73% 38.6
Mckay 61.6 54.6 50.8 121% 71.5
Willow Creek 5.7 5.6 5.4 106% 9.8
# of Sites Current Yr Last Yr
Umatilla Basin 5 113% 97%
Walla Walla Basin 7 114% 104%
Elevation
(ft)
Date
Measured
Snow
Depth
(in)
Current
SWE
Last Yr
SWE Median
% of
Median
Arbuckle Mtn SNOTEL 5770 1-Apr 51 19.9 18.2 18.8 106%
Spruce Springs SNOTEL 5700 1-Apr 32 13.1 12.0 13.8 95%
Milk Shakes SNOTEL 5580 1-Apr 99 41.7 45.1
Touchet SNOTEL 5530 1-Apr 77 36.1 36.4 30.1 120%
Madison Butte SNOTEL 5150 1-Apr 0 0.0 0.0 1.2 0%
Lucky Strike SNOTEL 4970 1-Apr 11 5.1 1.8 6.2 82%
High Ridge SNOTEL 4920 1-Apr 60 29.5 28.1 20.7 143%
Bowman Springs SNOTEL 4530 1-Apr 8 3.4 1.4 5.5 62%
Emigrant Springs SNOTEL 3800 1-Apr 0 0.0 0.0 0.0
Basin Snowpack Measurement
Sites
Snow Water Equivalent (in)
Umatilla, Walla Walla And Willow Basins Summary for April 1, 2017
Forecast Exceedance Probabilities for Risk Assessment *
50%
Snowpack Summary by Basin
Basin Snowpack
% of Median
11
John Day BasinApril 1, 2017
Summary of Water Supply Conditions
SNOWPACK
PRECIPITATION
STREAMFLOW FORECAST
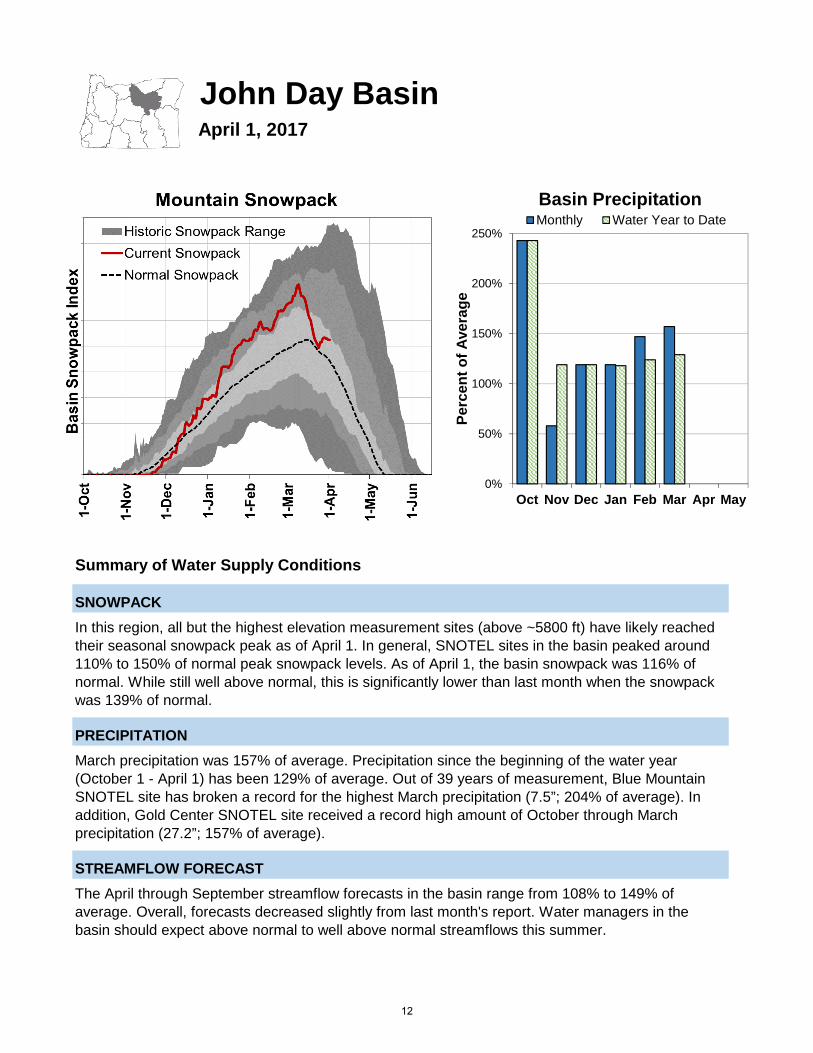
In this region, all but the highest elevation measurement sites (above ~5800 ft) have likely reached
their seasonal snowpack peak as of April 1. In general, SNOTEL sites in the basin peaked around
110% to 150% of normal peak snowpack levels. As of April 1, the basin snowpack was 116% of
normal. While still well above normal, this is significantly lower than last month when the snowpack
was 139% of normal.
March precipitation was 157% of average. Precipitation since the beginning of the water year
(October 1 - April 1) has been 129% of average. Out of 39 years of measurement, Blue Mountain
SNOTEL site has broken a record for the highest March precipitation (7.5”; 204% of average). In
addition, Gold Center SNOTEL site received a record high amount of October through March
precipitation (27.2”; 157% of average).
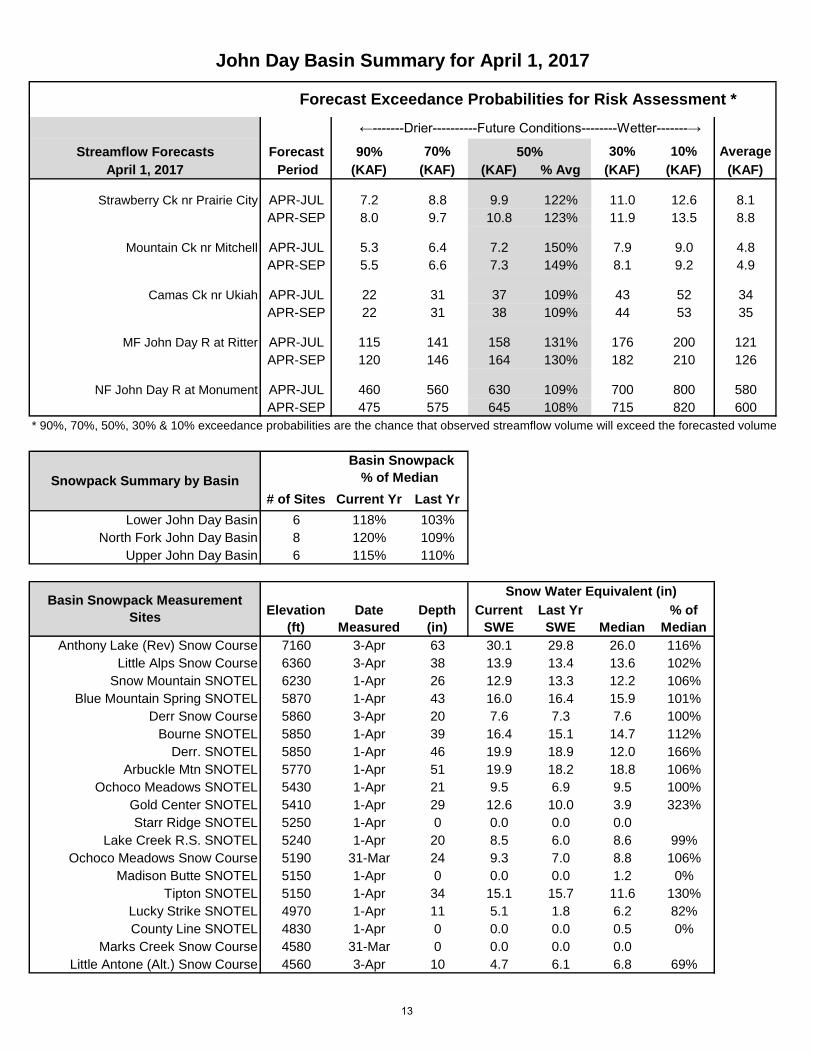
The April through September streamflow forecasts in the basin range from 108% to 149% of
average. Overall, forecasts decreased slightly from last month's report. Water managers in the
basin should expect above normal to well above normal streamflows this summer.
0%
50%
100%
150%
200%
250%
Oct Nov Dec Jan Feb Mar Apr May
Perc
en
t o
f A
vera
ge
Basin PrecipitationMonthly Water Year to Date
12
←-------Drier----------Future Conditions--------Wetter-------→
Streamflow Forecasts Forecast 90% 70% 30% 10% Average
April 1, 2017 Period (KAF) (KAF) (KAF) % Avg (KAF) (KAF) (KAF)
Strawberry Ck nr Prairie City APR-JUL 7.2 8.8 9.9 122% 11.0 12.6 8.1
APR-SEP 8.0 9.7 10.8 123% 11.9 13.5 8.8
Mountain Ck nr Mitchell APR-JUL 5.3 6.4 7.2 150% 7.9 9.0 4.8
APR-SEP 5.5 6.6 7.3 149% 8.1 9.2 4.9
Camas Ck nr Ukiah APR-JUL 22 31 37 109% 43 52 34
APR-SEP 22 31 38 109% 44 53 35
MF John Day R at Ritter APR-JUL 115 141 158 131% 176 200 121
APR-SEP 120 146 164 130% 182 210 126
NF John Day R at Monument APR-JUL 460 560 630 109% 700 800 580
APR-SEP 475 575 645 108% 715 820 600
* 90%, 70%, 50%, 30% & 10% exceedance probabilities are the chance that observed streamflow volume will exceed the forecasted volume
# of Sites Current Yr Last Yr
Lower John Day Basin 6 118% 103%
North Fork John Day Basin 8 120% 109%
Upper John Day Basin 6 115% 110%
Elevation
(ft)
Date
Measured
Snow
Depth
(in)
Current
SWE
Last Yr
SWE Median
% of
Median
Anthony Lake (Rev) Snow Course 7160 3-Apr 63 30.1 29.8 26.0 116%
Little Alps Snow Course 6360 3-Apr 38 13.9 13.4 13.6 102%
Snow Mountain SNOTEL 6230 1-Apr 26 12.9 13.3 12.2 106%
Blue Mountain Spring SNOTEL 5870 1-Apr 43 16.0 16.4 15.9 101%
Derr Snow Course 5860 3-Apr 20 7.6 7.3 7.6 100%
Bourne SNOTEL 5850 1-Apr 39 16.4 15.1 14.7 112%
Derr. SNOTEL 5850 1-Apr 46 19.9 18.9 12.0 166%
Arbuckle Mtn SNOTEL 5770 1-Apr 51 19.9 18.2 18.8 106%
Ochoco Meadows SNOTEL 5430 1-Apr 21 9.5 6.9 9.5 100%
Gold Center SNOTEL 5410 1-Apr 29 12.6 10.0 3.9 323%
Starr Ridge SNOTEL 5250 1-Apr 0 0.0 0.0 0.0
Lake Creek R.S. SNOTEL 5240 1-Apr 20 8.5 6.0 8.6 99%
Ochoco Meadows Snow Course 5190 31-Mar 24 9.3 7.0 8.8 106%
Madison Butte SNOTEL 5150 1-Apr 0 0.0 0.0 1.2 0%
Tipton SNOTEL 5150 1-Apr 34 15.1 15.7 11.6 130%
Lucky Strike SNOTEL 4970 1-Apr 11 5.1 1.8 6.2 82%
County Line SNOTEL 4830 1-Apr 0 0.0 0.0 0.5 0%
Marks Creek Snow Course 4580 31-Mar 0 0.0 0.0 0.0
Little Antone (Alt.) Snow Course 4560 3-Apr 10 4.7 6.1 6.8 69%
Basin Snowpack Measurement
Sites
Snow Water Equivalent (in)
John Day Basin Summary for April 1, 2017
Forecast Exceedance Probabilities for Risk Assessment *
50%
Snowpack Summary by Basin
Basin Snowpack
% of Median
13
April 1, 2017
Summary of Water Supply Conditions
SNOWPACK
PRECIPITATION
RESERVOIR
STREAMFLOW FORECAST
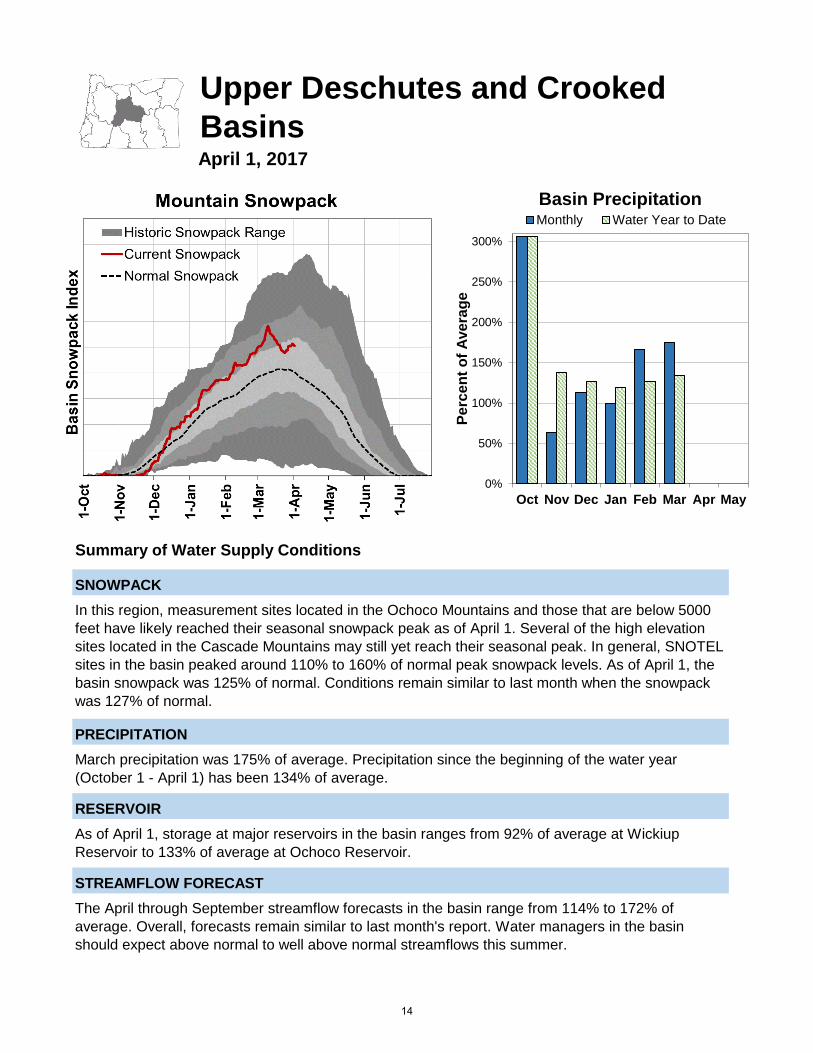
In this region, measurement sites located in the Ochoco Mountains and those that are below 5000
feet have likely reached their seasonal snowpack peak as of April 1. Several of the high elevation
sites located in the Cascade Mountains may still yet reach their seasonal peak. In general, SNOTEL
sites in the basin peaked around 110% to 160% of normal peak snowpack levels. As of April 1, the
basin snowpack was 125% of normal. Conditions remain similar to last month when the snowpack
was 127% of normal.
March precipitation was 175% of average. Precipitation since the beginning of the water year
(October 1 - April 1) has been 134% of average.
As of April 1, storage at major reservoirs in the basin ranges from 92% of average at Wickiup
Reservoir to 133% of average at Ochoco Reservoir.
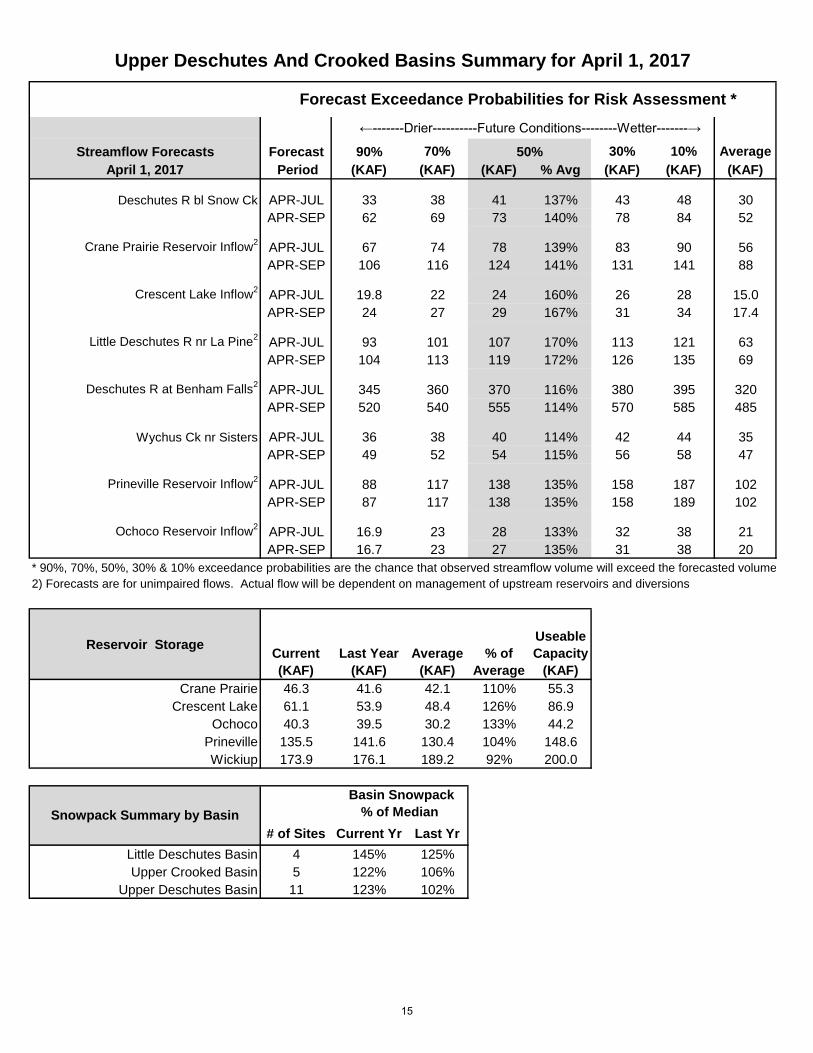
The April through September streamflow forecasts in the basin range from 114% to 172% of
average. Overall, forecasts remain similar to last month's report. Water managers in the basin
should expect above normal to well above normal streamflows this summer.
Upper Deschutes and Crooked
Basins
0%
50%
100%
150%
200%
250%
300%
Oct Nov Dec Jan Feb Mar Apr May
Pe
rce
nt
of
Ave
rag
e
Basin PrecipitationMonthly Water Year to Date
14
←-------Drier----------Future Conditions--------Wetter-------→
Streamflow Forecasts Forecast 90% 70% 30% 10% Average
April 1, 2017 Period (KAF) (KAF) (KAF) % Avg (KAF) (KAF) (KAF)
Deschutes R bl Snow Ck APR-JUL 33 38 41 137% 43 48 30
APR-SEP 62 69 73 140% 78 84 52
Crane Prairie Reservoir Inflow2
APR-JUL 67 74 78 139% 83 90 56
APR-SEP 106 116 124 141% 131 141 88
Crescent Lake Inflow2
APR-JUL 19.8 22 24 160% 26 28 15.0
APR-SEP 24 27 29 167% 31 34 17.4
Little Deschutes R nr La Pine2
APR-JUL 93 101 107 170% 113 121 63
APR-SEP 104 113 119 172% 126 135 69
Deschutes R at Benham Falls2
APR-JUL 345 360 370 116% 380 395 320
APR-SEP 520 540 555 114% 570 585 485
Wychus Ck nr Sisters APR-JUL 36 38 40 114% 42 44 35
APR-SEP 49 52 54 115% 56 58 47
Prineville Reservoir Inflow2
APR-JUL 88 117 138 135% 158 187 102
APR-SEP 87 117 138 135% 158 189 102
Ochoco Reservoir Inflow2
APR-JUL 16.9 23 28 133% 32 38 21
APR-SEP 16.7 23 27 135% 31 38 20
* 90%, 70%, 50%, 30% & 10% exceedance probabilities are the chance that observed streamflow volume will exceed the forecasted volume
2) Forecasts are for unimpaired flows. Actual flow will be dependent on management of upstream reservoirs and diversions
Reservoir StorageCurrent
(KAF)
Last Year
(KAF)
Average
(KAF)
% of
Average
Useable
Capacity
(KAF)
Crane Prairie 46.3 41.6 42.1 110% 55.3
Crescent Lake 61.1 53.9 48.4 126% 86.9
Ochoco 40.3 39.5 30.2 133% 44.2
Prineville 135.5 141.6 130.4 104% 148.6
Wickiup 173.9 176.1 189.2 92% 200.0
# of Sites Current Yr Last Yr
Little Deschutes Basin 4 145% 125%
Upper Crooked Basin 5 122% 106%
Upper Deschutes Basin 11 123% 102%
Upper Deschutes And Crooked Basins Summary for April 1, 2017
Forecast Exceedance Probabilities for Risk Assessment *
50%
Snowpack Summary by Basin
Basin Snowpack
% of Median
15
Elevation
(ft)
Date
Measured
Snow
Depth
(in)
Current
SWE
Last Yr
SWE Median
% of
Median
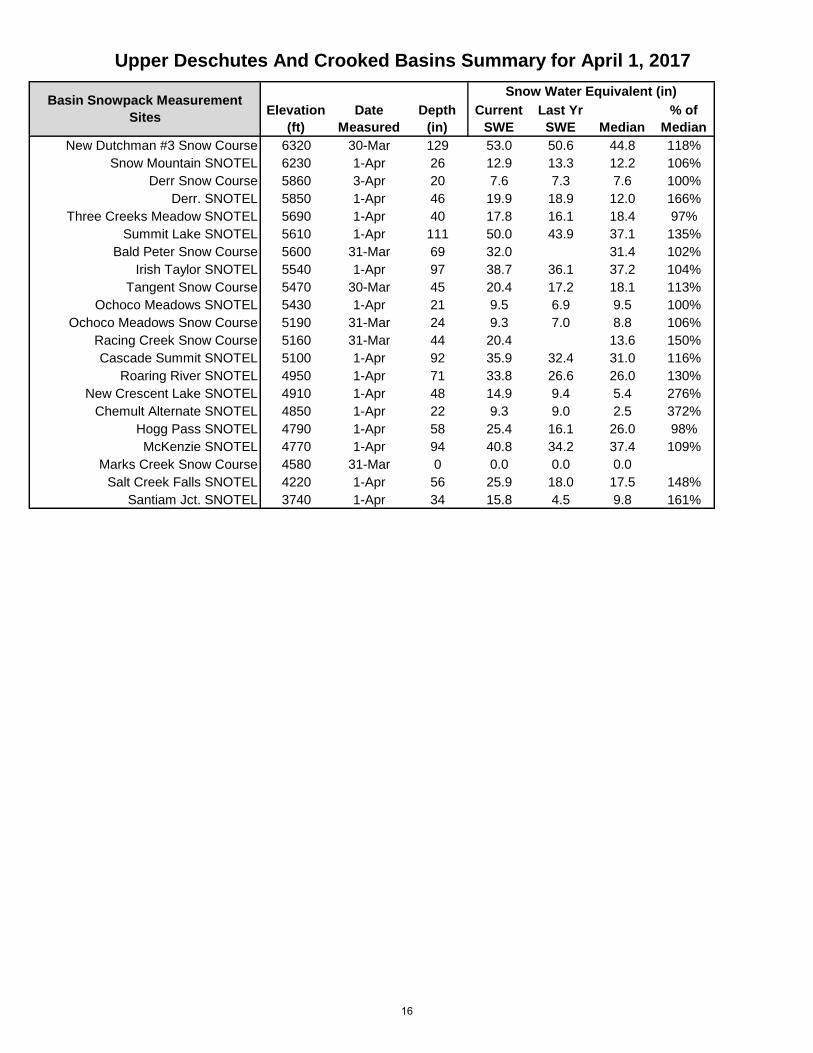
New Dutchman #3 Snow Course 6320 30-Mar 129 53.0 50.6 44.8 118%
Snow Mountain SNOTEL 6230 1-Apr 26 12.9 13.3 12.2 106%
Derr Snow Course 5860 3-Apr 20 7.6 7.3 7.6 100%
Derr. SNOTEL 5850 1-Apr 46 19.9 18.9 12.0 166%
Three Creeks Meadow SNOTEL 5690 1-Apr 40 17.8 16.1 18.4 97%
Summit Lake SNOTEL 5610 1-Apr 111 50.0 43.9 37.1 135%
Bald Peter Snow Course 5600 31-Mar 69 32.0 31.4 102%
Irish Taylor SNOTEL 5540 1-Apr 97 38.7 36.1 37.2 104%
Tangent Snow Course 5470 30-Mar 45 20.4 17.2 18.1 113%
Ochoco Meadows SNOTEL 5430 1-Apr 21 9.5 6.9 9.5 100%
Ochoco Meadows Snow Course 5190 31-Mar 24 9.3 7.0 8.8 106%
Racing Creek Snow Course 5160 31-Mar 44 20.4 13.6 150%
Cascade Summit SNOTEL 5100 1-Apr 92 35.9 32.4 31.0 116%
Roaring River SNOTEL 4950 1-Apr 71 33.8 26.6 26.0 130%
New Crescent Lake SNOTEL 4910 1-Apr 48 14.9 9.4 5.4 276%
Chemult Alternate SNOTEL 4850 1-Apr 22 9.3 9.0 2.5 372%
Hogg Pass SNOTEL 4790 1-Apr 58 25.4 16.1 26.0 98%
McKenzie SNOTEL 4770 1-Apr 94 40.8 34.2 37.4 109%
Marks Creek Snow Course 4580 31-Mar 0 0.0 0.0 0.0
Salt Creek Falls SNOTEL 4220 1-Apr 56 25.9 18.0 17.5 148%
Santiam Jct. SNOTEL 3740 1-Apr 34 15.8 4.5 9.8 161%
Basin Snowpack Measurement
Sites
Snow Water Equivalent (in)
Upper Deschutes And Crooked Basins Summary for April 1, 2017
16
April 1, 2017
Summary of Water Supply Conditions
SNOWPACK
PRECIPITATION
STREAMFLOW FORECAST
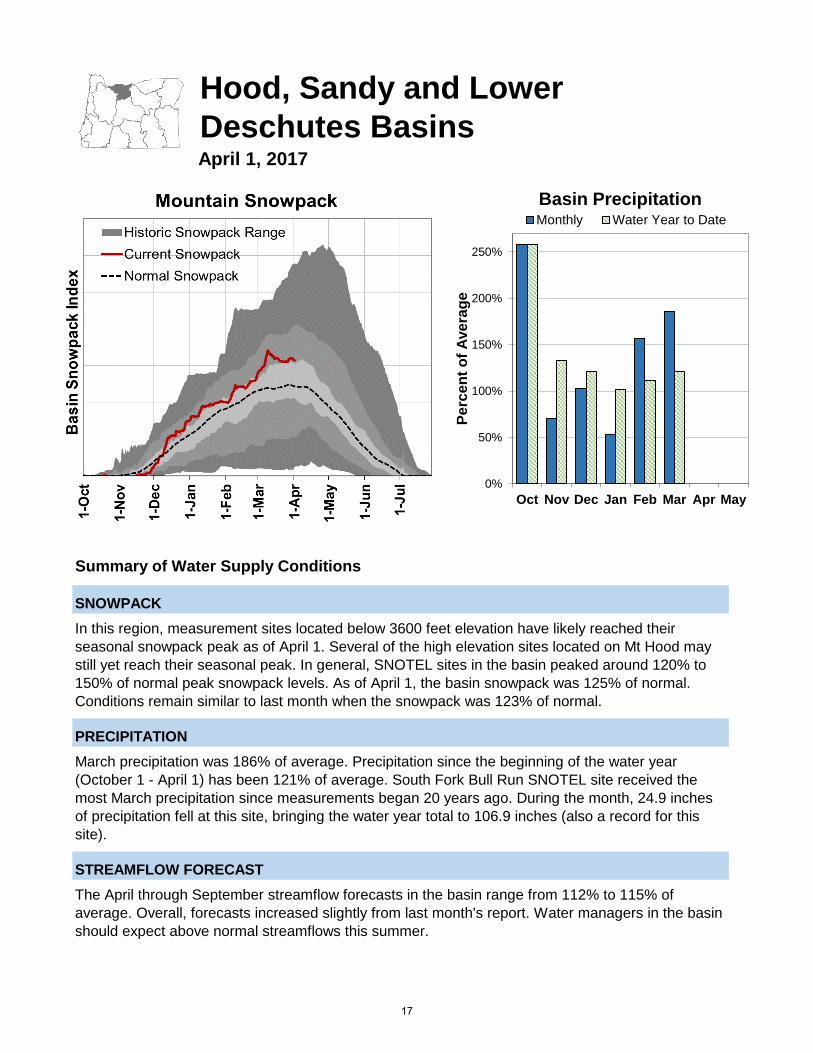
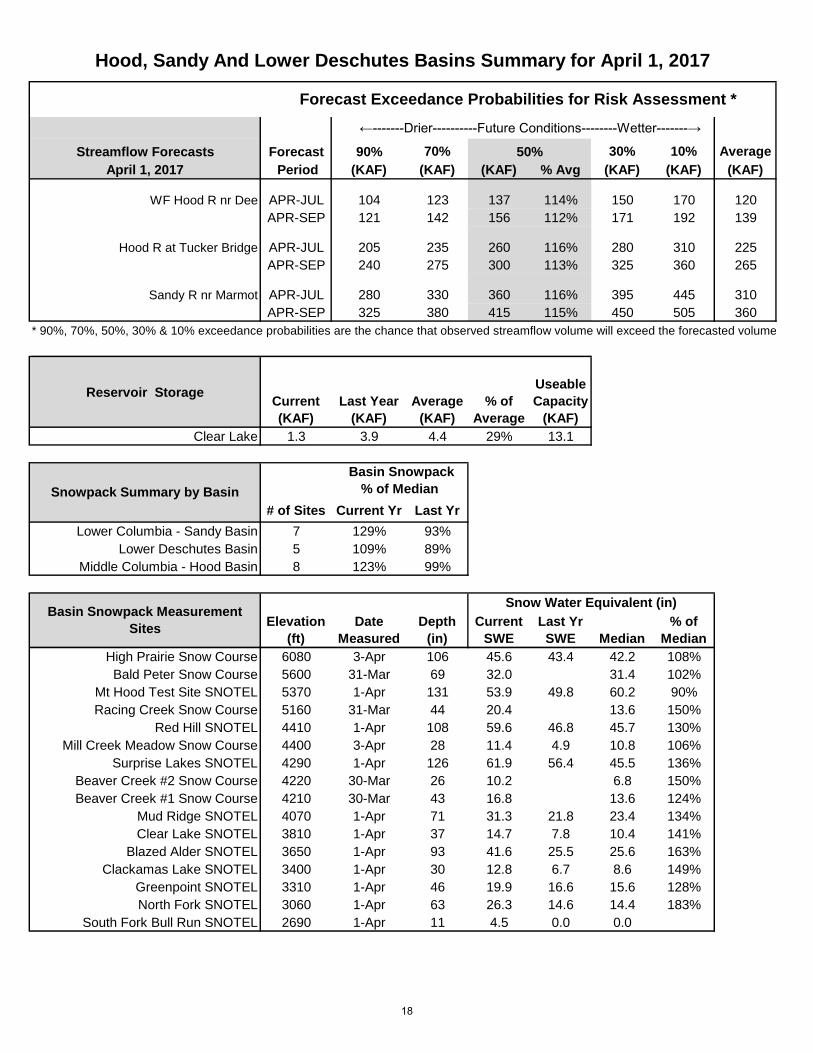
In this region, measurement sites located below 3600 feet elevation have likely reached their
seasonal snowpack peak as of April 1. Several of the high elevation sites located on Mt Hood may
still yet reach their seasonal peak. In general, SNOTEL sites in the basin peaked around 120% to
150% of normal peak snowpack levels. As of April 1, the basin snowpack was 125% of normal.
Conditions remain similar to last month when the snowpack was 123% of normal.
March precipitation was 186% of average. Precipitation since the beginning of the water year
(October 1 - April 1) has been 121% of average. South Fork Bull Run SNOTEL site received the
most March precipitation since measurements began 20 years ago. During the month, 24.9 inches
of precipitation fell at this site, bringing the water year total to 106.9 inches (also a record for this
site).
The April through September streamflow forecasts in the basin range from 112% to 115% of
average. Overall, forecasts increased slightly from last month's report. Water managers in the basin
should expect above normal streamflows this summer.
Hood, Sandy and Lower
Deschutes Basins
0%
50%
100%
150%
200%
250%
Oct Nov Dec Jan Feb Mar Apr May
Pe
rce
nt
of
Ave
rag
e
Basin PrecipitationMonthly Water Year to Date
17
←-------Drier----------Future Conditions--------Wetter-------→
Streamflow Forecasts Forecast 90% 70% 30% 10% Average
April 1, 2017 Period (KAF) (KAF) (KAF) % Avg (KAF) (KAF) (KAF)
WF Hood R nr Dee APR-JUL 104 123 137 114% 150 170 120
APR-SEP 121 142 156 112% 171 192 139
Hood R at Tucker Bridge APR-JUL 205 235 260 116% 280 310 225
APR-SEP 240 275 300 113% 325 360 265
Sandy R nr Marmot APR-JUL 280 330 360 116% 395 445 310
APR-SEP 325 380 415 115% 450 505 360
* 90%, 70%, 50%, 30% & 10% exceedance probabilities are the chance that observed streamflow volume will exceed the forecasted volume
Reservoir StorageCurrent
(KAF)
Last Year
(KAF)
Average
(KAF)
% of
Average
Useable
Capacity
(KAF)
Clear Lake 1.3 3.9 4.4 29% 13.1
# of Sites Current Yr Last Yr
Lower Columbia - Sandy Basin 7 129% 93%
Lower Deschutes Basin 5 109% 89%
Middle Columbia - Hood Basin 8 123% 99%
Elevation
(ft)
Date
Measured
Snow
Depth
(in)
Current
SWE
Last Yr
SWE Median
% of
Median
High Prairie Snow Course 6080 3-Apr 106 45.6 43.4 42.2 108%
Bald Peter Snow Course 5600 31-Mar 69 32.0 31.4 102%
Mt Hood Test Site SNOTEL 5370 1-Apr 131 53.9 49.8 60.2 90%
Racing Creek Snow Course 5160 31-Mar 44 20.4 13.6 150%
Red Hill SNOTEL 4410 1-Apr 108 59.6 46.8 45.7 130%
Mill Creek Meadow Snow Course 4400 3-Apr 28 11.4 4.9 10.8 106%
Surprise Lakes SNOTEL 4290 1-Apr 126 61.9 56.4 45.5 136%
Beaver Creek #2 Snow Course 4220 30-Mar 26 10.2 6.8 150%
Beaver Creek #1 Snow Course 4210 30-Mar 43 16.8 13.6 124%
Mud Ridge SNOTEL 4070 1-Apr 71 31.3 21.8 23.4 134%
Clear Lake SNOTEL 3810 1-Apr 37 14.7 7.8 10.4 141%
Blazed Alder SNOTEL 3650 1-Apr 93 41.6 25.5 25.6 163%
Clackamas Lake SNOTEL 3400 1-Apr 30 12.8 6.7 8.6 149%
Greenpoint SNOTEL 3310 1-Apr 46 19.9 16.6 15.6 128%
North Fork SNOTEL 3060 1-Apr 63 26.3 14.6 14.4 183%
South Fork Bull Run SNOTEL 2690 1-Apr 11 4.5 0.0 0.0
Snowpack Summary by Basin
Basin Snowpack
% of Median
Basin Snowpack Measurement
Sites
Snow Water Equivalent (in)
Hood, Sandy And Lower Deschutes Basins Summary for April 1, 2017
Forecast Exceedance Probabilities for Risk Assessment *
50%
18
Willamette BasinApril 1, 2017
Summary of Water Supply Conditions
SNOWPACK
PRECIPITATION
RESERVOIR
STREAMFLOW FORECAST
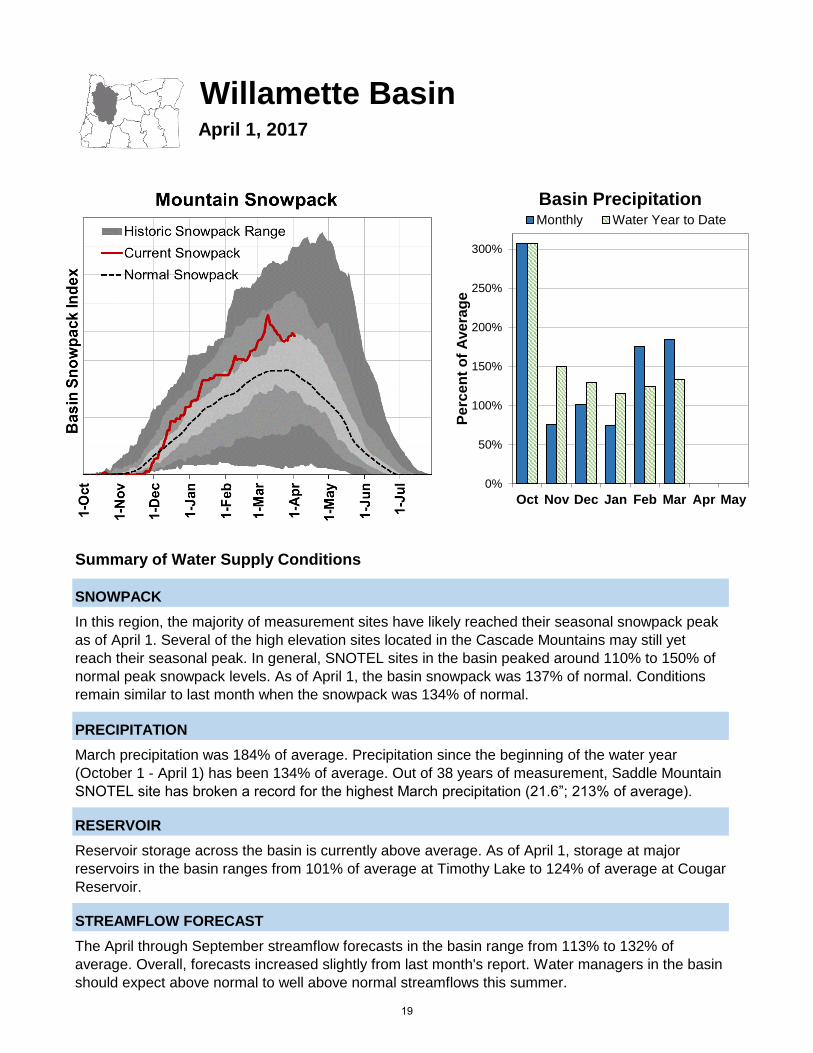
In this region, the majority of measurement sites have likely reached their seasonal snowpack peak
as of April 1. Several of the high elevation sites located in the Cascade Mountains may still yet
reach their seasonal peak. In general, SNOTEL sites in the basin peaked around 110% to 150% of
normal peak snowpack levels. As of April 1, the basin snowpack was 137% of normal. Conditions
remain similar to last month when the snowpack was 134% of normal.
March precipitation was 184% of average. Precipitation since the beginning of the water year
(October 1 - April 1) has been 134% of average. Out of 38 years of measurement, Saddle Mountain
SNOTEL site has broken a record for the highest March precipitation (21.6”; 213% of average).
Reservoir storage across the basin is currently above average. As of April 1, storage at major
reservoirs in the basin ranges from 101% of average at Timothy Lake to 124% of average at Cougar
Reservoir.
The April through September streamflow forecasts in the basin range from 113% to 132% of
average. Overall, forecasts increased slightly from last month's report. Water managers in the basin
should expect above normal to well above normal streamflows this summer.
0%
50%
100%
150%
200%
250%
300%
Oct Nov Dec Jan Feb Mar Apr May
Pe
rce
nt
of
Ave
rag
e
Basin PrecipitationMonthly Water Year to Date
19
←-------Drier----------Future Conditions--------Wetter-------→
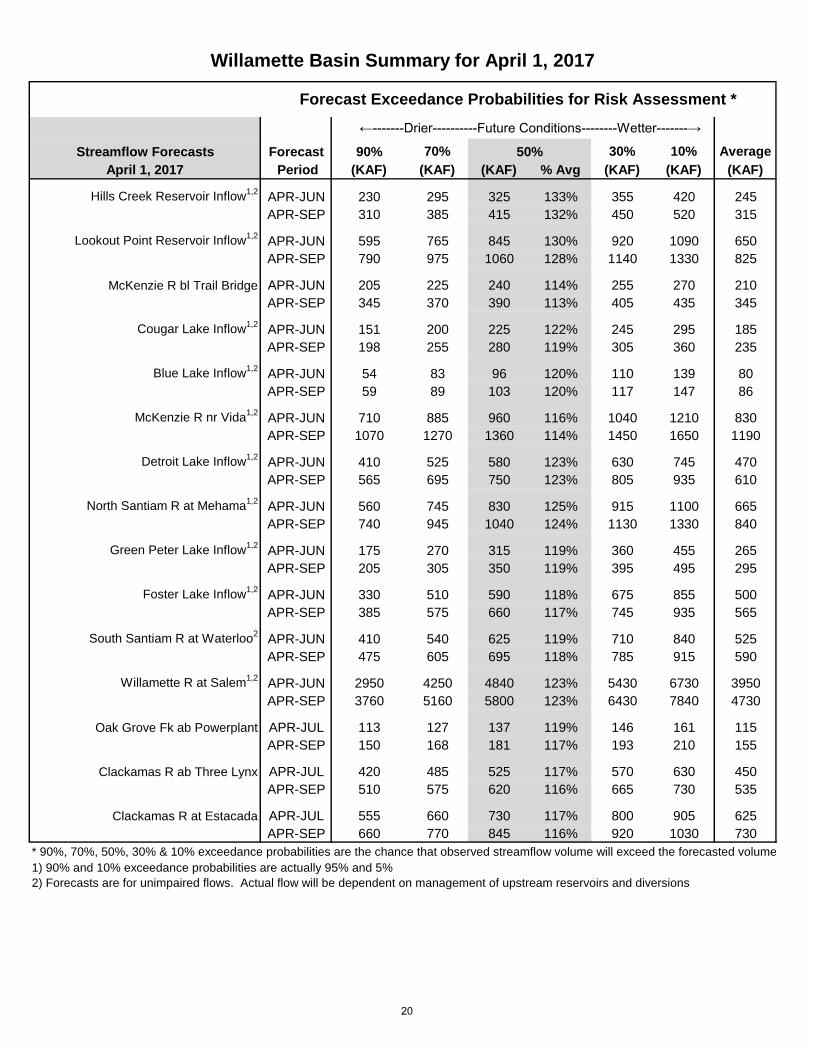
Streamflow Forecasts Forecast 90% 70% 30% 10% Average
April 1, 2017 Period (KAF) (KAF) (KAF) % Avg (KAF) (KAF) (KAF)
Hills Creek Reservoir Inflow1,2
APR-JUN 230 295 325 133% 355 420 245
APR-SEP 310 385 415 132% 450 520 315
Lookout Point Reservoir Inflow1,2
APR-JUN 595 765 845 130% 920 1090 650
APR-SEP 790 975 1060 128% 1140 1330 825
McKenzie R bl Trail Bridge APR-JUN 205 225 240 114% 255 270 210
APR-SEP 345 370 390 113% 405 435 345
Cougar Lake Inflow1,2
APR-JUN 151 200 225 122% 245 295 185
APR-SEP 198 255 280 119% 305 360 235
Blue Lake Inflow1,2
APR-JUN 54 83 96 120% 110 139 80
APR-SEP 59 89 103 120% 117 147 86
McKenzie R nr Vida1,2
APR-JUN 710 885 960 116% 1040 1210 830
APR-SEP 1070 1270 1360 114% 1450 1650 1190
Detroit Lake Inflow1,2
APR-JUN 410 525 580 123% 630 745 470
APR-SEP 565 695 750 123% 805 935 610
North Santiam R at Mehama1,2
APR-JUN 560 745 830 125% 915 1100 665
APR-SEP 740 945 1040 124% 1130 1330 840
Green Peter Lake Inflow1,2
APR-JUN 175 270 315 119% 360 455 265
APR-SEP 205 305 350 119% 395 495 295
Foster Lake Inflow1,2
APR-JUN 330 510 590 118% 675 855 500
APR-SEP 385 575 660 117% 745 935 565
South Santiam R at Waterloo2
APR-JUN 410 540 625 119% 710 840 525
APR-SEP 475 605 695 118% 785 915 590
Willamette R at Salem1,2
APR-JUN 2950 4250 4840 123% 5430 6730 3950
APR-SEP 3760 5160 5800 123% 6430 7840 4730
Oak Grove Fk ab Powerplant APR-JUL 113 127 137 119% 146 161 115
APR-SEP 150 168 181 117% 193 210 155
Clackamas R ab Three Lynx APR-JUL 420 485 525 117% 570 630 450
APR-SEP 510 575 620 116% 665 730 535
Clackamas R at Estacada APR-JUL 555 660 730 117% 800 905 625
APR-SEP 660 770 845 116% 920 1030 730
* 90%, 70%, 50%, 30% & 10% exceedance probabilities are the chance that observed streamflow volume will exceed the forecasted volume
1) 90% and 10% exceedance probabilities are actually 95% and 5%
2) Forecasts are for unimpaired flows. Actual flow will be dependent on management of upstream reservoirs and diversions
Willamette Basin Summary for April 1, 2017
Forecast Exceedance Probabilities for Risk Assessment *
50%
20

Reservoir Storage Current
(KAF)
Last Year
(KAF)
Average
(KAF)
% of
Average
Useable
Capacity
(KAF)
Blue River 59.5 56.3 56.4 106% 82.3
Cottage Grove 21.3 19.2 19.3 110% 31.8
Cougar 147.1 5.5 118.6 124% 174.9
Detroit 363.1 351.8 335.5 108% 426.8
Dorena 53.5 45.1 44.4 121% 72.1
Fall Creek 97.5 82.1 81.6 119% 116.0
Fern Ridge 83.4 79.5 73.1 114% 97.3
Foster 24.4 21.6 30.9 79% 46.2
Green Peter 347.2 336.7 332.6 104% 402.8
Hills Creek 241.9 225.0 205.6 118% 279.2
Lookout Point 340.5 335.3 296.7 115% 433.2
Timothy Lake 53.3 57.6 52.7 101% 63.6
Henry Hagg Lake 51.2 51.4 50.0 102% 53.3
# of Sites Current Yr Last Yr
Clackamas Basin 11 125% 93%
McKenzie Basin 16 125% 106%
Middle Fork Willamette Basin 7 124% 103%
North Santiam Basin 4 197% 71%
South Santiam Basin 4 196% 70%
Elevation
(ft)
Date
Measured
Depth
(in)
Current
SWE
Last Yr
SWE Median
% of
Median
Summit Lake SNOTEL 5610 1-Apr 111 50.0 43.9 37.1 135%
Irish Taylor SNOTEL 5540 1-Apr 97 38.7 36.1 37.2 104%
Cascade Summit SNOTEL 5100 1-Apr 92 35.9 32.4 31.0 116%
Roaring River SNOTEL 4950 1-Apr 71 33.8 26.6 26.0 130%
Holland Meadows SNOTEL 4930 1-Apr 55 26.5 18.5 21.1 126%
McKenzie SNOTEL 4770 1-Apr 94 40.8 34.2 37.4 109%
Bear Grass SNOTEL 4720 1-Apr 122 64.2 47.3
Beaver Creek #2 Snow Course 4220 30-Mar 26 10.2 6.8 150%
Salt Creek Falls SNOTEL 4220 1-Apr 56 25.9 18.0 17.5 148%
Beaver Creek #1 Snow Course 4210 30-Mar 43 16.8 13.6 124%
Mud Ridge SNOTEL 4070 1-Apr 71 31.3 21.8 23.4 134%
Little Meadows SNOTEL 4020 1-Apr 85 43.2 25.4 23.3 185%
Clear Lake SNOTEL 3810 1-Apr 37 14.7 7.8 10.4 141%
Santiam Jct. SNOTEL 3740 1-Apr 34 15.8 4.5 9.8 161%
Daly Lake SNOTEL 3690 1-Apr 36 16.7 3.0 7.7 217%
Marys Peak (Rev.) Snow Course 3580 31-Mar 0 0.0 0.0
Jump Off Joe SNOTEL 3520 1-Apr 30 11.8 2.5 7.8 151%
Peavine Ridge SNOTEL 3420 1-Apr 34 16.6 5.1 8.9 187%
Clackamas Lake SNOTEL 3400 1-Apr 30 12.8 6.7 8.6 149%
Smith Ridge SNOTEL 3270 1-Apr 2 1.1 0.0
Saddle Mountain SNOTEL 3110 1-Apr 0 0.0 0.0
Railroad Overpass SNOTEL 2680 1-Apr 0 0.0 0.0 0.0
Marion Forks SNOTEL 2590 1-Apr 31 15.1 0.0 5.4 280%
Seine Creek SNOTEL 2060 1-Apr 0 0.0 0.0 0.0
Miller Woods SNOTEL 420 1-Apr 0 0.0 0.0
Basin Snowpack Measurement
Sites
Snow Water Equivalent (in)
Willamette Basin Summary for April 1, 2017
Snowpack Summary by Basin
Basin Snowpack
% of Median
21
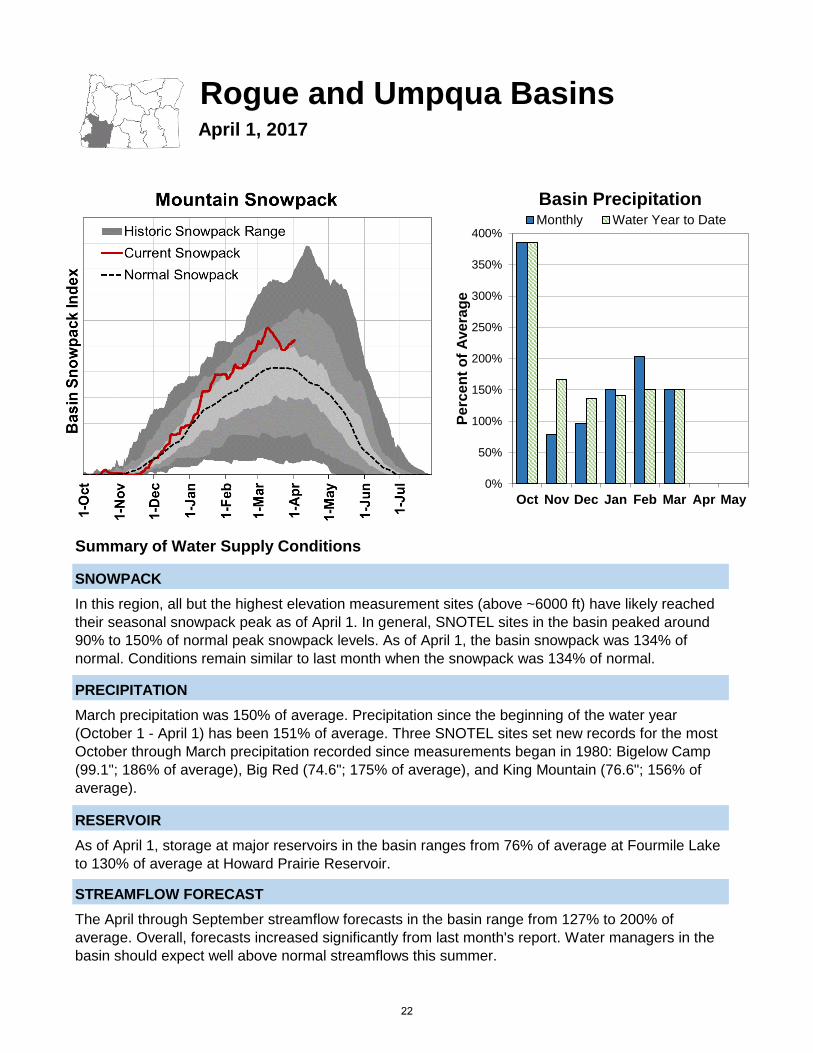
Rogue and Umpqua BasinsApril 1, 2017
Summary of Water Supply Conditions
SNOWPACK
PRECIPITATION
RESERVOIR
STREAMFLOW FORECAST
In this region, all but the highest elevation measurement sites (above ~6000 ft) have likely reached
their seasonal snowpack peak as of April 1. In general, SNOTEL sites in the basin peaked around
90% to 150% of normal peak snowpack levels. As of April 1, the basin snowpack was 134% of
normal. Conditions remain similar to last month when the snowpack was 134% of normal.
March precipitation was 150% of average. Precipitation since the beginning of the water year
(October 1 - April 1) has been 151% of average. Three SNOTEL sites set new records for the most
October through March precipitation recorded since measurements began in 1980: Bigelow Camp
(99.1"; 186% of average), Big Red (74.6"; 175% of average), and King Mountain (76.6"; 156% of
average).
As of April 1, storage at major reservoirs in the basin ranges from 76% of average at Fourmile Lake
to 130% of average at Howard Prairie Reservoir.
The April through September streamflow forecasts in the basin range from 127% to 200% of
average. Overall, forecasts increased significantly from last month's report. Water managers in the
basin should expect well above normal streamflows this summer.
0%
50%
100%
150%
200%
250%
300%
350%
400%
Oct Nov Dec Jan Feb Mar Apr May
Pe
rce
nt
of
Ave
rag
e
Basin PrecipitationMonthly Water Year to Date
22
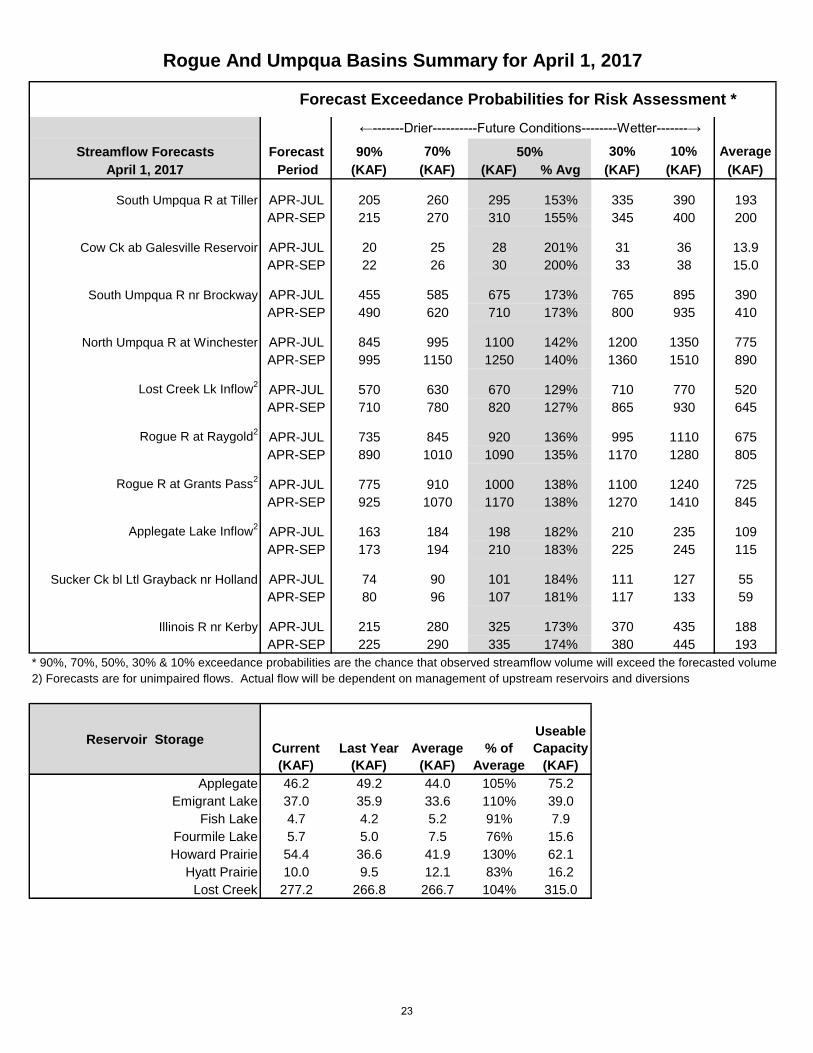
←-------Drier----------Future Conditions--------Wetter-------→
Streamflow Forecasts Forecast 90% 70% 30% 10% Average
April 1, 2017 Period (KAF) (KAF) (KAF) % Avg (KAF) (KAF) (KAF)
South Umpqua R at Tiller APR-JUL 205 260 295 153% 335 390 193
APR-SEP 215 270 310 155% 345 400 200
Cow Ck ab Galesville Reservoir APR-JUL 20 25 28 201% 31 36 13.9
APR-SEP 22 26 30 200% 33 38 15.0
South Umpqua R nr Brockway APR-JUL 455 585 675 173% 765 895 390
APR-SEP 490 620 710 173% 800 935 410
North Umpqua R at Winchester APR-JUL 845 995 1100 142% 1200 1350 775
APR-SEP 995 1150 1250 140% 1360 1510 890
Lost Creek Lk Inflow2
APR-JUL 570 630 670 129% 710 770 520
APR-SEP 710 780 820 127% 865 930 645
Rogue R at Raygold2
APR-JUL 735 845 920 136% 995 1110 675
APR-SEP 890 1010 1090 135% 1170 1280 805
Rogue R at Grants Pass2
APR-JUL 775 910 1000 138% 1100 1240 725
APR-SEP 925 1070 1170 138% 1270 1410 845
Applegate Lake Inflow2
APR-JUL 163 184 198 182% 210 235 109
APR-SEP 173 194 210 183% 225 245 115
Sucker Ck bl Ltl Grayback nr Holland APR-JUL 74 90 101 184% 111 127 55
APR-SEP 80 96 107 181% 117 133 59
Illinois R nr Kerby APR-JUL 215 280 325 173% 370 435 188
APR-SEP 225 290 335 174% 380 445 193
* 90%, 70%, 50%, 30% & 10% exceedance probabilities are the chance that observed streamflow volume will exceed the forecasted volume
2) Forecasts are for unimpaired flows. Actual flow will be dependent on management of upstream reservoirs and diversions
Reservoir StorageCurrent
(KAF)
Last Year
(KAF)
Average
(KAF)
% of
Average
Useable
Capacity
(KAF)
Applegate 46.2 49.2 44.0 105% 75.2
Emigrant Lake 37.0 35.9 33.6 110% 39.0
Fish Lake 4.7 4.2 5.2 91% 7.9
Fourmile Lake 5.7 5.0 7.5 76% 15.6
Howard Prairie 54.4 36.6 41.9 130% 62.1
Hyatt Prairie 10.0 9.5 12.1 83% 16.2
Lost Creek 277.2 266.8 266.7 104% 315.0
Rogue And Umpqua Basins Summary for April 1, 2017
Forecast Exceedance Probabilities for Risk Assessment *
50%
23
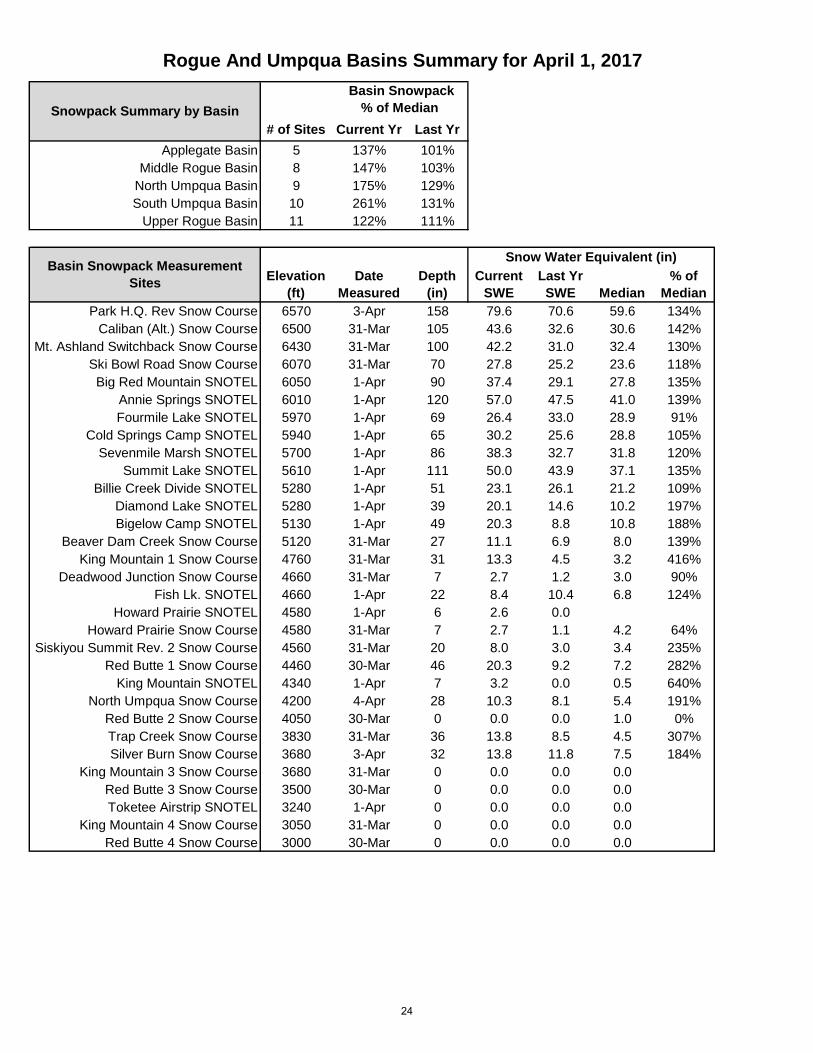
# of Sites Current Yr Last Yr
Applegate Basin 5 137% 101%
Middle Rogue Basin 8 147% 103%
North Umpqua Basin 9 175% 129%
South Umpqua Basin 10 261% 131%
Upper Rogue Basin 11 122% 111%
Elevation
(ft)
Date
Measured
Snow
Depth
(in)
Current
SWE
Last Yr
SWE Median
% of
Median
Park H.Q. Rev Snow Course 6570 3-Apr 158 79.6 70.6 59.6 134%
Caliban (Alt.) Snow Course 6500 31-Mar 105 43.6 32.6 30.6 142%
Mt. Ashland Switchback Snow Course 6430 31-Mar 100 42.2 31.0 32.4 130%
Ski Bowl Road Snow Course 6070 31-Mar 70 27.8 25.2 23.6 118%
Big Red Mountain SNOTEL 6050 1-Apr 90 37.4 29.1 27.8 135%
Annie Springs SNOTEL 6010 1-Apr 120 57.0 47.5 41.0 139%
Fourmile Lake SNOTEL 5970 1-Apr 69 26.4 33.0 28.9 91%
Cold Springs Camp SNOTEL 5940 1-Apr 65 30.2 25.6 28.8 105%
Sevenmile Marsh SNOTEL 5700 1-Apr 86 38.3 32.7 31.8 120%
Summit Lake SNOTEL 5610 1-Apr 111 50.0 43.9 37.1 135%
Billie Creek Divide SNOTEL 5280 1-Apr 51 23.1 26.1 21.2 109%
Diamond Lake SNOTEL 5280 1-Apr 39 20.1 14.6 10.2 197%
Bigelow Camp SNOTEL 5130 1-Apr 49 20.3 8.8 10.8 188%
Beaver Dam Creek Snow Course 5120 31-Mar 27 11.1 6.9 8.0 139%
King Mountain 1 Snow Course 4760 31-Mar 31 13.3 4.5 3.2 416%
Deadwood Junction Snow Course 4660 31-Mar 7 2.7 1.2 3.0 90%
Fish Lk. SNOTEL 4660 1-Apr 22 8.4 10.4 6.8 124%
Howard Prairie SNOTEL 4580 1-Apr 6 2.6 0.0
Howard Prairie Snow Course 4580 31-Mar 7 2.7 1.1 4.2 64%
Siskiyou Summit Rev. 2 Snow Course 4560 31-Mar 20 8.0 3.0 3.4 235%
Red Butte 1 Snow Course 4460 30-Mar 46 20.3 9.2 7.2 282%
King Mountain SNOTEL 4340 1-Apr 7 3.2 0.0 0.5 640%
North Umpqua Snow Course 4200 4-Apr 28 10.3 8.1 5.4 191%
Red Butte 2 Snow Course 4050 30-Mar 0 0.0 0.0 1.0 0%
Trap Creek Snow Course 3830 31-Mar 36 13.8 8.5 4.5 307%
Silver Burn Snow Course 3680 3-Apr 32 13.8 11.8 7.5 184%
King Mountain 3 Snow Course 3680 31-Mar 0 0.0 0.0 0.0
Red Butte 3 Snow Course 3500 30-Mar 0 0.0 0.0 0.0
Toketee Airstrip SNOTEL 3240 1-Apr 0 0.0 0.0 0.0
King Mountain 4 Snow Course 3050 31-Mar 0 0.0 0.0 0.0
Red Butte 4 Snow Course 3000 30-Mar 0 0.0 0.0 0.0
Basin Snowpack Measurement
Sites
Snow Water Equivalent (in)
Rogue And Umpqua Basins Summary for April 1, 2017
Snowpack Summary by Basin
Basin Snowpack
% of Median
24
Klamath BasinApril 1, 2017
Summary of Water Supply Conditions
SNOWPACK
PRECIPITATION
RESERVOIR
STREAMFLOW FORECAST
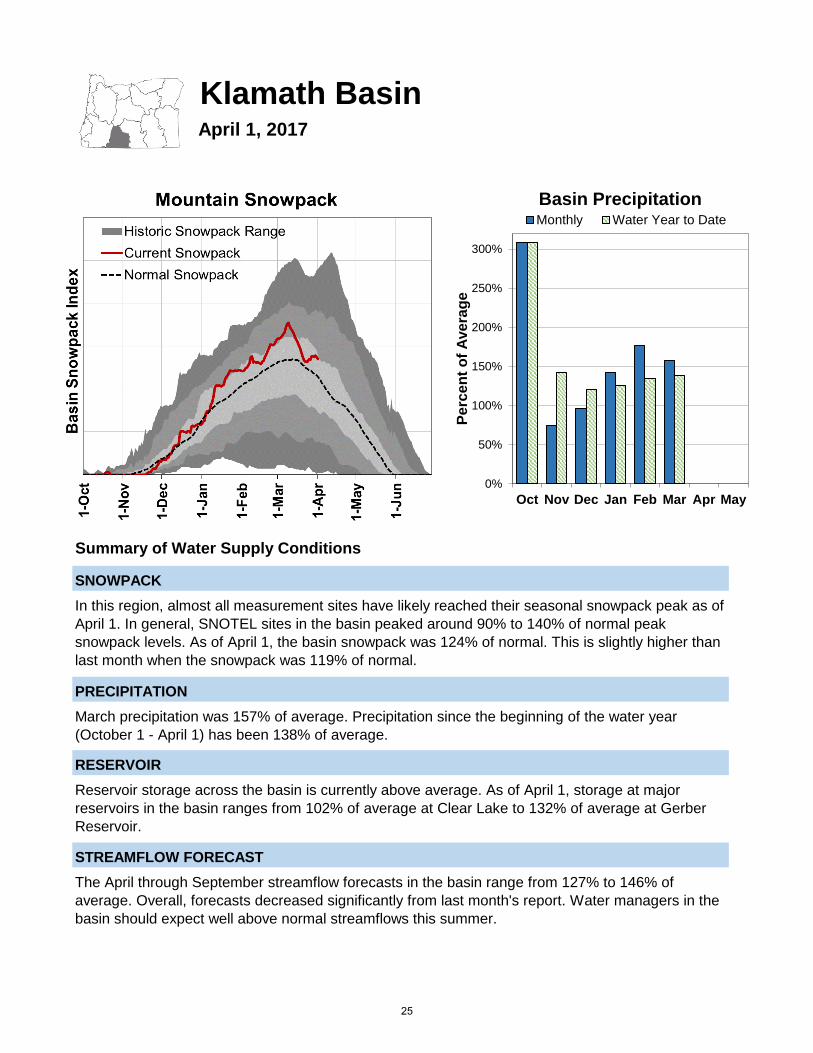
In this region, almost all measurement sites have likely reached their seasonal snowpack peak as of
April 1. In general, SNOTEL sites in the basin peaked around 90% to 140% of normal peak
snowpack levels. As of April 1, the basin snowpack was 124% of normal. This is slightly higher than
last month when the snowpack was 119% of normal.
March precipitation was 157% of average. Precipitation since the beginning of the water year
(October 1 - April 1) has been 138% of average.
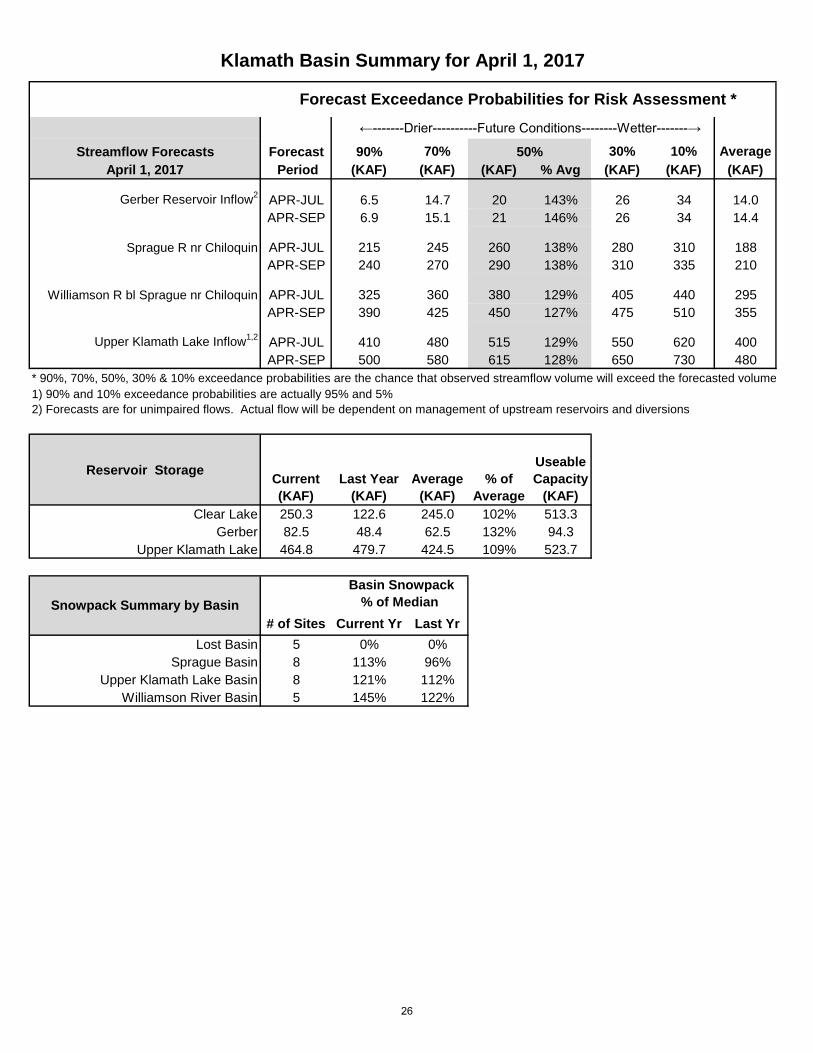
Reservoir storage across the basin is currently above average. As of April 1, storage at major
reservoirs in the basin ranges from 102% of average at Clear Lake to 132% of average at Gerber
Reservoir.
The April through September streamflow forecasts in the basin range from 127% to 146% of
average. Overall, forecasts decreased significantly from last month's report. Water managers in the
basin should expect well above normal streamflows this summer.
0%
50%
100%
150%
200%
250%
300%
Oct Nov Dec Jan Feb Mar Apr May
Pe
rce
nt
of
Ave
rag
e
Basin PrecipitationMonthly Water Year to Date
25
←-------Drier----------Future Conditions--------Wetter-------→
Streamflow Forecasts Forecast 90% 70% 30% 10% Average
April 1, 2017 Period (KAF) (KAF) (KAF) % Avg (KAF) (KAF) (KAF)
Gerber Reservoir Inflow2
APR-JUL 6.5 14.7 20 143% 26 34 14.0
APR-SEP 6.9 15.1 21 146% 26 34 14.4
Sprague R nr Chiloquin APR-JUL 215 245 260 138% 280 310 188
APR-SEP 240 270 290 138% 310 335 210
Williamson R bl Sprague nr Chiloquin APR-JUL 325 360 380 129% 405 440 295
APR-SEP 390 425 450 127% 475 510 355
Upper Klamath Lake Inflow1,2
APR-JUL 410 480 515 129% 550 620 400
APR-SEP 500 580 615 128% 650 730 480
* 90%, 70%, 50%, 30% & 10% exceedance probabilities are the chance that observed streamflow volume will exceed the forecasted volume
1) 90% and 10% exceedance probabilities are actually 95% and 5%
2) Forecasts are for unimpaired flows. Actual flow will be dependent on management of upstream reservoirs and diversions
Reservoir StorageCurrent
(KAF)
Last Year
(KAF)
Average
(KAF)
% of
Average
Useable
Capacity
(KAF)
Clear Lake 250.3 122.6 245.0 102% 513.3
Gerber 82.5 48.4 62.5 132% 94.3
Upper Klamath Lake 464.8 479.7 424.5 109% 523.7
# of Sites Current Yr Last Yr
Lost Basin 5 0% 0%
Sprague Basin 8 113% 96%
Upper Klamath Lake Basin 8 121% 112%
Williamson River Basin 5 145% 122%
Klamath Basin Summary for April 1, 2017
Forecast Exceedance Probabilities for Risk Assessment *
50%
Snowpack Summary by Basin
Basin Snowpack
% of Median
26
Elevation
(ft)
Date
Measured
Snow
Depth
(in)
Current
SWE
Last Yr
SWE Median
% of
Median
Summer Rim SNOTEL 7080 1-Apr 39 15.5 19.1 16.4 95%
Swan Lake Mtn SNOTEL 6830 1-Apr 70 31.8 31.2
Park H.Q. Rev Snow Course 6570 3-Apr 158 79.6 70.6 59.6 134%
Colvin Creek AM 6520 31-Mar 2 0.8 0.0 0.0
Crazyman Flat SNOTEL 6180 1-Apr 42 17.7 16.6 13.1 135%
Ski Bowl Road Snow Course 6070 31-Mar 70 27.8 25.2 23.6 118%
Annie Springs SNOTEL 6010 1-Apr 120 57.0 47.5 41.0 139%
Finley Corrals AM 6000 1-Apr 31 12.7 10.4 13.0 98%
Fourmile Lake SNOTEL 5970 1-Apr 69 26.4 33.0 28.9 91%
Cold Springs Camp SNOTEL 5940 1-Apr 65 30.2 25.6 28.8 105%
Strawberry SNOTEL 5770 1-Apr 0 0.0 0.0 1.2 0%
Cox Flat AM 5750 1-Apr 0 0.0 0.0 0.2 0%
Silver Creek SNOTEL 5740 1-Apr 24 10.4 5.0 7.2 144%
Quartz Mountain SNOTEL 5720 1-Apr 0 0.0 0.0 0.0
Sevenmile Marsh SNOTEL 5700 1-Apr 86 38.3 32.7 31.8 120%
Sycan Flat AM 5580 31-Mar 0 0.0 0.0 0.4 0%
Sun Pass SNOTEL 5400 1-Apr 60 23.9 20.9
Billie Creek Divide SNOTEL 5280 1-Apr 51 23.1 26.1 21.2 109%
Diamond Lake SNOTEL 5280 1-Apr 39 20.1 14.6 10.2 197%
Beaver Dam Creek Snow Course 5120 31-Mar 27 11.1 6.9 8.0 139%
Taylor Butte SNOTEL 5030 1-Apr 6 3.1 0.0 3.0 103%
Dog Hollow AM 4920 31-Mar 0 0.0 0.0 0.0
Gerber Reservoir SNOTEL 4890 1-Apr 0 0.0 0.0 0.0
Chemult Alternate SNOTEL 4850 1-Apr 22 9.3 9.0 2.5 372%
Deadwood Junction Snow Course 4660 31-Mar 7 2.7 1.2 3.0 90%
Fish Lk. SNOTEL 4660 1-Apr 22 8.4 10.4 6.8 124%
Howard Prairie SNOTEL 4580 1-Apr 6 2.6 0.0
Howard Prairie Snow Course 4580 31-Mar 7 2.7 1.1 4.2 64%
Siskiyou Summit Rev. 2 Snow Course 4560 31-Mar 20 8.0 3.0 3.4 235%
Basin Snowpack Measurement
Sites
Snow Water Equivalent (in)
Klamath Basin Summary for April 1, 2017
27
Lake County and Goose Lake BasinsApril 1, 2017
Summary of Water Supply Conditions
SNOWPACK
PRECIPITATION
RESERVOIR
STREAMFLOW FORECAST
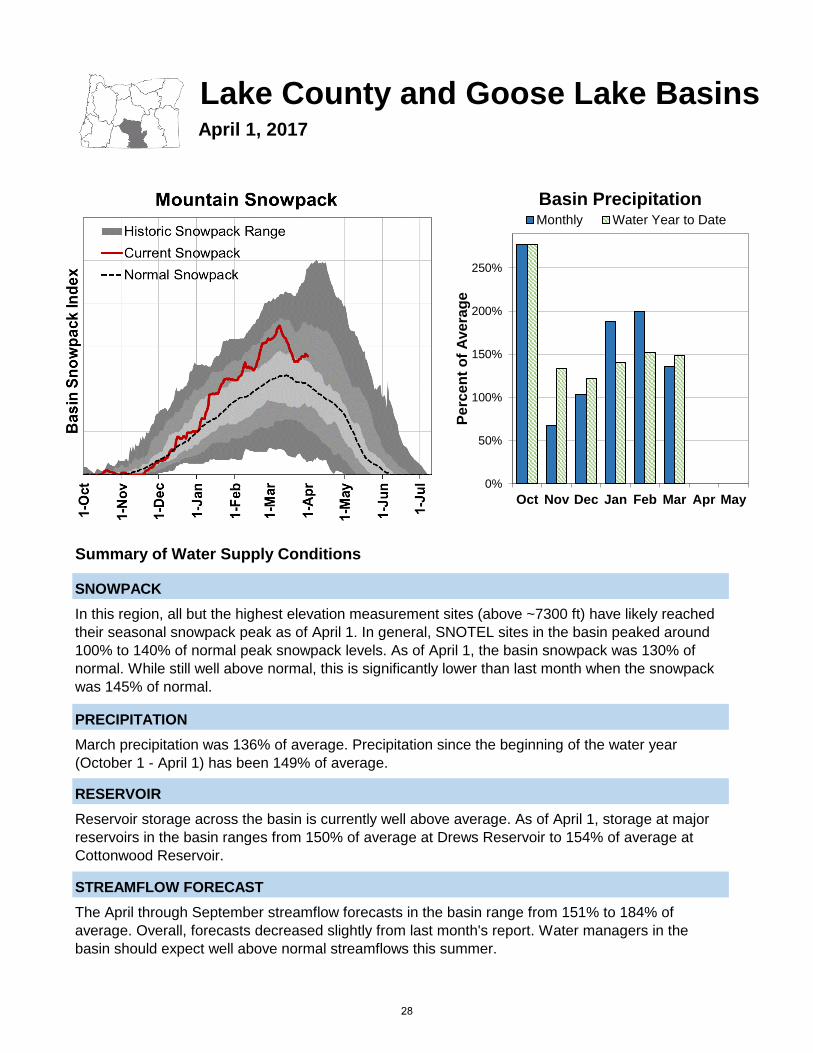
In this region, all but the highest elevation measurement sites (above ~7300 ft) have likely reached
their seasonal snowpack peak as of April 1. In general, SNOTEL sites in the basin peaked around
100% to 140% of normal peak snowpack levels. As of April 1, the basin snowpack was 130% of
normal. While still well above normal, this is significantly lower than last month when the snowpack
was 145% of normal.
March precipitation was 136% of average. Precipitation since the beginning of the water year
(October 1 - April 1) has been 149% of average.
Reservoir storage across the basin is currently well above average. As of April 1, storage at major
reservoirs in the basin ranges from 150% of average at Drews Reservoir to 154% of average at
Cottonwood Reservoir.
The April through September streamflow forecasts in the basin range from 151% to 184% of
average. Overall, forecasts decreased slightly from last month's report. Water managers in the
basin should expect well above normal streamflows this summer.
0%
50%
100%
150%
200%
250%
Oct Nov Dec Jan Feb Mar Apr May
Pe
rce
nt
of
Ave
rag
e
Basin PrecipitationMonthly Water Year to Date
28
←-------Drier----------Future Conditions--------Wetter-------→
Streamflow Forecasts Forecast 90% 70% 30% 10% Average
April 1, 2017 Period (KAF) (KAF) (KAF) % Avg (KAF) (KAF) (KAF)
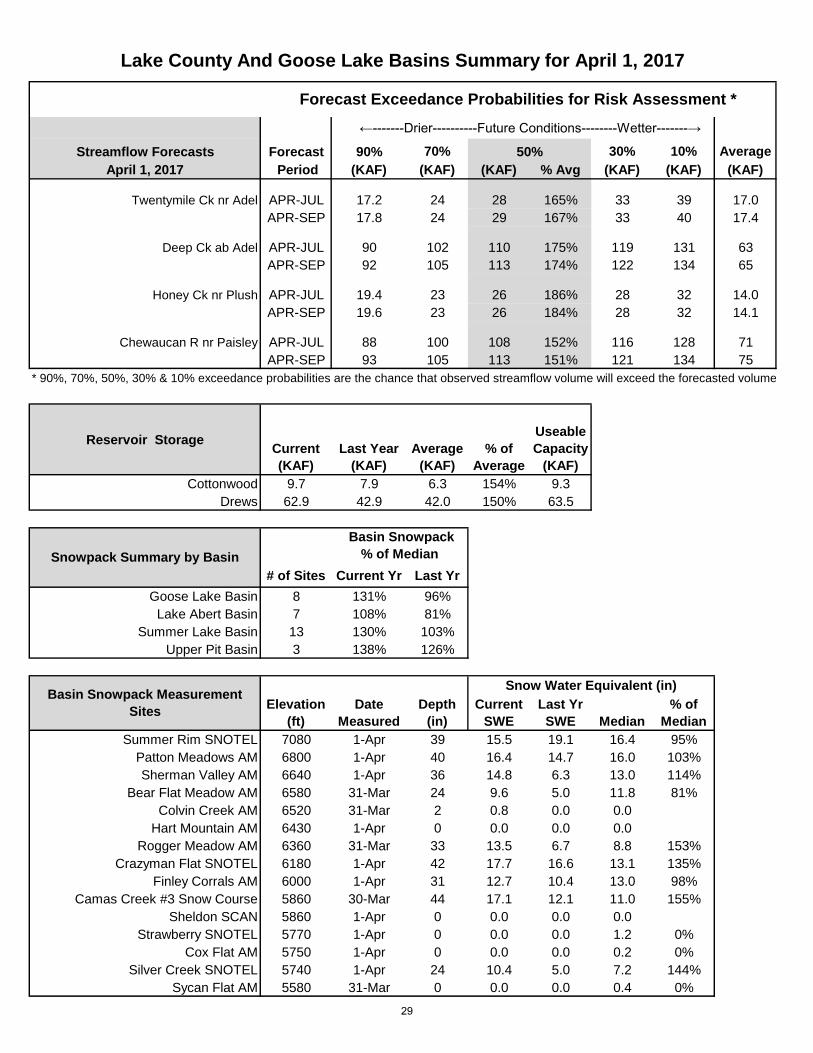
Twentymile Ck nr Adel APR-JUL 17.2 24 28 165% 33 39 17.0
APR-SEP 17.8 24 29 167% 33 40 17.4
Deep Ck ab Adel APR-JUL 90 102 110 175% 119 131 63
APR-SEP 92 105 113 174% 122 134 65
Honey Ck nr Plush APR-JUL 19.4 23 26 186% 28 32 14.0
APR-SEP 19.6 23 26 184% 28 32 14.1
Chewaucan R nr Paisley APR-JUL 88 100 108 152% 116 128 71
APR-SEP 93 105 113 151% 121 134 75
* 90%, 70%, 50%, 30% & 10% exceedance probabilities are the chance that observed streamflow volume will exceed the forecasted volume
Reservoir StorageCurrent
(KAF)
Last Year
(KAF)
Average
(KAF)
% of
Average
Useable
Capacity
(KAF)
Cottonwood 9.7 7.9 6.3 154% 9.3
Drews 62.9 42.9 42.0 150% 63.5
# of Sites Current Yr Last Yr
Goose Lake Basin 8 131% 96%
Lake Abert Basin 7 108% 81%
Summer Lake Basin 13 130% 103%
Upper Pit Basin 3 138% 126%
Elevation
(ft)
Date
Measured
Snow
Depth
(in)
Current
SWE
Last Yr
SWE Median
% of
Median
Summer Rim SNOTEL 7080 1-Apr 39 15.5 19.1 16.4 95%
Patton Meadows AM 6800 1-Apr 40 16.4 14.7 16.0 103%
Sherman Valley AM 6640 1-Apr 36 14.8 6.3 13.0 114%
Bear Flat Meadow AM 6580 31-Mar 24 9.6 5.0 11.8 81%
Colvin Creek AM 6520 31-Mar 2 0.8 0.0 0.0
Hart Mountain AM 6430 1-Apr 0 0.0 0.0 0.0
Rogger Meadow AM 6360 31-Mar 33 13.5 6.7 8.8 153%
Crazyman Flat SNOTEL 6180 1-Apr 42 17.7 16.6 13.1 135%
Finley Corrals AM 6000 1-Apr 31 12.7 10.4 13.0 98%
Camas Creek #3 Snow Course 5860 30-Mar 44 17.1 12.1 11.0 155%
Sheldon SCAN 5860 1-Apr 0 0.0 0.0 0.0
Strawberry SNOTEL 5770 1-Apr 0 0.0 0.0 1.2 0%
Cox Flat AM 5750 1-Apr 0 0.0 0.0 0.2 0%
Silver Creek SNOTEL 5740 1-Apr 24 10.4 5.0 7.2 144%
Sycan Flat AM 5580 31-Mar 0 0.0 0.0 0.4 0%
Snowpack Summary by Basin
Basin Snowpack
% of Median
Basin Snowpack Measurement
Sites
Snow Water Equivalent (in)
Lake County And Goose Lake Basins Summary for April 1, 2017
Forecast Exceedance Probabilities for Risk Assessment *
50%
29
Harney BasinApril 1, 2017
Summary of Water Supply Conditions
SNOWPACK
PRECIPITATION
STREAMFLOW FORECAST
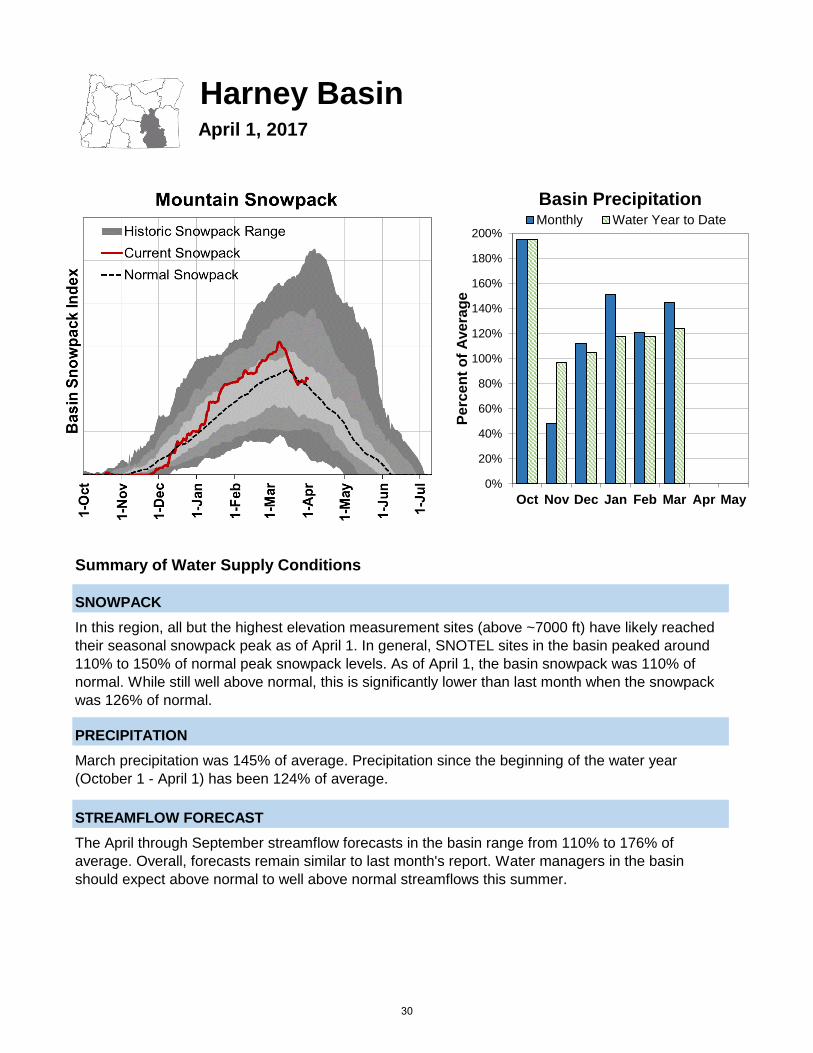
In this region, all but the highest elevation measurement sites (above ~7000 ft) have likely reached
their seasonal snowpack peak as of April 1. In general, SNOTEL sites in the basin peaked around
110% to 150% of normal peak snowpack levels. As of April 1, the basin snowpack was 110% of
normal. While still well above normal, this is significantly lower than last month when the snowpack
was 126% of normal.
March precipitation was 145% of average. Precipitation since the beginning of the water year
(October 1 - April 1) has been 124% of average.
The April through September streamflow forecasts in the basin range from 110% to 176% of
average. Overall, forecasts remain similar to last month's report. Water managers in the basin
should expect above normal to well above normal streamflows this summer.
0%
20%
40%
60%
80%
100%
120%
140%
160%
180%
200%
Oct Nov Dec Jan Feb Mar Apr May
Pe
rce
nt
of
Ave
rag
e
Basin PrecipitationMonthly Water Year to Date
30
←-------Drier----------Future Conditions--------Wetter-------→
Streamflow Forecasts Forecast 90% 70% 30% 10% Average
April 1, 2017 Period (KAF) (KAF) (KAF) % Avg (KAF) (KAF) (KAF)
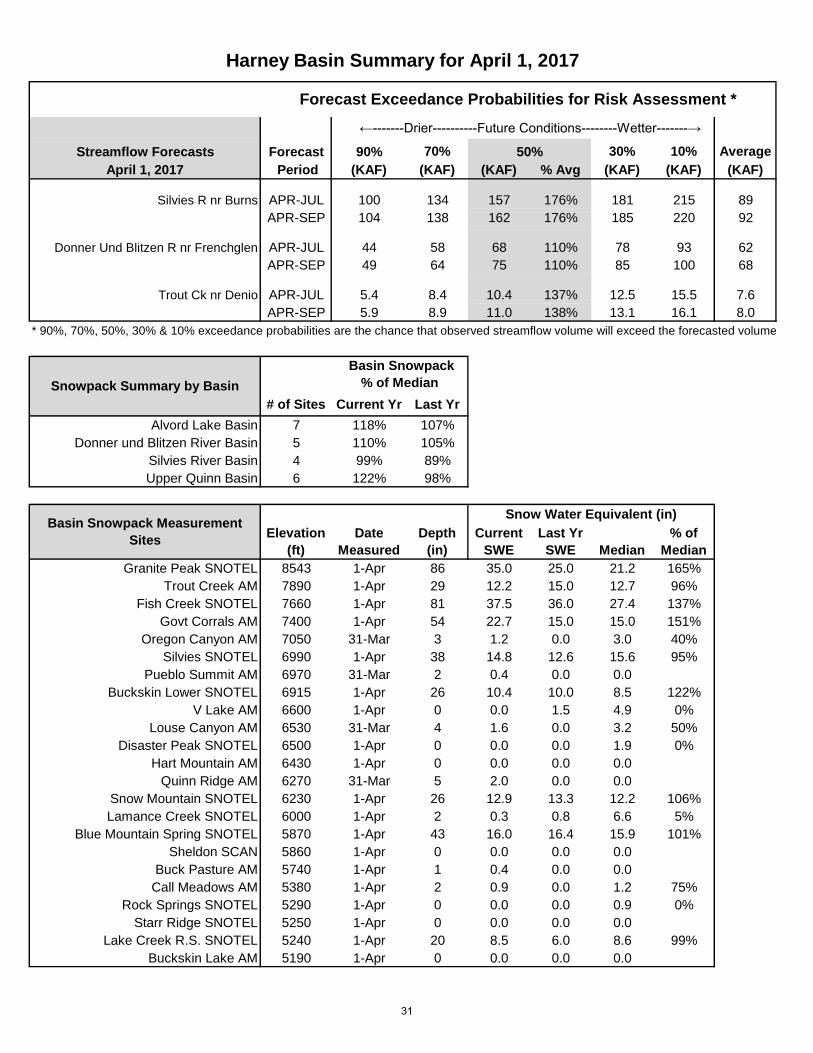
Silvies R nr Burns APR-JUL 100 134 157 176% 181 215 89
APR-SEP 104 138 162 176% 185 220 92
Donner Und Blitzen R nr Frenchglen APR-JUL 44 58 68 110% 78 93 62
APR-SEP 49 64 75 110% 85 100 68
Trout Ck nr Denio APR-JUL 5.4 8.4 10.4 137% 12.5 15.5 7.6
APR-SEP 5.9 8.9 11.0 138% 13.1 16.1 8.0
* 90%, 70%, 50%, 30% & 10% exceedance probabilities are the chance that observed streamflow volume will exceed the forecasted volume
# of Sites Current Yr Last Yr
Alvord Lake Basin 7 118% 107%
Donner und Blitzen River Basin 5 110% 105%
Silvies River Basin 4 99% 89%
Upper Quinn Basin 6 122% 98%
Elevation
(ft)
Date
Measured
Snow
Depth
(in)
Current
SWE
Last Yr
SWE Median
% of
Median
Granite Peak SNOTEL 8543 1-Apr 86 35.0 25.0 21.2 165%
Trout Creek AM 7890 1-Apr 29 12.2 15.0 12.7 96%
Fish Creek SNOTEL 7660 1-Apr 81 37.5 36.0 27.4 137%
Govt Corrals AM 7400 1-Apr 54 22.7 15.0 15.0 151%
Oregon Canyon AM 7050 31-Mar 3 1.2 0.0 3.0 40%
Silvies SNOTEL 6990 1-Apr 38 14.8 12.6 15.6 95%
Pueblo Summit AM 6970 31-Mar 2 0.4 0.0 0.0
Buckskin Lower SNOTEL 6915 1-Apr 26 10.4 10.0 8.5 122%
V Lake AM 6600 1-Apr 0 0.0 1.5 4.9 0%
Louse Canyon AM 6530 31-Mar 4 1.6 0.0 3.2 50%
Disaster Peak SNOTEL 6500 1-Apr 0 0.0 0.0 1.9 0%
Hart Mountain AM 6430 1-Apr 0 0.0 0.0 0.0
Quinn Ridge AM 6270 31-Mar 5 2.0 0.0 0.0
Snow Mountain SNOTEL 6230 1-Apr 26 12.9 13.3 12.2 106%
Lamance Creek SNOTEL 6000 1-Apr 2 0.3 0.8 6.6 5%
Blue Mountain Spring SNOTEL 5870 1-Apr 43 16.0 16.4 15.9 101%
Sheldon SCAN 5860 1-Apr 0 0.0 0.0 0.0
Buck Pasture AM 5740 1-Apr 1 0.4 0.0 0.0
Call Meadows AM 5380 1-Apr 2 0.9 0.0 1.2 75%
Rock Springs SNOTEL 5290 1-Apr 0 0.0 0.0 0.9 0%
Starr Ridge SNOTEL 5250 1-Apr 0 0.0 0.0 0.0
Lake Creek R.S. SNOTEL 5240 1-Apr 20 8.5 6.0 8.6 99%
Buckskin Lake AM 5190 1-Apr 0 0.0 0.0 0.0
Snowpack Summary by Basin
Basin Snowpack
% of Median
Basin Snowpack Measurement
Sites
Snow Water Equivalent (in)
Harney Basin Summary for April 1, 2017
Forecast Exceedance Probabilities for Risk Assessment *
50%
31
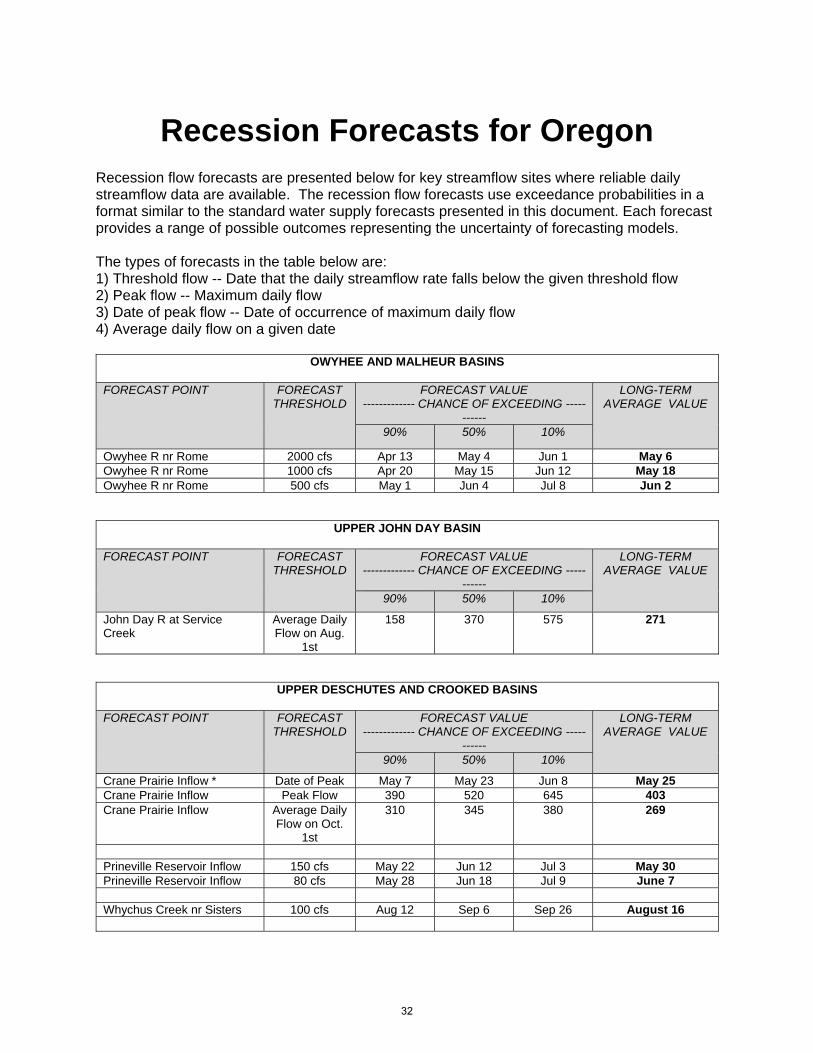
Recession Forecasts for Oregon Recession flow forecasts are presented below for key streamflow sites where reliable daily streamflow data are available. The recession flow forecasts use exceedance probabilities in a format similar to the standard water supply forecasts presented in this document. Each forecast provides a range of possible outcomes representing the uncertainty of forecasting models. The types of forecasts in the table below are: 1) Threshold flow -- Date that the daily streamflow rate falls below the given threshold flow 2) Peak flow -- Maximum daily flow 3) Date of peak flow -- Date of occurrence of maximum daily flow 4) Average daily flow on a given date
OWYHEE AND MALHEUR BASINS
FORECAST POINT
FORECAST THRESHOLD
FORECAST VALUE ------------- CHANCE OF EXCEEDING -----
------
LONG-TERM AVERAGE VALUE
90% 50% 10%
Owyhee R nr Rome 2000 cfs Apr 13 May 4 Jun 1 May 6
Owyhee R nr Rome 1000 cfs Apr 20 May 15 Jun 12 May 18
Owyhee R nr Rome 500 cfs May 1 Jun 4 Jul 8 Jun 2
UPPER JOHN DAY BASIN
FORECAST POINT
FORECAST THRESHOLD
FORECAST VALUE ------------- CHANCE OF EXCEEDING -----
------
LONG-TERM AVERAGE VALUE
90% 50% 10%
John Day R at Service Creek
Average Daily Flow on Aug.
1st
158 370 575 271
UPPER DESCHUTES AND CROOKED BASINS
FORECAST POINT
FORECAST THRESHOLD
FORECAST VALUE ------------- CHANCE OF EXCEEDING -----
------
LONG-TERM AVERAGE VALUE
90% 50% 10%
Crane Prairie Inflow * Date of Peak May 7 May 23 Jun 8 May 25
Crane Prairie Inflow Peak Flow 390 520 645 403
Crane Prairie Inflow Average Daily Flow on Oct.
1st
310 345 380 269
Prineville Reservoir Inflow 150 cfs May 22 Jun 12 Jul 3 May 30
Prineville Reservoir Inflow 80 cfs May 28 Jun 18 Jul 9 June 7
Whychus Creek nr Sisters 100 cfs Aug 12 Sep 6 Sep 26 August 16
32
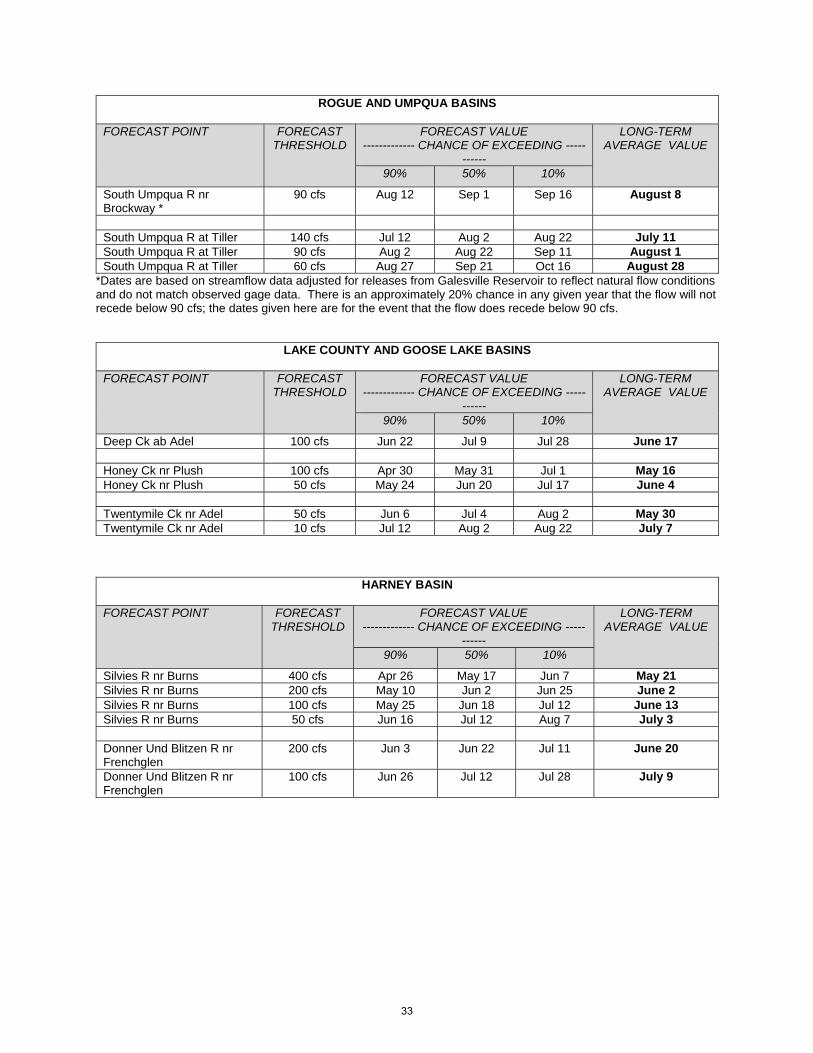
ROGUE AND UMPQUA BASINS
FORECAST POINT
FORECAST THRESHOLD
FORECAST VALUE ------------- CHANCE OF EXCEEDING -----
------
LONG-TERM AVERAGE VALUE
90% 50% 10%
South Umpqua R nr Brockway *
90 cfs Aug 12 Sep 1 Sep 16 August 8
South Umpqua R at Tiller 140 cfs Jul 12 Aug 2 Aug 22 July 11
South Umpqua R at Tiller 90 cfs Aug 2 Aug 22 Sep 11 August 1
South Umpqua R at Tiller 60 cfs Aug 27 Sep 21 Oct 16 August 28
*Dates are based on streamflow data adjusted for releases from Galesville Reservoir to reflect natural flow conditions and do not match observed gage data. There is an approximately 20% chance in any given year that the flow will not recede below 90 cfs; the dates given here are for the event that the flow does recede below 90 cfs.
LAKE COUNTY AND GOOSE LAKE BASINS
FORECAST POINT
FORECAST THRESHOLD
FORECAST VALUE ------------- CHANCE OF EXCEEDING -----
------
LONG-TERM AVERAGE VALUE
90% 50% 10%
Deep Ck ab Adel 100 cfs Jun 22 Jul 9 Jul 28 June 17
Honey Ck nr Plush 100 cfs Apr 30 May 31 Jul 1 May 16
Honey Ck nr Plush 50 cfs May 24 Jun 20 Jul 17 June 4
Twentymile Ck nr Adel 50 cfs Jun 6 Jul 4 Aug 2 May 30
Twentymile Ck nr Adel 10 cfs Jul 12 Aug 2 Aug 22 July 7
HARNEY BASIN
FORECAST POINT
FORECAST THRESHOLD
FORECAST VALUE ------------- CHANCE OF EXCEEDING -----
------
LONG-TERM AVERAGE VALUE
90% 50% 10%
Silvies R nr Burns 400 cfs Apr 26 May 17 Jun 7 May 21
Silvies R nr Burns 200 cfs May 10 Jun 2 Jun 25 June 2
Silvies R nr Burns 100 cfs May 25 Jun 18 Jul 12 June 13
Silvies R nr Burns 50 cfs Jun 16 Jul 12 Aug 7 July 3
Donner Und Blitzen R nr Frenchglen
200 cfs Jun 3 Jun 22 Jul 11 June 20
Donner Und Blitzen R nr Frenchglen
100 cfs Jun 26 Jul 12 Jul 28 July 9
33
Basin Outlook Reports: How Forecasts Are Made
Federal – State – Private Cooperative Snow Surveys
For more water supply and resource management information, contact:
USDA, Natural Resources Conservation Service Snow Survey Office 1201 NE Lloyd Suite 900 Portland, OR 97232 Phone: (503) 414-3271 Web site http://www.or.nrcs.usda.gov/snow
Most of the annual streamflow in the western United States originates as snowfall that has accumulated in the mountains during the winter and early spring. As the snowpack accumulates, hydrologists estimate the runoff that will occur when it melts. Measurements of snow water equivalent at selected manual snow courses and automated SNOTEL sites, along with precipitation, antecedent streamflow, and indices of the El Niño / Southern Oscillation are used in computerized statistical and simulation models to prepare runoff forecasts. Unless otherwise specified, all forecasts are for flows that would occur naturally without any upstream influences
Forecasts of any kind, of course, are not perfect. Streamflow forecast uncertainty arises from three primary sources: (1) uncertain knowledge of future weather conditions, (2) uncertainty in the forecasting procedure, and (3) errors in the data. The forecast, therefore, must be interpreted not as a single value but rather as a range of values with specific probabilities of occurrence. The middle of the range is expressed by the 50% exceedance probability forecast, for which there is a 50% chance that the actual flow will be above, and a 50% chance that the actual flow will be below, this value. To describe the expected range around this 50% value, four other forecasts are provided, two smaller values (90% and 70% exceedance probability) and two larger values (30%, and 10% exceedance probability). For example, there is a 90% chance that the actual flow will be more than the 90% exceedance probability forecast. The others can be interpreted similarly.
The wider the spread among these values, the more uncertainty is in the forecast. As the season progresses, forecasts become more accurate, primarily because a greater portion of the future weather conditions become known; this is reflected by a narrowing of the range around the 50% exceedance probability forecast. Users should take this uncertainty into consideration when making operational decisions by selecting forecasts corresponding to the level of risk they are willing to assume about the amount of water to be expected. If users anticipate receiving a lesser supply of water, or if they wish to increase their chances of having an adequate supply of water for their operations, they may want to base their decisions on the 90% or 70% exceedance probability forecasts, or something in between. On the other hand, if users are concerned about receiving too much water (for example, threat of flooding), they may want to base their decisions on the 30% or 10% exceedance probability forecasts, or something in between. Regardless of the forecast value users choose for operations, they should be prepared to deal with either more or less water. Users should remember that even if the 90% exceedance probability forecast is used, there is still a 10% chance of receiving less than this amount. By using the exceedance probability information, users can easily determine the chances of receiving more or less water.
34
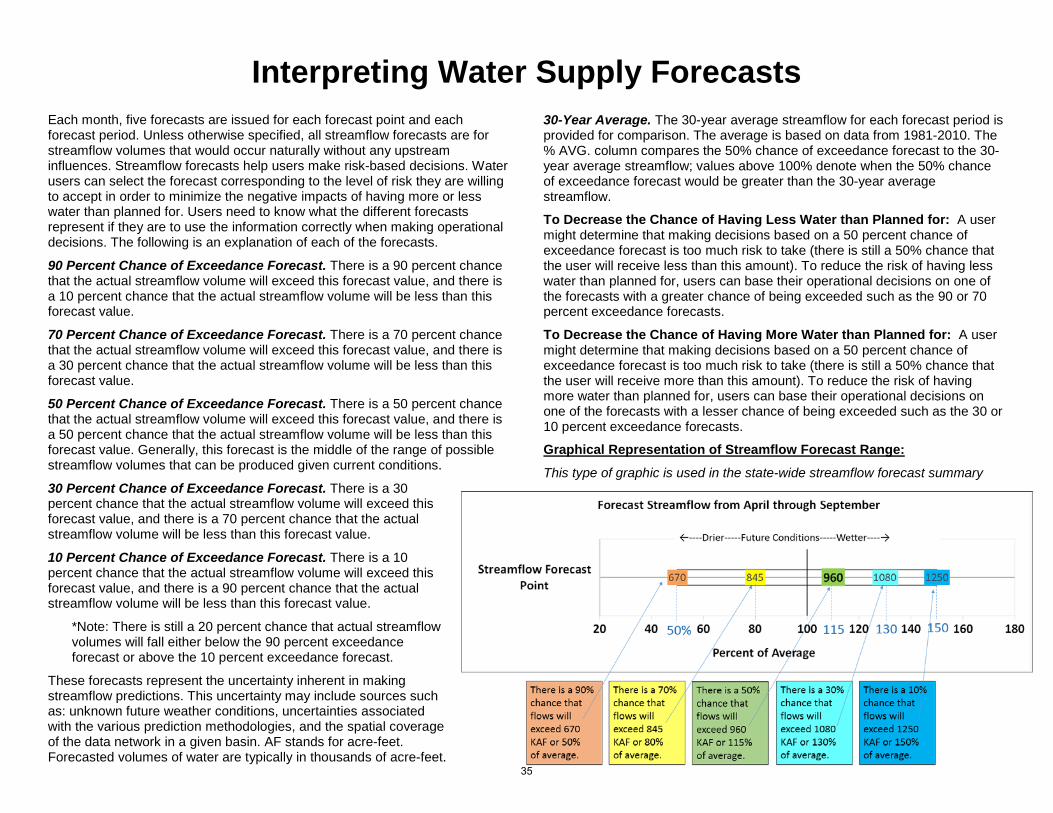
Interpreting Water Supply Forecasts
Each month, five forecasts are issued for each forecast point and each forecast period. Unless otherwise specified, all streamflow forecasts are for streamflow volumes that would occur naturally without any upstream influences. Streamflow forecasts help users make risk-based decisions. Water users can select the forecast corresponding to the level of risk they are willing to accept in order to minimize the negative impacts of having more or less water than planned for. Users need to know what the different forecasts represent if they are to use the information correctly when making operational decisions. The following is an explanation of each of the forecasts.
90 Percent Chance of Exceedance Forecast. There is a 90 percent chance that the actual streamflow volume will exceed this forecast value, and there is a 10 percent chance that the actual streamflow volume will be less than this forecast value.
70 Percent Chance of Exceedance Forecast. There is a 70 percent chance that the actual streamflow volume will exceed this forecast value, and there is a 30 percent chance that the actual streamflow volume will be less than this forecast value.
50 Percent Chance of Exceedance Forecast. There is a 50 percent chance that the actual streamflow volume will exceed this forecast value, and there is a 50 percent chance that the actual streamflow volume will be less than this forecast value. Generally, this forecast is the middle of the range of possible streamflow volumes that can be produced given current conditions.
30 Percent Chance of Exceedance Forecast. There is a 30 percent chance that the actual streamflow volume will exceed this forecast value, and there is a 70 percent chance that the actual streamflow volume will be less than this forecast value.
10 Percent Chance of Exceedance Forecast. There is a 10 percent chance that the actual streamflow volume will exceed this forecast value, and there is a 90 percent chance that the actual streamflow volume will be less than this forecast value.
*Note: There is still a 20 percent chance that actual streamflowvolumes will fall either below the 90 percent exceedance forecast or above the 10 percent exceedance forecast.
These forecasts represent the uncertainty inherent in making streamflow predictions. This uncertainty may include sources such as: unknown future weather conditions, uncertainties associated with the various prediction methodologies, and the spatial coverage of the data network in a given basin. AF stands for acre-feet. Forecasted volumes of water are typically in thousands of acre-feet.
30-Year Average. The 30-year average streamflow for each forecast period is provided for comparison. The average is based on data from 1981-2010. The % AVG. column compares the 50% chance of exceedance forecast to the 30-year average streamflow; values above 100% denote when the 50% chance of exceedance forecast would be greater than the 30-year average streamflow.
To Decrease the Chance of Having Less Water than Planned for: A user might determine that making decisions based on a 50 percent chance of exceedance forecast is too much risk to take (there is still a 50% chance that the user will receive less than this amount). To reduce the risk of having less water than planned for, users can base their operational decisions on one of the forecasts with a greater chance of being exceeded such as the 90 or 70 percent exceedance forecasts.
To Decrease the Chance of Having More Water than Planned for: A user might determine that making decisions based on a 50 percent chance of exceedance forecast is too much risk to take (there is still a 50% chance that the user will receive more than this amount). To reduce the risk of having more water than planned for, users can base their operational decisions on one of the forecasts with a lesser chance of being exceeded such as the 30 or 10 percent exceedance forecasts.
Graphical Representation of Streamflow Forecast Range:
This type of graphic is used in the state-wide streamflow forecast summary
35
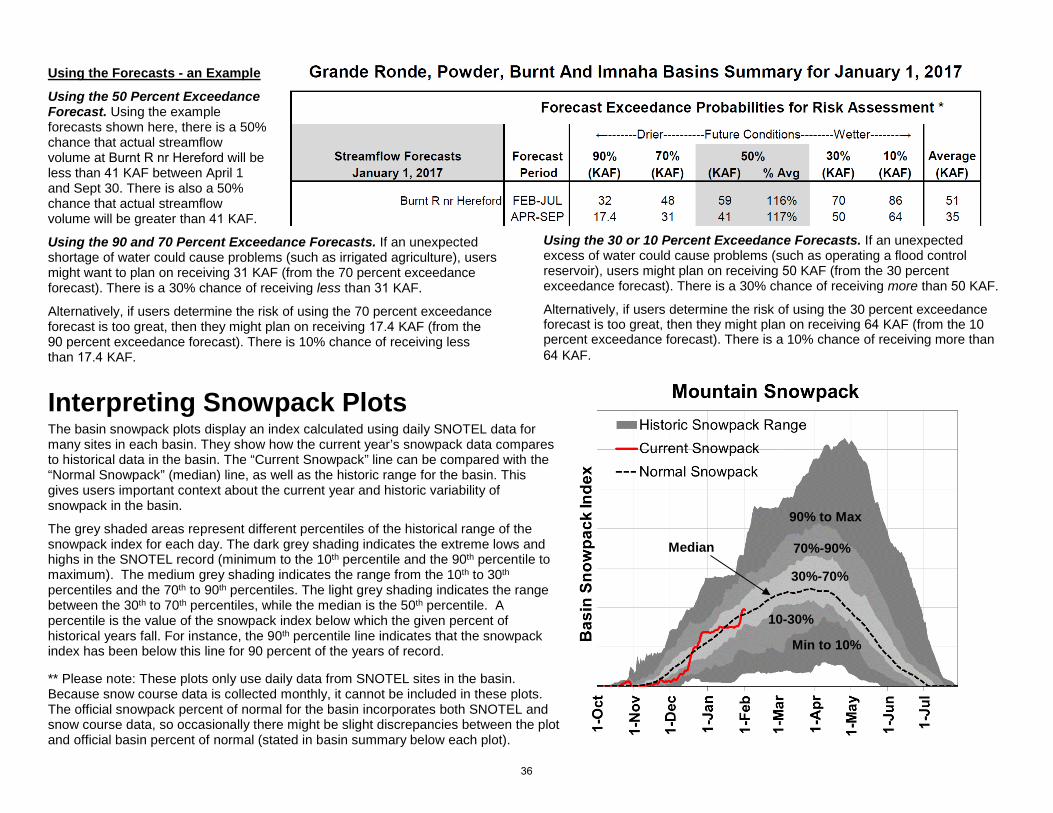
Using the Forecasts - an Example
Using the 50 Percent Exceedance Forecast. Using the example forecasts shown here, there is a 50% chance that actual streamflow volume at Burnt R nr Hereford will be less than 41 KAF between April 1 and Sept 30. There is also a 50% chance that actual streamflow volume will be greater than 41 KAF.
Using the 90 and 70 Percent Exceedance Forecasts. If an unexpected shortage of water could cause problems (such as irrigated agriculture), users might want to plan on receiving 31 KAF (from the 70 percent exceedance forecast). There is a 30% chance of receiving less than 31 KAF.
Alternatively, if users determine the risk of using the 70 percent exceedance forecast is too great, then they might plan on receiving 17.4 KAF (from the 90 percent exceedance forecast). There is 10% chance of receiving less than 17.4 KAF.
Using the 30 or 10 Percent Exceedance Forecasts. If an unexpected excess of water could cause problems (such as operating a flood control reservoir), users might plan on receiving 50 KAF (from the 30 percent exceedance forecast). There is a 30% chance of receiving more than 50 KAF.
Alternatively, if users determine the risk of using the 30 percent exceedance forecast is too great, then they might plan on receiving 64 KAF (from the 10 percent exceedance forecast). There is a 10% chance of receiving more than
64 KAF.
Interpreting Snowpack Plots The basin snowpack plots display an index calculated using daily SNOTEL data for many sites in each basin. They show how the current year’s snowpack data compares to historical data in the basin. The “Current Snowpack” line can be compared with the “Normal Snowpack” (median) line, as well as the historic range for the basin. This gives users important context about the current year and historic variability of snowpack in the basin.
The grey shaded areas represent different percentiles of the historical range of the snowpack index for each day. The dark grey shading indicates the extreme lows and highs in the SNOTEL record (minimum to the 10th percentile and the 90th percentile to maximum). The medium grey shading indicates the range from the 10th to 30th percentiles and the 70th to 90th percentiles. The light grey shading indicates the range between the 30th to 70th percentiles, while the median is the 50th percentile. A percentile is the value of the snowpack index below which the given percent of historical years fall. For instance, the 90th percentile line indicates that the snowpack index has been below this line for 90 percent of the years of record.
** Please note: These plots only use daily data from SNOTEL sites in the basin. Because snow course data is collected monthly, it cannot be included in these plots. The official snowpack percent of normal for the basin incorporates both SNOTEL and snow course data, so occasionally there might be slight discrepancies between the plot and official basin percent of normal (stated in basin summary below each plot).
Min to 10%
10-30%
30%-70%
70%-90%
90% to Max
Median
36
USDA Natural Resources Conservation Service 1201 NE Lloyd Suite 900 Portland, OR 97232-1274
Official Business
This publication may be found online at: http://www.or.nrcs.usda.gov/snow
Issued by Leonard Jordan, Acting Chief Natural Resources Conservation Service U.S. Department of Agriculture
Released by Ron Alvarado, State Conservationist Natural Resources Conservation Service Portland, Oregon
IMPORTANT NOTICE
WE ARE NOW OFFERING AN EMAIL SUBSCRIPTION FOR THE OREGON BASIN OUTLOOK REPORT
If you would like to receive this document in PDF format via an email announcement, please sign up on our website to update your subscription preference.
You will receive an email each month as soon as the report is published with a link to the PDF document on our website. By choosing this paperless option, you will receive your
water supply information much faster and also help us save natural resources by reducing our hardcopy printing.
If you would like to update your subscription, please sign up on our website by clicking the email updates link on the left hand side of the webpage:
Snow Survey Homepage:
http://www.or.nrcs.usda.gov/snow
37