Embed Size (px)
Citation preview
Bruce SorteCommunity Economist
Bruce WeberProfessor and Extension Economist
Department of Agricultural and Resource Economics Oregon State University
Oregon Agriculture
and the EconomyOregon State University Extension Service
Rural Studies Program
Special Report 1080February 2008

Contents Introduction .....................................................................................................................................1Farm and Ranch Production ............................................................................................................3Farmgate Sales ................................................................................................................................9Processing .....................................................................................................................................10Agricultural Support Services, Wholesale Trade, Transportation and Warehousing,
and Retail Trade .......................................................................................................................12Economic Footprint ........................................................................................................................14Oregon’s Economic Dependence on Agriculture ............................................................................15Implications for Agriculture and Oregon ........................................................................................19
References .....................................................................................................................................20
TablesTable 1.—Oregon farm profiles (1997, 2002, 2005) .........................................................................3Table 2.—Profile of farms in three Oregon counties (2004)..............................................................5Table 3.—Number of Oregon farms by type (2002) ..........................................................................6Table 4.—Oregon farmland acreage by farm type (2002) .................................................................7Table 5.—Change in Oregon agricultural commodity sales 2004–2005 ............................................9Table 6.—Oregon agricultural processing in food, fiber, and related products (2005) ....................11Table 7.—Oregon agricultural output, employment, and value added (2005) .................................13Table 8.—Oregon agriculture’s economic footprint (2005) .............................................................14Table 9.—Exogenous demand for Oregon agriculture (2005) .........................................................15Table 10.—Summary of Oregon agricultural economic impacts (2005) .........................................16Table 11.—Oregon agricultural value-added economic impacts detail (2004–2005) ......................17
FiguresFigure 1.—Percentage of Oregon farms by type (2002) ...................................................................6Figure 2.—Percentage of Oregon farmland acreage by type (2002) .................................................7Figure 3.—Oregon agricultural land use (2005) ................................................................................8Figure 4.—Oregon agricultural commodity sales (2005) ................................................................10Figure 5.—Oregon agricultural processing: sectors with more than 1,000 jobs
as percentage of total employment ...........................................................................................12
AcknowledgmentsThe authors thank the Oregon Department of Agriculture (ODA) for its support of this project and the helpful ideas and perspectives provided by Brent Searle, Special Assistant to the ODA Director. We also appreciate the reviews and suggestions provided by Linda Brewer, Senior Faculty Research Assistant, and Greg Perry, Professor and Interim Department Head, in the Department of Agricultural and Resource Economics, Oregon State University; and William Lazarus, Professor of Applied Economics, University of Minnesota. Their comments improved the theoretical integrity and clarity of the report.Cover photos by Lynn Ketchum, editing and production by Ariel Ginsburg and Andrea Dailey; Department of Extension & Experiment Station Communications, Oregon State University.

1
IntroductionAgriculture in Oregon is changing rapidly in ways that are very similar to the changes in other industries. Agricultural producers, scientists, and teachers have worked together to reach high levels of efficiency that could not have been imagined 150 years ago in Oregon—or even 25 years ago, when agriculture was struggling through its worst downturn since the 1930s.
Globalization has provided market opportunities to some producers and severe competition to others. While consumers have been quite pleased with changes that have allowed them to spend ever-smaller portions of their income for agricultural products, producers have struggled to maintain sufficient profit margins while using sustainable production processes. Convincing young people that agriculture is the place to spend their future remains a challenge.
Policies that support and regulate agriculture play a large role in these changes. Policy makers consider an industry’s economic impacts as they make their decisions. Economists typically measure economic impacts in terms of sales, jobs, or value of added contributions to the economy. Industries that can demonstrate the largest impacts and/or fastest growth receive considerable attention and encouragement from policy decisions. As industries like agriculture become more efficient and provide products and services at lower costs, the growth of their economic impacts as traditionally measured is slower than in newer industries that have not matured to agriculture’s levels of efficiency.
Agriculture and forestry were the primary economic engines of the Oregon economy for more than 100 years. Though a number of other industries now share that role, it should be remembered as we progress through this analysis that achieving and maintaining high levels of efficiency for necessities such as food, fiber, and fuel create the foundation for a standard of living that allows increasing portions of income and time to be allocated to civic, cultural, and recreational pursuits.
This report provides economic impact measures based on sales, employment, and value added—and it goes beyond those traditional measures as well. It also describes the scope
Employment in natural resources and mining actually increased as a percentage of employment in 2005. This is due to the continuing strength of Oregon’s agricultural economy. Despite the growth in agriculture, food manufacturing employment declined due to improved productivity, mechanization, and import competition.
Michael Meyers Oregon Labor Market Information System
October 27, 2006

2
and diversity of the agriculture industry and discusses the challenges that may lie ahead for maintaining and even increasing agriculture’s economic impacts.
In this analysis we: Profile agriculture •Estimate agriculture’s “economic footprint” •Calculate the extent to which Oregon’s economy depends on agriculture or •agriculture’s economic impacts Discuss the challenges agriculture faces in maintaining its pivotal role in Oregon’s •economy
It is important to remember that the metrics in the tables and figures throughout this report are different ways of describing agriculture. While they can be considered together for a comprehensive summary of agriculture, the individual metrics should not be added together.
This report generally follows the format of and updates information in Agriculture and the Oregon Economy (SR 1014, OSU Extension Service) by Jim Cornelius, David Holland, Edward Waters, and Bruce Weber, in 2000.

3
Farm and Ranch ProductionWe define agriculture broadly to include activities necessary to cultivate, harvest, and process biologically based products. This section describes primary agricultural production, including fishing. Processing and other aspects of the agricultural industry are discussed in the next section.
The United States has formally gathered information to describe agriculture since the first Decennial Census in 1790 (when 94.9 percent of people lived in rural areas) through the most recent Decennial Census in 2000 (when an estimated 21 percent lived in rural areas in both the U.S. in general and Oregon specifically). The first Census of Agriculture (Ag Census) was taken as part of the 1840 Decennial Census. The Ag Census is completed every 5 years, and portions of it are updated every year.
The types of data collected in each census have become more extensive over time. Definitions and data-gathering techniques have changed regularly to match the diversification of the agriculture industry.
For this report, we have used the most recent complete Ag Census (2002, issued in 2004) and any partial updates that have been completed since 2004. Our definition of a farm
Table 1.—Oregon farm profiles (1997, 2002, 2005).
Category 1997 2002 2005
Total land in agriculture (acres) 17,658,213 17,200,000 17,100,000Total ag land & buildings value ($000) 17,744,663 20,383,264 20,383,264Average value/acre ($) 1,005 1,185 1,192
Number of farms 39,975 40,033 39,300Average farm size (acres) 442 430 435
Market value of farm sales ($000) 3,890,848 3,798,435 4,725,064Purchased inputs ($000) -1,738,004 -1,802,943 -1,904,708Net govt. payments to farmers minus taxes ($000) -44,715 -14,935 -5,637Gross value added ($000) 2,108,129 1,980,557 2,814,719Capital consumption ($000) -340,608 -370,910 -428,763Net value added ($000) 1,767,521 1,609,647 2,385,956Payments for labor, landlords, & lenders ($000) -1,101,280 -1,114,051 -1,333,039Net farm income ($000) 666,241 495,596 1,052,917Average gross sales/acre ($) 220 221 276Average net income/farm ($) 16,666 12,380 26,792Average net income/acre ($) 38 29 62
Sources: U.S. Department of Agriculture, 1997 Census of Agriculture (1999) and 2002 Census of Agriculture (2004); and U.S. Department of Agriculture/Economic Research Service, Farm Income: Data Files, May 2007.

4
comes from the 2002 Ag Census: “…agricultural places that produce and sell, or would normally sell, $1,000 or more of agricultural products [per year].”
As Table 1 indicates, Oregon agricultural acreage decreased 3.16 percent between 1997 and 2005, the number of farms declined by 1.6 percent, and the average size of a farm declined by 1.6 percent as well. This is a continuing trend, as farms larger than 50 acres have decreased in number and total acreage. The decline has been slowed to some degree by the increase in number of adaptive farms of fewer than 50 acres. Adaptive farms are typically smaller farms that produce a variety of outputs and initially are not intended to be the primary source of household income.
Still, the changes seem smaller than might be expected given the commodity price fluctuations during the period and the pressure from residential development, particularly in the Willamette Valley, where farmgate sales dollars are highest statewide. Farmgate sales are grower sales from primary agricultural production.
While the declining average size of Oregon farms remains a concern, the potential of adaptive farms to grow into larger commercial operations may be underestimated. A recent USDA study showed that adaptive farms tend to have average gross sales per acre that are about twice as high as the overall average, their average age of operator is lower than for farmers in general, and the number of their off-farm work days tends to decline over time (Newton 2005). Vineyards, nursery and tree products, vegetables and melons, floriculture, other noncitrus fruit, and tree-nut farming were more likely than other types of farming to follow this trend.
Throughout this report, we summarize agricultural statistics to report information concisely for all of Oregon. Combining information from an industry as diverse as agriculture and a state as varied as Oregon leaves out some important distinctions that must be remembered as we evaluate the economic impacts of agriculture. To illustrate these distinctions, consider three counties that represent areas from the Pacific Ocean to the Idaho border. Table 2 (page 5) profiles the differences in farms and agricultural production in Tillamook, Sherman, and Malheur counties.

5
Table 2.—Profile of farms in three Oregon counties (2004).
Tillamook Sherman Malheur
Number of farms 333 210 1,272Land in farms (acres) 39,526 507,705 1,175,280Land in farms (%) 5.60 96.40 18.60Average farm size (acres) 119 2,418 924Market value of land & buildings ($000) 557,675 187,605 699,988Average value/acre ($) 14,109 370 596Total net farm income from operations ($000) 25,000 6,051 37,053Average income/farm ($000) 75 29 29Average income/acre ($) 632 12 32Average income/acre divided by average value/acre (%) 4.48 3.23 5.29
Jobs directly employed in farm production (%) 7.76 27.16 23.77Sources: U.S. Department of Agriculture, 2002 Census of Agriculture—County Data, June 2004; and Minnesota Implan Group, Inc. IMPLAN 2004 Data.
Farms are classified by type in Table 3 (page 6) and are shown graphically in Figure 1 (page 6) following the recently implemented North American Industrial Classification System (NAICS). Two sectors have shown small increases: greenhouse, nursery, and floriculture production, increasing from 10.5 percent in 1997 to 10.7 percent in 2002; and fruit and nut farming, increasing from 9.8 percent in 1997 to 10 percent in 2002.

6
Table 3.—Number of Oregon farms by type (2002).
Type
Units
Share (%)
Cattle ranching & farming 13,345 33.3Other crop farming (hay, mint, other crops) 6,570 16.4Horse & other equine production 5,013 12.5Greenhouse, nursery, & floriculture production 4,291 10.7Fruit & nut farming 3,995 10.0Sheep & goat farming 1,816 4.5Other animal production 1,768 4.4Grain farming 1,105 2.8Vegetable farming 974 2.4Poultry & egg production 622 1.6Hog & pig farming 534 1.3Total 40,033 100.0
Source: U.S. Department of Agriculture, 2002 Census of Agriculture, Table 50, June 2004.
Figure 1.—Percentage of Oregon farms by type (2002).
Source: U.S. Department of Agriculture, 2002 Census of Agriculture, Table 50, June 2004.
Grain farming 2.8%
Fruit & nut farming 10.0%
Vegetable farming 2.4%Other animal production 4.4%
Horse & other equine production 12.5%
Sheep & goat farming 4.5%Greenhouse, nursery, & floriculture production 10.7%
Other crop farming (hay, mint, other crops) 16.4%
Cattle ranching & farming 33.3%
Hog & pig farming 1.3%
Poultry & egg production 1.6%

7
There are 61.44 million acres in Oregon, more than 17 million (28 percent) of which are in farm and ranch production. Table 4 details how the acreage is used, and Figure 2 shows the proportion of land used by each type of farming and ranching operation. Cattle ranches and farms, which are about a third of the farms by type, use the highest number of acres at just over 10 million, or almost 60 percent. Most of the cattle ranches and farms are in arid portions of the state where acreage requirements to sustain cattle are higher.
Table 4.—Oregon farmland acreage by farm type (2002).
Type
Acres
Share (%)
Cattle ranching & farming 10,102,698 59.1Other crop farming (hay, mint, other crops) 2,520,942 14.8Grain farming 2,065,090 12.1Other animal production 734,306 4.3Horse & other equine production 582,548 3.4Vegetable farming 350,869 2.1Greenhouse, nursery, & floriculture production 256,597 1.5Fruit & nut farming 246,861 1.4Sheep & goat farming 162,158 0.9Poultry & egg production 41,348 0.2Hog & pig farming 17,005 0.1Total 17,080,422 100.0
Figure 2.—Percentage of Oregon farmland acreage by type (2002).
Other animal production 4.3% Grain farming 12.1%
Vegetable farming 2.1%
Fruit & nut farming 1.4%Greenhouse, nursery, & floriculture production 1.5%
Other crop farming (hay, mint, other crops) 14.8%
Cattle ranching & farming 59.1%
Poultry & egg production 0.2%
Hog & pig farming 0.1%
Sheep & goat farming 0.9%
Horse & other equine production 3.4%
Source: U.S. Department of Agriculture, 2002 Census of Agriculture, Table 50, June 2004.

8
If land uses are further aggregated (Figure 3), the 17.1 million agricultural acres include 5.42 million acres (31.7 percent) classified as cropland, 2.17 million acres (12.7 percent) as woodland, 8.86 million acres (51.8 percent) as pastureland, and 0.64 million acres (3.8 percent) for structures and facilities. Note that 2.54 million acres classified as cropland and woodland are used as pasture some of the time, so the total use for pasture is approximately 11.4 million acres (66.7 percent), as illustrated by the dotted lines and arrows in Figure 3.
Source: U.S. Department of Agriculture, Economic Research Service, State Facts Sheets: Oregon, March 2007. Note: Dotted lines and arrows indicate land that is used for pasture as well as cropland or woodland.
Figure 3.—Oregon agricultural land use (2005).
Pastureland 51.8% / 66.7%
Cropland 31.7%
House lots, ponds, roads, wasteland, etc. 3.8%
Woodland 12.7%

9
Farmgate SalesFarmgate sales are estimated on an annual basis by the Oregon Agricultural Information Network (OAIN) using a number of databases, including information from about 70 local Oregon State University Extension Service agents in all 36 counties. The OAIN includes local estimates from Extension Service agents in its database to distinguish and compare OAIN and Agricultural Census data.
The estimates that follow are from the preliminary 2005 data, which are compared with 2004 data. Farmgate sales of crops in 2005 were $2.92 billion and accounted for 71.7 percent of total sales. Livestock farmgate sales were $1.15 billion and accounted for 28.3 percent of total sales. The more than $200 million of growth in Oregon agriculture’s farmgate sales in just 1 year between 2004 and 2005 is significant. In addition, only 4 of 14 industries in Table 5 experienced a decrease in sales between 2004 and 2005, and those decreases were small.
Table 5.—Change in Oregon agricultural commodity sales (2004–2005).
Commodity group
2004 ($000)
2005 ($000)
Change (%)
Share of total sales (%)
Hay & forage 225,913 258,202 14.3 6.4Vegetables & truck crops 230,995 261,644 13.3 6.4Small woodland, hybrid poplars, fee hunting & recreation, and other specialty products 333,670 375,500 12.5 9.2
Grass & legumes 351,136 373,490 6.4 9.2Nursery crops, bulbs, greenhouse crops, & turf 743,689 776,410 4.4 19.1
Field crops 196,732 203,105 3.2 5.0Tree fruit & nuts 244,691 244,486 -0.1 6.0Small fruit & berries 98,658 97,205 -1.5 2.4Grains 212,522 198,829 -6.4 4.9Christmas trees 137,265 126,436 -7.9 3.1All crops 2,775,271 2,915,307 5.0 71.7Cattle & calves 592,361 619,491 4.6 15.2Dairy products 327,080 340,062 4.0 8.4Poultry 82,940 97,276 17.3 2.4Other animal products 78,699 92,333 17.3 2.3All livestock and poultry 1,081,080 1,149,162 6.3 28.3Total sales 3,856,351 4,064,469 5.4 100.0
Source: 2005 Oregon County and State Agricultural Estimates, Special Report 790-05, revised April 2006, Oregon State University Extension Service.

10
Figure 4.—Oregon agricultural commodity sales (2005).
Source: 2005 Oregon County and State Agricultural Estimates, Special Report 790-05, revised April 2006, Oregon State University Extension Service.
Poultry 2.4%
Cattle & calves 15.2%
Small woodland, hybrid poplars, fee hunting & recreation, & other specialty products 9.2%
Christmas trees 3.1%
Nursery crops, bulbs, greenhouse crops, & turf 19.1%
Vegetables & truck crops 6.4%Small fruit & berries 2.4%
Tree fruit & nuts 6.0%
Field crops 5.0%
Dairy products 8.4%
Grass & legumes 9.2%
Hay & forage 6.4%
Grains 4.9%
Other animal products 2.3%
In the 2000 report of Cornelius et al., nursery crops were 16.7 percent, dairy 7.4 percent, and beef cattle 11.6 percent of total sales. As seen in Figure 4, those industries have continued to increase their proportion of total sales. Also in the Cornelius et al. report, grains were 9.0 percent, vegetables 8.9 percent, and field crops 8.8 percent of total sales. Those sectors’ proportions of total sales have decreased.
ProcessingCrops and livestock produced on farms and fish harvested from the ocean provide the basic inputs for a large processing industry in Oregon. For clarity of presentation, we used the sectoring system of the basic IMPLAN (IMpact PLANning) input/output model. We aggregated 41 processing sectors into 22 sectors in Table 6 (page 11) and sorted them in descending order by value of output. We have included all the processing sectors that do or could use agricultural inputs. Most of the processing sectors are modest in size, and some may not be using significant amounts of Oregon agricultural inputs at the current time. Yet, traditionally they have been considered part of the agricultural processing industry and, with changes in markets or policies, their use of Oregon agricultural inputs may again become significant.
Four sectors make up more than half (51 percent) of processing output in Oregon: frozen food manufacturing ($1,724,056,000); dairy ($1,250,557,000); fruit and vegetable canning and drying ($1,127,602,000); and baked goods, pasta, and tortilla manufacturing ($840,672,000).

11
Table 6.—Oregon agricultural processing in food, fiber, and related products (2005).
Industry
Output ($000) Sales
Employment Full- & part-
time jobs
Value added ($000)
Frozen food manufacturing 1,724,056 6,421 393,226Dairy 1,250,557 2,161 162,758Fruit & vegetable canning & drying 1,127,602 2,758 223,689Bakery goods, pasta, & tortilla mfg. 840,672 4,601 323,647Meat processing 817,905 2,048 103,043Breweries, wineries, & distilleries 687,986 1,732 161,751Soft drink & ice mfg. 558,947 1,047 93,679All other food mfg. 269,474 1,075 51,064Seafood product preparation & packaging 240,188 1,006 28,691Coffee & tea mfg. 239,169 489 27,833Food milling 228,438 308 29,307Roasted nuts, peanut butter, & snack food mfg. 222,016 422 57,537Breakfast cereal mfg. 219,207 247 16,574Animal food mfg. 212,123 307 20,275Fabric, carpet, curtain, & other mills 206,627 1,447 66,553Apparel mfg. 189,596 1,630 52,133Confectionery mfg. 137,150 461 25,278Sugar mfg. 130,727 248 12,217Flavoring syrup, dressings, sauces, & spices mfg. 121,515 258 31,731Soybean processing 94,482 37 1,983Leather tanning, finishing, & product mfg. 89,455 675 23,984Fats & oils refining & blending 58,209 42 2,896Total 9,666,099 29,420 1,909,850
Source: Minnesota Implan Group, Inc. IMPLAN 2004 Data
In Figure 5 (page 12), we show all food processing sectors with more than 1,000 jobs, which are shown as a percentage of total food processing employment. The sectors with fewer than 1,000 jobs are included in “All other processing.” These jobs vary within and between sectors from very seasonal part-time jobs to year-round, full-time jobs.
Five sectors together account for 60 percent of all jobs in agricultural processing: frozen food manufacturing (21 percent); baked goods, pasta, and tortilla manufacturing (16 percent); fruit and vegetable canning and drying (9 percent); dairy (7 percent); and meat processing (7 percent).

12
Figure 5.—Oregon agricultural processing: sectors with more than 1,000 jobs as percentage of total employment.
Source: Minnesota Implan Group, Inc. IMPLAN 2004 Data
Frozen food mfg. 21%
Fruit & vegetable canning & drying 9%
Dairy 7%
Bakery goods, pasta, & tortilla mfg. 16%
Meat processing 7%
Breweries, wineries, & distilleries 6%
Soft drink & ice mfg. 4%Other processing 16%
Seafood product preparation & packaging 3%
Apparel mfg. 6%
Fabric, carpet, curtain, & other mills 5%
Agricultural Support Services, Wholesale Trade, Transportation and Warehousing, and Retail TradeFour major sectors provide producer and processor specialized services, an extensive distribution and marketing network, and multiple modes of transportation to get agricultural products to markets. Those sectors are agricultural support services (e.g., well drilling); wholesale trade; transportation (land, air, and water) and warehousing; and retail trade.
These industries’ economic relationships to agriculture are not regularly reported on a separate basis. Economic discussions typically focus on producer prices for a specific industrial sector. However, large portions of the wholesale trade, transportation and warehousing, and retail trade industries’ expenditures bring agricultural products and services to the consumer. Those expenditures are added to producer prices to establish the final retail prices that consumers pay.
We used IMPLAN margins that are estimates of the percentages of wholesale and retail prices attributable to wholesale trade, transportation and warehousing, and retail trade activity. Based on those margins or percentages, we determined the portion of the

13
wholesale trade, transportation and warehousing, and retail trade sectors that are engaged in the distribution and sale of agricultural goods and services.
Table 7 brings together all six major parts of the agricultural industry: production, processing, agricultural support services, wholesale trade, transportation and warehousing, and retail trade. It provides the output (sales), employment (full- and part-time jobs), and value-added expenditures (employee compensation, proprietor income, special business taxes, and leases and rents) for each part of the industry to give a summary of the direct economic activity of the agricultural industry in Oregon.
Table 7.—Oregon agricultural output, employment, and value added (2005).
Aggregated sector
Output ($000) Sales
Employment Full- & part-
time jobs
Value added ($000)
Production 4,209,375 66,367 2,805,904Processing 9,666,099 29,420 1,909,850Agricultural support services 335,080 10,160 190,252Wholesale trade 1,493,853 8,883 1,021,141Transportation & warehousing 489,671 4,670 273,785Retail trade 1,723,678 27,145 1,100,909Total agriculture 17,917,756 146,645 7,301,841Total all Oregon sectors 242,673,884 2,116,589 129,937,290Portion agriculture (%) 7.38 6.93 5.62

14
Economic Footprint The direct expenditures and employment profiled in Table 7 are associated with a number of other expenditures and jobs in the Oregon economy. Each of the listed agricultural sectors purchases a wide range of inputs from suppliers. These purchases are the indirect expenditures associated with the agricultural industry. Another type of expenditure includes those that members of households make when they receive their salaries or other income from businesses directly or indirectly related to agriculture. These are induced expenditures that include purchases for food, medical services, retail goods, and many others.
While all these linked industries do not necessarily depend on exports from the agricultural industry, they are likely to be disrupted if the agricultural industry experiences an economic shock, such as a serious drop in prices and resulting drop in production.
The output, employment, and value-added measures of these direct, indirect, and induced expenditures are the “economic footprint” of the agriculture industry in Oregon. They are summarized in Table 8.
In compiling Table 8, it was important to avoid double counting (e.g., counting commodity inputs as part of production final sales and also as inputs or part of processing’s economic footprint). We avoided double counting by, for example:
Counting farmgate sales separately if they were sold directly to the consumer or •exported. If these sales were inputs to a processing sector, they were counted in the processing sector.
Table 8.—Oregon agriculture’s economic footprint (2005).
Aggregated sector
Output ($000) Sales
Employment Full- & part-time
jobs
Value added ($000)
Production, processing, & agricultural support services 18,846,703 142,898 8,031,841Wholesale trade 2,933,782 22,247 1,894,516Transportation & warehousing 916,250 8,753 516,352Retail trade 3,073,815 40,613 1,892,439Total agriculture 25,770,550 214,511 12,335,149 Total all Oregon sectors 242,673,884 2,116,589 129,937,290Portion agriculture (%) 10.62 10.13 9.49
15
Counting wholesale-trade and transportation-and-warehousing margins for a •processed commodity only as an input to the respective processing sector’s producer price. We assumed that exports of agricultural goods and services would be at wholesale prices, so no retail trade component or margin is included for exports. Since the linkages were particularly difficult to attribute uniquely to one sector among production, processing, and agricultural support services, they are combined in Table 8.
Oregon’s Economic Dependence on AgricultureDetermining what “drives” the Oregon economy, or the extent to which each major industrial sector is critical to that economy, can be estimated in a number of ways. One approach, called export base theory, suggests that economies are primarily dependent on the goods and services they can export to bring in outside money to maintain growth and economic vitality. The IMPLAN model we used for this report is an input/output model that relies on export base theory. We used it to calculate how a change in demand from outside Oregon (or exogenous demand) can cause economic changes in Oregon. These changes (known as respending) are often called the ripple effect. An estimate of the size of the respending caused by a change in exogenous demand as it ripples through the economy is called the multiplier.
In addition to the goods and services that are currently exported from Oregon, the economy also depends on transfer payments, such as Social Security, and on dividend and interest payments from investments initiated in the past.
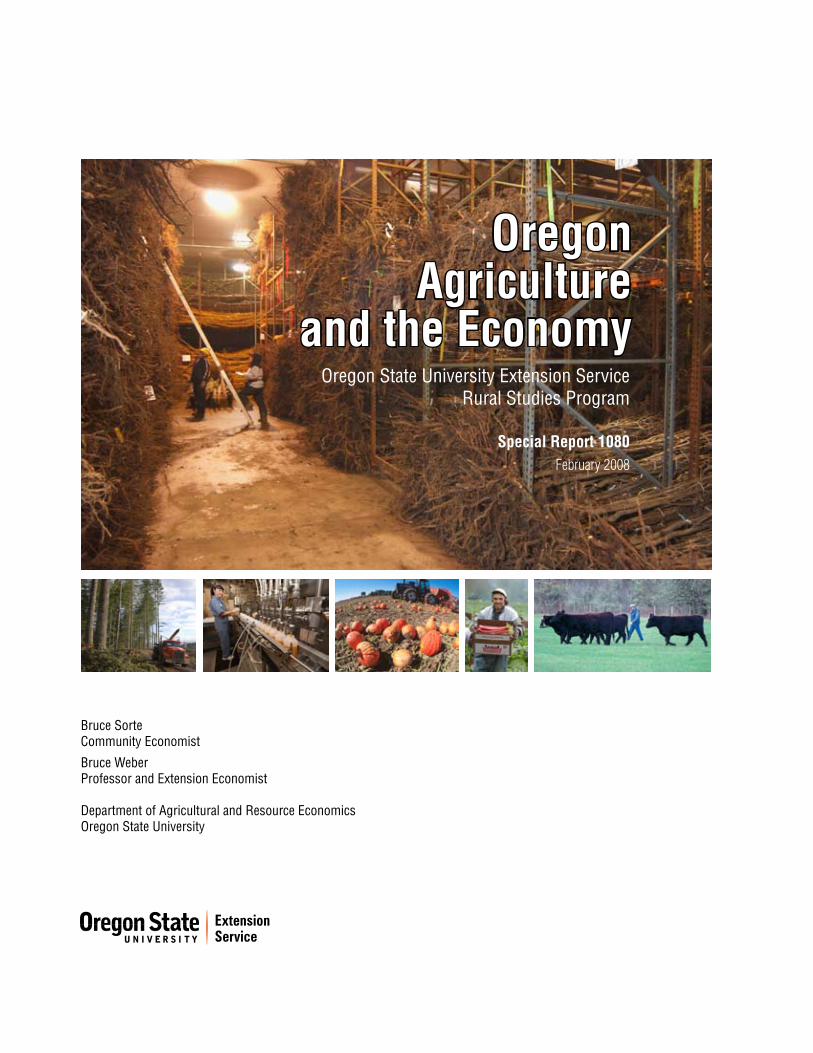
Table 9 shows the exogenous demand for goods and services related to the major parts of agriculture in Oregon.
We estimated the impacts of the exogenous demand for agriculture throughout the Oregon economy and summarized those impacts in Table 10. These calculations were
Table 9.—Exogenous demand for Oregon agriculture (2005).
Aggregated sector
Total ($000)
Share (%)
Production 2,311,450 2.26Processing 6,244,602 6.10Agriculture support activities 13,105 0.01Wholesale trade 1,251,992 1.22Transportation & warehousing 388,636 0.38Total agriculture 10,209,786 9.98Total all Oregon sectors 102,337,600 100.00

16
made by analyzing the changes from the 75 sectors in the IMPLAN model that are related through suppliers or consumers of agricultural goods and services.
The amounts in Table 10 are smaller than those in Table 8 because Table 8 shows all the expenditures in the Oregon economy that are related to agriculture both in and outside Oregon (exports). As mentioned above, any changes to an economic footprint (Table 8) can disrupt an economy in the short run. However, according to export base theory, structural changes (e.g., contraction of the economy due to a negative economic shock) are likely only if exports are affected, causing an economic impact (Table 10).
Table 10.—Summary of Oregon agricultural economic impacts (2005).
Aggregated Sector
Output ($000) Sales
Employment Full- & part-time
jobs
Value added ($000)
Production 3,446,712 47,854 2,495,910Processing 11,089,392 62,389 3,901,441Agricultural support services 24,708 525 13,962Wholesale trade 2,062,631 15,641 1,331,962Transportation & warehousing 723,456 6,911 407,703Total agriculture 17,346,900 133,320 8,150,979Total all Oregon sectors 242,673,884 2,116,589 129,937,290Portion agriculture (%) 7.15 6.30 6.27
In Table 11 (pages 17–18), we provide a more detailed summary of the value-added economic impacts from Table 10. Value-added includes employee compensation, proprietor income, other property income (rents and leases), and indirect business taxes. The columns in Table 11 show the economic impacts of each agricultural sector on itself, the other agricultural sectors, and nonagricultural sectors. The sectors are aggregated at the NAICS two-digit level.

Tabl
e 11
.—O
rego
n ag
ricu
ltura
l val
ue-a
dded
eco
nom
ic im
pact
s de
tail
(200
5).
Gre
enho
use
&
nur
sery
673,
407
720
295
9862
302
1,39
747
827
81,
321
3,32
512
430
483
530
2
Crop
s2,
200
974,
561
18,9
3934
18,
277
95,9
4314
4,27
320
,202
9,72
016
,654
19,0
6576
187
2,06
679
7
Live
stoc
k1,
061
850
42,8
4217
384
790
712
,360
44,3
3733
81,
796
2,69
533
814
11,
142
435
Com
mer
cial
fis
hing
3424
450
,315
1321
173
571
830
107
142
16
Feed
76
127
116
,230
545
133
29
92
110
3
Gra
ins
& s
ugar
33
2540
639
763
,747
460
7719
738
220
08
139
16
Froz
en
& c
anne
d fo
ods
110
7811
2533
108
489,
141
185
125
2,40
760
821
213
149
Dai
ry, m
eat,
&
sea
food
1,15
181
915
920
71,
200
1,18
814
,892
63,9
7043
01,
478
469
300
211,
378
526
Bake
d go
ods
&
sna
cks
1,42
91,
014
131
251
146
1,39
32,
664
495
81,5
211,
591
529
269
261,
679
751
Beve
rage
s13
495
1321
431
5629
259
2718
8,70
282
252
164
64
All o
ther
food
24
917
723
5966
194
5,12
782
829
915
,741
55,0
6047
428
811
0
Clot
h &
leat
her
107
8312
2811
4919
637
2087
2667
,909
313
149
Agri
cultu
ral
supp
ort s
ervi
ces
3,74
16,
012
2,08
820
9766
21,
593
2,17
988
290
339
396,
508
125
52
Fore
stry
325
286
6275
6829
91,
202
176
9696
088
416
717
334
182
Min
ing
557
550
132
136
126
519
2,34
437
019
11,
096
263
254
1473
039
6
Util
ities
8,17
75,
974
1,84
21,
210
1,29
49,
172
29,4
675,
509
2,63
39,
299
3,05
83,
043
134
11,1
143,
565
Cons
truc
tion
1,74
11,
402
440
6,43
729
61,
948
6,23
81,
418
667
2,28
579
663
040
3,48
01,
271
Man
ufac
turi
ng
(oth
er th
an a
g.)
26,2
8628
,872
6,18
67,
764
6,97
519
,603
118,
607
16,8
799,
180
65,6
7113
,931
13,5
0682
134
,342
18,9
23
Who
lesa
le tr
ade
25,3
1922
,337
7,27
710
,630
10,2
3967
,489
222,
575
30,5
4516
,073
86,2
8726
,199
15,3
1167
084
9,55
715
,582
Prod
uctio
nPr
oces
sing
Greenhouse & nursery
Crops
Livestock
Commercial fishing
Feed
Grains & sugar
Frozen & canned foods
Dairy, meat, & seafood
Baked goods & snacks
Beverages
All other food
Cloth & leather
Ag. support services * ($000)
Wholesale trade** ($000)
Transportation & warehousing** ($000)
* Ex
porte
d**
Rel
ated
to a
gric
ultu
ral e
xpor
ts17

Tabl
e 11
(con
td.)
.—O
rego
n ag
ricu
ltura
l val
ue-a
dded
eco
nom
ic im
pact
s de
tail
(200
5).
Tran
spor
tatio
n
& w
areh
ousi
ng11
,843
9,57
63,
707
7,57
05,
988
25,6
2787
,302
12,4
597,
038
28,8
3111
,488
6,55
827
726
,273
226,
716
Ret
ail t
rade
33,9
5624
,206
3,30
66,
878
3,21
517
,379
75,3
8311
,426
7,18
327
,013
8,14
06,
528
622
45,4
9116
,490
Info
rmat
ion
4,56
43,
428
847
955
832
4,80
515
,929
3,22
51,
610
7,06
32,
282
1,61
911
411
,081
3,30
0
Fina
nce
&
insu
ranc
e22
,034
17,5
913,
612
5,11
23,
027
15,3
9557
,087
11,8
205,
743
25,8
2912
,842
5,85
044
135
,142
13,2
55
Rea
l est
ate
&
rent
al23
,625
23,9
997,
085
4,78
32,
914
14,8
1064
,102
14,9
116,
688
29,1
059,
119
6,10
640
943
,949
14,7
64
Prof
essi
onal
, sc
ient
ific,
&
tech
. ser
vice
s13
,898
11,1
834,
563
3,64
13,
758
27,2
8575
,625
14,7
647,
677
36,1
9711
,323
7,21
061
846
,736
13,0
52
Man
agem
ent o
f co
mpa
nies
4,17
03,
522
722
1,08
62,
059
10,4
4766
,823
10,7
486,
356
19,3
716,
825
4,59
697
20,0
323,
681
Adm
inis
trat
ive
&
was
te s
ervi
ces
7,77
26,
192
1,58
12,
059
1,58
48,
631
31,9
005,
873
2,96
013
,008
4,57
54,
074
170
30,7
7610
,944
Educ
atio
nal
serv
ices
(p
rivat
e)3,
910
2,79
136
068
833
31,
617
6,43
41,
189
675
2,57
189
673
271
5,18
31,
774
Hea
lth &
soc
ial
serv
ices
43,4
2530
,707
3,74
07,
436
3,30
615
,822
63,9
1011
,984
6,88
925
,170
8,89
97,
509
774
48,2
5118
,091
Arts
, rec
reat
ion,
&
ent
erta
inm
ent
4,17
82,
990
420
1,13
142
22,
117
8,08
91,
534
864
3,28
71,
183
893
855,
602
1,86
7
Acco
mm
odat
ion
&
food
ser
vice
s14
,230
10,2
191,
443
2,55
81,
540
7,77
629
,711
5,46
83,
160
12,1
144,
400
3,31
826
119
,615
7,92
4
Oth
er s
ervi
ces
13,2
449,
982
2,09
92,
369
1,72
79,
399
36,4
087,
296
3,44
313
,256
4,62
83,
683
241
20,1
127,
408
Gov
ernm
ent
55,2
1539
,575
5,77
79,
788
5,14
426
,429
103,
270
18,4
4010
,336
40,4
1614
,444
11,5
6298
666
,132
25,3
47
Tota
ls1,
002,
132
1,23
9,84
911
9,88
513
4,04
482
,257
451,
145
1,77
5,02
131
9,58
119
2,51
267
9,31
822
8,59
217
2,99
913
,962
1,33
1,96
340
7,70
3
* Ex
porte
d**
Rel
ated
to a
gric
ultu
ral e
xpor
ts
Prod
uctio
nPr
oces
sing
Greenhouse & nursery
Crops
Livestock
Commercial fishing
Feed
Grains & sugar
Frozen & canned foods
Dairy, meat, & seafood
Baked goods & snacks
Beverages
All other food
Cloth & leather
Ag. support services * ($000)
Wholesale trade** ($000)
Transportation & warehousing** ($000)
18

19
Implications for Agriculture and Oregon Farmers, ranchers, processors, distributors, and shippers have a significant impact on Oregon’s economy. When compared to national changes in agriculture, the number of Oregon farms and their agricultural acreage has remained more stable than expected for almost three decades. Agriculture still is one of the most reliable industries in Oregon in terms of sales.
A number of market trends suggest that the agriculture industry will remain healthy and continue to grow in Oregon, possibly at an increasing rate. These trends include:
More intense consumer interest in where food is grown and processed, and •consumers’ increasing preference to buy “locally,” which can be helpful to some producers and many processors. Producers who differentiate their products can gain access to a much wider market •through agricultural cooperatives. More flexible land-use policies give producers more options to manage their assets. •The number and sophistication of adaptive farms is growing, and cooperation among •producers also is growing. Communication and learning among all parts of the agricultural industry are more •effective, particularly with greater access to Internet resources in rural communities.
At the same time, global and local economic and political factors continue to increase costs and challenge agriculture:
Producers must maintain machinery, pay competitive wages, retain farmland, and •find ways to manage pests and soil fertility in ways that are acceptable to all groups participating in those decisions. As fewer people work in agriculture and related industries, there are fewer options for •young people who would like to work in agriculture and live in rural communities. Over the past 20 years, lifestyle- and recreation-based economies have filled some of •the gaps caused by technological and policy changes in rural communities’ natural-resource-based economies. But slowdowns in the housing market, higher fuel prices, and—eventually—baby boomers’ reduced discretionary spending may seriously distress those communities.Accelerating development of renewable energy is increasing commodity prices and •is giving individual growers the ability to utilize untapped assets (such as wind) and to control some of the uncertainty of their input costs, to the extent that they can grow and manufacture part of their own fuel. On the other hand, many of the new renewable-energy facilities (e.g., ethanol and wind) are owned by firms outside Oregon, which significantly reduces the economic impacts to Oregon of those developments. The momentum for trade protection is growing. As real wages decline for many •people in the U.S., there will be more pressure to protect local jobs and secure borders against illegal immigration.

20
The decline of real wages, with ever-greater inequity in the distribution of wealth, •forces consumers to become more dependent on large retail firms that purchase goods globally at lower cost and thus can keep retail prices low (90 percent of Americans live within 15 miles of a large retailer). Increasing demands for water continue to challenge agriculture in many parts of •Oregon. While there are some positive examples of collaborative efforts to bring together competing interests, there are still tensions in the western U.S. that do not exist in other states and nations with which Oregon producers must compete for markets, labor, and investments.
The strength of an industry’s economic impacts depends on where its owners reside, where it purchases its inputs, the value it adds to its products, and its ability to differentiate itself from producers in other places. Many competing locations in the U.S. and the world have a more robust set of incentives to encourage their agricultural (and other) industries than we have in Oregon. Government at all levels in Oregon can affect agriculture’s contribution to local and statewide economies by creating public policies that encourage and add incentive for local ownership, purchase of inputs locally, production of finished products rather than exporting of unfinished or raw products, and creativity to differentiate products to maximize the value added in Oregon and achieve a premium in the marketplace. Although such policies are open to equity challenges and retaliatory strategies in competing communities, states, and nations, implementing this course of action in Oregon could further increase agriculture’s economic impacts and provide critical job opportunities for people who are being left out of the new economy.
ReferencesCornelius, Jim, David Holland, Edward Waters, and Bruce Weber. 2000. Agriculture
and the Oregon Economy (Special Report 1014). Oregon State University Extension Service, OSU Rural Studies Program; Corvallis, Oregon. http://extension.oregonstate.edu/catalog/pdf/sr/sr1014.pdf
Holland, David W., Hans T. Geier, and Ervin G. Schuster. 1997. Using IMPLAN to Identify Rural Opportunities (General Technical Report INT-GTR-350). USDA Forest Service, Intermountain Research Station, 324 25th Street, Ogden, UT 84401.
Meyers, Michael. 2006. Structural Employment Changes in Rural Oregon Over the Past 25 Years. Salem, Oregon: Oregon Labor Market Information System (OLMIS), Oregon Employment Department.
Minnesota Implan Group, Inc. 1725 Tower Drive, Suite 140, Stillwater, MN 55082. http://implansupport.com/index.php?option=com_frontpage&Itemid=1
Newton, Doris J. 2005. Small Farms Can Grow Into Large Enterprises. Amber Waves, Vol. 3, Issue 2. U.S. Department of Agriculture, Economic Research Service. http://www.ers.usda.gov/briefing/farmstructure/
Northwest Area Foundation. 2004. http://www.indicators.nwaf.org/
Olson, Doug, and Scott Lindall. 1999. IMPLAN Professional Version 2.0 Social Accounting and Impact Analysis Software—User’s Guide, Analysis Guide, and Data Guide. Minnesota IMPLAN Group, Inc., 1725 Tower Drive West, Suite 140, Stillwater, MN 55082. http://www.implan.com
Oregon Agricultural Information Network (OAIN). Oregon State University Extension Service—Agricultural and Resource Economics Department. http://ludwig.arec.orst.edu/oain/SignIn.asp
Oregon State University Extension Service. 2005 Oregon County and State Agricultural Estimates (SR 790-05). Revised April 2006. http://extension.oregonstate.edu/catalog/pdf/sr/sr790-05.pdf
U.S. Department of Agriculture, Economic Research Service. 2007. Farm Income: Data Files. http://www.ers.usda.gov/data/FarmIncome/finfidmuWk4.htm
U.S. Department of Agriculture, Economic Research Service. March 2007. State Facts Sheets: Oregon.
U.S. Department of Agriculture, National Agricultural Statistics Service. 1999. 1997 Census of Agriculture. http://www.nass.usda.gov/census/index1997.htm
U.S. Department of Agriculture, National Agricultural Statistics Service. 2004. 2002 Census of Agriculture. http://www.nass.usda.gov/Census_of_Agriculture/index.asp
© 2008 Oregon State University. This publication may be photocopied or reprinted in its entirety for noncommercial purposes. This publication was produced and distributed in furtherance of the Acts of Congress of May 8 and June 30, 1914. Extension work is a cooperative program of Oregon State University, the U.S. Department of Agriculture, and Oregon counties. Oregon State University Extension Service offers educational programs, activities, and materials without discrimination based on age, color, disability, gender identity or expression, marital status, national origin, race, religion, sex, sexual orientation, or veteran’s status. Oregon State University Extension Service is an Equal Opportunity Employer.Published February 2008.