Embed Size (px)
Citation preview
2015-16 School Accountability Report Card for Orchard Hills School Page 1 of 15
Orchard Hills School
School Accountability Report Card
Reported Using Data from the 2015-16 School Year
Published During 2016-17
By February 1 of each year, every school in California is required by state law to publish a School Accountability Report Card (SARC). The SARC contains information about the condition and performance of each California public school. Under the Local Control Funding Formula (LCFF) all local educational agencies (LEAs) are required to prepare a Local Control and Accountability Plan (LCAP), which describes how they intend to meet annual school-specific goals for all pupils, with specific activities to address state and local priorities. Additionally, data reported in an LCAP is to be consistent with data reported in the SARC. • For more information about SARC requirements, see the California Department of Education (CDE) SARC Web page at
http://www.cde.ca.gov/ta/ac/sa/. • For more information about the LCFF or LCAP, see the CDE LCFF Web page at http://www.cde.ca.gov/fg/aa/lc/. • For additional information about the school, parents/guardians and community members should contact the school principal or
the district office. DataQuest DataQuest is an online data tool located on the CDE DataQuest Web page at http://dq.cde.ca.gov/dataquest/ that contains additional information about this school and comparisons of the school to the district and the county. Specifically, DataQuest is a dynamic system that provides reports for accountability (e.g., test data, enrollment, high school graduates, dropouts, course enrollments, staffing, and data regarding English learners). Internet Access Internet access is available at public libraries and other locations that are publicly accessible (e.g., the California State Library). Access to the Internet at libraries and public locations is generally provided on a first-come, first-served basis. Other use restrictions may include the hours of operation, the length of time that a workstation may be used (depending on availability), the types of software programs available on a workstation, and the ability to print documents.
About This School Contact Information (School Year 2016-17)
School Contact Information
School Name------- Orchard Hills School
Street------- 11555 Culver Dr.
City, State, Zip------- Irvine, CA 92602
Phone Number------- (714) 430-2078
Principal------- Cindy Agopian
E-mail Address------- [email protected]
Web Site------- http://www.tustin.k12.ca.us/orchardhills
CDS Code 30-73643-0121152
2015-16 School Accountability Report Card for Orchard Hills School Page 2 of 15
District Contact Information
District Name------- Tustin Unified School District
Phone Number------- (714) 730-7301
Superintendent-------
Gregory A. Franklin, Ed.D.
E-mail Address------- [email protected]
Web Site------- http://www.tustin.k12.ca.us
School Description and Mission Statement (School Year 2016-17)
Vision: It is the collective responsibility that all students become effective communicators, creative thinkers, and productive citizens prepared to use their skills and talents to achieve extraordinary success in life! Mission: At Orchard Hills School, we strive to be the pinnacle of academic excellence by ensuring that all students achieve the highest levels of learning and engaged in multiple opportunities to discover their Element! Student Enrollment by Grade Level (School Year 2015-16)
Grade Number of
Level Students
Grade 5 254
Grade 6 311
Grade 7 291
Grade 8 300
Total Enrollment 1,156
Student Enrollment by Group (School Year 2015-16)
Student Percent of
Group Total Enrollment
Black or African American 2.7
American Indian or Alaska Native 0.2
Asian 48.5
Filipino 2.5
Hispanic or Latino 10.5
Native Hawaiian or Pacific Islander 0.6
White 31.8
Two or More Races 2.4
Socioeconomically Disadvantaged 11.5
English Learners 6.3
Students with Disabilities 4.6
Foster Youth 0.1
2015-16 School Accountability Report Card for Orchard Hills School Page 3 of 15
A. Conditions of Learning
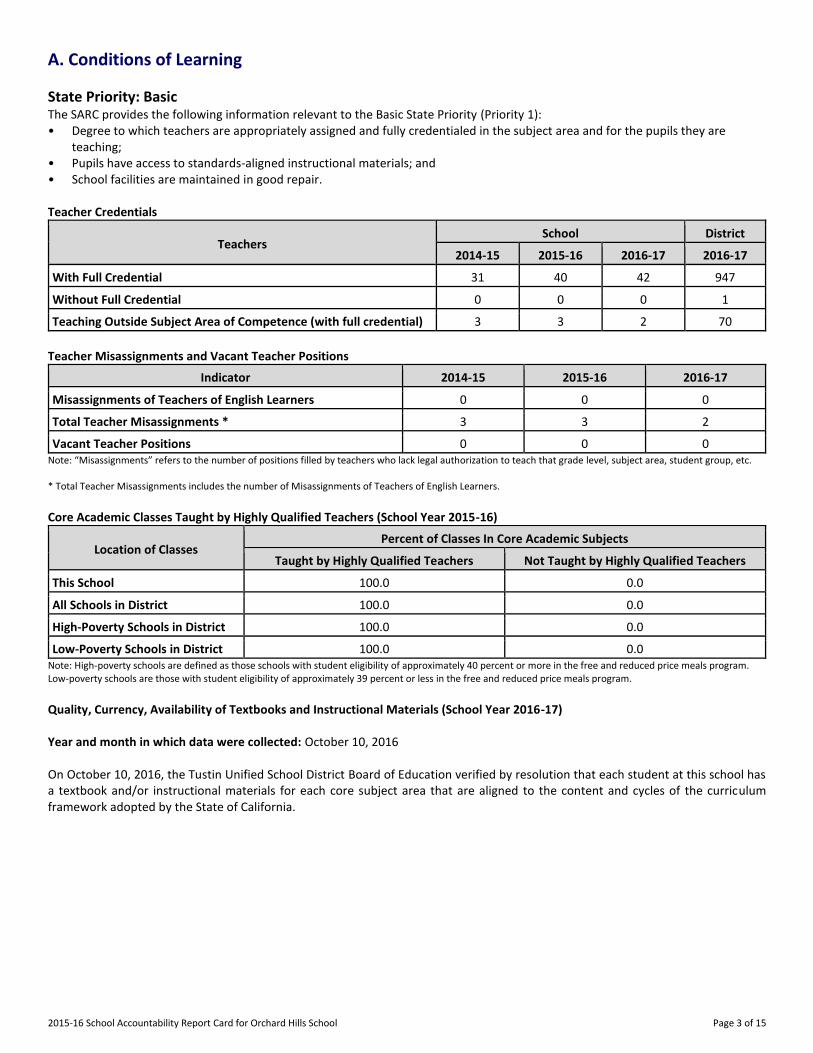
State Priority: Basic The SARC provides the following information relevant to the Basic State Priority (Priority 1): • Degree to which teachers are appropriately assigned and fully credentialed in the subject area and for the pupils they are
teaching; • Pupils have access to standards-aligned instructional materials; and • School facilities are maintained in good repair. Teacher Credentials
Teachers School District
2014-15 2015-16 2016-17 2016-17
With Full Credential 31 40 42 947
Without Full Credential 0 0 0 1
Teaching Outside Subject Area of Competence (with full credential) 3 3 2 70
Teacher Misassignments and Vacant Teacher Positions
Indicator 2014-15 2015-16 2016-17
Misassignments of Teachers of English Learners 0 0 0
Total Teacher Misassignments * 3 3 2
Vacant Teacher Positions 0 0 0 Note: “Misassignments” refers to the number of positions filled by teachers who lack legal authorization to teach that grade level, subject area, student group, etc. * Total Teacher Misassignments includes the number of Misassignments of Teachers of English Learners. Core Academic Classes Taught by Highly Qualified Teachers (School Year 2015-16)
Location of Classes Percent of Classes In Core Academic Subjects
Taught by Highly Qualified Teachers Not Taught by Highly Qualified Teachers
This School 100.0 0.0
All Schools in District 100.0 0.0
High-Poverty Schools in District 100.0 0.0
Low-Poverty Schools in District 100.0 0.0 Note: High-poverty schools are defined as those schools with student eligibility of approximately 40 percent or more in the free and reduced price meals program. Low-poverty schools are those with student eligibility of approximately 39 percent or less in the free and reduced price meals program. Quality, Currency, Availability of Textbooks and Instructional Materials (School Year 2016-17) Year and month in which data were collected: October 10, 2016 On October 10, 2016, the Tustin Unified School District Board of Education verified by resolution that each student at this school has a textbook and/or instructional materials for each core subject area that are aligned to the content and cycles of the curriculum framework adopted by the State of California.

2015-16 School Accountability Report Card for Orchard Hills School Page 4 of 15
Subject Textbooks and Instructional Materials/
Year of Adoption
From Most Recent
Adoption?
Percent of Students Lacking Own
Assigned Copy
Reading/Language Arts State-Adopted Textbooks - Grade 5
Textbooks and support materials are state-adopted and consistent with the content and cycles of the curriculum frameworks adopted by the State Board of Education. The school district has purchased and provided each student with textbooks and materials in this subject area that are aligned with state standards. For Grade 5, the Units of Study for Teaching Reading and the Units of Study in Opinion, Information, and Narrative Writing by Lucy Calkins as well as K-2 Phonics Lessons by Irene Fountas and Gay Su Pinnell are the state adopted textbooks for the District. The Tustin Unified School District Board of Education approved these textbooks for adoption on December 12, 2016.
State-Adopted Textbooks - Grades 6-8
Holt, Rinehart and Winston Literature and Language Arts (2003) is the state adopted textbook for the Grades 6-8. The Tustin Unified School District Board of Education approved these textbooks for adoption in 2003.
Supplemental Textbooks and Materials for Grade 5: Students have access to classroom libraries containing both literature and non-fiction text.
Supplemental Textbooks and Materials for Grades 6-8: National Geographic Inside (2008) is used as a supplemental material with English Language Learners.
Yes 0%
Mathematics State-Adopted Textbooks - Grade 5
Textbooks and support materials are state-adopted and consistent with the content and cycles of the curriculum frameworks adopted by the State Board of Education. The school district has purchased and provided each student with textbooks and materials in this subject area that are aligned to state standards. Houghton Mifflin Harcourt California Math Expressions Common Core (2015) is the state adopted core curriculum for the District. The Tustin Unified Board of Education approved this textbook for adoption on June 9, 2014.
State-Adopted Textbooks - Grades 6-8
Textbooks are state-adopted, in good condition, and are available consistent with the content and cycles of the curriculum frameworks adopted by the State Board of Education. The school district has purchased and provided each student with textbooks and materials in this subject area that are aligned to state standards. Holt, Rinehart, and Winston Course 1: Numbers to Algebra (2008) –
Yes 0%
2015-16 School Accountability Report Card for Orchard Hills School Page 5 of 15
Subject Textbooks and Instructional Materials/
Year of Adoption
From Most Recent
Adoption?
Percent of Students Lacking Own
Assigned Copy
Grade 6 and Course 2: Pre-Algebra (2008), Pearson/Prentice Hall California Algebra I (2009), and McDougall Littell Geometry (2007) are the state adopted textbooks for the District. These textbooks were adopted by the Board of Education in 2009.
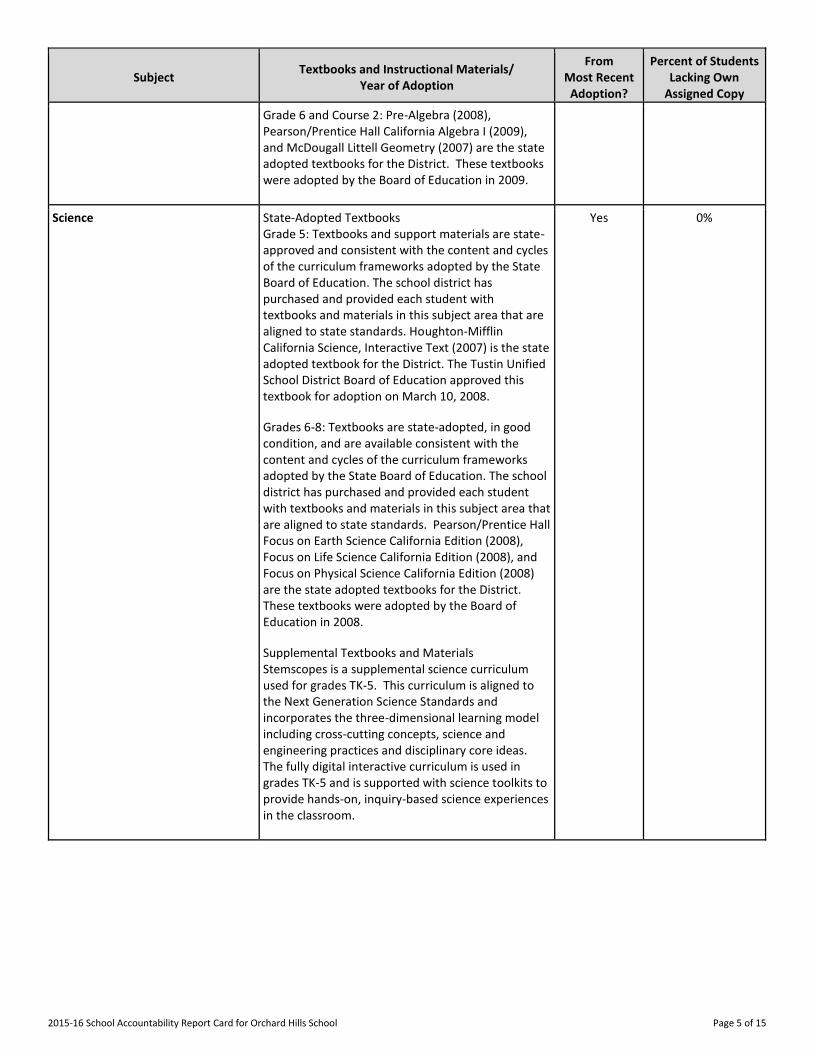
Science State-Adopted Textbooks
Grade 5: Textbooks and support materials are state-approved and consistent with the content and cycles of the curriculum frameworks adopted by the State Board of Education. The school district has purchased and provided each student with textbooks and materials in this subject area that are aligned to state standards. Houghton-Mifflin California Science, Interactive Text (2007) is the state adopted textbook for the District. The Tustin Unified School District Board of Education approved this textbook for adoption on March 10, 2008.
Grades 6-8: Textbooks are state-adopted, in good condition, and are available consistent with the content and cycles of the curriculum frameworks adopted by the State Board of Education. The school district has purchased and provided each student with textbooks and materials in this subject area that are aligned to state standards. Pearson/Prentice Hall Focus on Earth Science California Edition (2008), Focus on Life Science California Edition (2008), and Focus on Physical Science California Edition (2008) are the state adopted textbooks for the District. These textbooks were adopted by the Board of Education in 2008.
Supplemental Textbooks and Materials
Stemscopes is a supplemental science curriculum used for grades TK-5. This curriculum is aligned to the Next Generation Science Standards and incorporates the three-dimensional learning model including cross-cutting concepts, science and engineering practices and disciplinary core ideas. The fully digital interactive curriculum is used in grades TK-5 and is supported with science toolkits to provide hands-on, inquiry-based science experiences in the classroom.
Yes 0%
2015-16 School Accountability Report Card for Orchard Hills School Page 6 of 15
Subject Textbooks and Instructional Materials/
Year of Adoption
From Most Recent
Adoption?
Percent of Students Lacking Own
Assigned Copy
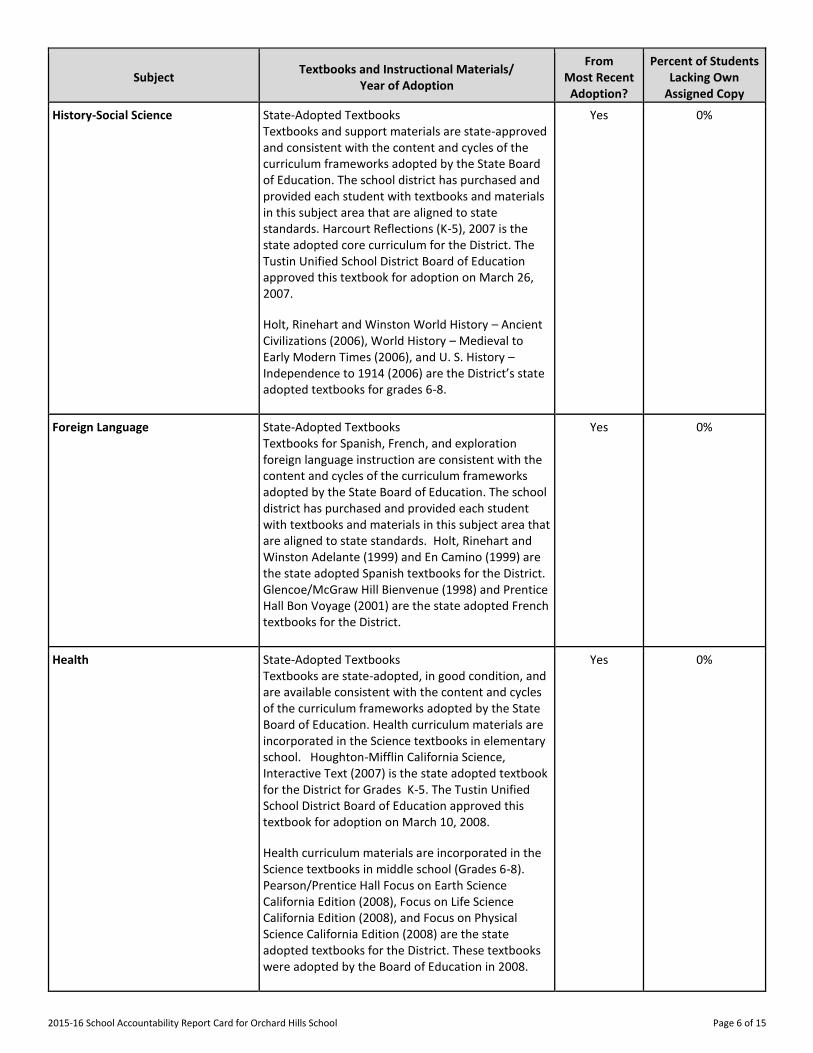
History-Social Science State-Adopted Textbooks
Textbooks and support materials are state-approved and consistent with the content and cycles of the curriculum frameworks adopted by the State Board of Education. The school district has purchased and provided each student with textbooks and materials in this subject area that are aligned to state standards. Harcourt Reflections (K-5), 2007 is the state adopted core curriculum for the District. The Tustin Unified School District Board of Education approved this textbook for adoption on March 26, 2007.
Holt, Rinehart and Winston World History – Ancient Civilizations (2006), World History – Medieval to Early Modern Times (2006), and U. S. History – Independence to 1914 (2006) are the District’s state adopted textbooks for grades 6-8.
Yes 0%
Foreign Language State-Adopted Textbooks
Textbooks for Spanish, French, and exploration foreign language instruction are consistent with the content and cycles of the curriculum frameworks adopted by the State Board of Education. The school district has purchased and provided each student with textbooks and materials in this subject area that are aligned to state standards. Holt, Rinehart and Winston Adelante (1999) and En Camino (1999) are the state adopted Spanish textbooks for the District. Glencoe/McGraw Hill Bienvenue (1998) and Prentice Hall Bon Voyage (2001) are the state adopted French textbooks for the District.
Yes 0%
Health State-Adopted Textbooks
Textbooks are state-adopted, in good condition, and are available consistent with the content and cycles of the curriculum frameworks adopted by the State Board of Education. Health curriculum materials are incorporated in the Science textbooks in elementary school. Houghton-Mifflin California Science, Interactive Text (2007) is the state adopted textbook for the District for Grades K-5. The Tustin Unified School District Board of Education approved this textbook for adoption on March 10, 2008.
Health curriculum materials are incorporated in the Science textbooks in middle school (Grades 6-8). Pearson/Prentice Hall Focus on Earth Science California Edition (2008), Focus on Life Science California Edition (2008), and Focus on Physical Science California Edition (2008) are the state adopted textbooks for the District. These textbooks were adopted by the Board of Education in 2008.
Yes 0%

2015-16 School Accountability Report Card for Orchard Hills School Page 7 of 15
Subject Textbooks and Instructional Materials/
Year of Adoption
From Most Recent
Adoption?
Percent of Students Lacking Own
Assigned Copy
Visual and Performing Arts Not applicable. N/A
Science Laboratory Equipment (grades 9-12)
Not applicable. N/A
School Facility Conditions and Planned Improvements (Most Recent Year)
The Tustin Unified School District takes great efforts to ensure that all schools are clean, safe, and functional. To assist in this effort, the District uses a facility survey instrument developed by the State of California Office of Public School Construction (OPSC). The results of this survey are available at the school office, the District office, or on the Internet at http://www.tustin.k12.ca.us/Domain/3505. The District maintenance staff ensures that the repairs necessary to keep the school in good repair and working order are completed in a timely manner. A work order process is used to ensure efficient service and that emergency repairs are given the highest priority. The percent of systems in good repair is 100%. The overall school rating is: "exemplary." School Facility Good Repair Status (Most Recent Year)
School Facility Good Repair Status (Most Recent Year) Year and month of the most recent FIT report: 11/04/2016
System Inspected Repair Status Repair Needed and
Action Taken or Planned Good Fair Poor
Systems: Gas Leaks, Mechanical/HVAC, Sewer
X
Interior: Interior Surfaces X
Cleanliness: Overall Cleanliness, Pest/ Vermin Infestation
X
Electrical: Electrical X
Restrooms/Fountains: Restrooms, Sinks/ Fountains
X
Safety: Fire Safety, Hazardous Materials X
Structural: Structural Damage, Roofs X
External: Playground/School Grounds, Windows/ Doors/Gates/Fences
X
Overall Facility Rating (Most Recent Year)
Year and month of the most recent FIT report: 11/04/2016
Overall Rating Exemplary Good Fair Poor
X
2015-16 School Accountability Report Card for Orchard Hills School Page 8 of 15
B. Pupil Outcomes
State Priority: Pupil Achievement The SARC provides the following information relevant to the State priority: Pupil Achievement (Priority 4): • Statewide assessments (i.e., California Assessment of Student Performance and Progress [CAASPP] System, which includes the
Smarter Balanced Summative Assessments for students in the general education population and the California Alternate Assessments [CAAs] for English language arts/literacy [ELA] and mathematics given in grades three through eight and grade eleven. The CAAs have replaced the California Alternate Performance Assessment [CAPA] for ELA and mathematics, which were eliminated in 2015. Only eligible students may participate in the administration of the CAAs. CAA items are aligned with alternate achievement standards, which are linked with the Common Core State Standards [CCSS] for students with significant cognitive disabilities); and
• The percentage of students who have successfully completed courses that satisfy the requirements for entrance to the University of California and the California State University, or career technical education sequences or programs of study
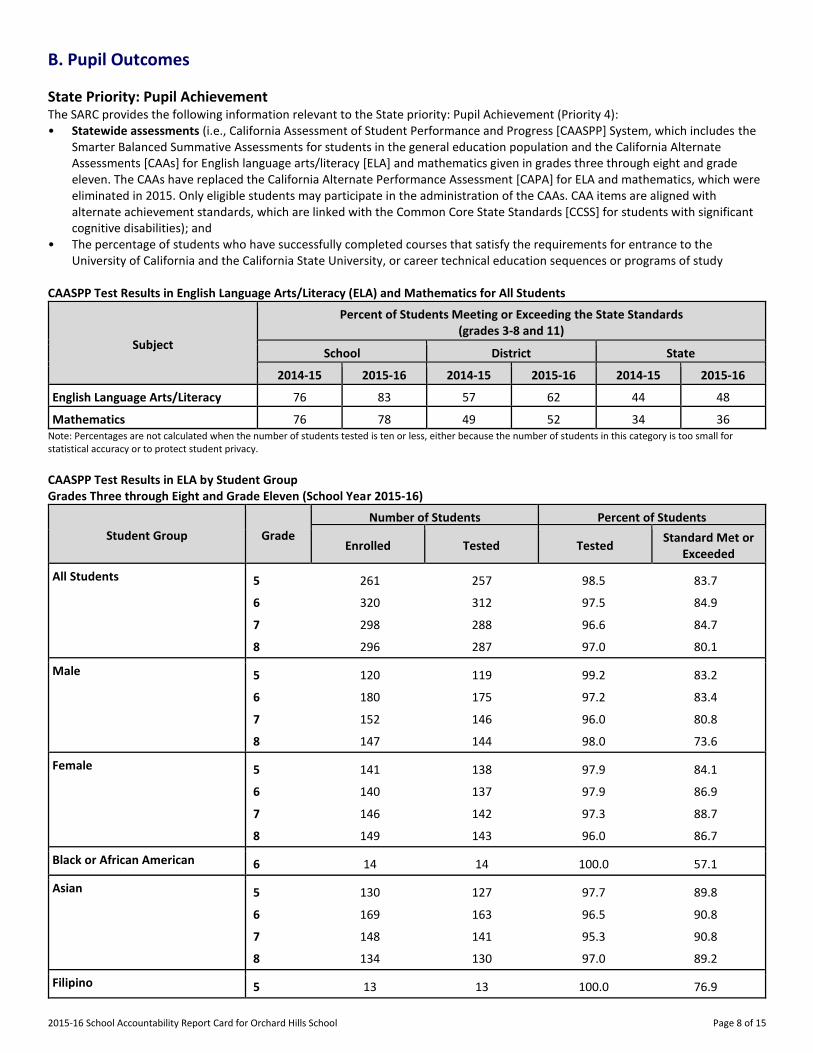
CAASPP Test Results in English Language Arts/Literacy (ELA) and Mathematics for All Students
Subject
Percent of Students Meeting or Exceeding the State Standards (grades 3-8 and 11)
School District State
2014-15 2015-16 2014-15 2015-16 2014-15 2015-16
English Language Arts/Literacy 76 83 57 62 44 48
Mathematics 76 78 49 52 34 36 Note: Percentages are not calculated when the number of students tested is ten or less, either because the number of students in this category is too small for statistical accuracy or to protect student privacy.
CAASPP Test Results in ELA by Student Group Grades Three through Eight and Grade Eleven (School Year 2015-16)
Student Group Grade
Number of Students Percent of Students
Enrolled Tested Tested Standard Met or
Exceeded
All Students 5 261 257 98.5 83.7
6 320 312 97.5 84.9
7 298 288 96.6 84.7
8 296 287 97.0 80.1
Male 5 120 119 99.2 83.2
6 180 175 97.2 83.4
7 152 146 96.0 80.8
8 147 144 98.0 73.6
Female 5 141 138 97.9 84.1
6 140 137 97.9 86.9
7 146 142 97.3 88.7
8 149 143 96.0 86.7
Black or African American 6 14 14 100.0 57.1
Asian 5 130 127 97.7 89.8
6 169 163 96.5 90.8
7 148 141 95.3 90.8
8 134 130 97.0 89.2
Filipino 5 13 13 100.0 76.9
2015-16 School Accountability Report Card for Orchard Hills School Page 9 of 15
Student Group Grade
Number of Students Percent of Students
Enrolled Tested Tested Standard Met or
Exceeded
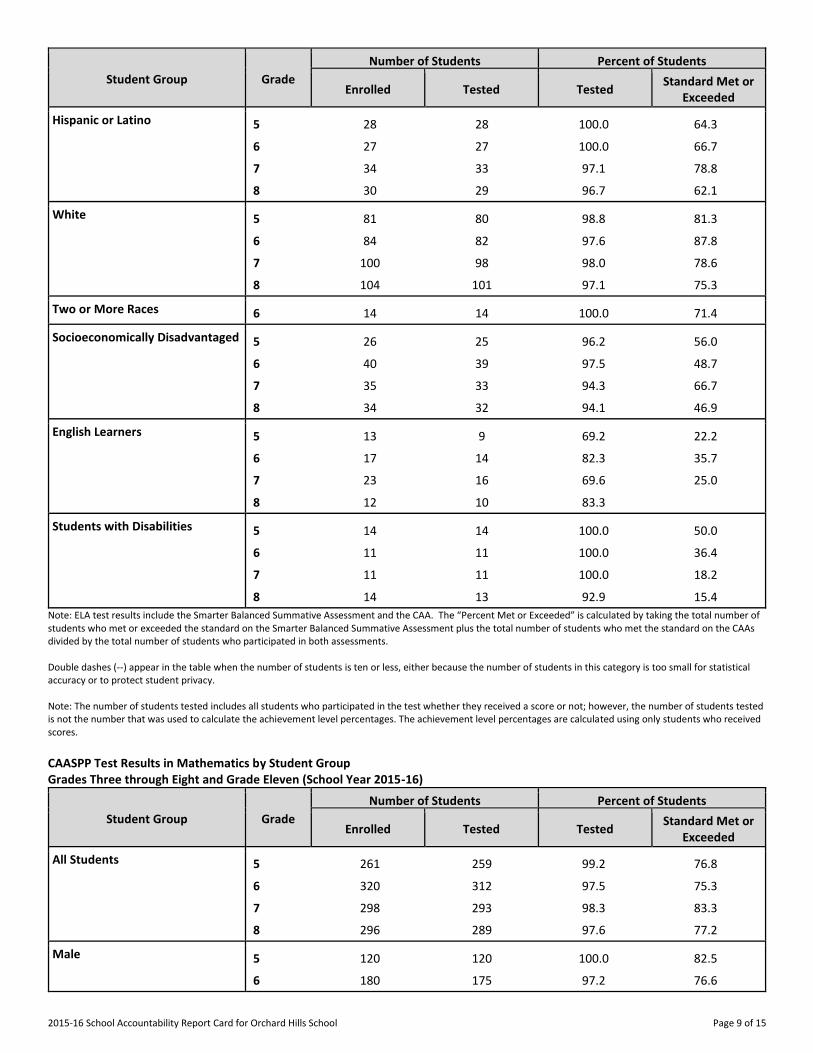
Hispanic or Latino 5 28 28 100.0 64.3
6 27 27 100.0 66.7
7 34 33 97.1 78.8
8 30 29 96.7 62.1
White 5 81 80 98.8 81.3
6 84 82 97.6 87.8
7 100 98 98.0 78.6
8 104 101 97.1 75.3
Two or More Races 6 14 14 100.0 71.4
Socioeconomically Disadvantaged 5 26 25 96.2 56.0
6 40 39 97.5 48.7
7 35 33 94.3 66.7
8 34 32 94.1 46.9
English Learners 5 13 9 69.2 22.2
6 17 14 82.3 35.7
7 23 16 69.6 25.0
8 12 10 83.3
Students with Disabilities 5 14 14 100.0 50.0
6 11 11 100.0 36.4
7 11 11 100.0 18.2
8 14 13 92.9 15.4
Note: ELA test results include the Smarter Balanced Summative Assessment and the CAA. The “Percent Met or Exceeded” is calculated by taking the total number of students who met or exceeded the standard on the Smarter Balanced Summative Assessment plus the total number of students who met the standard on the CAAs divided by the total number of students who participated in both assessments. Double dashes (--) appear in the table when the number of students is ten or less, either because the number of students in this category is too small for statistical accuracy or to protect student privacy. Note: The number of students tested includes all students who participated in the test whether they received a score or not; however, the number of students tested is not the number that was used to calculate the achievement level percentages. The achievement level percentages are calculated using only students who received scores.
CAASPP Test Results in Mathematics by Student Group Grades Three through Eight and Grade Eleven (School Year 2015-16)
Student Group Grade
Number of Students Percent of Students
Enrolled Tested Tested Standard Met or
Exceeded
All Students 5 261 259 99.2 76.8
6 320 312 97.5 75.3
7 298 293 98.3 83.3
8 296 289 97.6 77.2
Male 5 120 120 100.0 82.5
6 180 175 97.2 76.6
2015-16 School Accountability Report Card for Orchard Hills School Page 10 of 15
Student Group Grade
Number of Students Percent of Students
Enrolled Tested Tested Standard Met or
Exceeded
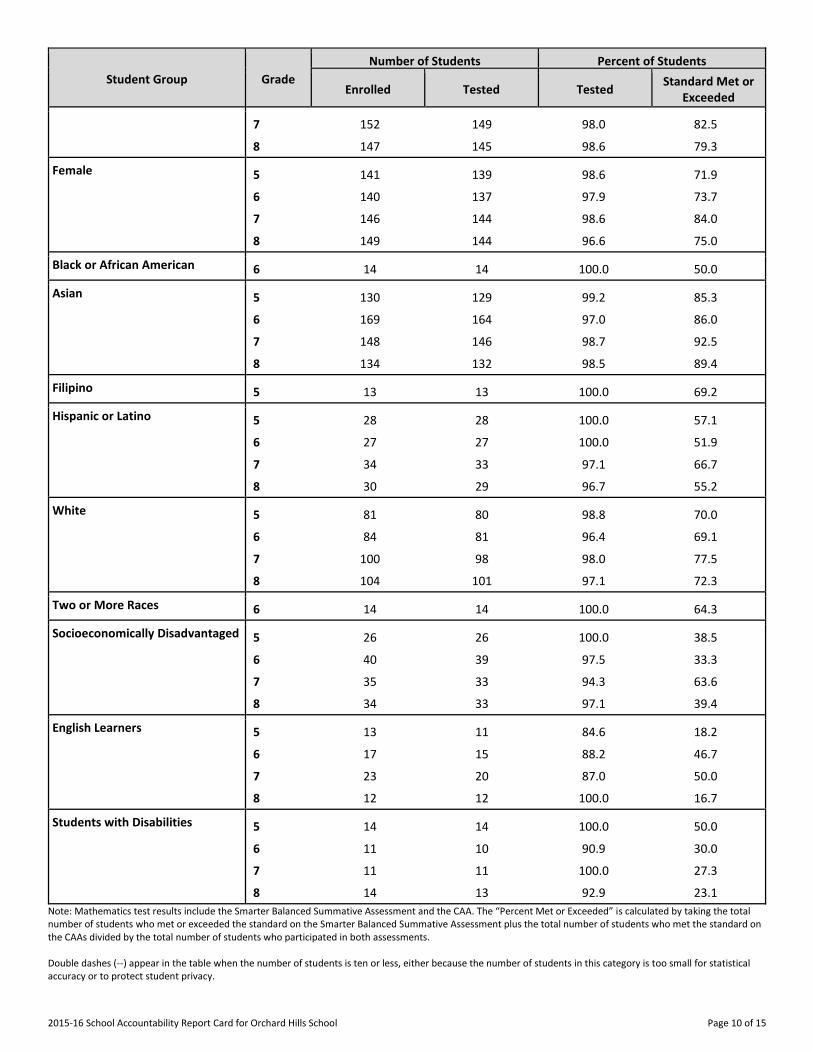
7 152 149 98.0 82.5
8 147 145 98.6 79.3
Female 5 141 139 98.6 71.9
6 140 137 97.9 73.7
7 146 144 98.6 84.0
8 149 144 96.6 75.0
Black or African American 6 14 14 100.0 50.0
Asian 5 130 129 99.2 85.3
6 169 164 97.0 86.0
7 148 146 98.7 92.5
8 134 132 98.5 89.4
Filipino 5 13 13 100.0 69.2
Hispanic or Latino 5 28 28 100.0 57.1
6 27 27 100.0 51.9
7 34 33 97.1 66.7
8 30 29 96.7 55.2
White 5 81 80 98.8 70.0
6 84 81 96.4 69.1
7 100 98 98.0 77.5
8 104 101 97.1 72.3
Two or More Races 6 14 14 100.0 64.3
Socioeconomically Disadvantaged 5 26 26 100.0 38.5
6 40 39 97.5 33.3
7 35 33 94.3 63.6
8 34 33 97.1 39.4
English Learners 5 13 11 84.6 18.2
6 17 15 88.2 46.7
7 23 20 87.0 50.0
8 12 12 100.0 16.7
Students with Disabilities 5 14 14 100.0 50.0
6 11 10 90.9 30.0
7 11 11 100.0 27.3
8 14 13 92.9 23.1
Note: Mathematics test results include the Smarter Balanced Summative Assessment and the CAA. The “Percent Met or Exceeded” is calculated by taking the total number of students who met or exceeded the standard on the Smarter Balanced Summative Assessment plus the total number of students who met the standard on the CAAs divided by the total number of students who participated in both assessments. Double dashes (--) appear in the table when the number of students is ten or less, either because the number of students in this category is too small for statistical accuracy or to protect student privacy.
2015-16 School Accountability Report Card for Orchard Hills School Page 11 of 15
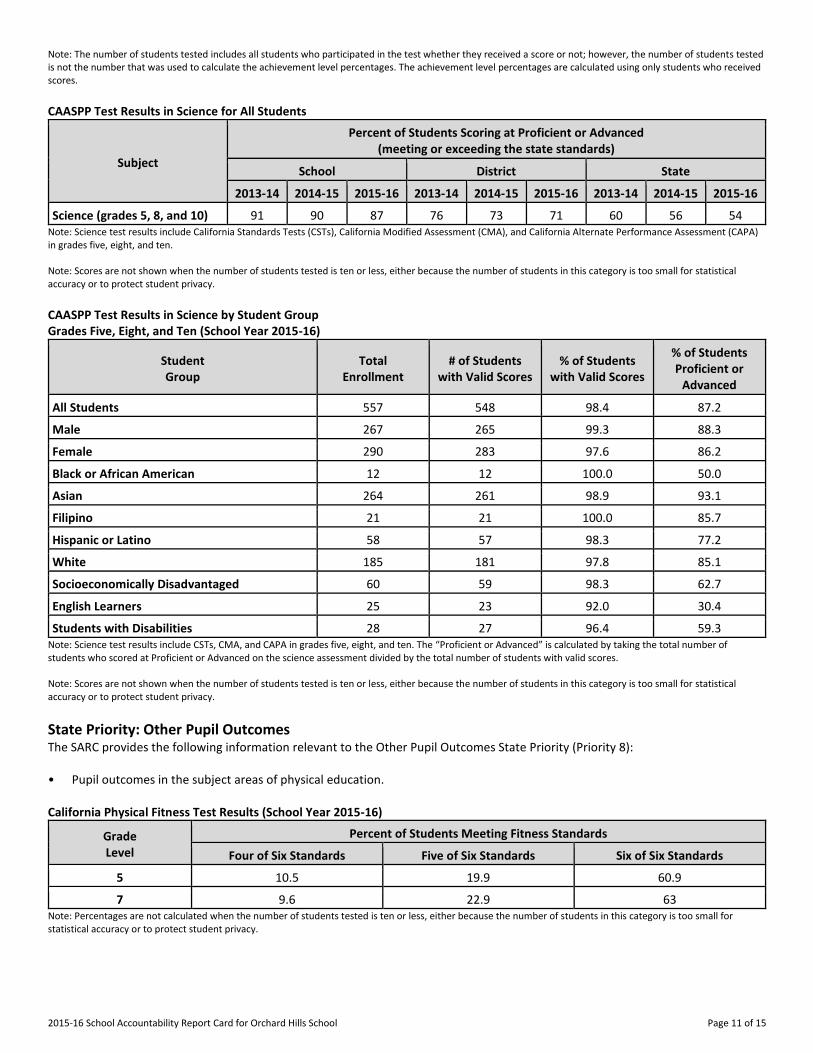
Note: The number of students tested includes all students who participated in the test whether they received a score or not; however, the number of students tested is not the number that was used to calculate the achievement level percentages. The achievement level percentages are calculated using only students who received scores.
CAASPP Test Results in Science for All Students
Subject
Percent of Students Scoring at Proficient or Advanced (meeting or exceeding the state standards)
School District State
2013-14 2014-15 2015-16 2013-14 2014-15 2015-16 2013-14 2014-15 2015-16
Science (grades 5, 8, and 10) 91 90 87 76 73 71 60 56 54 Note: Science test results include California Standards Tests (CSTs), California Modified Assessment (CMA), and California Alternate Performance Assessment (CAPA) in grades five, eight, and ten. Note: Scores are not shown when the number of students tested is ten or less, either because the number of students in this category is too small for statistical accuracy or to protect student privacy.
CAASPP Test Results in Science by Student Group Grades Five, Eight, and Ten (School Year 2015-16)
Student Group
Total Enrollment
# of Students with Valid Scores
% of Students with Valid Scores
% of Students Proficient or
Advanced
All Students 557 548 98.4 87.2
Male 267 265 99.3 88.3
Female 290 283 97.6 86.2
Black or African American 12 12 100.0 50.0
Asian 264 261 98.9 93.1
Filipino 21 21 100.0 85.7
Hispanic or Latino 58 57 98.3 77.2
White 185 181 97.8 85.1
Socioeconomically Disadvantaged 60 59 98.3 62.7
English Learners 25 23 92.0 30.4
Students with Disabilities 28 27 96.4 59.3 Note: Science test results include CSTs, CMA, and CAPA in grades five, eight, and ten. The “Proficient or Advanced” is calculated by taking the total number of students who scored at Proficient or Advanced on the science assessment divided by the total number of students with valid scores. Note: Scores are not shown when the number of students tested is ten or less, either because the number of students in this category is too small for statistical accuracy or to protect student privacy.
State Priority: Other Pupil Outcomes The SARC provides the following information relevant to the Other Pupil Outcomes State Priority (Priority 8): • Pupil outcomes in the subject areas of physical education. California Physical Fitness Test Results (School Year 2015-16)
Grade Level
Percent of Students Meeting Fitness Standards
Four of Six Standards Five of Six Standards Six of Six Standards
---5--- 10.5 19.9 60.9
---7--- 9.6 22.9 63 Note: Percentages are not calculated when the number of students tested is ten or less, either because the number of students in this category is too small for statistical accuracy or to protect student privacy.
2015-16 School Accountability Report Card for Orchard Hills School Page 12 of 15
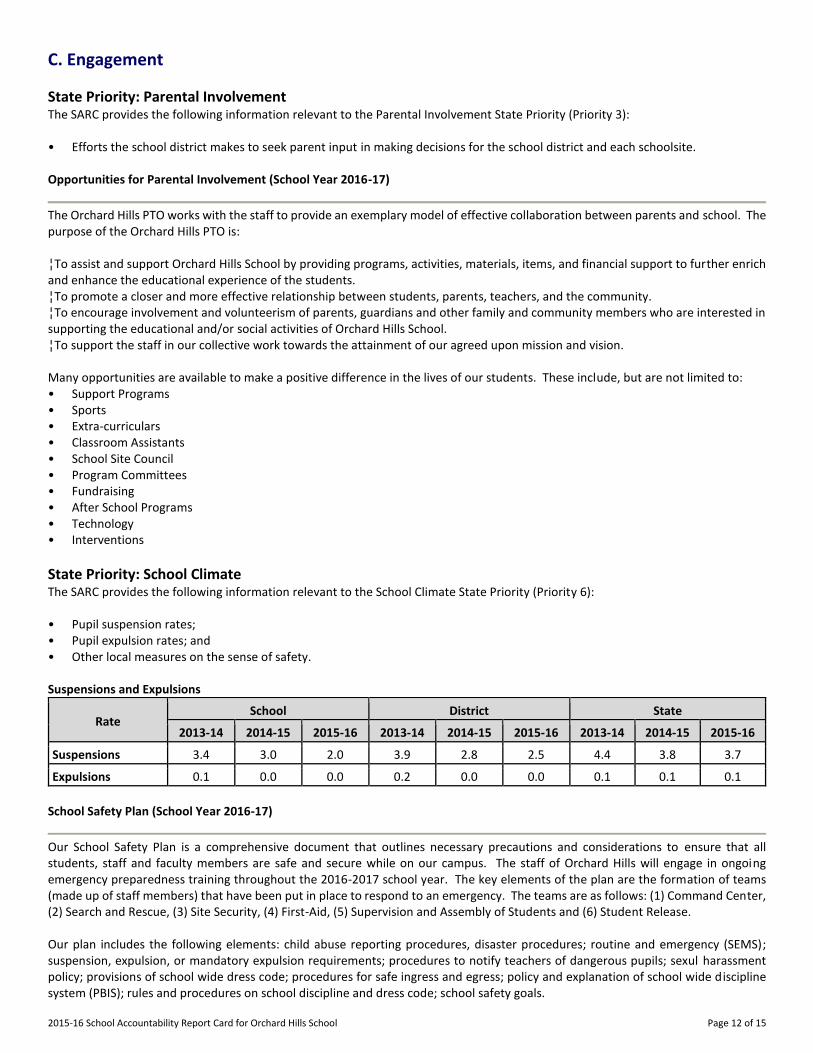
C. Engagement
State Priority: Parental Involvement The SARC provides the following information relevant to the Parental Involvement State Priority (Priority 3): • Efforts the school district makes to seek parent input in making decisions for the school district and each schoolsite. Opportunities for Parental Involvement (School Year 2016-17)
The Orchard Hills PTO works with the staff to provide an exemplary model of effective collaboration between parents and school. The purpose of the Orchard Hills PTO is: ¦To assist and support Orchard Hills School by providing programs, activities, materials, items, and financial support to further enrich and enhance the educational experience of the students. ¦To promote a closer and more effective relationship between students, parents, teachers, and the community. ¦To encourage involvement and volunteerism of parents, guardians and other family and community members who are interested in supporting the educational and/or social activities of Orchard Hills School. ¦To support the staff in our collective work towards the attainment of our agreed upon mission and vision. Many opportunities are available to make a positive difference in the lives of our students. These include, but are not limited to: • Support Programs • Sports • Extra-curriculars • Classroom Assistants • School Site Council • Program Committees • Fundraising • After School Programs • Technology • Interventions
State Priority: School Climate The SARC provides the following information relevant to the School Climate State Priority (Priority 6): • Pupil suspension rates; • Pupil expulsion rates; and • Other local measures on the sense of safety. Suspensions and Expulsions
Rate School District State
2013-14 2014-15 2015-16 2013-14 2014-15 2015-16 2013-14 2014-15 2015-16
Suspensions------- 3.4 3.0 2.0 3.9 2.8 2.5 4.4 3.8 3.7
Expulsions------- 0.1 0.0 0.0 0.2 0.0 0.0 0.1 0.1 0.1
School Safety Plan (School Year 2016-17)
Our School Safety Plan is a comprehensive document that outlines necessary precautions and considerations to ensure that all students, staff and faculty members are safe and secure while on our campus. The staff of Orchard Hills will engage in ongoing emergency preparedness training throughout the 2016-2017 school year. The key elements of the plan are the formation of teams (made up of staff members) that have been put in place to respond to an emergency. The teams are as follows: (1) Command Center, (2) Search and Rescue, (3) Site Security, (4) First-Aid, (5) Supervision and Assembly of Students and (6) Student Release. Our plan includes the following elements: child abuse reporting procedures, disaster procedures; routine and emergency (SEMS); suspension, expulsion, or mandatory expulsion requirements; procedures to notify teachers of dangerous pupils; sexul harassment policy; provisions of school wide dress code; procedures for safe ingress and egress; policy and explanation of school wide discipline system (PBIS); rules and procedures on school discipline and dress code; school safety goals.
2015-16 School Accountability Report Card for Orchard Hills School Page 13 of 15
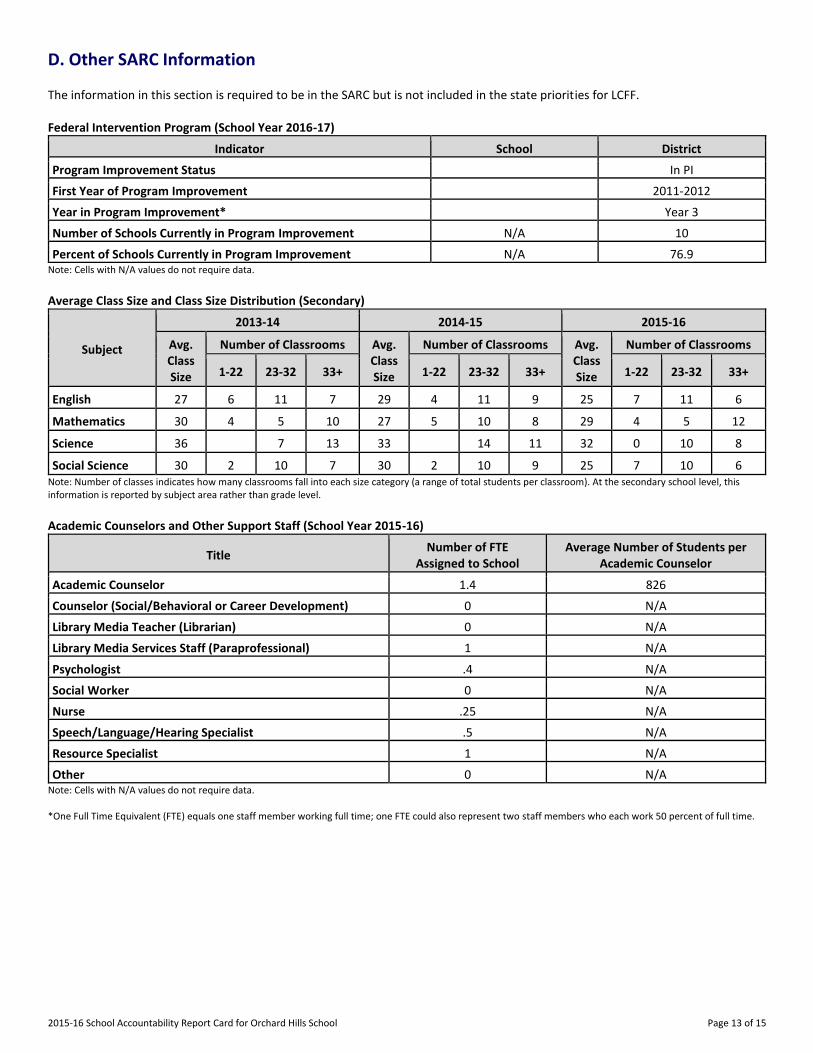
D. Other SARC Information
The information in this section is required to be in the SARC but is not included in the state priorities for LCFF. Federal Intervention Program (School Year 2016-17)
Indicator School District
Program Improvement Status In PI
First Year of Program Improvement 2011-2012
Year in Program Improvement* Year 3
Number of Schools Currently in Program Improvement N/A 10
Percent of Schools Currently in Program Improvement N/A 76.9 Note: Cells with N/A values do not require data.
Average Class Size and Class Size Distribution (Secondary)
Subject
2013-14 2014-15 2015-16
Avg. Class Size
Number of Classrooms Avg. Class Size
Number of Classrooms Avg. Class Size
Number of Classrooms
1-22 23-32 33+ 1-22 23-32 33+ 1-22 23-32 33+
English------- ----------
27 6 11 7 29 4 11 9 25 7 11 6
Mathematics ----------
30 4 5 10 27 5 10 8 29 4 5 12
Science------- ----------
36 7 13 33 14 11 32 0 10 8
Social Science ----------
30 2 10 7 30 2 10 9 25 7 10 6 Note: Number of classes indicates how many classrooms fall into each size category (a range of total students per classroom). At the secondary school level, this information is reported by subject area rather than grade level. Academic Counselors and Other Support Staff (School Year 2015-16)
Title Number of FTE
Assigned to School Average Number of Students per
Academic Counselor
Academic Counselor------- 1.4 826
Counselor (Social/Behavioral or Career Development) 0 N/A
Library Media Teacher (Librarian) 0 N/A
Library Media Services Staff (Paraprofessional) 1 N/A
Psychologist------- .4 N/A
Social Worker------- 0 N/A
Nurse------- .25 N/A
Speech/Language/Hearing Specialist .5 N/A
Resource Specialist------- 1 N/A
Other------- 0 N/A Note: Cells with N/A values do not require data. *One Full Time Equivalent (FTE) equals one staff member working full time; one FTE could also represent two staff members who each work 50 percent of full time.
2015-16 School Accountability Report Card for Orchard Hills School Page 14 of 15
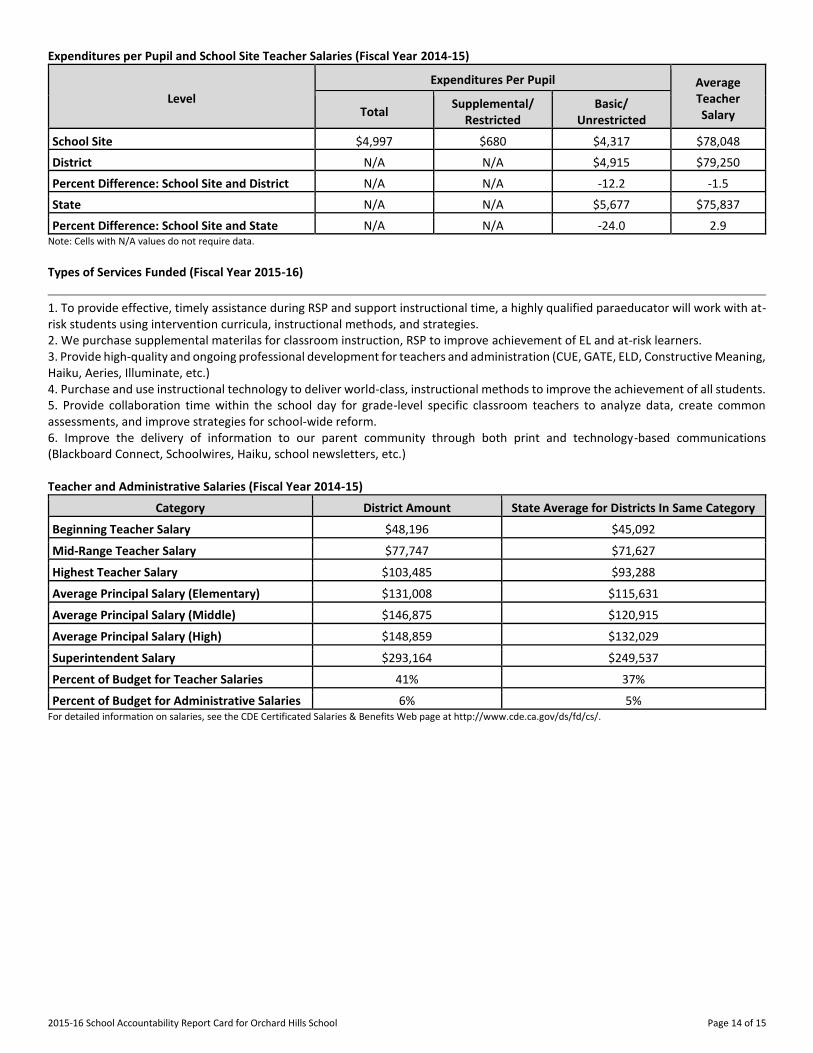
Expenditures per Pupil and School Site Teacher Salaries (Fiscal Year 2014-15)
Level
Expenditures Per Pupil Average Teacher Salary Total
Supplemental/ Restricted
Basic/ Unrestricted
School Site------- $4,997 $680 $4,317 $78,048
District------- N/A N/A $4,915 $79,250
Percent Difference: School Site and District N/A N/A -12.2 -1.5
State------- N/A N/A $5,677 $75,837
Percent Difference: School Site and State N/A N/A -24.0 2.9 Note: Cells with N/A values do not require data.
Types of Services Funded (Fiscal Year 2015-16)
1. To provide effective, timely assistance during RSP and support instructional time, a highly qualified paraeducator will work with at-risk students using intervention curricula, instructional methods, and strategies. 2. We purchase supplemental materilas for classroom instruction, RSP to improve achievement of EL and at-risk learners. 3. Provide high-quality and ongoing professional development for teachers and administration (CUE, GATE, ELD, Constructive Meaning, Haiku, Aeries, Illuminate, etc.) 4. Purchase and use instructional technology to deliver world-class, instructional methods to improve the achievement of all students. 5. Provide collaboration time within the school day for grade-level specific classroom teachers to analyze data, create common assessments, and improve strategies for school-wide reform. 6. Improve the delivery of information to our parent community through both print and technology-based communications (Blackboard Connect, Schoolwires, Haiku, school newsletters, etc.) Teacher and Administrative Salaries (Fiscal Year 2014-15)
Category District Amount State Average for Districts In Same Category
Beginning Teacher Salary $48,196 $45,092
Mid-Range Teacher Salary $77,747 $71,627
Highest Teacher Salary $103,485 $93,288
Average Principal Salary (Elementary) $131,008 $115,631
Average Principal Salary (Middle) $146,875 $120,915
Average Principal Salary (High) $148,859 $132,029
Superintendent Salary $293,164 $249,537
Percent of Budget for Teacher Salaries 41% 37%
Percent of Budget for Administrative Salaries 6% 5% For detailed information on salaries, see the CDE Certificated Salaries & Benefits Web page at http://www.cde.ca.gov/ds/fd/cs/.
2015-16 School Accountability Report Card for Orchard Hills School Page 15 of 15
Professional Development (Most Recent Three Years)
All Orchard Hills teachers are fully credentialed and are CLAD certified. All teachers have training in lesson design strategies, multiple learning styles and effective use of technology to support student learning. The Tustin Unified School District has a comprehensive long-term plan for professional development that is aligned with state content standards and frameworks. The plan is based on current research, driven by the analysis of data from CAASPP and local assessments and needs identified by administrators, teachers and staff. The plan is reflective of the California Standards for the Teaching Profession. District goals focus on student acheivement, planning for facilities, fiscal responsibility, ensuring the highest level of quality of all employees and parent/community partnerships. The district continues to focus on the language proficiency of English Learners. Teachers may attend workshops and conferences for professional development specifically to help improve the English proficiency levels for these students. The effective use of technology to improve student acheive is another area of focus. Teachers also have the opportunity to attend various trainings to improve their delivery of instruction through technology (i.e. use of the Smartboards/Polyvision boards, document cameras, illuminate software, webpage design, etc.). This year, all teachers are using Haiku, an online Learning Management System, that allows students and staff to interact online. In addition, teachers are beginning to use iPads in the learning environment to enhance lesson preparation, improve data collection, and assess instructional delivery. All teachers have been trained in the implementation of graphic organizers to improve note-taking, comprehension and retention of learned material. Through the Professional Learning Community process, Orchard Hills teachers regularly share teaching ideas, best practices that are leading to student learning, materials and other helpful information among departments, and with grade level counterparts. The Banking Minutes program allows teachers extra time and the opportunity to meet a minimum of twice per month to collaborate. Cross-curricular collaboration is a focus, but school-wide collaboration happens informally on a daily basis. Because collaboration is a key component of the school's vision, evidence of this is found in teacher's use of essential standards, common assessments, and use of benchmark data across the curriculum.