Embed Size (px)
Citation preview
2015-16 School Accountability Report Card for Design39Campus Page 1 of 16
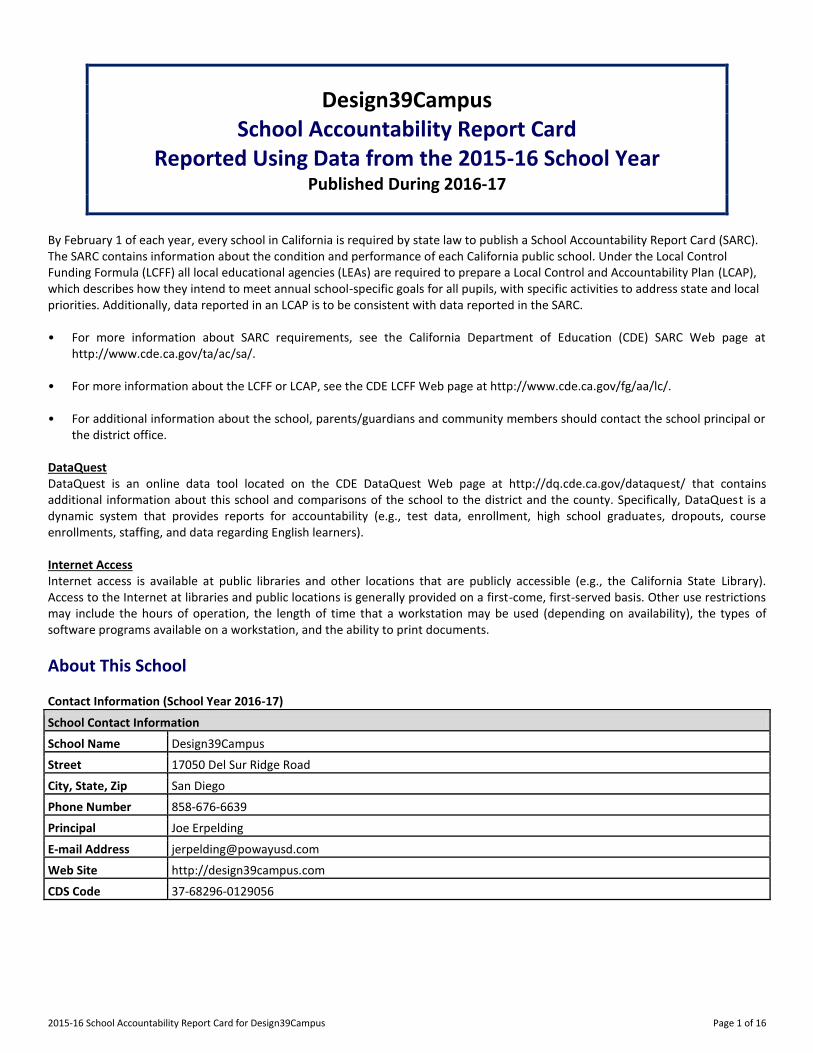
Design39Campus
School Accountability Report Card
Reported Using Data from the 2015-16 School Year
Published During 2016-17
By February 1 of each year, every school in California is required by state law to publish a School Accountability Report Card (SARC). The SARC contains information about the condition and performance of each California public school. Under the Local Control Funding Formula (LCFF) all local educational agencies (LEAs) are required to prepare a Local Control and Accountability Plan (LCAP), which describes how they intend to meet annual school-specific goals for all pupils, with specific activities to address state and local priorities. Additionally, data reported in an LCAP is to be consistent with data reported in the SARC. • For more information about SARC requirements, see the California Department of Education (CDE) SARC Web page at
http://www.cde.ca.gov/ta/ac/sa/. • For more information about the LCFF or LCAP, see the CDE LCFF Web page at http://www.cde.ca.gov/fg/aa/lc/. • For additional information about the school, parents/guardians and community members should contact the school principal or
the district office. DataQuest DataQuest is an online data tool located on the CDE DataQuest Web page at http://dq.cde.ca.gov/dataquest/ that contains additional information about this school and comparisons of the school to the district and the county. Specifically, DataQuest is a dynamic system that provides reports for accountability (e.g., test data, enrollment, high school graduates, dropouts, course enrollments, staffing, and data regarding English learners). Internet Access Internet access is available at public libraries and other locations that are publicly accessible (e.g., the California State Library). Access to the Internet at libraries and public locations is generally provided on a first-come, first-served basis. Other use restrictions may include the hours of operation, the length of time that a workstation may be used (depending on availability), the types of software programs available on a workstation, and the ability to print documents.
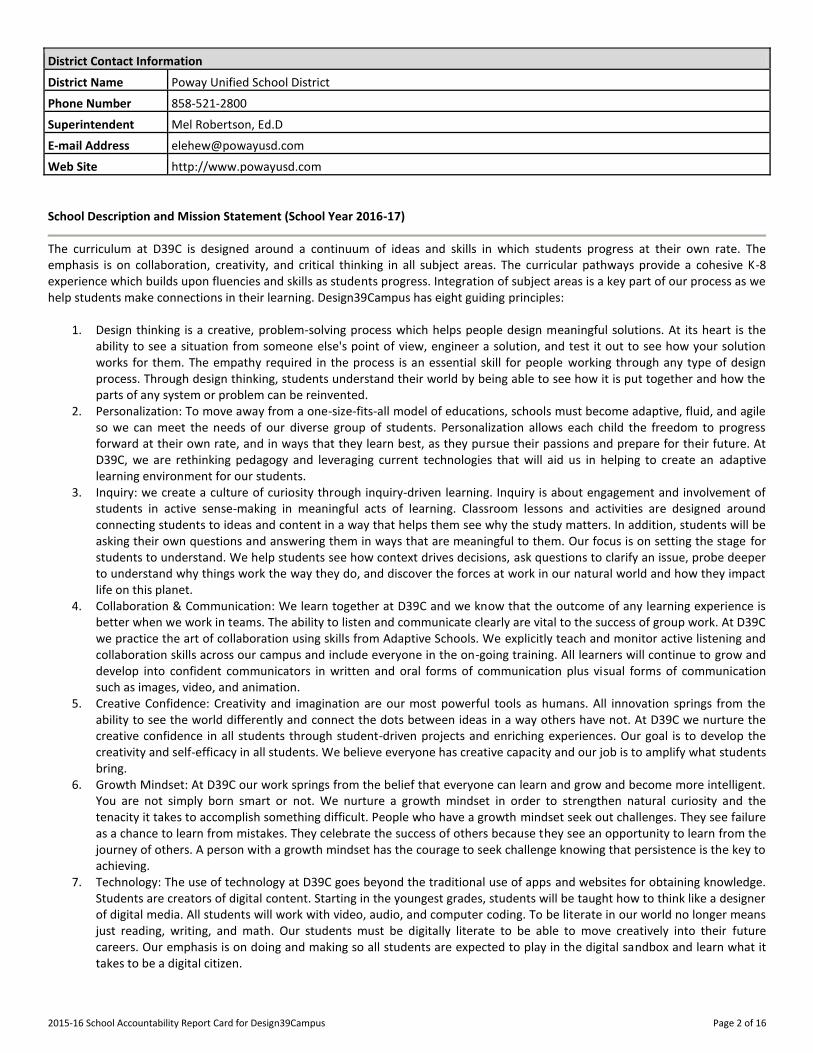
About This School Contact Information (School Year 2016-17)
School Contact Information
School Name------- Design39Campus
Street------- 17050 Del Sur Ridge Road
City, State, Zip------- San Diego
Phone Number------- 858-676-6639
Principal------- Joe Erpelding
E-mail Address------- [email protected]
Web Site------- http://design39campus.com
CDS Code 37-68296-0129056
2015-16 School Accountability Report Card for Design39Campus Page 2 of 16
District Contact Information
District Name------- Poway Unified School District
Phone Number------- 858-521-2800
Superintendent------- Mel Robertson, Ed.D
E-mail Address------- [email protected]
Web Site------- http://www.powayusd.com
School Description and Mission Statement (School Year 2016-17)
The curriculum at D39C is designed around a continuum of ideas and skills in which students progress at their own rate. The emphasis is on collaboration, creativity, and critical thinking in all subject areas. The curricular pathways provide a cohesive K-8 experience which builds upon fluencies and skills as students progress. Integration of subject areas is a key part of our process as we help students make connections in their learning. Design39Campus has eight guiding principles:
1. Design thinking is a creative, problem-solving process which helps people design meaningful solutions. At its heart is the ability to see a situation from someone else's point of view, engineer a solution, and test it out to see how your solution works for them. The empathy required in the process is an essential skill for people working through any type of design process. Through design thinking, students understand their world by being able to see how it is put together and how the parts of any system or problem can be reinvented.
2. Personalization: To move away from a one-size-fits-all model of educations, schools must become adaptive, fluid, and agile so we can meet the needs of our diverse group of students. Personalization allows each child the freedom to progress forward at their own rate, and in ways that they learn best, as they pursue their passions and prepare for their future. At D39C, we are rethinking pedagogy and leveraging current technologies that will aid us in helping to create an adaptive learning environment for our students.
3. Inquiry: we create a culture of curiosity through inquiry-driven learning. Inquiry is about engagement and involvement of students in active sense-making in meaningful acts of learning. Classroom lessons and activities are designed around connecting students to ideas and content in a way that helps them see why the study matters. In addition, students will be asking their own questions and answering them in ways that are meaningful to them. Our focus is on setting the stage for students to understand. We help students see how context drives decisions, ask questions to clarify an issue, probe deeper to understand why things work the way they do, and discover the forces at work in our natural world and how they impact life on this planet.
4. Collaboration & Communication: We learn together at D39C and we know that the outcome of any learning experience is better when we work in teams. The ability to listen and communicate clearly are vital to the success of group work. At D39C we practice the art of collaboration using skills from Adaptive Schools. We explicitly teach and monitor active listening and collaboration skills across our campus and include everyone in the on-going training. All learners will continue to grow and develop into confident communicators in written and oral forms of communication plus visual forms of communication such as images, video, and animation.
5. Creative Confidence: Creativity and imagination are our most powerful tools as humans. All innovation springs from the ability to see the world differently and connect the dots between ideas in a way others have not. At D39C we nurture the creative confidence in all students through student-driven projects and enriching experiences. Our goal is to develop the creativity and self-efficacy in all students. We believe everyone has creative capacity and our job is to amplify what students bring.
6. Growth Mindset: At D39C our work springs from the belief that everyone can learn and grow and become more intelligent. You are not simply born smart or not. We nurture a growth mindset in order to strengthen natural curiosity and the tenacity it takes to accomplish something difficult. People who have a growth mindset seek out challenges. They see failure as a chance to learn from mistakes. They celebrate the success of others because they see an opportunity to learn from the journey of others. A person with a growth mindset has the courage to seek challenge knowing that persistence is the key to achieving.
7. Technology: The use of technology at D39C goes beyond the traditional use of apps and websites for obtaining knowledge. Students are creators of digital content. Starting in the youngest grades, students will be taught how to think like a designer of digital media. All students will work with video, audio, and computer coding. To be literate in our world no longer means just reading, writing, and math. Our students must be digitally literate to be able to move creatively into their future careers. Our emphasis is on doing and making so all students are expected to play in the digital sandbox and learn what it takes to be a digital citizen.
2015-16 School Accountability Report Card for Design39Campus Page 3 of 16
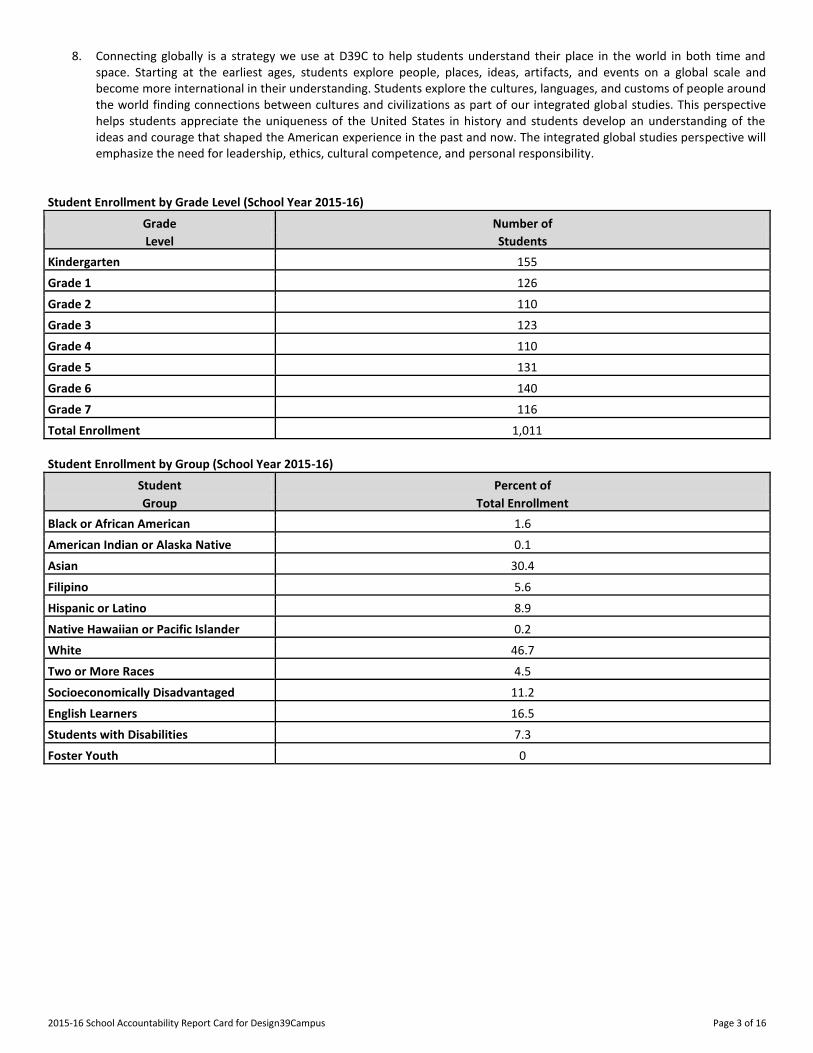
8. Connecting globally is a strategy we use at D39C to help students understand their place in the world in both time and space. Starting at the earliest ages, students explore people, places, ideas, artifacts, and events on a global scale and become more international in their understanding. Students explore the cultures, languages, and customs of people around the world finding connections between cultures and civilizations as part of our integrated global studies. This perspective helps students appreciate the uniqueness of the United States in history and students develop an understanding of the ideas and courage that shaped the American experience in the past and now. The integrated global studies perspective will emphasize the need for leadership, ethics, cultural competence, and personal responsibility.
Student Enrollment by Grade Level (School Year 2015-16)
Grade Number of
Level Students
Kindergarten 155
Grade 1 126
Grade 2 110
Grade 3 123
Grade 4 110
Grade 5 131
Grade 6 140
Grade 7 116
Total Enrollment 1,011
Student Enrollment by Group (School Year 2015-16)
Student Percent of
Group Total Enrollment
Black or African American 1.6
American Indian or Alaska Native 0.1
Asian 30.4
Filipino 5.6
Hispanic or Latino 8.9
Native Hawaiian or Pacific Islander 0.2
White 46.7
Two or More Races 4.5
Socioeconomically Disadvantaged 11.2
English Learners 16.5
Students with Disabilities 7.3
Foster Youth 0
2015-16 School Accountability Report Card for Design39Campus Page 4 of 16
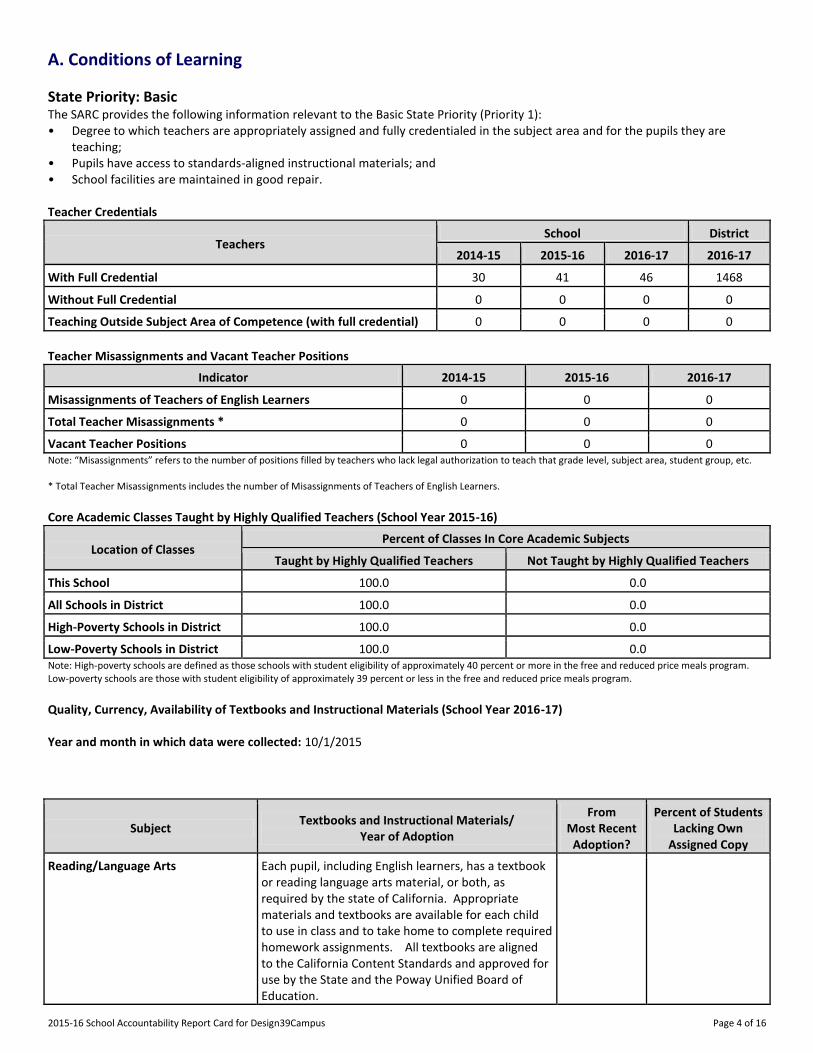
A. Conditions of Learning
State Priority: Basic The SARC provides the following information relevant to the Basic State Priority (Priority 1): • Degree to which teachers are appropriately assigned and fully credentialed in the subject area and for the pupils they are
teaching; • Pupils have access to standards-aligned instructional materials; and • School facilities are maintained in good repair. Teacher Credentials
Teachers School District
2014-15 2015-16 2016-17 2016-17
With Full Credential 30 41 46 1468
Without Full Credential 0 0 0 0
Teaching Outside Subject Area of Competence (with full credential) 0 0 0 0
Teacher Misassignments and Vacant Teacher Positions
Indicator 2014-15 2015-16 2016-17
Misassignments of Teachers of English Learners 0 0 0
Total Teacher Misassignments * 0 0 0
Vacant Teacher Positions 0 0 0 Note: “Misassignments” refers to the number of positions filled by teachers who lack legal authorization to teach that grade level, subject area, student group, etc. * Total Teacher Misassignments includes the number of Misassignments of Teachers of English Learners. Core Academic Classes Taught by Highly Qualified Teachers (School Year 2015-16)
Location of Classes Percent of Classes In Core Academic Subjects
Taught by Highly Qualified Teachers Not Taught by Highly Qualified Teachers
This School 100.0 0.0
All Schools in District 100.0 0.0
High-Poverty Schools in District 100.0 0.0
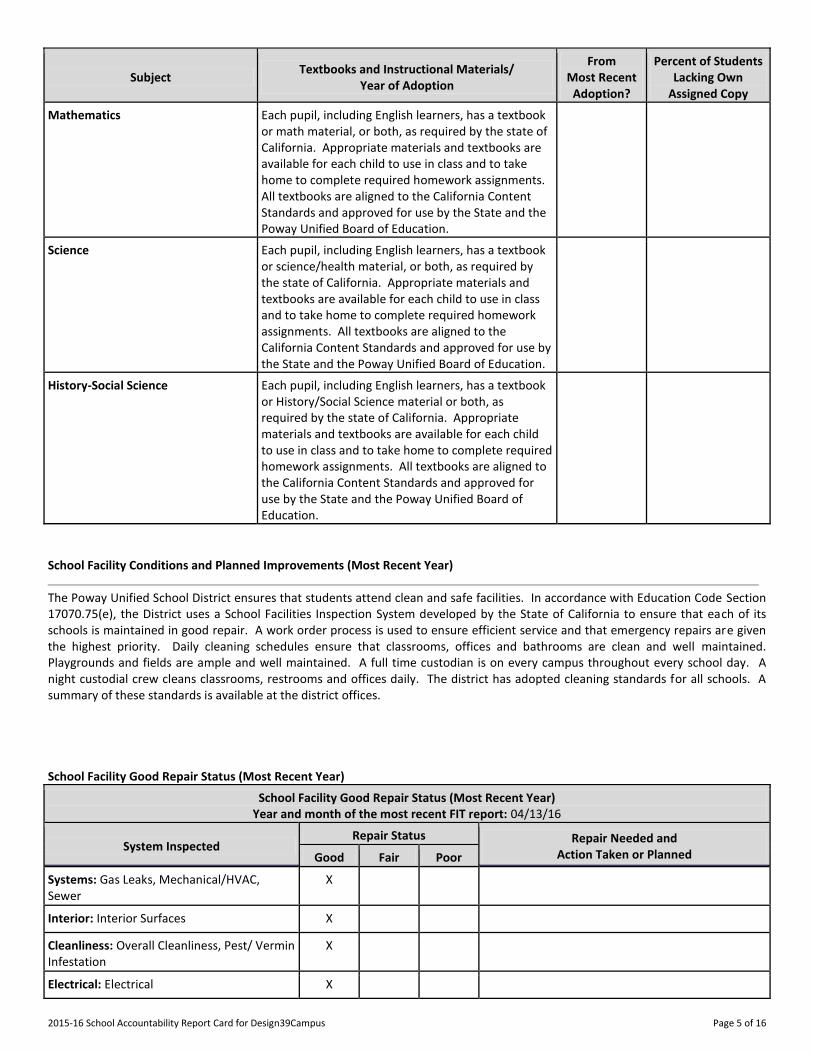
Low-Poverty Schools in District 100.0 0.0 Note: High-poverty schools are defined as those schools with student eligibility of approximately 40 percent or more in the free and reduced price meals program. Low-poverty schools are those with student eligibility of approximately 39 percent or less in the free and reduced price meals program. Quality, Currency, Availability of Textbooks and Instructional Materials (School Year 2016-17) Year and month in which data were collected: 10/1/2015
Subject Textbooks and Instructional Materials/
Year of Adoption
From Most Recent
Adoption?
Percent of Students Lacking Own
Assigned Copy
Reading/Language Arts Each pupil, including English learners, has a textbook or reading language arts material, or both, as required by the state of California. Appropriate materials and textbooks are available for each child to use in class and to take home to complete required homework assignments. All textbooks are aligned to the California Content Standards and approved for use by the State and the Poway Unified Board of Education.
2015-16 School Accountability Report Card for Design39Campus Page 5 of 16
Subject Textbooks and Instructional Materials/
Year of Adoption
From Most Recent
Adoption?
Percent of Students Lacking Own
Assigned Copy
Mathematics Each pupil, including English learners, has a textbook or math material, or both, as required by the state of California. Appropriate materials and textbooks are available for each child to use in class and to take home to complete required homework assignments. All textbooks are aligned to the California Content Standards and approved for use by the State and the Poway Unified Board of Education.
Science Each pupil, including English learners, has a textbook or science/health material, or both, as required by the state of California. Appropriate materials and textbooks are available for each child to use in class and to take home to complete required homework assignments. All textbooks are aligned to the California Content Standards and approved for use by the State and the Poway Unified Board of Education.
History-Social Science Each pupil, including English learners, has a textbook or History/Social Science material or both, as required by the state of California. Appropriate materials and textbooks are available for each child to use in class and to take home to complete required homework assignments. All textbooks are aligned to the California Content Standards and approved for use by the State and the Poway Unified Board of Education.
School Facility Conditions and Planned Improvements (Most Recent Year)
The Poway Unified School District ensures that students attend clean and safe facilities. In accordance with Education Code Section 17070.75(e), the District uses a School Facilities Inspection System developed by the State of California to ensure that each of its schools is maintained in good repair. A work order process is used to ensure efficient service and that emergency repairs are given the highest priority. Daily cleaning schedules ensure that classrooms, offices and bathrooms are clean and well maintained. Playgrounds and fields are ample and well maintained. A full time custodian is on every campus throughout every school day. A night custodial crew cleans classrooms, restrooms and offices daily. The district has adopted cleaning standards for all schools. A summary of these standards is available at the district offices. School Facility Good Repair Status (Most Recent Year)
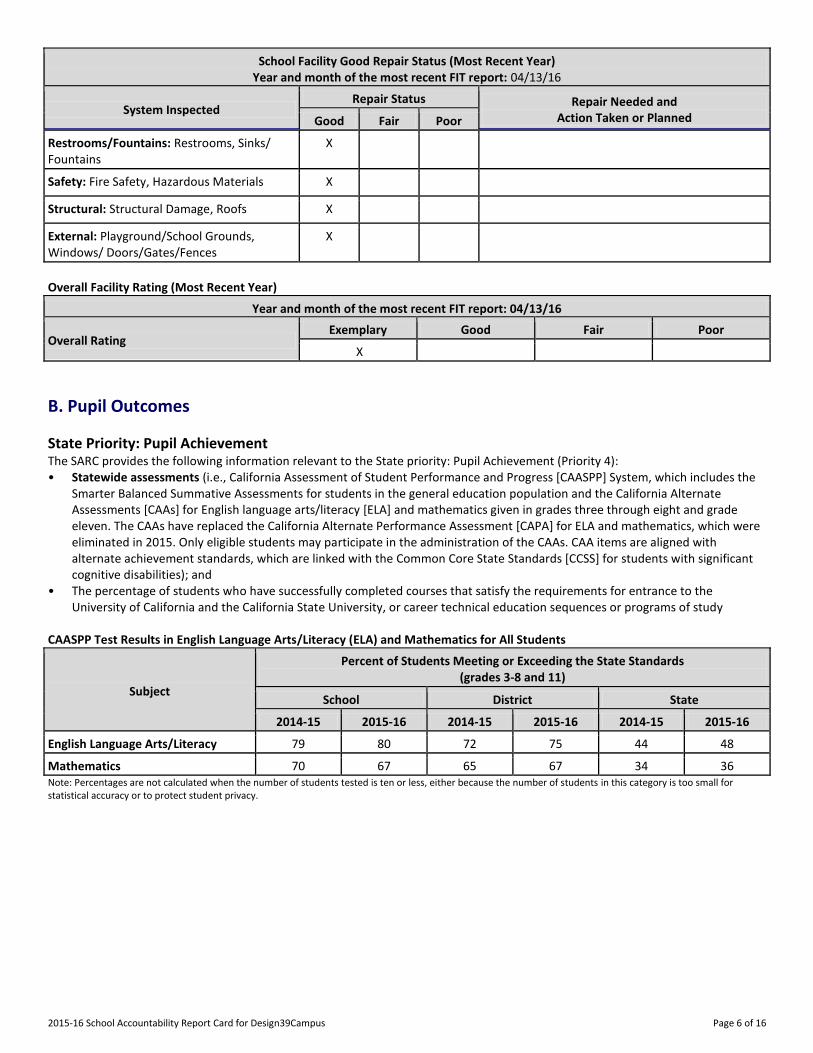
School Facility Good Repair Status (Most Recent Year) Year and month of the most recent FIT report: 04/13/16
System Inspected Repair Status Repair Needed and
Action Taken or Planned Good Fair Poor
Systems: Gas Leaks, Mechanical/HVAC, Sewer
X
Interior: Interior Surfaces X
Cleanliness: Overall Cleanliness, Pest/ Vermin Infestation
X
Electrical: Electrical X
2015-16 School Accountability Report Card for Design39Campus Page 6 of 16
School Facility Good Repair Status (Most Recent Year) Year and month of the most recent FIT report: 04/13/16
System Inspected Repair Status Repair Needed and
Action Taken or Planned Good Fair Poor
Restrooms/Fountains: Restrooms, Sinks/ Fountains
X
Safety: Fire Safety, Hazardous Materials X
Structural: Structural Damage, Roofs X
External: Playground/School Grounds, Windows/ Doors/Gates/Fences
X
Overall Facility Rating (Most Recent Year)
Year and month of the most recent FIT report: 04/13/16
Overall Rating Exemplary Good Fair Poor
X
B. Pupil Outcomes
State Priority: Pupil Achievement The SARC provides the following information relevant to the State priority: Pupil Achievement (Priority 4): • Statewide assessments (i.e., California Assessment of Student Performance and Progress [CAASPP] System, which includes the
Smarter Balanced Summative Assessments for students in the general education population and the California Alternate Assessments [CAAs] for English language arts/literacy [ELA] and mathematics given in grades three through eight and grade eleven. The CAAs have replaced the California Alternate Performance Assessment [CAPA] for ELA and mathematics, which were eliminated in 2015. Only eligible students may participate in the administration of the CAAs. CAA items are aligned with alternate achievement standards, which are linked with the Common Core State Standards [CCSS] for students with significant cognitive disabilities); and
• The percentage of students who have successfully completed courses that satisfy the requirements for entrance to the University of California and the California State University, or career technical education sequences or programs of study
CAASPP Test Results in English Language Arts/Literacy (ELA) and Mathematics for All Students
Subject
Percent of Students Meeting or Exceeding the State Standards (grades 3-8 and 11)
School District State
2014-15 2015-16 2014-15 2015-16 2014-15 2015-16
English Language Arts/Literacy 79 80 72 75 44 48
Mathematics 70 67 65 67 34 36 Note: Percentages are not calculated when the number of students tested is ten or less, either because the number of students in this category is too small for statistical accuracy or to protect student privacy.
2015-16 School Accountability Report Card for Design39Campus Page 7 of 16
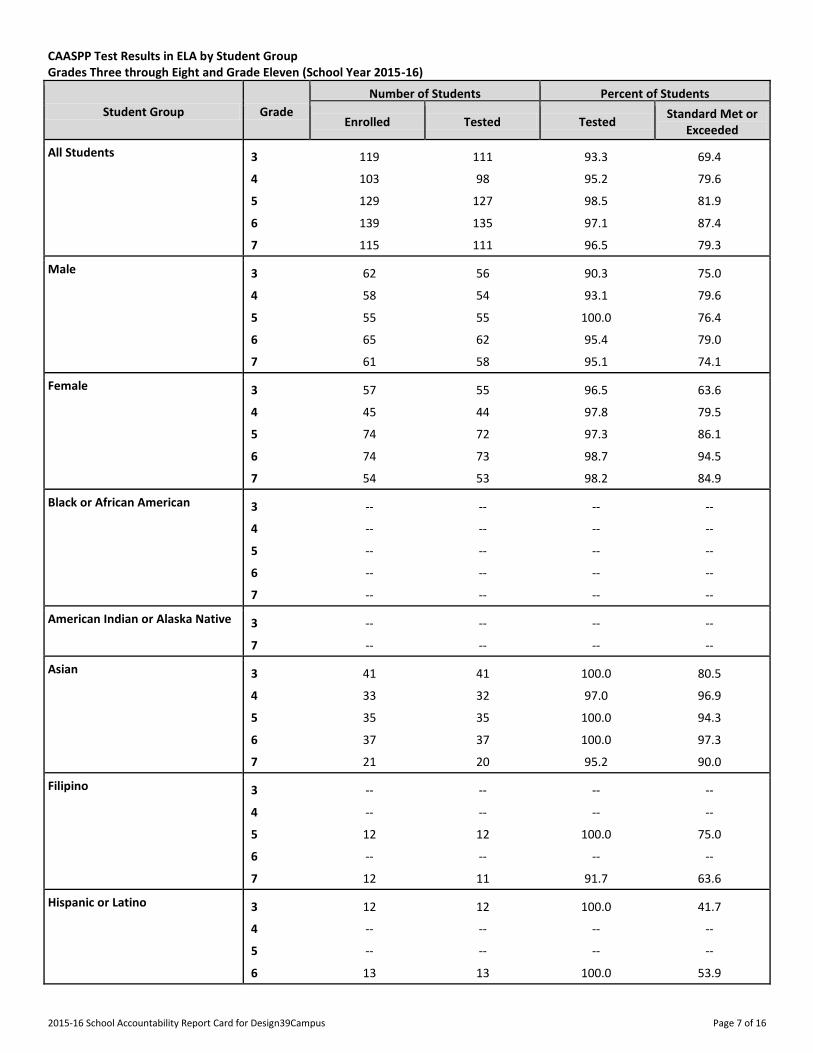
CAASPP Test Results in ELA by Student Group Grades Three through Eight and Grade Eleven (School Year 2015-16)
Student Group Grade
Number of Students Percent of Students
Enrolled Tested Tested Standard Met or
Exceeded
All Students 3 119 111 93.3 69.4
4 103 98 95.2 79.6
5 129 127 98.5 81.9
6 139 135 97.1 87.4
7 115 111 96.5 79.3
Male 3 62 56 90.3 75.0
4 58 54 93.1 79.6
5 55 55 100.0 76.4
6 65 62 95.4 79.0
7 61 58 95.1 74.1
Female 3 57 55 96.5 63.6
4 45 44 97.8 79.5
5 74 72 97.3 86.1
6 74 73 98.7 94.5
7 54 53 98.2 84.9
Black or African American 3 -- -- -- --
4 -- -- -- --
5 -- -- -- --
6 -- -- -- --
7 -- -- -- --
American Indian or Alaska Native 3 -- -- -- --
7 -- -- -- --
Asian 3 41 41 100.0 80.5
4 33 32 97.0 96.9
5 35 35 100.0 94.3
6 37 37 100.0 97.3
7 21 20 95.2 90.0
Filipino 3 -- -- -- --
4 -- -- -- --
5 12 12 100.0 75.0
6 -- -- -- --
7 12 11 91.7 63.6
Hispanic or Latino 3 12 12 100.0 41.7
4 -- -- -- --
5 -- -- -- --
6 13 13 100.0 53.9
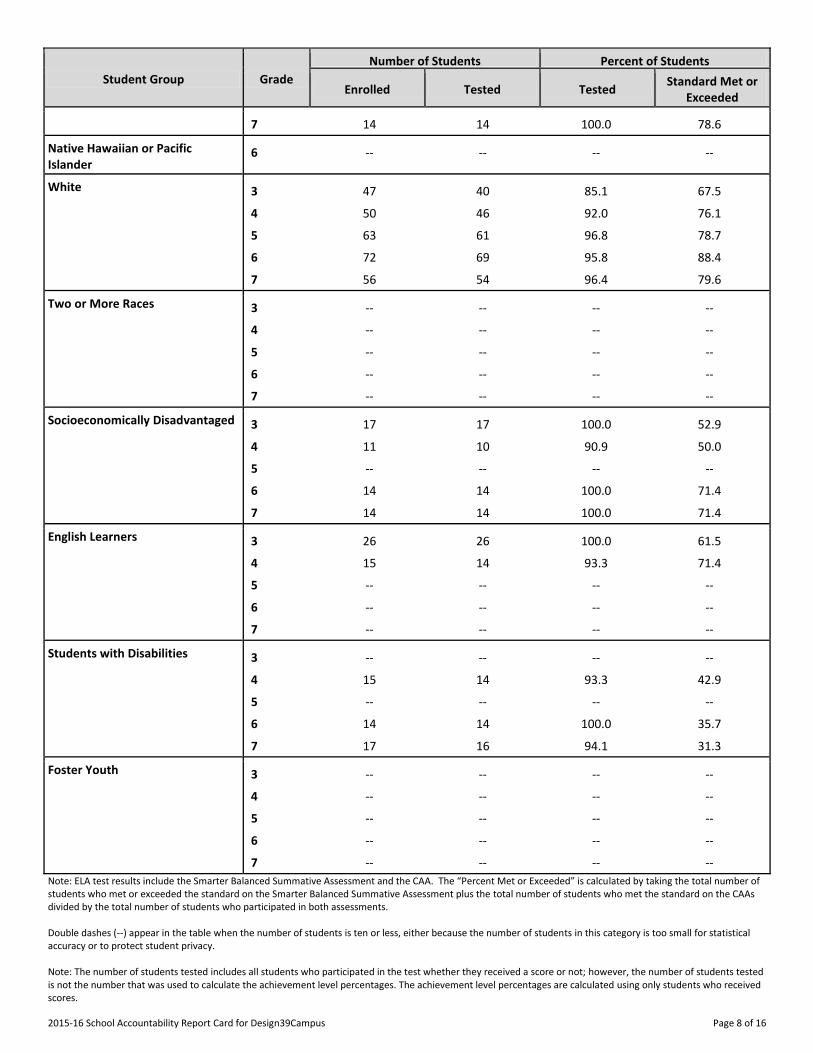
2015-16 School Accountability Report Card for Design39Campus Page 8 of 16
Student Group Grade
Number of Students Percent of Students
Enrolled Tested Tested Standard Met or
Exceeded
7 14 14 100.0 78.6
Native Hawaiian or Pacific Islander
6 -- -- -- --
White 3 47 40 85.1 67.5
4 50 46 92.0 76.1
5 63 61 96.8 78.7
6 72 69 95.8 88.4
7 56 54 96.4 79.6
Two or More Races 3 -- -- -- --
4 -- -- -- --
5 -- -- -- --
6 -- -- -- --
7 -- -- -- --
Socioeconomically Disadvantaged 3 17 17 100.0 52.9
4 11 10 90.9 50.0
5 -- -- -- --
6 14 14 100.0 71.4
7 14 14 100.0 71.4
English Learners 3 26 26 100.0 61.5
4 15 14 93.3 71.4
5 -- -- -- --
6 -- -- -- --
7 -- -- -- --
Students with Disabilities 3 -- -- -- --
4 15 14 93.3 42.9
5 -- -- -- --
6 14 14 100.0 35.7
7 17 16 94.1 31.3
Foster Youth 3 -- -- -- --
4 -- -- -- --
5 -- -- -- --
6 -- -- -- --
7 -- -- -- --
Note: ELA test results include the Smarter Balanced Summative Assessment and the CAA. The “Percent Met or Exceeded” is calculated by taking the total number of students who met or exceeded the standard on the Smarter Balanced Summative Assessment plus the total number of students who met the standard on the CAAs divided by the total number of students who participated in both assessments. Double dashes (--) appear in the table when the number of students is ten or less, either because the number of students in this category is too small for statistical accuracy or to protect student privacy. Note: The number of students tested includes all students who participated in the test whether they received a score or not; however, the number of students tested is not the number that was used to calculate the achievement level percentages. The achievement level percentages are calculated using only students who received scores.
2015-16 School Accountability Report Card for Design39Campus Page 9 of 16
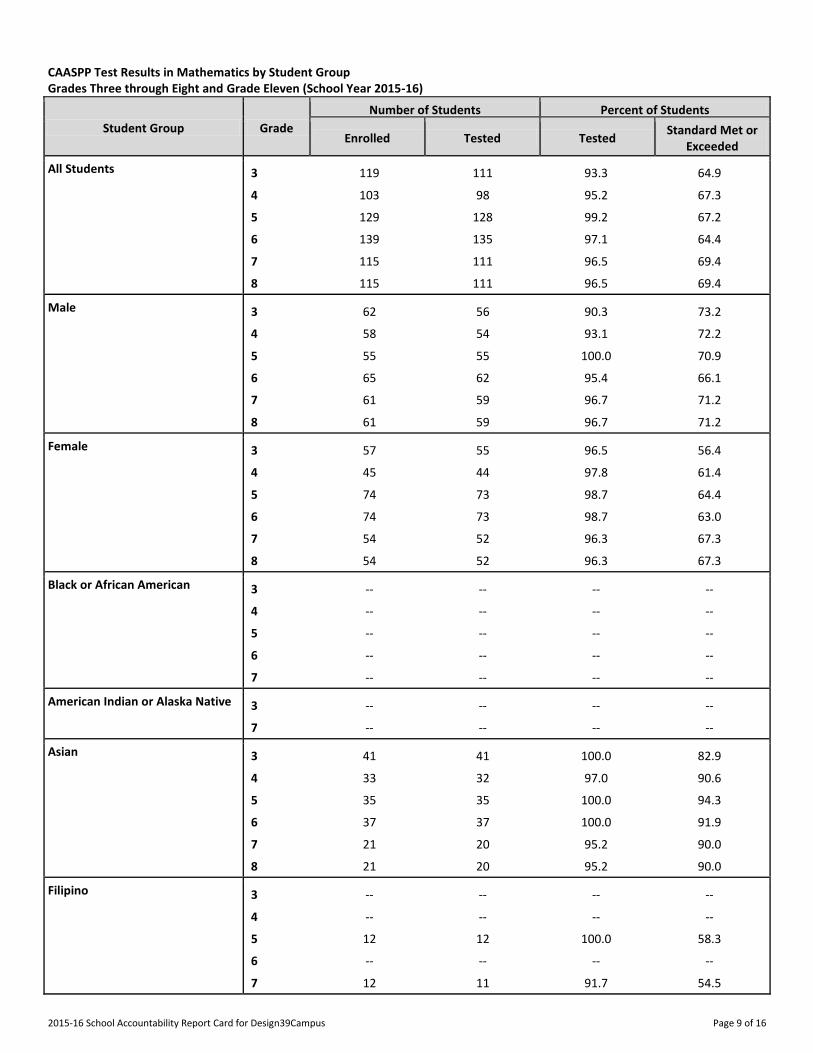
CAASPP Test Results in Mathematics by Student Group Grades Three through Eight and Grade Eleven (School Year 2015-16)
Student Group Grade
Number of Students Percent of Students
Enrolled Tested Tested Standard Met or
Exceeded
All Students 3 119 111 93.3 64.9
4 103 98 95.2 67.3
5 129 128 99.2 67.2
6 139 135 97.1 64.4
7 115 111 96.5 69.4
8 115 111 96.5 69.4
Male 3 62 56 90.3 73.2
4 58 54 93.1 72.2
5 55 55 100.0 70.9
6 65 62 95.4 66.1
7 61 59 96.7 71.2
8 61 59 96.7 71.2
Female 3 57 55 96.5 56.4
4 45 44 97.8 61.4
5 74 73 98.7 64.4
6 74 73 98.7 63.0
7 54 52 96.3 67.3
8 54 52 96.3 67.3
Black or African American 3 -- -- -- --
4 -- -- -- --
5 -- -- -- --
6 -- -- -- --
7 -- -- -- --
American Indian or Alaska Native 3 -- -- -- --
7 -- -- -- --
Asian 3 41 41 100.0 82.9
4 33 32 97.0 90.6
5 35 35 100.0 94.3
6 37 37 100.0 91.9
7 21 20 95.2 90.0
8 21 20 95.2 90.0
Filipino 3 -- -- -- --
4 -- -- -- --
5 12 12 100.0 58.3
6 -- -- -- --
7 12 11 91.7 54.5
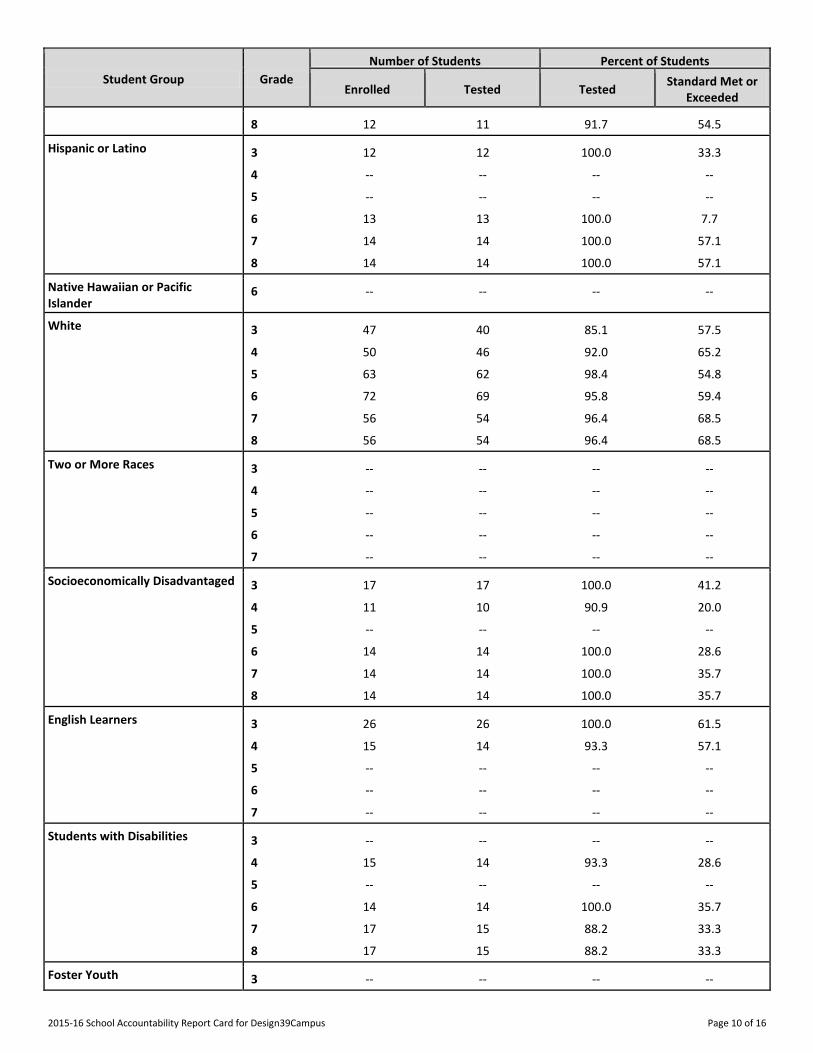
2015-16 School Accountability Report Card for Design39Campus Page 10 of 16
Student Group Grade
Number of Students Percent of Students
Enrolled Tested Tested Standard Met or
Exceeded
8 12 11 91.7 54.5
Hispanic or Latino 3 12 12 100.0 33.3
4 -- -- -- --
5 -- -- -- --
6 13 13 100.0 7.7
7 14 14 100.0 57.1
8 14 14 100.0 57.1
Native Hawaiian or Pacific Islander
6 -- -- -- --
White 3 47 40 85.1 57.5
4 50 46 92.0 65.2
5 63 62 98.4 54.8
6 72 69 95.8 59.4
7 56 54 96.4 68.5
8 56 54 96.4 68.5
Two or More Races 3 -- -- -- --
4 -- -- -- --
5 -- -- -- --
6 -- -- -- --
7 -- -- -- --
Socioeconomically Disadvantaged 3 17 17 100.0 41.2
4 11 10 90.9 20.0
5 -- -- -- --
6 14 14 100.0 28.6
7 14 14 100.0 35.7
8 14 14 100.0 35.7
English Learners 3 26 26 100.0 61.5
4 15 14 93.3 57.1
5 -- -- -- --
6 -- -- -- --
7 -- -- -- --
Students with Disabilities 3 -- -- -- --
4 15 14 93.3 28.6
5 -- -- -- --
6 14 14 100.0 35.7
7 17 15 88.2 33.3
8 17 15 88.2 33.3
Foster Youth 3 -- -- -- --
2015-16 School Accountability Report Card for Design39Campus Page 11 of 16
Student Group Grade
Number of Students Percent of Students
Enrolled Tested Tested Standard Met or
Exceeded
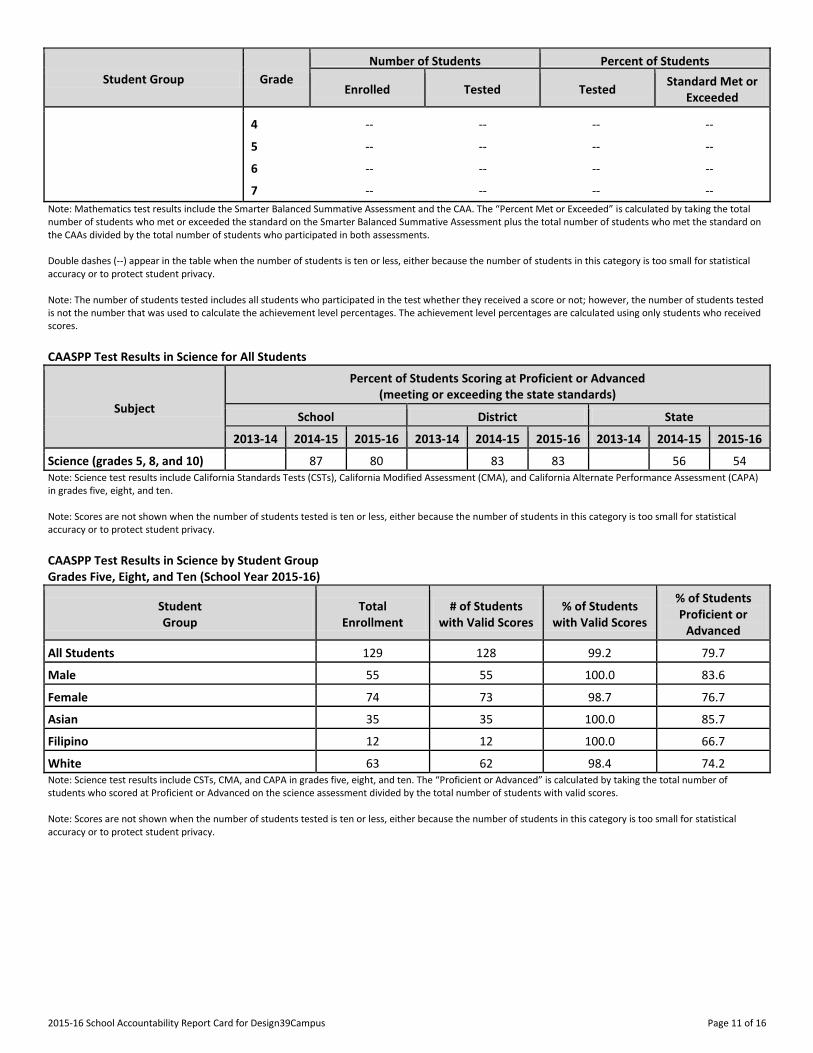
4 -- -- -- --
5 -- -- -- --
6 -- -- -- --
7 -- -- -- --
Note: Mathematics test results include the Smarter Balanced Summative Assessment and the CAA. The “Percent Met or Exceeded” is calculated by taking the total number of students who met or exceeded the standard on the Smarter Balanced Summative Assessment plus the total number of students who met the standard on the CAAs divided by the total number of students who participated in both assessments. Double dashes (--) appear in the table when the number of students is ten or less, either because the number of students in this category is too small for statistical accuracy or to protect student privacy. Note: The number of students tested includes all students who participated in the test whether they received a score or not; however, the number of students tested is not the number that was used to calculate the achievement level percentages. The achievement level percentages are calculated using only students who received scores.
CAASPP Test Results in Science for All Students
Subject
Percent of Students Scoring at Proficient or Advanced (meeting or exceeding the state standards)
School District State
2013-14 2014-15 2015-16 2013-14 2014-15 2015-16 2013-14 2014-15 2015-16
Science (grades 5, 8, and 10) 87 80 83 83 56 54 Note: Science test results include California Standards Tests (CSTs), California Modified Assessment (CMA), and California Alternate Performance Assessment (CAPA) in grades five, eight, and ten. Note: Scores are not shown when the number of students tested is ten or less, either because the number of students in this category is too small for statistical accuracy or to protect student privacy.
CAASPP Test Results in Science by Student Group Grades Five, Eight, and Ten (School Year 2015-16)
Student Group
Total Enrollment
# of Students with Valid Scores
% of Students with Valid Scores
% of Students Proficient or
Advanced
All Students 129 128 99.2 79.7
Male 55 55 100.0 83.6
Female 74 73 98.7 76.7
Asian 35 35 100.0 85.7
Filipino 12 12 100.0 66.7
White 63 62 98.4 74.2 Note: Science test results include CSTs, CMA, and CAPA in grades five, eight, and ten. The “Proficient or Advanced” is calculated by taking the total number of students who scored at Proficient or Advanced on the science assessment divided by the total number of students with valid scores. Note: Scores are not shown when the number of students tested is ten or less, either because the number of students in this category is too small for statistical accuracy or to protect student privacy.
2015-16 School Accountability Report Card for Design39Campus Page 12 of 16
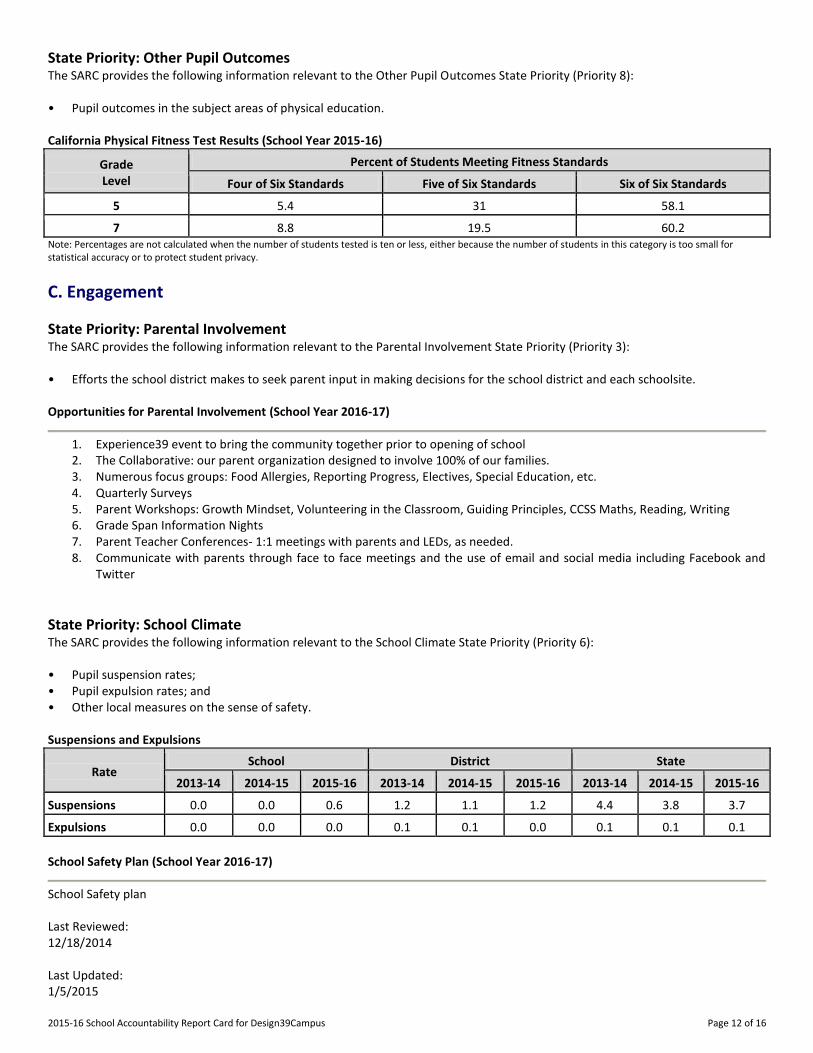
State Priority: Other Pupil Outcomes The SARC provides the following information relevant to the Other Pupil Outcomes State Priority (Priority 8): • Pupil outcomes in the subject areas of physical education. California Physical Fitness Test Results (School Year 2015-16)
Grade Level
Percent of Students Meeting Fitness Standards
Four of Six Standards Five of Six Standards Six of Six Standards
---5--- 5.4 31 58.1
---7--- 8.8 19.5 60.2 Note: Percentages are not calculated when the number of students tested is ten or less, either because the number of students in this category is too small for statistical accuracy or to protect student privacy.
C. Engagement
State Priority: Parental Involvement The SARC provides the following information relevant to the Parental Involvement State Priority (Priority 3): • Efforts the school district makes to seek parent input in making decisions for the school district and each schoolsite. Opportunities for Parental Involvement (School Year 2016-17)
1. Experience39 event to bring the community together prior to opening of school 2. The Collaborative: our parent organization designed to involve 100% of our families. 3. Numerous focus groups: Food Allergies, Reporting Progress, Electives, Special Education, etc. 4. Quarterly Surveys 5. Parent Workshops: Growth Mindset, Volunteering in the Classroom, Guiding Principles, CCSS Maths, Reading, Writing 6. Grade Span Information Nights 7. Parent Teacher Conferences- 1:1 meetings with parents and LEDs, as needed. 8. Communicate with parents through face to face meetings and the use of email and social media including Facebook and
State Priority: School Climate The SARC provides the following information relevant to the School Climate State Priority (Priority 6): • Pupil suspension rates; • Pupil expulsion rates; and • Other local measures on the sense of safety. Suspensions and Expulsions
Rate School District State
2013-14 2014-15 2015-16 2013-14 2014-15 2015-16 2013-14 2014-15 2015-16
Suspensions------- 0.0 0.0 0.6 1.2 1.1 1.2 4.4 3.8 3.7
Expulsions------- 0.0 0.0 0.0 0.1 0.1 0.0 0.1 0.1 0.1
School Safety Plan (School Year 2016-17)
School Safety plan Last Reviewed: 12/18/2014 Last Updated: 1/5/2015
2015-16 School Accountability Report Card for Design39Campus Page 13 of 16
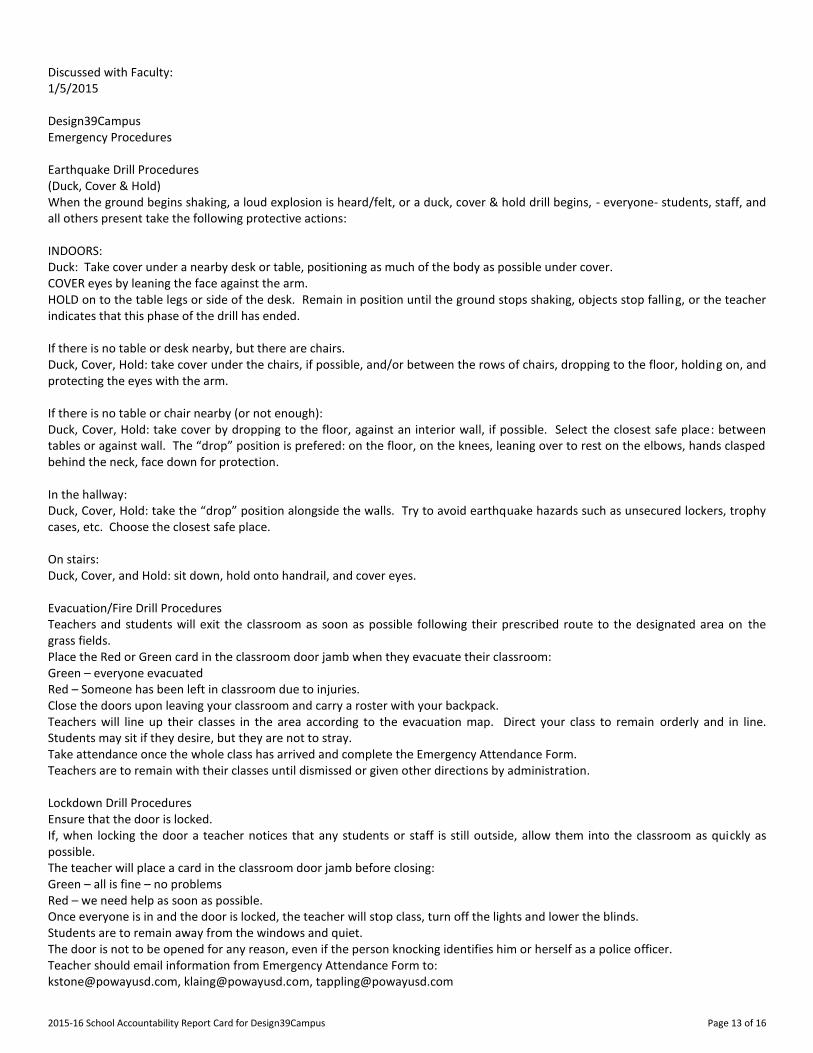
Discussed with Faculty: 1/5/2015 Design39Campus Emergency Procedures Earthquake Drill Procedures (Duck, Cover & Hold) When the ground begins shaking, a loud explosion is heard/felt, or a duck, cover & hold drill begins, - everyone- students, staff, and all others present take the following protective actions: INDOORS: Duck: Take cover under a nearby desk or table, positioning as much of the body as possible under cover. COVER eyes by leaning the face against the arm. HOLD on to the table legs or side of the desk. Remain in position until the ground stops shaking, objects stop falling, or the teacher indicates that this phase of the drill has ended. If there is no table or desk nearby, but there are chairs. Duck, Cover, Hold: take cover under the chairs, if possible, and/or between the rows of chairs, dropping to the floor, holding on, and protecting the eyes with the arm. If there is no table or chair nearby (or not enough): Duck, Cover, Hold: take cover by dropping to the floor, against an interior wall, if possible. Select the closest safe place: between tables or against wall. The “drop” position is prefered: on the floor, on the knees, leaning over to rest on the elbows, hands clasped behind the neck, face down for protection. In the hallway: Duck, Cover, Hold: take the “drop” position alongside the walls. Try to avoid earthquake hazards such as unsecured lockers, trophy cases, etc. Choose the closest safe place. On stairs: Duck, Cover, and Hold: sit down, hold onto handrail, and cover eyes. Evacuation/Fire Drill Procedures Teachers and students will exit the classroom as soon as possible following their prescribed route to the designated area on the grass fields. Place the Red or Green card in the classroom door jamb when they evacuate their classroom: Green – everyone evacuated Red – Someone has been left in classroom due to injuries. Close the doors upon leaving your classroom and carry a roster with your backpack. Teachers will line up their classes in the area according to the evacuation map. Direct your class to remain orderly and in line. Students may sit if they desire, but they are not to stray. Take attendance once the whole class has arrived and complete the Emergency Attendance Form. Teachers are to remain with their classes until dismissed or given other directions by administration. Lockdown Drill Procedures Ensure that the door is locked. If, when locking the door a teacher notices that any students or staff is still outside, allow them into the classroom as quickly as possible. The teacher will place a card in the classroom door jamb before closing: Green – all is fine – no problems Red – we need help as soon as possible. Once everyone is in and the door is locked, the teacher will stop class, turn off the lights and lower the blinds. Students are to remain away from the windows and quiet. The door is not to be opened for any reason, even if the person knocking identifies him or herself as a police officer. Teacher should email information from Emergency Attendance Form to: [email protected], [email protected], [email protected]
2015-16 School Accountability Report Card for Design39Campus Page 14 of 16
Teachers are responsible for the well-being and behavior of their students during the drill until dismissed or given other directions from the administration. During a lockdown, if a situation occurs in the classroom requiring help, the teacher may change the card from green to red.
D. Other SARC Information
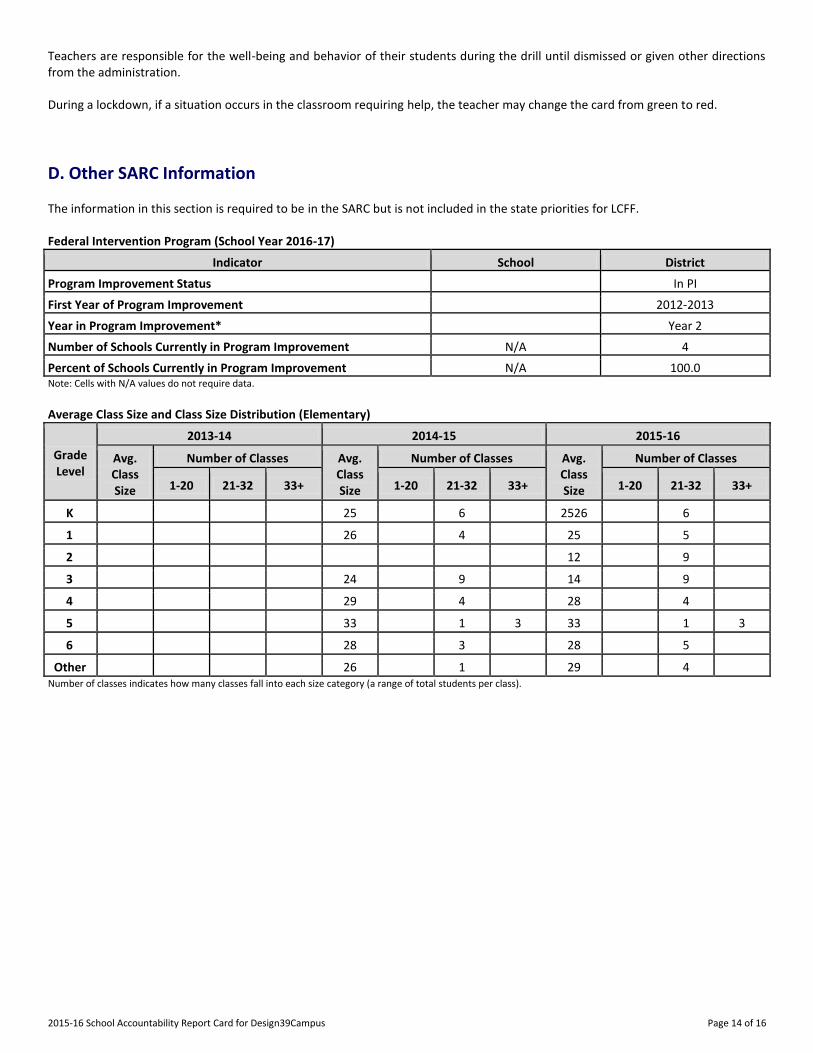
The information in this section is required to be in the SARC but is not included in the state priorities for LCFF. Federal Intervention Program (School Year 2016-17)
Indicator School District
Program Improvement Status In PI
First Year of Program Improvement 2012-2013
Year in Program Improvement* Year 2
Number of Schools Currently in Program Improvement N/A 4
Percent of Schools Currently in Program Improvement N/A 100.0 Note: Cells with N/A values do not require data.
Average Class Size and Class Size Distribution (Elementary)
Grade Level
2013-14 2014-15 2015-16
Avg. Class Size
Number of Classes Avg. Class Size
Number of Classes Avg. Class Size
Number of Classes
1-20 21-32 33+ 1-20 21-32 33+ 1-20 21-32 33+
K
25 6 2526 6
1
26 4 25 5
2
12 9
3
24 9 14 9
4
29 4 28 4
5
33 1 3 33 1 3
6
28 3 28 5
Other
26 1 29 4 Number of classes indicates how many classes fall into each size category (a range of total students per class).
2015-16 School Accountability Report Card for Design39Campus Page 15 of 16
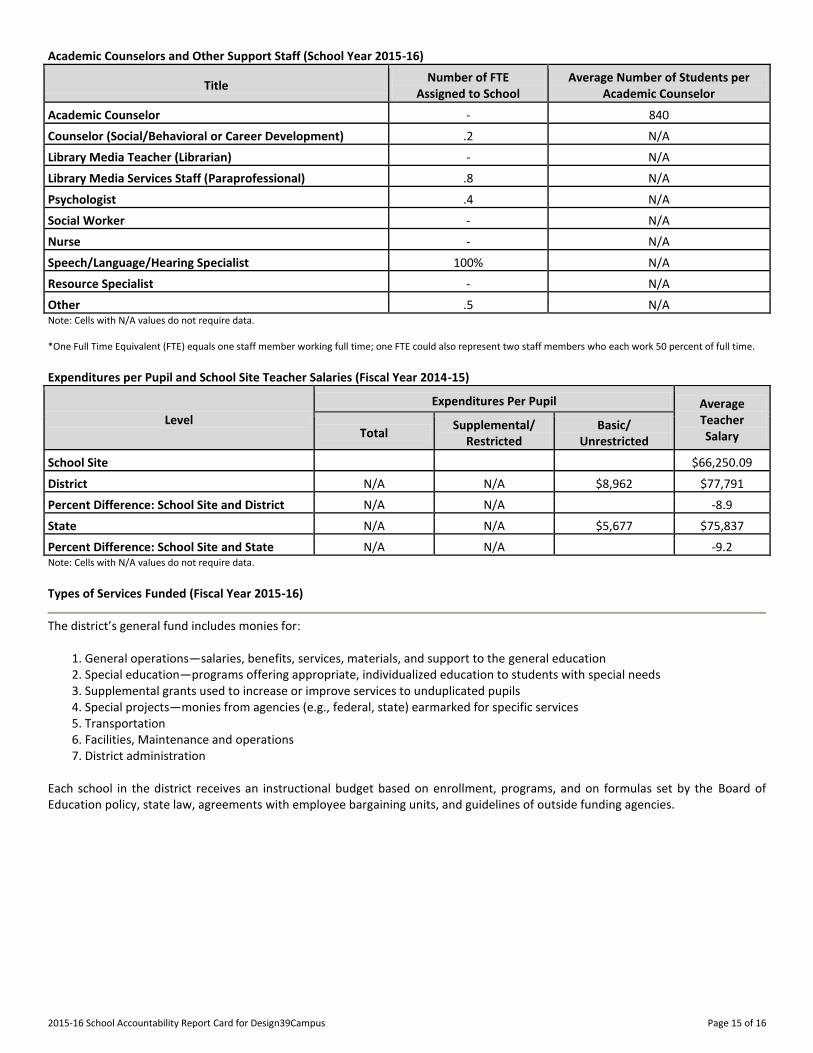
Academic Counselors and Other Support Staff (School Year 2015-16)
Title Number of FTE
Assigned to School Average Number of Students per
Academic Counselor
Academic Counselor------- - 840
Counselor (Social/Behavioral or Career Development) .2 N/A
Library Media Teacher (Librarian) - N/A
Library Media Services Staff (Paraprofessional) .8 N/A
Psychologist------- .4 N/A
Social Worker------- - N/A
Nurse------- - N/A
Speech/Language/Hearing Specialist 100% N/A
Resource Specialist------- - N/A
Other------- .5 N/A Note: Cells with N/A values do not require data. *One Full Time Equivalent (FTE) equals one staff member working full time; one FTE could also represent two staff members who each work 50 percent of full time.
Expenditures per Pupil and School Site Teacher Salaries (Fiscal Year 2014-15)
Level
Expenditures Per Pupil Average Teacher Salary Total
Supplemental/ Restricted
Basic/ Unrestricted
School Site------- $66,250.09
District------- N/A N/A $8,962 $77,791
Percent Difference: School Site and District N/A N/A -8.9
State------- N/A N/A $5,677 $75,837
Percent Difference: School Site and State N/A N/A -9.2 Note: Cells with N/A values do not require data.
Types of Services Funded (Fiscal Year 2015-16)
The district’s general fund includes monies for:
1. General operations—salaries, benefits, services, materials, and support to the general education 2. Special education—programs offering appropriate, individualized education to students with special needs 3. Supplemental grants used to increase or improve services to unduplicated pupils 4. Special projects—monies from agencies (e.g., federal, state) earmarked for specific services 5. Transportation 6. Facilities, Maintenance and operations 7. District administration
Each school in the district receives an instructional budget based on enrollment, programs, and on formulas set by the Board of Education policy, state law, agreements with employee bargaining units, and guidelines of outside funding agencies.
2015-16 School Accountability Report Card for Design39Campus Page 16 of 16
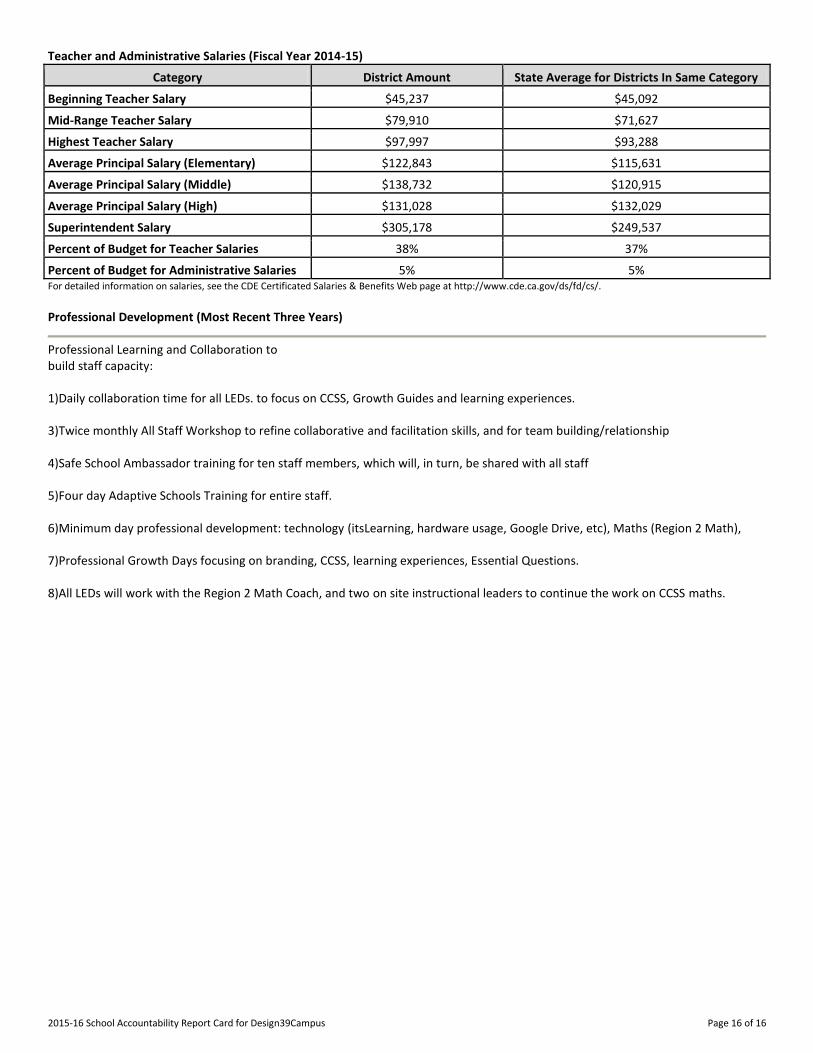
Teacher and Administrative Salaries (Fiscal Year 2014-15)
Category District Amount State Average for Districts In Same Category
Beginning Teacher Salary $45,237 $45,092
Mid-Range Teacher Salary $79,910 $71,627
Highest Teacher Salary $97,997 $93,288
Average Principal Salary (Elementary) $122,843 $115,631
Average Principal Salary (Middle) $138,732 $120,915
Average Principal Salary (High) $131,028 $132,029
Superintendent Salary $305,178 $249,537
Percent of Budget for Teacher Salaries 38% 37%
Percent of Budget for Administrative Salaries 5% 5% For detailed information on salaries, see the CDE Certificated Salaries & Benefits Web page at http://www.cde.ca.gov/ds/fd/cs/. Professional Development (Most Recent Three Years)
Professional Learning and Collaboration to build staff capacity: 1)Daily collaboration time for all LEDs. to focus on CCSS, Growth Guides and learning experiences. 3)Twice monthly All Staff Workshop to refine collaborative and facilitation skills, and for team building/relationship 4)Safe School Ambassador training for ten staff members, which will, in turn, be shared with all staff 5)Four day Adaptive Schools Training for entire staff. 6)Minimum day professional development: technology (itsLearning, hardware usage, Google Drive, etc), Maths (Region 2 Math), 7)Professional Growth Days focusing on branding, CCSS, learning experiences, Essential Questions. 8)All LEDs will work with the Region 2 Math Coach, and two on site instructional leaders to continue the work on CCSS maths.