Embed Size (px)
Citation preview

www.orcina.com
R648#04#02 OrcaFlex VIV Comparison with Deepstar Seneca Trials.doc, 1-Nov-18 Page 1 of 15
OrcaFlex VIV Toolbox Validation
Comparisons withMeasured Data from
Deepstar Seneca Trials
Project 648
Client: Orcina Ltd.
Revision History: Report No. Issue Report Date Report Status
04 02 17 May 2007 Issue
04 01 18 July 2006 Draft
For Orcina: Author: R M Isherwood
Checked: P P Quiggin
Report file: R648#04#02 OrcaFlex VIV Comparison with Deepstar Seneca Trials.doc

www.orcina.com
R648#04#02 OrcaFlex VIV Comparison with Deepstar Seneca Trials.doc, 1-Nov-18 Page 2 of 15
1 IntroductionThis is one of a series of reports comparing measurements of VIV response withpredictions made using the OrcaFlex VIV Toolbox (Ref. 1). In this report we give a briefdescription of the test cases and present comparisons between measurement andprediction.
We do not attempt in this report to draw firm conclusions regarding the validity andappropriate field of application for each of the VIV models in the Toolbox, on thegrounds that conclusions based on a single set of tests would be of limited value andcould be misleading. General conclusions are drawn in a separate report (Ref. 2), inwhich we review comparisons over as wide a range of conditions as possible.
The DeepStar tests were quite recent and the project was still active when we werecarrying out our computations. We were also fortunate in having access to some of theraw measurements and this, together with the detailed analysis of the data supplied byDeepStar gave some valuable insights into long riser VIV which are both important intheir own right and relevant to the validation of VIV prediction software. We discussthese issues in Section 3 following a brief review of the test data in Section 2. Thecomparisons between measurement and prediction are presented in Section 4 anddiscussed in Section 5.
2 Data Obtained2.1 Data Sources
VIV tests were carried out in 2004 as part of the DeepStar project (CTR 7402). The testswere carried out on riser models with high L/D (1800 to 4000), comparable with L/D forreal world deepwater risers. Tests included bare pipe and straked pipe with variousamounts of strake cover, in uniform and shear flows.
Two sets of tests were carried out, one in Lake Seneca, NY, and one offshore Miami, FL.An in-house review revealed anomalies in the Miami measured data which led us toconclude that these results are not at present suitable for software benchmarking.Accordingly, in this report we consider only the Seneca tests.
2.2 Test Details
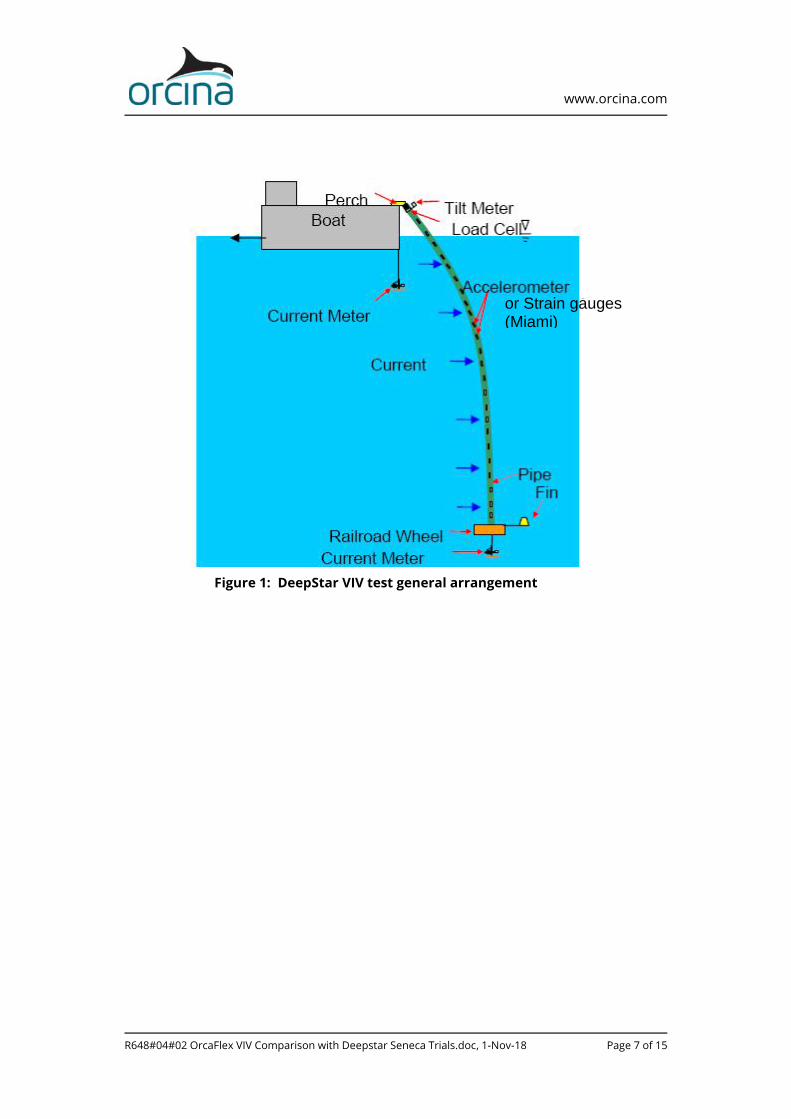
The system general arrangement is shown in Figure 1. The railroad wheel at thebottom end was there simply as a weight to apply tension to the riser. Instrumentationfor the Seneca tests consisted of accelerometers placed at intervals down the riser.
Some key parameters of the tests are tabulated below for convenience: full details aregiven in the references cited. Test conditions were supplied to us by DeepStar for allcases. Measured test results were supplied for the Open cases but were withheld forthe Blind cases. This report therefore considers the Open test cases only.
Test series Riser Details Test cases Ref.Open Blind
Seneca Bare Bare riser; 1.31 in. OD x 401 ft. long. 6 2 3Seneca Straked Same riser but 201 ft. long with 100% strake
cover.3 1 4
www.orcina.com
R648#04#02 OrcaFlex VIV Comparison with Deepstar Seneca Trials.doc, 1-Nov-18 Page 3 of 15
Riser mass ratio (mass including contents/displaced mass of water) was 1.38 for basedon bare riser details.
The tests took place in Lake Seneca, NY. Currents in the lake were negligible and flowrelative to the riser was induced by moving the boat through the water at constantspeed, giving the same constant horizontal velocity at all elevations.
Accelerations were measured at 24 locations (‘pigs’) equally spaced down the riser. Notall the accelerometers were working during the tests, and some logging difficultiesoccurred. After omitting data from non-functioning pigs, or pigs with loggingdifficulties, measurements from a total of 10 (in some cases 9) locations were availablefor each test.
The accelerometers measured acceleration in two directions normal to each other andto the riser axis. The measurement directions normal to the riser axis were nominallyaligned with the in-line and transverse directions with an alignment error estimated at±10°. No attempt has been made to correct for possible misalignment.
The accelerometers were fixed rigidly to the riser and rotated with it. In thesecircumstances, any variation in the angle to vertical of the riser axis causes a variationin the component of gravitational acceleration which is sensed by the accelerometer:i.e. the measured accelerations are “g-contaminated”. This issue is discussed in Ref. 5,Appendix 1. In the Seneca tests, transverse vibration of the riser took place atfrequencies of 2 to 3Hz. Computation showed vibration in modes around 16-18. Underthese circumstances, the effects of g-contamination are minimal. Nevertheless, the gcomponent has been included in the computed values used for the comparisons.
The acceleration data were provided in the form of RMS in-line and transverseaccelerations at each measurement location for each test. RMS displacementsobtained by double integration of the accelerations were also provided but are notconsidered in this report. Sample time histories and spectral densities of acceleration(both in-line and transverse) were also provided for each test.
3 Review of Test Results3.1 Bare Riser Tests
3.1.1 Frequency Content of VIV Response
We expect to see transverse vibration at a “fundamental” frequency close to theStrouhal frequency with in-line vibration at twice the transverse frequency. In thesetests, the spectral densities show transverse components of acceleration at 1, 3, 5 and 7times the “fundamental” frequency, and in-line components at 2, 4 and 6 times. Forexample, Figure 2 shows spectral densities of measured accelerations for four locationson the riser during a single test. Since acceleration is proportional to (frequency)2, thehigher frequency components contribute more strongly to acceleration than todisplacement.
3.1.2 Variability of VIV Response
The results of the bare riser tests provided a valuable opportunity to assessquantitatively the “repeatability” or “natural variability” of VIV. Two tests were carriedout under nominally identical conditions. We have had access to the detailed timehistories of measured acceleration for both tests, courtesy of DeepStar/MIT.

www.orcina.com
R648#04#02 OrcaFlex VIV Comparison with Deepstar Seneca Trials.doc, 1-Nov-18 Page 4 of 15
Time histories of acceleration were measured for durations of 160 to 180s. Figure 3shows time history plots of transverse acceleration for the same location in the upperpart of the riser for the two tests. Scales are the same for both graphs. Two pointsstand out:
acceleration amplitude varies substantially over time for both tests the average amplitude in the upper graph is around twice that in the lower
graph.
There is no suggestion from either time history that the response is gradually settling toa consistent level, indeed rather the reverse from the upper graph where amplitudeappears to be increasing with time. Without further evidence, we have no reason toconsider any particular section of either time history as more “typical” or morerepresentative of the “true” or “steady state” VIV response. All we can say is that theamplitude of the observed response varies over a wide range.
To quantify the variation, RMS transverse accelerations were computed for successive20s “windows” for both tests. (20s represents about 50 cycles of transverse VIV - longenough to avoid distortion by an occasional stray cycle, short enough to capturevariation of response with time.) The results are shown in Figure 4 where RMStransverse accelerations are plotted against arc length down the riser. The bold linesare the values reported by DeepStar for use in benchmarking, and were obtained fromthe full time histories recorded for the two tests. The lighter lines are values from the20s window analysis.
The range of variation shown is substantial. The ratio of maximum to minimum RMSacceleration at any location is never less than 2, and approaches 5 in the upper part ofthe riser. Note, also, that the distribution of VIV amplitude along the riser length doesnot show a consistent pattern: amplitude sometimes increases from top to bottom, atother times it decreases from top to bottom, and at other times there is no clear trend.
Since lengthwise variation is not consistent, a good summary measure of response overany period of time is RMS acceleration averaged over the riser length. We havemeasurements for 17 x 20s windows from the two tests under consideration. Themean of these 17 measurements is 6.8m/s2, with standard deviation 1.35m/s2 (20% ofthe mean). The measured values follow a Gaussian distribution, so we can say that theresponse averaged over the riser length is 6.8m/s2 ± 2.7m/s2 (40% of the mean) with95% confidence. This is shown in Figure 5.
3.2 100% Straked Riser Tests
It has been common practice to assume that VIV of a cylinder fitted with VIVsuppression strakes is similar to that of a bare cylinder and follows the same generalpattern but just at smaller amplitude. I.e. the strakes are assumed to reduce theamplitude of the lift force but to have no other effect. The OrcaFlex VIV Toolbox modelsinclude user-assignable factors to be applied to the lift force for just this purpose. (Asimilar practice is recommended in the SHEAR7 manual.)
The Seneca test results confound this expectation. Not only are the measured RMSaccelerations reduced by 1 to 2 orders of magnitude compared with the bare riser, butthe frequency content of the response is very different. Typical spectral densities showa single peak at the same frequency for both transverse and in-line response (Fig 6).

www.orcina.com
R648#04#02 OrcaFlex VIV Comparison with Deepstar Seneca Trials.doc, 1-Nov-18 Page 5 of 15
3.3 Use of Data for Software Validation
It is clear from the bare riser tests that the VIV response of a long riser is far fromsteady, even in steady flow conditions, so there is limited scope for making detailedcomparisons between measurement and prediction. In this report, we compareaverage and maximum values of RMS acceleration over the riser length. We compareaverage values because this is the best overall measure; maximum values because thisis a measure of worst fatigue damage. We do not attempt to compare distributions ofresponse along the riser length, since the evidence suggests that the distribution ishighly variable.
4 Calculated Results4.1 VIV Models
VIV response calculations were carried out using the OrcaFlex VIV Toolbox. In thisreport we present results for the following VIV models:
Two wake oscillator models:
Milan wake oscillator with as-published parameters (‘Milan’) Iwan and Blevins wake oscillator with as-published parameters (‘I+B’)
Two vortex tracking models:
Vortex tracking (1) uses special techniques to group newly-shed vortices intovortex sheets and decide when a sheet detaches from the riser disk and a newsheet starts to form ('VT1')
Vortex tracking (2) does not try to group vortices into sheets. However thesheets are still present in the pattern of vortices being shed. ('VT2')
Details of the models and references to the original publications are given in Ref 1.
4.2 Treatment of Straked Sections
OrcaFlex includes a facility to apply a reduction factor to the VIV force, which wasintended as a rough and ready means of representing the suppressive effects ofstrakes. Our original intention was to adjust this factor for each model so as to obtainreasonable agreement with measurement for the 100% straked tests. We found thatthis was not practical for two reasons:
The VIV response was very sensitive to small changes in reduction factor, andidentifying the “best fit” for each VIV model and each load case by trial and errorwould have been very time consuming. Furthermore, the “best fit” appeared tovary from one load case to the next, making a simple “recommended reductionfactor” unsuitable.
As noted above (Section 3.2), applying a simple reduction factor fails toreproduce the actual VIV behaviour of a straked riser.
The attempt to compare measured and predicted response for the 100% straked caseswas aborted and no results are presented here. As already noted in Section 3.2, thetest results showed that strakes were in fact highly effective and reduced VIVamplitudes by 1 to 2 orders of magnitude. Our recommendation, therefore, is to treata 100% straked riser as exhibiting negligible VIV.

www.orcina.com
R648#04#02 OrcaFlex VIV Comparison with Deepstar Seneca Trials.doc, 1-Nov-18 Page 6 of 15
4.3 Comparisons and Presentation of Results
Comparisons are presented for the four VIV models in Figures 7 to 10. The form ofpresentation is the same in each figure and is as follows:
Top Left: RMS transverse acceleration averaged over the riser length:predicted versus measured
Top Right: Maximum RMS transverse acceleration irrespective of axiallocation: predicted versus measured
Centre: Dominant frequency of transverse acceleration: predicted versusmeasured
Bottom: Bias ratio plot (predicted/measured) for each of the above threequantities plotted against flow speed
5 Review of ComparisonsTable 5.1 gives the mean and standard deviation (SD) over the test series for the biasratios shown plotted in Figures 7 to 10. Table entries are given in the form Mean ± SD.
Ave RMSAccel
Max RMSAccel
Dom Freq
Milan 0.80 ± 0.11 0.96 ± 0.20 1.00 ± 0.10
I+B 1.35 ± 0.22 1.58 ± 0.35 1.17 ± 0.13
VT(1) 37.5 ± 13.6 49.3 ± 11.0 18.1 ± 1.3
VT(2) 4.00 ± 0.55 4.14 ± 0.74 7.40 ± 0.42
Table 5.1: Average Bias Ratio ± Scatter for all models
Overall, the Wake Oscillator models are more successful that the Vortex Trackingmodels in predicting VIV amplitude and frequency. The Milan Wake Oscillator model isparticularly successful.
6 AcknowledgementsOrcina Ltd. wish to thank the DeepStar project and its sponsoring companies forpermission to use the VIV measurements for this comparison study.
7 References1 OrcaFlex User Manual (Version 9.0 or later), Orcina Ltd.
2 R648#01#02 OrcaFlex VIV Toolbox Validation: Summary and Recommendations,Orcina Ltd., Report R648#01#01, 17 May 2007.
3 Vandiver J K, et al: Benchmark Data for the Bare Pipe Test Cases from theDeepStar/MIT Lake Seneca Test conducted on July 14, 2004.
4 Vandiver J K, et al: Benchmark Data for the Straked Pipe Cases from theDeepStar/MIT Lake Seneca Test conducted on July 15, 2004.
5 OrcinaLtd: OrcaFlex VIV Toolbox Validation: Comparisons with measured datafrom Schiehallion Drilling Riser, 20 March 2006.
www.orcina.com
R648#04#02 OrcaFlex VIV Comparison with Deepstar Seneca Trials.doc, 1-Nov-18 Page 7 of 15
Figure 1: DeepStar VIV test general arrangement
(Seneca)or Strain gauges(Miami)

www.orcina.com
R648#04#02 OrcaFlex VIV Comparison with Deepstar Seneca Trials.doc, 1-Nov-18 Page 8 of 15
Figure 2: Spectral densities of Transverse and In-Line Accelerations
-60
-40
-20
0
20
40
60
80
0.00 20.00 40.00 60.00 80.00 100.00 120.00 140.00 160.00 180.00 200.00
Time (sec)
Pig
16 A
ccel
erat
ion
- Cro
ss fl
ow (m
/s**
2)
-60
-40
-20
0
20
40
60
80
0.00 20.00 40.00 60.00 80.00 100.00 120.00 140.00 160.00 180.00
Time (sec)
Pig
16 A
ccel
erat
ion
- Cro
ss fl
ow (m
/s**
2)
Figure 3: Measured transverse accelerations at the same location from two testsunder identical conditions

www.orcina.com
R648#04#02 OrcaFlex VIV Comparison with Deepstar Seneca Trials.doc, 1-Nov-18 Page 9 of 15
DeepStar SenecaTrials: Replicated Bare Riser Tests
0
50
100
150
200
250
300
350
400
0 2 4 6 8 10 12 14 16
RMS Transverse Acceleration (m/s^2)
Arc
leng
th (f
t)
Figure 4: RMS transverse accelerations from two bare riser tests in identical conditions.Heavy lines are RMS values as reported by DeepStar for the full measured duration of each
test. Light lines are RMS values computed for 20s windows

www.orcina.com
R648#04#02 OrcaFlex VIV Comparison with Deepstar Seneca Trials.doc, 1-Nov-18 Page 10 of 15
Figure 5: RMS transverse accelerations for two tests – data as in Figure 4. The verticalbroken line is the overall mean value of the 20s windowed RMS accelerations from bothtests, irrespective of arc length. The error bars represent ±40% about the mean value
(±2*SD for the values averaged over the riser length – see text).
DeepStar SenecaTrials: Replicated Bare Riser Tests
0
50
100
150
200
250
300
350
400
0 2 4 6 8 10 12 14 16
RMS Transverse Acceleration (m/s^2)
Arc
leng
th (f
t)

www.orcina.com
R648#04#02 OrcaFlex VIV Comparison with Deepstar Seneca Trials.doc, 1-Nov-18 Page 11 of 15
Figure 6: Spectral densities of Crossflow (transverse) and In-Lineacceleration for the Seneca 100% Straked riser (Test S040715138,
2.3 ft/s flow speed)

www.orcina.com
R648#04#02 OrcaFlex VIV Comparison with Deepstar Seneca Trials.doc, 1-Nov-18 Page 12 of 15
Seneca bare- Average acc plot
0
2
4
6
8
10
0 2 4 6 8 10Deepstar average acceleration
(m/s 2)
MIla
n av
erag
e ac
cele
ratio
n (m
/s^2
)
Seneca bare- Max acc plot
0
5
10
15
0 5 10 15Deepstar max acceleration
(m/s 2)
MIla
n m
ax a
ccel
erat
ion
(m/s
^2)
Seneca bare- Dominant freq. plot
0
1
2
3
4
0 1 2 3 4Deepstar dominant frequency
(Hz)
MIla
n do
min
ant f
requ
ency
(Hz
)
Figure 7: Milan Wake Oscillator – Results for Seneca Bare Riser Tests
Seneca bare- Bias ratio plot
0.0
0.5
1.0
1.5
0.0 0.5 1.0 1.5 2.0 2.5
Current velocity (ft/s)
MIla
n / /
Deep
star
ratio
s
Ratio ofAverage acc
Ratio of Maxacc
Ratio ofdominantfreq.
Unit line

www.orcina.com
R648#04#02 OrcaFlex VIV Comparison with Deepstar Seneca Trials.doc, 1-Nov-18 Page 13 of 15
Seneca bare- Max acc plot
0
5
10
15
20
25
0 5 10 15 20 25Deepstar max acceleration
(m/s^2)
I&B
max
acc
eler
atio
n (m
/s^2
)
Seneca bare- Average acc plot
0
5
10
15
0 5 10 15Deepstar average acceleration
(m/s^2)
I&B
aver
age
acce
lera
tion
(m/s
^2)
Seneca bare- Dominant freq. plot
0
1
2
3
4
5
6
0 1 2 3 4 5 6Deepstar dominant frequency
(Hz)
I&B
dom
inan
t fre
quen
cy (
Hz)
Seneca bare- Bias ratio plot
0.0
0.5
1.0
1.5
2.0
2.5
1.0 1.5 2.0 2.5
Current velocity (ft/s)
I&B
/ /D
eeps
tar r
atio
s
Ratio ofAverage acc
Ratio of Maxacc
Ratio ofdominantfreq.
Unit line
Figure 8: Iwan + Blevins Wake Oscillator – Results for Seneca Bare Riser Tests

www.orcina.com
R648#04#02 OrcaFlex VIV Comparison with Deepstar Seneca Trials.doc, 1-Nov-18 Page 14 of 15
Seneca bare- Bias ratio plot
0
10
20
30
40
50
60
70
80
0.0 0.5 1.0 1.5 2.0 2.5
Current velocity (ft/s)
VT (1
) / /D
eeps
tar r
atio
s
Ratio ofAverage acc
Ratio of Maxacc
Ratio ofdominantfreq.Unit line
Figure 9: Vortex Tracking (1) – Results for Seneca Bare Riser Tests
Seneca bare- Average acc plot
0
50
100
150
200
250
300
0 100 200 300
Deepstar average acceleration(m/s 2)
VT (1
) ave
rage
acc
eler
atio
n (m
/s^2
)
Seneca bare- Max acc plot
0
100
200
300
400
500
600
0 100 200 300 400 500 600Deepstar max acceleration
(m/s 2)
VT (1
) max
acc
eler
atio
n (m
/s^2
)Seneca bare- Dominant freq. plot
0
10
20
30
40
50
60
0 10 20 30 40 50 60
Deepstar dominant frequency (Hz)
VT (1
) dom
inan
t fre
quen
cy (
Hz)

www.orcina.com
R648#04#02 OrcaFlex VIV Comparison with Deepstar Seneca Trials.doc, 1-Nov-18 Page 15 of 15
Figure 10: Vortex Tracking (2) – Results for Seneca Bare Riser Test
Seneca bare- Average acc plot
0
10
20
30
40
0 10 20 30 40Deepstar average acceleration
(m/s 2)
VT (2
) ave
rage
acc
eler
atio
n(m
/s^2
)Seneca bare- Max acc plot
0
10
20
30
40
50
0 10 20 30 40 50Deepstar max acceleration
(m/s 2)
VT (2
) max
acc
eler
atio
n (m
/s^2
)Seneca bare- Dominant freq. plot
0
5
10
15
20
25
0 5 10 15 20 25Deepstar dominant frequency
(Hz)
VT (2
) dom
inan
t fre
quen
cy (
Hz)
Seneca bare- Bias ratio plot
0
1
2
3
4
5
6
7
8
9
0.0 0.5 1.0 1.5 2.0 2.5
Current velocity (ft/s)
VT (2
) / /D
eeps
tar r
atio
s
Ratio ofAverage acc
Ratio of Maxacc
Ratio ofdominantfreq.
Unit line