Embed Size (px)
Citation preview

ORANGE COUNTY
CLE EMPLOYEES RETIREMENT SYSTEM
2021 Edition of OCERS
by the Numbers (As o f December 31, 2020
actuarial valua ti on)


Table of Contents
Our Members Tell Our Story .............................................................................................................................. ii Pension Quick Facts ........................................................................................................................................ iii Demographics OCERS Participating Employers ................................................................................................................... 2 Count of Members ......................................................................................................................................... 2 Active Member Demographics Count of Active Members by Status ............................................................................................................... 4 Count of Active Members by Plans and by Employers .................................................................................. 4 Count and Percentage of PEPRA to Legacy Members .................................................................................. 6 Average Entry Age of Active Members .......................................................................................................... 7 Count of Active Members Eligible to Retire by Age Groups .......................................................................... 8 Count of Active Members Eligible to Retire by Employers ............................................................................. 9 Deferred Member Demographics Count of Deferred Members by Status ........................................................................................................ 11 Count of Deferred Members by Plans and by Employers ............................................................................ 11 Count of Deferred Members Eligible to Retire by Age Groups .................................................................... 13 Count of Deferred Members Eligible to Retire by Employers ...................................................................... 14 Retiree & Beneficiary (Payees) Demographics Number of Benefit Recipients ...................................................................................................................... 16 Average Age at Service at Retirement ......................................................................................................... 16 Average Years of Retirement ....................................................................................................................... 16 Average Years Into Retirement of Currently Retired Members ................................................................... 16 Average Age at Retirement by Employer and Benefit Type ........................................................................ 17 Average Years of Service at Retirement by Employer and Benefit Type .................................................... 18 Average Age of Retirees by Employer and Benefit Type ............................................................................. 19 Benefit Recipients by Employers, Plans and Benefit Types ........................................................................ 20 Benefit Recipients by Payment Options ....................................................................................................... 22 Number of New Payees by Calendar Year .................................................................................................. 23 Payees’ Residences by Region & State ...................................................................................................... 24 Benefits Average Monthly Benefit .............................................................................................................................. 26 History of OCERS’ Cost-of-Living Adjustments ........................................................................................... 28 Average Monthly Pension Benefit Payments for Service Retirements by Years of Service ........................ 29 Median Monthly Pension Benefit Payments for Service Retirements by Years of Service .......................... 30 Monthly Pension Benefit for Retirees (Service and Disability Retirements) ................................................ 31 The OCERS Fund Funding Sources .......................................................................................................................................... 33 Asset Allocation Policy ................................................................................................................................. 34 Fund Performance ....................................................................................................................................... 35 Growth of a Dollar ........................................................................................................................................ 36 Revenue ...................................................................................................................................................... 37 Fund Status ................................................................................................................................................. 38 Growth of System Net Investments at Fair Value, UAAL, and Funded Ratio .............................................. 39 Annual Investment Returns vs. Total Valuation Value of Assets & Unfunded Actuarial Accrued Liability ... 40
i

Our Members Tell Our Story OCERS members do not receive Social Security benefits for their years of service in our community so they depend on us to help them achieve a measure of financial security in retirement. OCERS partners with 13 active participating employers to provide pension benefits for retirees and their beneficiaries. Our members include many different public servants, including deputy sheriffs, firefighters, probation officers, physicians, secretaries, and bus drivers.
$961 mil. paid in pension benefits annually (as of Dec. 31, 2020)
$3,686 average monthly allowance for retired General members (excludes DRO’s and beneficiaries)
$6,680 average monthly allowance for retired Safety members (excludes DRO’s and beneficiaries)
$4,380 average monthly allowance for General members who retired with service retirement in 2020
$7,380 average monthly allowance for Safety members who retired with service retirement in 2020
45% of all retirees who receive a monthly allowance receive less than $3,000
12% of all retirees receive a pension greater than $100,000 annually; they are typically attorneys, department heads, and other professionals
OCERSbytheNumbers
19% Safety members
81% General members
ii
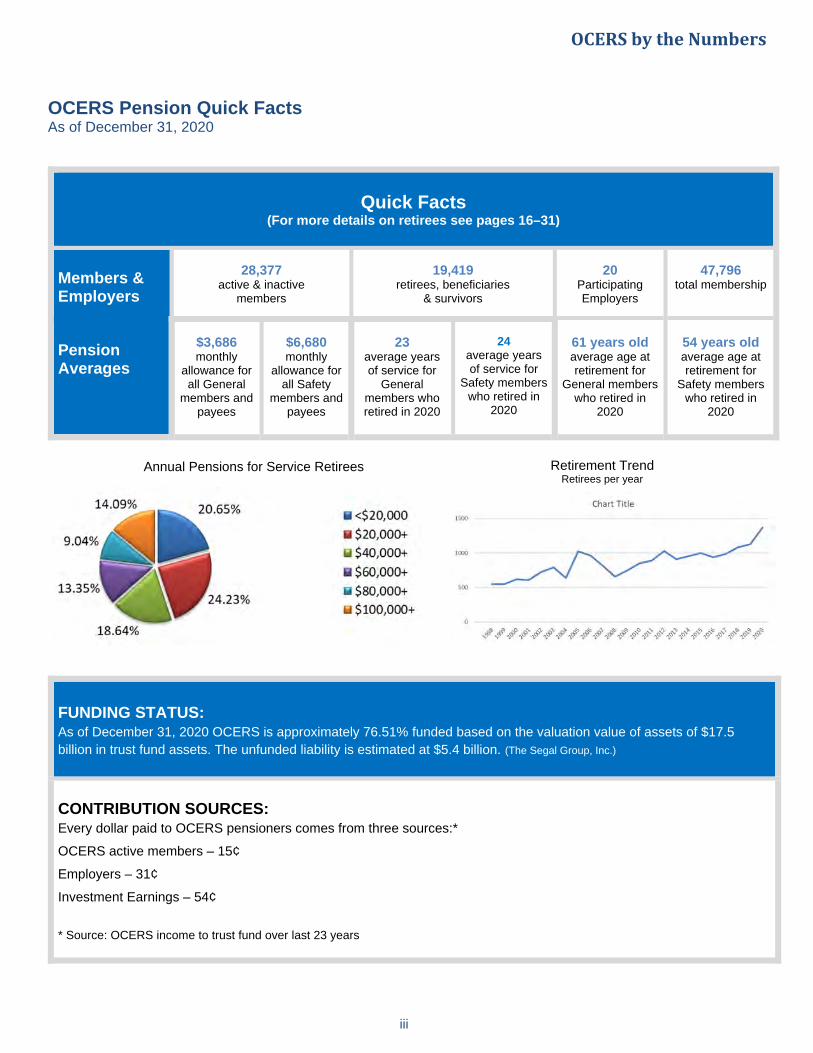
OCERS Pension Quick Facts As of December 31, 2020
Annual Pensions for Service Retirees
FUNDING STATUS: As of December 31, 2020 OCERS is approximately 76.51% funded based on the valuation value of assets of $17.5 billion in trust fund assets. The unfunded liability is estimated at $5.4 billion. (The Segal Group, Inc.)
CONTRIBUTION SOURCES: Every dollar paid to OCERS pensioners comes from three sources:*
OCERS active members – 15¢
Employers – 31¢
Investment Earnings – 54¢
* Source: OCERS income to trust fund over last 23 years
Quick Facts
(For more details on retirees see pages 16–31)
Members & Employers
28,377
active & inactive members
19,419
retirees, beneficiaries & survivors
20
Participating Employers
47,796
total membership
Pension Averages
$3,686 monthly
allowance for all General
members and payees
$6,680 monthly
allowance for all Safety
members and payees
23
average years of service for
General members who retired in 2020
24
average years of service for
Safety members who retired in
2020
61 years old average age at retirement for
General members who retired in
2020
54 years old average age at retirement for
Safety members who retired in
2020
iii
OCERSbytheNumbers
Retirement Trend Retirees per year
Chart Title
Iii <$20,000 1500
$20,000+
liiil $40,000+ 1000
Iii $60,000+
Iii $80,000+ 500
Iii $100,000+
18.64%

Demographics
OCERSbytheNumbers

Orange County Employees Retirement System As of December 31, 2020
Demographics OCERS Active Participating Employers City of San Juan Capistrano County of Orange Orange County Cemetery District Orange County Children and Families Commission Orange County Employees Retirement System Orange County Fire Authority Orange County In-Home Supportive Services Public Authority Orange County Local Agency Formation Commission Orange County Public Law Library Orange County Sanitation District Orange County Superior Court Orange County Transportation Authority Transportation Corridor Agencies
OCERS Inactive Participating Employers Capistrano Beach Sanitary District
City of Rancho Santa Margarita
Cypress Recreation and Park District
Orange County Department of Education
Orange County Mosquito and Vector Control District
University of California, Irvine Medical Center
University of California, Irvine Campus
Count of Active, Deferred and Payee by Status As of December 31, 2020
General Safety Total
Active 17,733 3,826 21,559 Deferred 6,280 538 6,818 Payee 15,745 3,674 19,419
Total 39,758 8,038 47,796 Active Members per Payee 1.13 1.04 1.11
* DRO: A court order dividing a pension benefit due to a divorce or legal separation.
OCERSbytheNumbers
2 Demographics
Service
Disability Retirements 1,525
25,000
2D,DOO
15,DOO
10,000
5,000
D
21,559
Active
■ Active
Survivors 1,982
Deferred 6,818
■ Disability Retirements
■ Service Retirements
Deferred
■ Deferred
■ DROs*
■ Survivors
Payees

Active Member Demographics
OCERSbytheNumbers

Count of Active Members by Status As of December 31, 2020
General Safety Total Count
Active 17,733 3,826 21,559
Count of Active Members by Plans and by Employers As of December 31, 2020
Retirement Plans
Employers A/BG/H
2.5%@55
I/J
2.7%@55
M/N
2%@55
P
1.62%@65
S
2%@57
E/F Probation
Safety 3%@50
E/F Safety
3%@50
Q/R Safety
3%@55
T PEPRA
Compliant
1.62%@65
U PEPRA 2.5%@67
V PEPRA
Probation
Safety 2.7%@57
V PEPRA Safety
2.7%@57
W PEPRA Alt
1.62%@65Total
City of SJC 23 16 27 1 67
Local Agency Formation Commission 2 2 4
Cemetery District 15 10 25
Children & Families 4 10 14
OCFA 105 42 620 160 178 352 1,457
IHSS Public Authority 6 18 24
Public Law Library 12 2 14
OCERS 40 27 20 87
Superior Court 892 19 488 1,399
OCTA 897 425 1,322
County of Orange 622 7,135 157 605 919 387 4,766 1,100 74 709 16,474
Sanitation District 52 292 274 618
Transportation Corridor Agencies 26 28 54
Total 1,577 304 8,201 83 176 16 605 1,539 547 5,283 2,092 74 1,061 1 21,559
OCERSbytheNumbers
4 Active Member Demographics
17,733
Ill ... 20,000 ~ .c E ~ 15,000 ~ ~ > :;; 10,000 3,826 I.I <( -0 .... 5,000 C: ::I 0 u 0
General Safety
Active Members
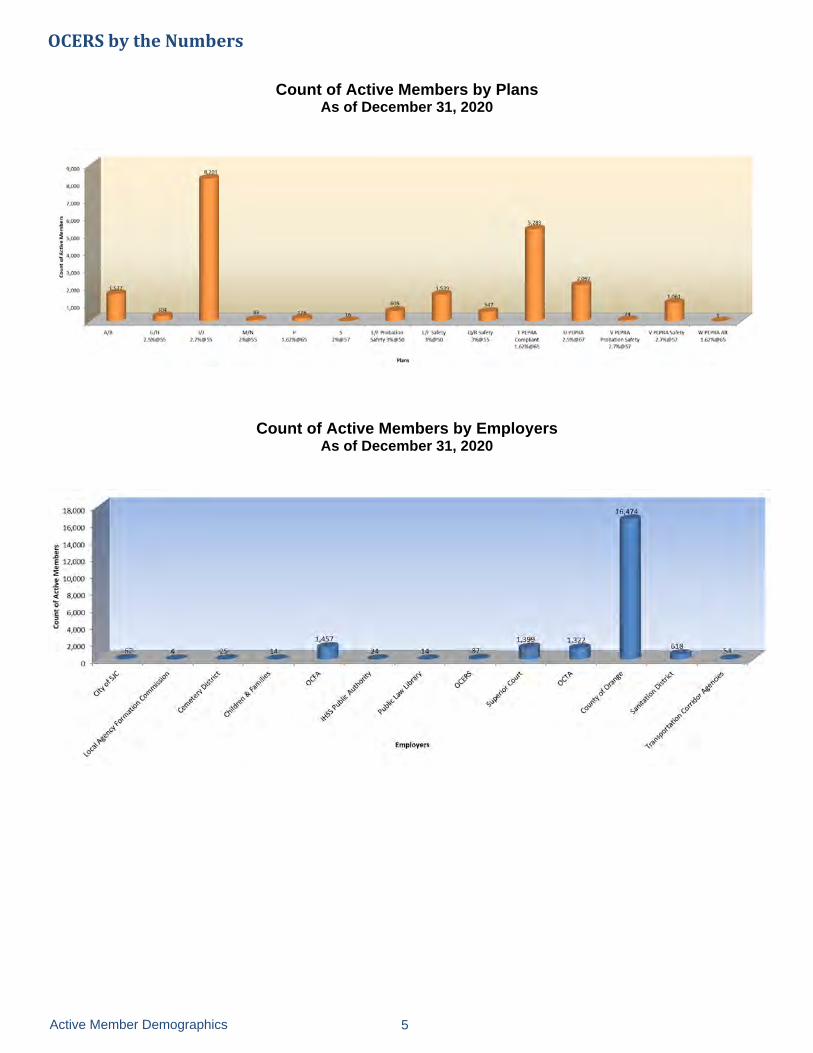
Count of Active Members by Plans
As of December 31, 2020
Count of Active Members by Employers As of December 31, 2020
OCERSbytheNumbers
5 Active Member Demographics
9,000
8,000
7,IXXJ
6,000
5,000
4,000
3,000
2,000
1,000
18,000
16,000
~ 14,000 .c E 12,000 ~ :; cu 10,000
·f .. 8,000 0 § 6,000
8 4,000
2,000
A/U G/t-t 2.5%@>55
1/J 2.7"@)'5S
M/N 2%(!!S5
p
1.62%!"6S s
2%@157
605
C/FProbation Satcty3'6@150
Plans
C/FSafety 3%@)50
Employers
547
0/RSafely 3~55
S2
l PCPRA Compliant 1.62%@>65
U P[PllA
2.5%1!'167 V l>[PRA V PEPRA Safety W PEPRA Alt
Probation Satcty 2.7"@157 1.62%lf)65 2.7"(!!157

Count and Percentage of PEPRA to Legacy Members
2016 2017 2018 2019 2020
Legacy Active and Deferred Members 21,944 21,006 19,911 18,921 18,442
PEPRA Active and Deferred Members 5,220 6,570 8,044 9,856 9,935
Total 27,164 27,576 27,955 28,777 28,377
Percentage of PEPRA to Legacy Members 19% 24% 29% 34% 35%
PEPRA Members are new Public Employees hired on or after Jan 1, 2013
Active Member Demographics 6
OCERSbytheNumbers
30,000
25,000
20,000
15,000
10,000
5,000
0
PEPRA vs Legacy Members
2016 2017 2018 2019 2020
■ Legacy Active and Deferred Members PEPRA Active and Deferred Members

Average Entry Age of Active Members with Reciprocity by Plan Formula
As of December 31, 2020
Average Entry Age of Active Members without Reciprocity by Plan Formula As of December 31, 2020
A/BGeneral
G/H2.5% @ 55
I/J2.7% @ 55
M/N2% @ 55
P1.62% @ 65
S2% @ 57
T-PEPRA Compliant 1.62% @ 65
U-PEPRA2.5% @ 67
E/F Probation Safety
3% @ 50
E/F Safety3% @ 50
Q/R Safety3% @ 55
V-PEPRA Prob Safety
2.7% @ 57
V-PEPRA Safety
2.7% @ 57
Average Entry Age
Average Entry
Age by Plan 38 34 34 41 37 43 33 34 29 32 36 31 30 34
A/BGeneral
G/H2.5% @ 55
I/J2.7% @ 55
M/N2% @ 55
P1.62% @ 65
S2% @ 57
T-PEPRA Compliant 1.62% @ 65
U-PEPRA2.5% @ 67
WPEPRA-Alt1.62% @ 65
E/FProbation
Safety3% @ 50
E/F Safety 3% @ 50
Q/R Safety3% @ 55
V-PEPRA Prob Safety2.7% @ 57
V-PEPRA Safety
2.7% @ 57
Average Entry Age
Average Entry
Age by Plan
32 31 29 34 35 31 34 36 56 26 28 27 29 30 31
7
OCERSbytheNumbers
Active Member Demographics
A/B General
G/H 2.5%@ 55
1/J 2.7%@ 55
M/N 2%@ 55
p
1.62%@ 65 5 T-PEPRA U-PEPRA
2%@ 57 Compliant 2.5% @ 67 1.62%@ 65
Plans
E/F Probation
Safety 3%@ 50
E/F Safety Q/R Safety 3%@ 50 3%@ 55
V-PEPRA Prob Safety 2.7%@ 57
V-PEPRA Safety
2.7%@ 57
I I I I I I I I I I I I I I I I I
60
., 55 .. < 50 1:-~ 45
~ 40
~ 35 > < 30
25
,, -A/B
General
--·
G/H 2.5%@ 55
34
29 ~
-1/J
2.7%@ 55 M/N
2%@55
::
1.62%@65
--·
s 2%@57
-/'\. / '\.
/ '\. 34 ~
T-PEPRA U-PEPRA W Compliant 2.5%@ 67 PEPRA-Alt
1.62% @ 65 1.62% @ 65
Plans
' ' Jfi
'-E/F
Probation Sa fety
3%@50
28
E/F Safety 3%@50
29 jU J7 ---
0/R Safety V-PEPRA Prob V-PEPRA 3%@ 55 Safety Safety
2.7%@ 57 2.7%@ 57

0
500
1,000
1,500
2,000
2,500
3,000
3,500
<20 20+ 25+ 30+ 35+ 40+ 45+ 50+ 55+ 60+ 65+ 70+
Count of Active M
embers
Age Groups
Yes
No
Count of Active Members Eligible to Retire by Age Groups As of December 31, 2020
Age Groups
Eligible to Retire
<20 20+ 25+ 30+ 35+ 40+ 45+ 50+ 55+ 60+ 65+ 70+ Total
No 1 278 1,683 2,759 3,086 3,033 2,960 652 518 325 101 15,396
Yes 97 437 2,467 1,644 965 354 199 6,163
21,559
OCERSbytheNumbers
8 Active Member Demographics
Eligible to Retire
■
■

Active Members – Eligible to Retire by Employers
As of December 31, 2020
(Percentages rounded)
Eligible to retire for plans A – S (Legacy plans for public employees hired before Jan 1, 2013 including reciprocity) if:
Tier 1 12 month measuring period
Tier 2 (hired on or after Sep 21, 1979) 36 month measuring period
- 70 years old General A G I
B H J
Other General Members 2.5% @ 55 2.7% @ 55
- 50 years old and has 10 or more years of eligible service M O
N P
2% @ 55 1.62% @ 65
- Safety member has 20 years or more of eligible service at any age S 2% @ 57
- General member has 30 years or more of eligible service at any age Eligible to retire for PEPRA compliant/alternative plans T and W if: - 50 years old and has 10 or more years of eligible service - 70 years old Eligible to retire for PEPRA plan U if: - 52 years old and has 5 or more years of eligible service - 70 years old Eligible to retire for PEPRA Safety plan V if: - 50 years old and has 5 or more years of eligible service - 70 years old Eligible Service = current service + incoming reciprocal service
Safety C D 2% @ 50 E F 3% @ 50 Q R 3% @ 55 New Public Employees hired on or after Jan 1, 2013 General T & W 1.62% @ 65 U 2.5% @ 67 Safety V 2.7% @ 57
9
OCERSbytheNumbers
Active Member Demographics
Plans A & B
General
G & H
2.5%@55
I & J
2.7%@55
M & N
2%@55
P
1.62%@65
S
2%@57
T PEPRA
Compliant
1.62%@65
U PEPRA
2.5%@67
W PEPRA
Alt
1.62%@65
E & F Prob
Safety
3%@50
E & F
Safety
3%@50
Q & R
Safety
3%@55
V PEPRA
Prob
Safety
2.7%@57
V PEPRA
Safety
2.7%@57
Total
Eligible to
Retire
% Eligible by
Employer
City of SJC 11 7 18 27%
LAFCO 1 1 25%
Cemetery District 9 9 36%
Children & Families
Comm0 0%
OCFA 65 6 261 28 360 25%
IHSS Public
Authority5 1 6 25%
Public Law Library 9 9 64%
OCERS 17 17 20%
Superior Court 444 3 5 452 32%
OCTA 521 1 522 39%
County of Orange 280 3,398 20 16 3 293 527 18 3 4,558 28%
Sanitation District 10 184 194 31%
Transportation
Corridor Agencies17 17 31%
Total Eligible to
Retire816 193 3,936 32 23 7 21 5 0 293 788 46 0 3 6,163 29%
% Eligible By Plan 52% 63% 48% 39% 13% 44% 0% 0% 0% 48% 51% 8% 0% 0%

Deferred Member Demographics
OCERSbytheNumbers

Employers A/B
General
G/H
2.5% @ 55
I/J
2.7% @ 55
M/N
2% @ 55
P
1.62% @ 65
S
2% @ 57
T PEPRA
Compliant
1.62% @ 65
U PEPRA
2.5% @ 67
C/D
Safety
2% @ 50
E/F
Probation
Safety
3% @ 50
E/F
Safety
3% @ 50
Q/R
Safety
3% @ 55
V PEPRA
Probation Safety
2.7% @ 57
V PEPRA
Safety
2.7% @ 57
Total
City of SJC
4 39 5 19 67
Cypress Rec &
Park District
5 5
Local Agency
Formation Comm
3 2 2 7
Cemetery District
2 1 3
Children &
Families Comm
2 1 3
OCFA
8 89 18 119 4 45 7 55 345
IHSS Public
Authority
4 17 21
Public Law
Library
1 2 3
OCERS
19 8 4 31
Superior Court
16 274 15 172 477
OCTA
518 132 650
Vector Control
District
31 31
County of Orange
874 1,973 73 1,272 347 73 171 94 35 13 41 4,966
Sanitation
District
45 52 39 136
Transportation
Corridor
Agencies
12 41 19 72
UCI Medical
Center
1 1
Total 1,519 54 2,399 61 90 5 1,454 698 77 171 139 42 13 96 6,818
Count of Deferred Members by Status As of December 31, 2020
Count of Deferred Members by Plans and by Employers
As of December 31, 2020
Retirement Plans
General Safety Total Count
Deferred 6,280 538 6,818
OCERSbytheNumbers
11 Deferred Member Demographics
~ 7,000 .. 6,000 -"
E .. 5,000 :!? "'Cl
4,000 ~ ~ 3,000 .. 0
'o 2,000 t:
1,000 :, 0 u
0 General Safety
Deferred Members

Count of Deferred Members by Plans As of December 31, 2020
Count of Deferred Members by Employers As of December 31, 2020
OCERSbytheNumbers
Deferred Member Demographics 12
2,500 e f 2,000
~ 1 1,500
• ~ 1,000
0 1 500
A/B General -G/H
2.5%@55
• 1/J M/N
2.7%@55 2%@55
• 5 -p s TPEPRA U PEPRA 1.62%@65 2%@57 Comp~ant 2.5%@67
1.62%@65
Plans
Employers
- - • JI. .- .. C/0 E/F E/F 0/R V P'EPRA V PEPRA
Safety Probation Safety Safety Probiltion Safety safety 2%@50 Safety 3%@ 50 3%@55 2.7%@57 2.7%@57
3%@50
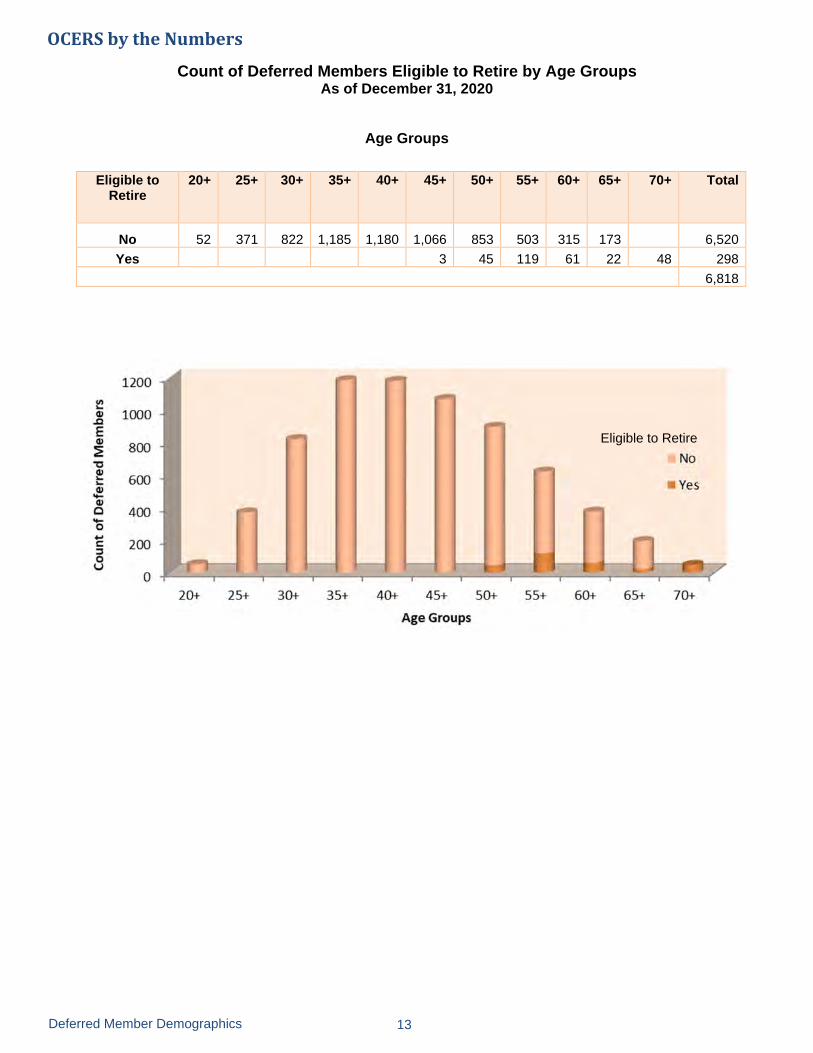
Count of Deferred Members Eligible to Retire by Age Groups As of December 31, 2020
Age Groups
Eligible to
Retire 20+ 25+ 30+ 35+ 40+ 45+ 50+ 55+ 60+ 65+ 70+ Total
No 52 371 822 1,185 1,180 1,066 853 503 315 173 6,520
Yes 3 45 119 61 22 48 298 6,818
Deferred Member Demographics 13
OCERSbytheNumbers
Eligible to Retire
1200 Iii ... QI 1000 .c E QI
800 ~ "C QI
600 ... ... QI .... QI C 400 .... 0 +-'
200 C ::::s 0 u
0 20+ 25+ 30+ 35+ 40+ 45+
Age Groups
50+ 55+
No
■ Yes
60+ 65+ 70+
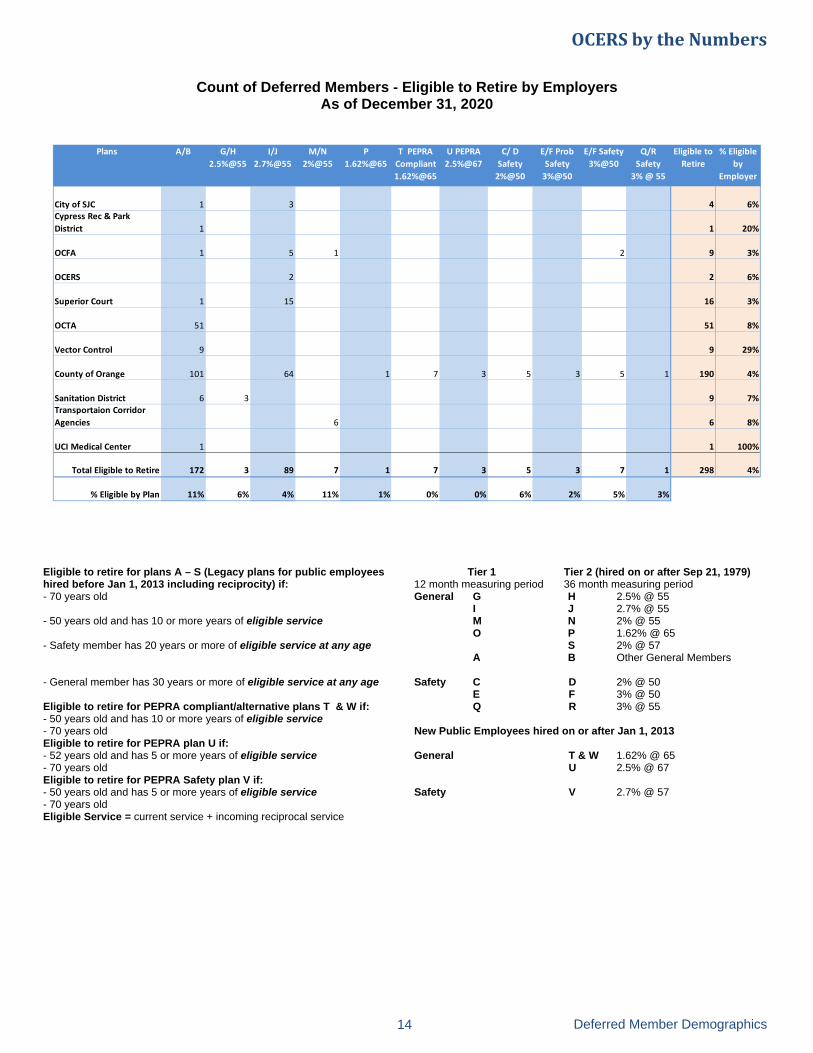
Count of Deferred Members - Eligible to Retire by Employers
As of December 31, 2020
Eligible to retire for plans A – S (Legacy plans for public employees hired before Jan 1, 2013 including reciprocity) if:
Tier 1
12 month measuring period
Tier 2 (hired on or after Sep 21, 1979) 36 month measuring period
- 70 years old General G I
H J
2.5% @ 55 2.7% @ 55
- 50 years old and has 10 or more years of eligible service M O
N P
2% @ 55 1.62% @ 65
- Safety member has 20 years or more of eligible service at any age A
S B
2% @ 57 Other General Members
- General member has 30 years or more of eligible service at any age Eligible to retire for PEPRA compliant/alternative plans T & W if: - 50 years old and has 10 or more years of eligible service - 70 years old Eligible to retire for PEPRA plan U if: - 52 years old and has 5 or more years of eligible service - 70 years old Eligible to retire for PEPRA Safety plan V if: - 50 years old and has 5 or more years of eligible service - 70 years old Eligible Service = current service + incoming reciprocal service
Safety C D 2% @ 50 E F 3% @ 50 Q R 3% @ 55 New Public Employees hired on or after Jan 1, 2013 General T & W 1.62% @ 65 U 2.5% @ 67 Safety V 2.7% @ 57
Plans A/B G/H
2.5%@55
I/J
2.7%@55
M/N
2%@55
P
1.62%@65
T PEPRA
Compliant
1.62%@65
U PEPRA
2.5%@67
C/ D
Safety
2%@50
E/F Prob
Safety
3%@50
E/F Safety
3%@50
Q/R
Safety
3% @ 55
Eligible to
Retire
% Eligible
by
Employer
City of SJC 1 3 4 6%Cypress Rec & Park
District 1 1 20%
OCFA 1 5 1 2 9 3%
OCERS 2 2 6%
Superior Court 1 15 16 3%
OCTA 51 51 8%
Vector Control 9 9 29%
County of Orange 101 64 1 7 3 5 3 5 1 190 4%
Sanitation District 6 3 9 7%Transportaion Corridor
Agencies 6 6 8%
UCI Medical Center 1 1 100%
Total Eligible to Retire 172 3 89 7 1 7 3 5 3 7 1 298 4%
% Eligible by Plan 11% 6% 4% 11% 1% 0% 0% 6% 2% 5% 3%
OCERSbytheNumbers
14 Deferred Member Demographics
Retiree & Beneficiary Demographics
(Payees)
OCERSbytheNumbers

Total
General Safety 2% Safety 3% General Safety 2% Safety 3%
Capistrano Beach Sanitary District 3 3
11.51 11.51
City of San Juan Capistrano 122 6 128
10.80 19.83 11.23
Cypress Recreation & Park District 16 16
13.52 13.52
Department of Education 15 15
20.34 20.34
Local Agency Formation Comm. 5 5
8.05 8.05
Cemetery District 7 7
9.20 9.20
Children & Families Comm. 11 11
7.39 7.39
OCFA 187 49 432 11 31 183 892
9.01 19.02 9.19 15.00 20.92 8.76 10.11
IHSS Public Authority 3 3
3.92 3.92
Public Law Library 12 12
9.62 9.62
OCERS 43 3 46
9.78 21.20 10.53
Superior Court 973 16 989
9.18 11.44 9.22
OCTA 1,028 267 1,295
10.28 18.18 11.91
Vector Control District 38 38
10.87 10.87
County of Orange 9,717 449 1,549 564 203 211 12,693
11.96 19.23 8.26 19.16 28.69 9.34 12.31
City of Rancho Santa Margarita 1 1
4.74 4.74
Sanitation District 435 19 454
9.94 16.68 10.22
Transportation Corridor Agencies 54 54
8.61 8.61
UCI Campus 14 1 15
17.98 16.48 17.88
UCI Medical Center 167 11 178
23.68 16.47 23.85
12,851 498 1,981 898 233 394 16,855
Average 11.63 19.21 8.46 18.73 27.83 9.07 12.02
Service Disability
All benefit recipients as of December 31, 2020
For Retired General members with service and disability retirements: 13,757 For General member survivors and other payees: 2,088 For Safety members with service and disability retirements: 3,107 For Safety member survivors and other payees: 567
Total Benefit Recipients: 19,419 Average age at retirement for members who retired with a service retirement in 2020
For General members: 61.02 years old For Safety members: 54.15 years old
Average years of service for members who retired with a service retirement in 2020
For General members: 23.18 For Safety members: 23.87
Average years of service for all General and Safety members who retired with service and disability retirements as of December 31, 2020: 23.28
Average Years Into Retirement of Currently Retired Members As of December 31, 2020
Retiree & Beneficiary Demographics
16
OCERSbytheNumbers
Retiree & Beneficiary Demographics
17 Retiree & Beneficiary Demographics
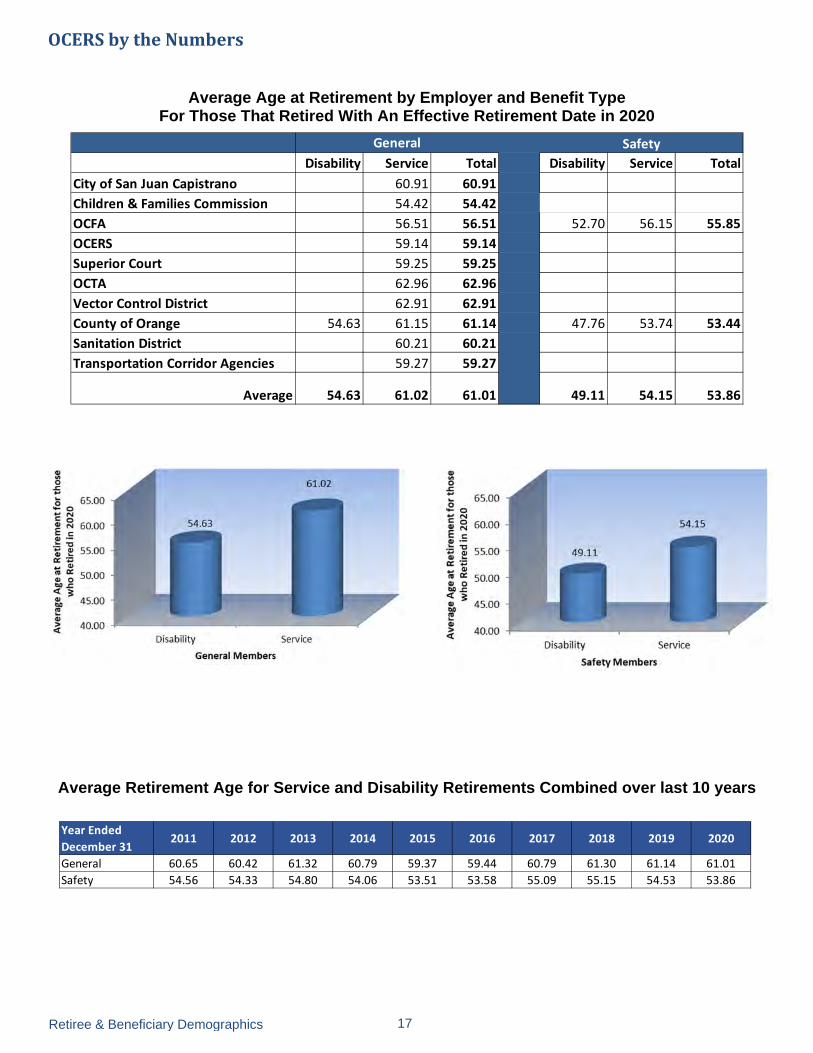
Year Ended
December 312011 2012 2013 2014 2015 2016 2017 2018 2019 2020
General 60.65 60.42 61.32 60.79 59.37 59.44 60.79 61.30 61.14 61.01
Safety 54.56 54.33 54.80 54.06 53.51 53.58 55.09 55.15 54.53 53.86
Average Age at Retirement by Employer and Benefit Type For Those That Retired With An Effective Retirement Date in 2020
Average Retirement Age for Service and Disability Retirements Combined over last 10 years
Disability Service Total Disability Service Total
City of San Juan Capistrano 60.91 60.91
Children & Families Commission 54.42 54.42
OCFA 56.51 56.51 52.70 56.15 55.85
OCERS 59.14 59.14
Superior Court 59.25 59.25
OCTA 62.96 62.96
Vector Control District 62.91 62.91
County of Orange 54.63 61.15 61.14 47.76 53.74 53.44
Sanitation District 60.21 60.21
Transportation Corridor Agencies 59.27 59.27
Average 54.63 61.02 61.01 49.11 54.15 53.86
General Safety
OCERSbytheNumbers
~ J:. ... ]o .,. N C 0 QJ N E C .. ·-·= "'C ..... .. ~ a: ·;;
~~ .. 0 t>O J:. <t 3 .. & .. > <t
65.00
60.00
55.00
50.00
45.00
40.00
61.02
54.63
Disability Service
General Members
.. "' 0
J:. ... 5
... 0 'i: N .. ~ ~ ·= ·= "'C ..... .. ~ 0: ·;;
~~ .. 0 t>O.i::. <t 3 .. & .. > <t
65.00
60.00 54.15
Disability Service
Safety Members

Average Years of Service at Retirement by Employer and Benefit Type
For Those That Retired With an Effective Retirement Date in 2020
Disability Service Total Disability Service Total
City of San Juan Capistrano 15.50 15.50
Children & Families Commission 28.77 28.77
OCFA 19.90 19.90 30.04 25.74 26.12
OCERS 11.88 11.88
Superior Court 23.33 23.33
OCTA 23.79 23.79
Vector Control District 21.16 21.16
County of Orange 15.14 23.33 23.31 21.58 23.49 23.40
Sanitation District 24.03 24.03
Transportation Corridor Agencies 14.03 14.03
Average 15.14 23.18 23.17 23.88 23.87 23.87
General Safety
OCERSbytheNumbers
Retiree & Beneficiary Demographics 18
Disability
General Members
Service
25.00
20.00
15.00
10.00
5.00
0.00 Disability Service
Safety Members

Average Age of Retirees by Employer and Benefit Type As of December 31, 2020
Disability Service Total Disability Service Total
Capistrano Beach Sanitary District 74.44 74.44
City of San Juan Capistrano 64.44 68.72 68.52
Cypress Recreation & Park District 70.36 70.36
Department of Education 81.81 81.81
Local Agency Formation Comm. 64.91 64.91
Cemetery District 73.26 73.26
Children & Families Comm. 66.23 66.23
OCFA 65.45 66.56 66.50 65.45 65.81 65.70
IHSS Public Authority 67.68 67.68
Public Law Library 72.06 72.06
OCERS 72.69 69.69 69.89
Superior Court 65.22 68.33 68.28
OCTA 67.30 70.95 70.20
Vector Control District 72.00 72.00
County of Orange 67.50 71.39 71.18 63.44 64.50 64.32
City of Rancho Santa Margarita 75.95 75.95
Sanitation District 66.89 68.93 68.56
Transportation Corridor Agencies 69.93 69.93
UCI Medical Campus 69.62 75.48 75.09
UCI Medical Center 80.81 81.22 81.19
Average 67.53 71.06 70.83 64.12 64.76 64.63
General Safety
19 Retiree & Beneficiary Demographics
OCERSbytheNumbers
64.76
"' 71.06 "' ., ., ~ 72.00 ~ 64.80 . ., .,
71.00 .,
a: a: 64.60 0 ....
70.00 0 ., ., .. ..
<( 69.00 67 .53 <( 64.40 ... ... 64.12
C: C: ., ~ t:: 68.00 s 64.20 ::,
u u ., 67.00 ., .. ~ 64.00 "' ~ 66.00 ~ > > <t 65.00 <t 63.80
Disability Service Disability Service
General Members Safety Members
A & B
General
G & H
2.5% @ 55
I & J
2.7% @ 55
M & N
2% @ 55
P
1.62% @ 65
S
2% @ 57
T PEPRA ‐
Compliant
1.62% @ 65
U PEPRA
2.5% @ 67
C & D
Safety
2% @ 50
E & F
Probation
Safety
3% @ 50
E & F
Safety
3% @ 50
Q & R
Safety
3% @ 50
V PEPRA
Safety
2.7% @ 57
Total
Payees
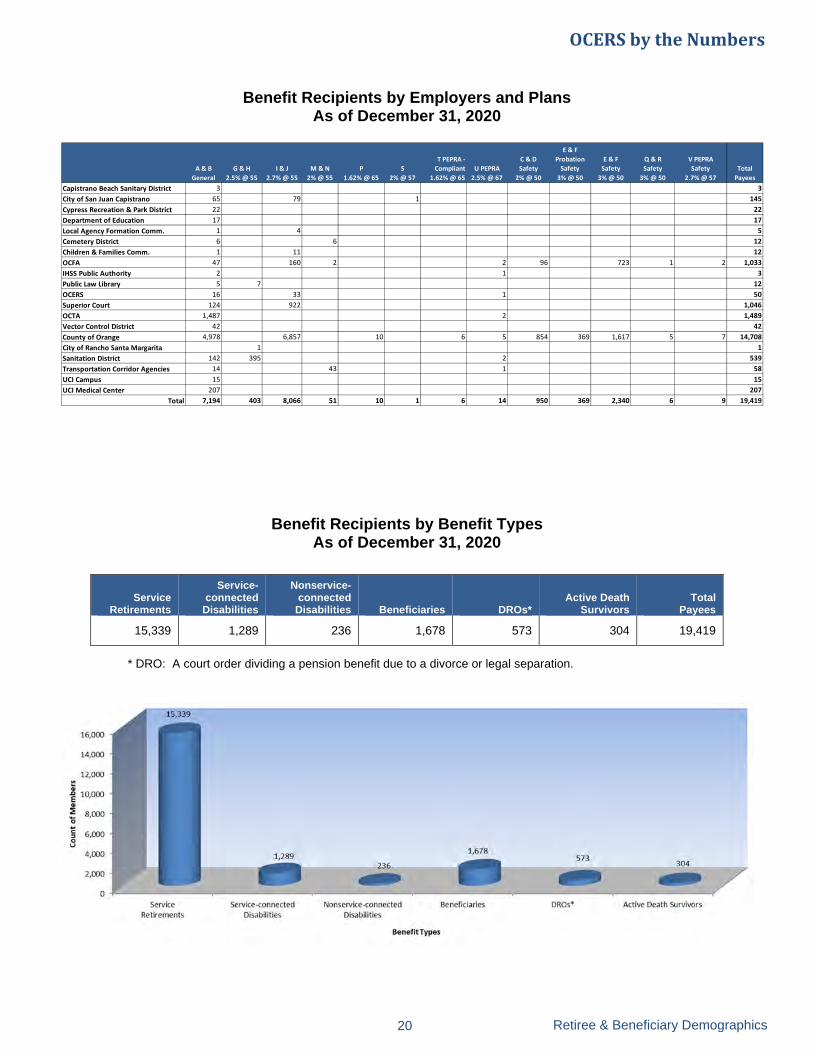
Capistrano Beach Sanitary District 3 3
City of San Juan Capistrano 65 79 1 145
Cypress Recreation & Park District 22 22
Department of Education 17 17
Local Agency Formation Comm. 1 4 5
Cemetery District 6 6 12
Children & Families Comm. 1 11 12
OCFA 47 160 2 2 96 723 1 2 1,033
IHSS Public Authority 2 1 3
Public Law Library 5 7 12
OCERS 16 33 1 50
Superior Court 124 922 1,046
OCTA 1,487 2 1,489
Vector Control District 42 42
County of Orange 4,978 6,857 10 6 5 854 369 1,617 5 7 14,708
City of Rancho Santa Margarita 1 1
Sanitation District 142 395 2 539
Transportation Corridor Agencies 14 43 1 58
UCI Campus 15 15
UCI Medical Center 207 207
Total 7,194 403 8,066 51 10 1 6 14 950 369 2,340 6 9 19,419
Benefit Recipients by Employers and Plans As of December 31, 2020
Benefit Recipients by Benefit Types As of December 31, 2020
* DRO: A court order dividing a pension benefit due to a divorce or legal separation.
Service Retirements
Service-connected
Disabilities
Nonservice-connected
Disabilities Beneficiaries DROs* Active Death
Survivors Total
Payees
15,339 1,289 236 1,678 573 304 19,419
OCERSbytheNumbers
Retiree & Beneficiary Demographics 20
15,339
16,000
14,000
12,000 I'.! ., .c 10,000 E ., :::; 8,000 '5 !: 6,000 :, 0 u
4,000
2,000
0 Service
Retirements Service-connected
Disabil ities Nonservice-connected
Disabil ities
BenefitTypes
Beneficiaries DROs* Active Death Survivors

Benefit Recipients by Employers As of December 31, 2020
Benefit Recipients by Plans As of December 31, 2020
OCERSbytheNumbers
21 Retiree & Beneficiary Demographics
16,00)
14,00)
12,00) . . 10,00)
~
0 8,000
C
8 6,000
4,000
2,000 145
,:- .o _,.c-($'~ ~l~ ,.o
.,:,~ (., .. .. .. , ~o~ ,,,. ~J:,"'r.Ji
<.,o"' ,.,. ~ •'
._,<> <!:)'~ .~
~
12 -,/''
<.,o<" §:.~.,,
;s-'·?ef- ,·"' , .. ;:;,o<:-"i? •' ,,,, <.,•"' ~,.,'b~ ,,,. ,o " .,.. .. .~ .cs b"q,~ 0 o••
~~<t><:-0 o"' ,,.. ~ ~ , ... •'' c•
(., .. "'<t .._,o
9,000
8,000
7,000 ~ .. 6,000 .. > ..
5,000 "-0
4,000 'i: :,
3,000 0 u 2,000
1,000
0 A&B G&H l& J M&N p
General 2.5%@ 55 2.7%@ 55 2%@ 55 1.62%@ 65
14,708
1,033 539 - -
d' i,.~ <'~ 0 ,.o '¢-Q
~ ~,1,}' ;,,c.f
•" ,:§> -$',_,,.,
Employers
c-"' .,:- ~ J~'b ,:- <i' •' <V ,,.,, <'" ($'~ ,/'. •' 0 ~~q;
.. <.,• ,o ,o .... <.,• if¼ -,,o <!-0 ,. ;:-0<:- ~._~o' _,,o
<.,o• .. .,. . ... Y)◊"1-o' <.,O ,.o ,., .. <.,O ,y •" ,i--+'<:-.. ,,..
~ ,,
.0 o"' •' ,._('
- - -5 T PEPRA - U PEPRA C&D E&F E&F Q&R V PEPRA
2%@ 57 Compliant 2.5% @ 67 Safety Probation Safety Safety Safety 1.62%@ 2%@ 50 Safety 3%@50 3%@50 2.7% @57
65 3%@50
Plans
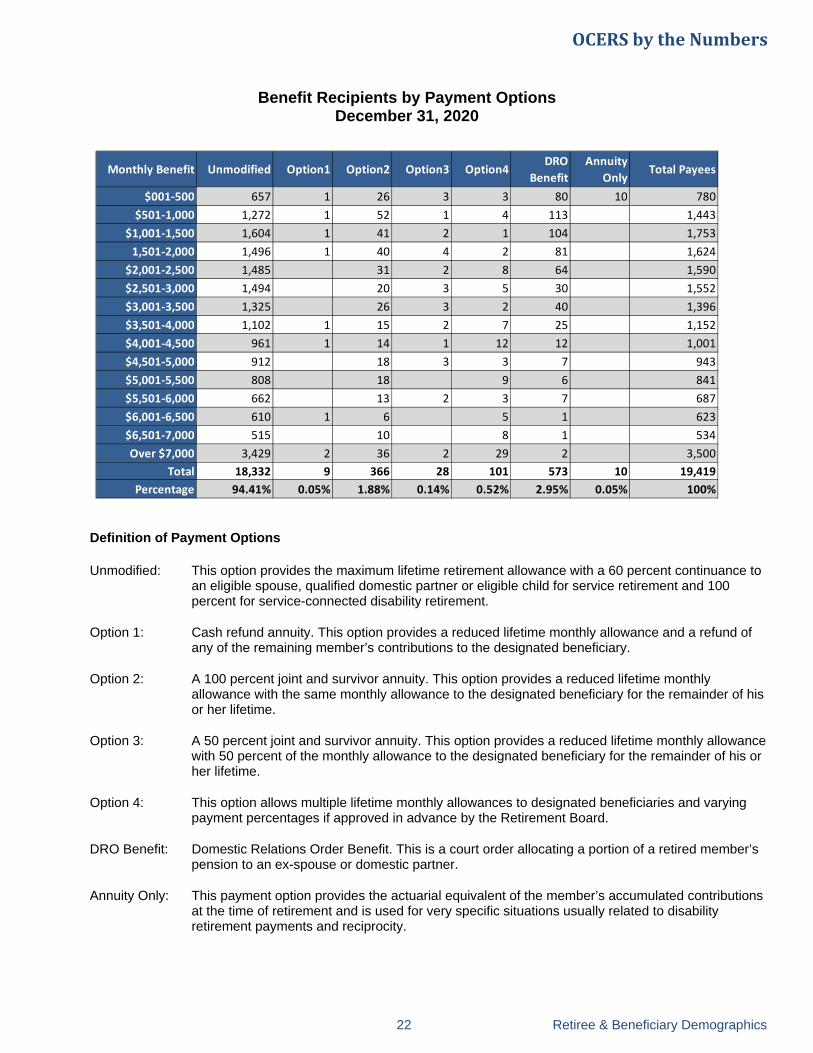
Benefit Recipients by Payment Options December 31, 2020
Definition of Payment Options
Unmodified: This option provides the maximum lifetime retirement allowance with a 60 percent continuance to an eligible spouse, qualified domestic partner or eligible child for service retirement and 100 percent for service-connected disability retirement.
Option 1: Cash refund annuity. This option provides a reduced lifetime monthly allowance and a refund of any of the remaining member’s contributions to the designated beneficiary.
Option 2: A 100 percent joint and survivor annuity. This option provides a reduced lifetime monthly allowance with the same monthly allowance to the designated beneficiary for the remainder of his or her lifetime.
Option 3: A 50 percent joint and survivor annuity. This option provides a reduced lifetime monthly allowance with 50 percent of the monthly allowance to the designated beneficiary for the remainder of his or her lifetime.
Option 4: This option allows multiple lifetime monthly allowances to designated beneficiaries and varying payment percentages if approved in advance by the Retirement Board.
DRO Benefit: Domestic Relations Order Benefit. This is a court order allocating a portion of a retired member’s pension to an ex-spouse or domestic partner.
Annuity Only: This payment option provides the actuarial equivalent of the member’s accumulated contributions at the time of retirement and is used for very specific situations usually related to disability retirement payments and reciprocity.
Monthly Benefit Unmodified Option1 Option2 Option3 Option4DRO
Benefit
Annuity
OnlyTotal Payees
$001‐500 657 1 26 3 3 80 10 780
$501‐1,000 1,272 1 52 1 4 113 1,443
$1,001‐1,500 1,604 1 41 2 1 104 1,753
1,501‐2,000 1,496 1 40 4 2 81 1,624
$2,001‐2,500 1,485 31 2 8 64 1,590
$2,501‐3,000 1,494 20 3 5 30 1,552
$3,001‐3,500 1,325 26 3 2 40 1,396
$3,501‐4,000 1,102 1 15 2 7 25 1,152
$4,001‐4,500 961 1 14 1 12 12 1,001
$4,501‐5,000 912 18 3 3 7 943
$5,001‐5,500 808 18 9 6 841
$5,501‐6,000 662 13 2 3 7 687
$6,001‐6,500 610 1 6 5 1 623
$6,501‐7,000 515 10 8 1 534
Over $7,000 3,429 2 36 2 29 2 3,500
Total 18,332 9 366 28 101 573 10 19,419
Percentage 94.41% 0.05% 1.88% 0.14% 0.52% 2.95% 0.05% 100%
OCERSbytheNumbers
22 Retiree & Beneficiary Demographics
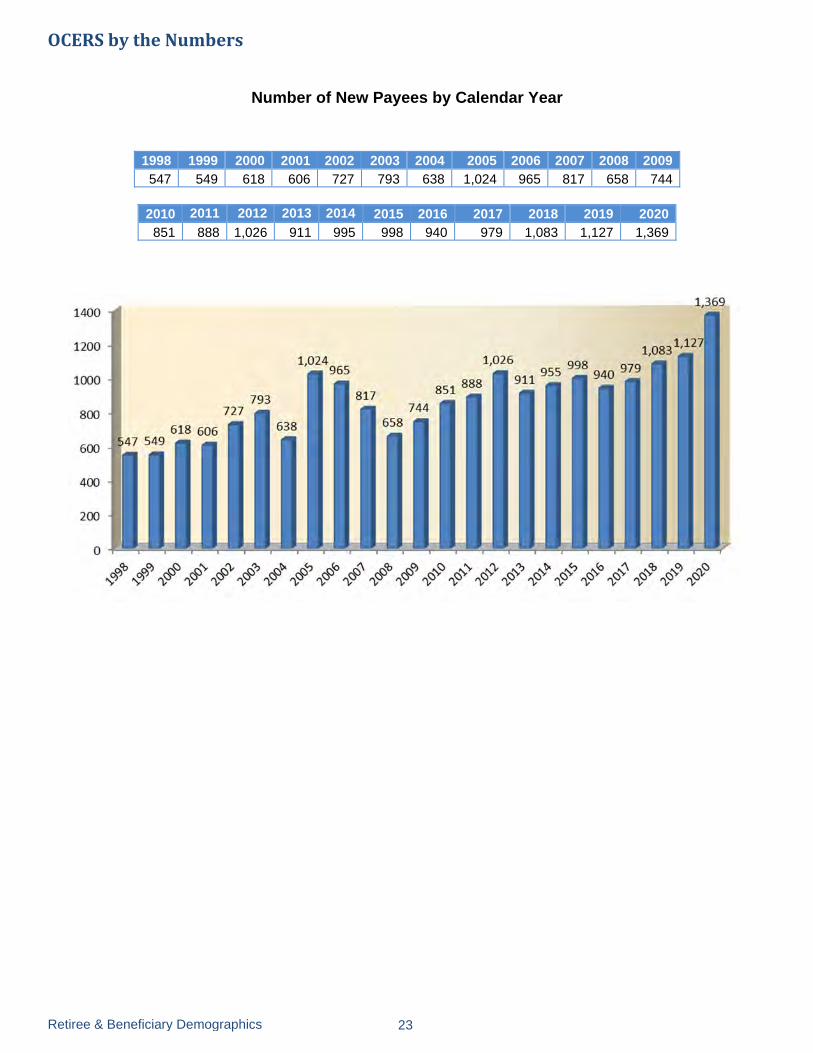
Number of New Payees by Calendar Year
1998 1999 2000 2001 2002 2003 2004 2005 2006 2007 2008 2009 547 549 618 606 727 793 638 1,024 965 817 658 744
2010 2011 2012 2013 2014 2015 2016 2017 2018 2019 2020
851 888 1,026 911 995 998 940 979 1,083 1,127 1,369
OCERSbytheNumbers
23 Retiree & Beneficiary Demographics
1,369 1400
1200
1000
800
600
400
200
0

Total Annual Benefits Paid in Orange County $545,127,395 10,185
Total Annual Benefits Paid in California $762,614,169 15,110
Payees’ Residences by Region & State
As of December 31, 2020
REGIONS
Foreign Countries & US Territories
Northeast
Northwest
Southeast
Southwest
1,050
Total Count of Payees 19,140*
North Central
35
263
253
882
16,657
OCERSbytheNumbers
24 Retiree & Beneficiary Demographics
* Payees with multiple benefits are counted only once.
Northwest
Southwest
North Central
Southeast
Northeast
REGIONS
._____ ____ _____. D -----~□ -----~□
D -----~□
-----------' D

Benefits
OCERSbytheNumbers
26 Benefits
Benefits as of December 31, 2020
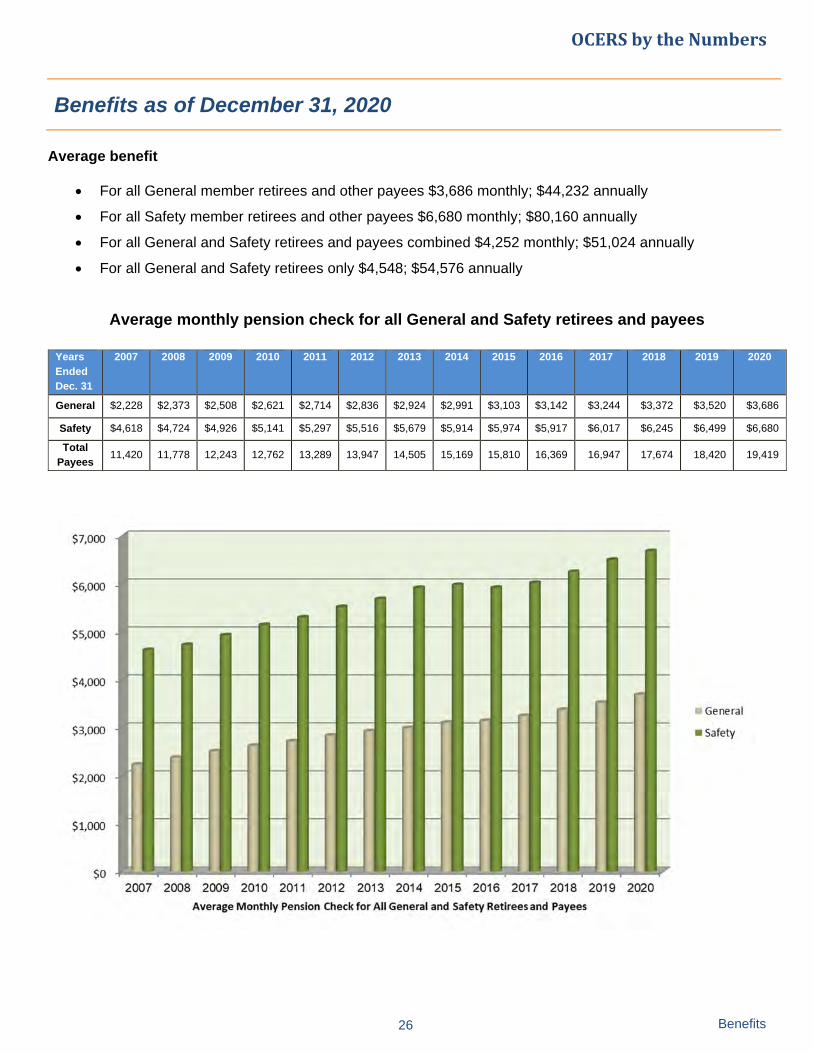
Average benefit
For all General member retirees and other payees $3,686 monthly; $44,232 annually
For all Safety member retirees and other payees $6,680 monthly; $80,160 annually
For all General and Safety retirees and payees combined $4,252 monthly; $51,024 annually
For all General and Safety retirees only $4,548; $54,576 annually
Average monthly pension check for all General and Safety retirees and payees
Years Ended Dec. 31
2007 2008 2009 2010 2011 2012 2013 2014 2015 2016 2017 2018 2019 2020
General $2,228 $2,373 $2,508 $2,621 $2,714 $2,836 $2,924 $2,991 $3,103 $3,142 $3,244 $3,372 $3,520 $3,686
Safety $4,618 $4,724 $4,926 $5,141 $5,297 $5,516 $5,679 $5,914 $5,974 $5,917 $6,017 $6,245 $6,499 $6,680
Total Payees
11,420 11,778 12,243 12,762 13,289 13,947 14,505 15,169 15,810 16,369 16,947 17,674 18,420 19,419
OCERSbytheNumbers
$7,000
$6,000
$5,000
$4,000
$3,000
$2,000
$1,000
$0
;
-V
------V - ------ 0- - -
v - >----- 1----- - >----- - >----- 1----- - - -... ... --- - - - - _ ,.. - - - - -V - -----;; ... - ... ... ... ... V - - - - - - - - - - - - -V - - - - - - - - - - - - -
I/ - - - - - ,_ - - - - - - -2007 2008 2009 2010 201 1 2012 2013 2014 2015 2016 2017 2018 2019 2020
Average Monthly Pension Check for All General and Safety Retirees and Payees
-
-
-
■ General -
■ Safety
-
-
"7
27
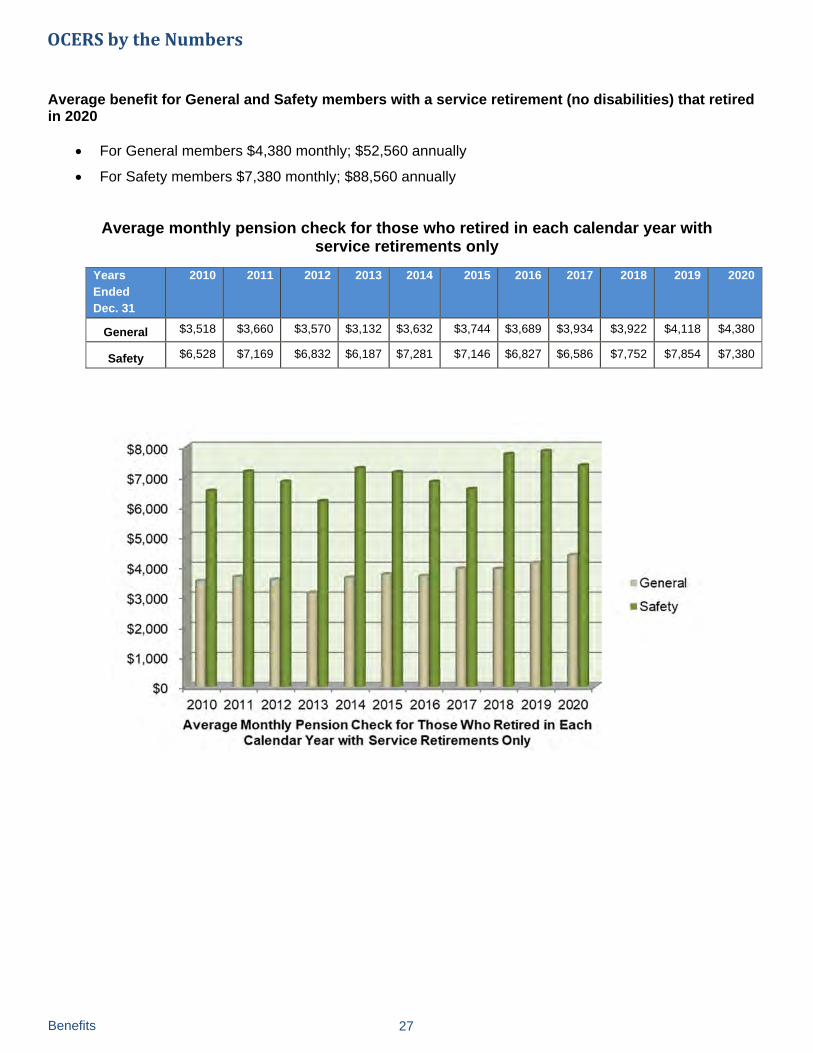
Average benefit for General and Safety members with a service retirement (no disabilities) that retired in 2020
For General members $4,380 monthly; $52,560 annually
For Safety members $7,380 monthly; $88,560 annually Average monthly pension check for those who retired in each calendar year with
service retirements only
Years Ended Dec. 31
2010 2011 2012 2013 2014 2015 2016 2017 2018 2019 2020
General $3,518 $3,660 $3,570 $3,132 $3,632 $3,744 $3,689 $3,934 $3,922 $4,118 $4,380
Safety $6,528 $7,169 $6,832 $6,187 $7,281 $7,146 $6,827 $6,586 $7,752 $7,854 $7,380
Benefits
OCERSbytheNumbers
$8,000
$7,000
$6,000
$5,000
$4,000
$3,000
$2,000
$1 ,000
$0
,II
- - -V
- - - - -V
- - - - -V .. - - - - - -V ,.. .. - ,. - -- -
I/ ,__ ,__ -- - - - - - ,__ - -
V ,__ ,__ - - - I- I- I- ,__ - -
I/ - ,__ - - - - - - ,__ - -
- - - - - - - - - - .,, 2010 2011 2012 2013 2014 2015 2016 2017 2018 2019 2020
Average Monthly Pension Check for Those Who Retired in Each Calendar Year with Service Retirements Only
■ General
■ Safety
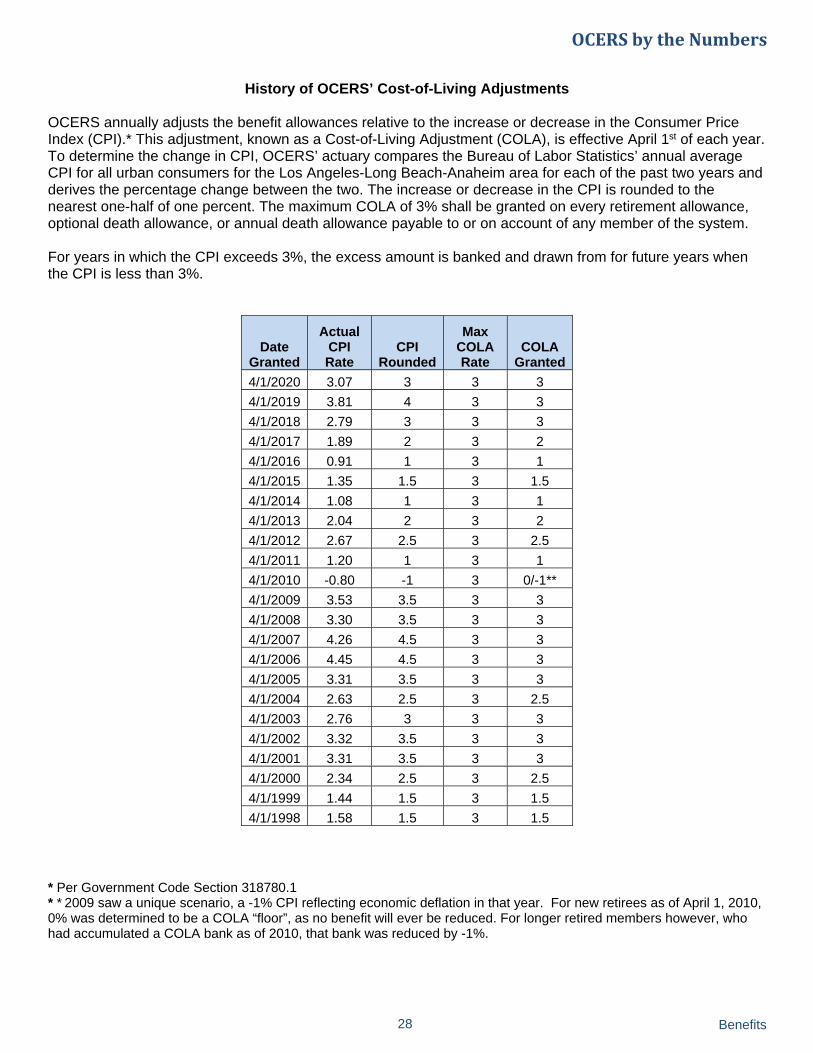
History of OCERS’ Cost-of-Living Adjustments
OCERS annually adjusts the benefit allowances relative to the increase or decrease in the Consumer Price Index (CPI).* This adjustment, known as a Cost-of-Living Adjustment (COLA), is effective April 1st of each year. To determine the change in CPI, OCERS’ actuary compares the Bureau of Labor Statistics’ annual average CPI for all urban consumers for the Los Angeles-Long Beach-Anaheim area for each of the past two years and derives the percentage change between the two. The increase or decrease in the CPI is rounded to the nearest one-half of one percent. The maximum COLA of 3% shall be granted on every retirement allowance, optional death allowance, or annual death allowance payable to or on account of any member of the system. For years in which the CPI exceeds 3%, the excess amount is banked and drawn from for future years when the CPI is less than 3%.
Date Granted
Actual CPI Rate
CPI Rounded
Max COLA Rate
COLA Granted
4/1/2020 3.07 3 3 3
4/1/2019 3.81 4 3 3
4/1/2018 2.79 3 3 3
4/1/2017 1.89 2 3 2
4/1/2016 0.91 1 3 1
4/1/2015 1.35 1.5 3 1.5
4/1/2014 1.08 1 3 1
4/1/2013 2.04 2 3 2
4/1/2012 2.67 2.5 3 2.5
4/1/2011 1.20 1 3 1
4/1/2010 -0.80 -1 3 0/-1**
4/1/2009 3.53 3.5 3 3
4/1/2008 3.30 3.5 3 3
4/1/2007 4.26 4.5 3 3
4/1/2006 4.45 4.5 3 3
4/1/2005 3.31 3.5 3 3
4/1/2004 2.63 2.5 3 2.5
4/1/2003 2.76 3 3 3
4/1/2002 3.32 3.5 3 3
4/1/2001 3.31 3.5 3 3
4/1/2000 2.34 2.5 3 2.5
4/1/1999 1.44 1.5 3 1.5
4/1/1998 1.58 1.5 3 1.5
* Per Government Code Section 318780.1 * * 2009 saw a unique scenario, a -1% CPI reflecting economic deflation in that year. For new retirees as of April 1, 2010, 0% was determined to be a COLA “floor”, as no benefit will ever be reduced. For longer retired members however, who had accumulated a COLA bank as of 2010, that bank was reduced by -1%.
OCERSbytheNumbers
28 Benefits

Retirement Effective Dates 0-5 5-10 10-15 15-20 20-25 25-30 30 & Over
PERIOD 1/1/09 –12/31/09
Average Monthly Pension Benefits $381 $950 $1,821 $2,716 $3,711 $5,852 $7,467
Average Monthly "Final Average Salary" $3,766 $4,228 $5,564 $6,006 $6,417 $7,669 $8,378
Number of Retired Members 26 45 102 87 110 106 124
PERIOD 1/1/10 –12/31/10
Average Monthly Pension Benefits $587 $986 $1,855 $2,929 $4,046 $5,922 $6,856
Average Monthly "Final Average Salary" $3,666 $4,800 $5,537 $6,291 $6,962 $7,764 $7,741
Number of Retired Members 23 45 108 106 130 127 129
PERIOD 1/1/11 –12/31/11
Average Monthly Pension Benefits $678 $1,057 $1,689 $3,054 $4,257 $5,910 $6,766
Average Monthly "Final Average Salary" $4,843 $5,825 $5,475 $6,497 $7,314 $7,874 $7,650
Number of Retired Members 16 55 111 86 120 123 155
PERIOD 1/1/12 –12/31/12
Average Monthly Pension Benefits $647 $1,142 $1,701 $2,957 $4,058 $5,802 $7,015
Average Monthly "Final Average Salary" $5,988 $5,398 $5,672 $6,347 $6,759 $7,702 $7,750
Number of Retired Members 20 71 128 88 187 145 172
PERIOD 1/1/13 –12/31/13
Average Monthly Pension Benefits $435 $1,166 $2,039 $2,946 $3,794 $6,409 $7,732
Average Monthly "Final Average Salary" $8,199 $6,347 $6,458 $6,492 $6,431 $8,432 $8,482
Number of Retired Members 29 55 139 82 161 147 131
PERIOD 1/1/14 –12/31/14
Average Monthly Pension Benefits $421 $1,152 $1,925 $3,188 $4,117 $6,444 $6,719
Average Monthly "Final Average Salary" $8,176 $6,955 $6,301 $6,961 $7,003 $8,463 $7,349
Number of Retired Members 23 45 146 96 143 192 138
PERIOD 1/1/15 –12/31/15
Average Monthly Pension Benefits $582 $1,263 $1,755 $2,850 $3,895 $5,679 $7,235
Average Monthly "Final Average Salary" $8,802 $6,888 $5,970 $6,673 $6,800 $7,893 $8,352
Number of Retired Members 22 63 128 119 110 200 182
PERIOD 1/1/16 –12/31/16
Average Monthly Pension Benefits $427 $1,244 $2,135 $2,886 $4,272 $5,549 $6,782
Average Monthly "Final Average Salary" $8,298 $6,907 $6,911 $6,580 $7,383 $7,651 $7,762
Number of Retired Members 24 56 121 120 113 195 163
PERIOD 1/1/17 –12/31/17
Average Monthly Pension Benefits $541 $1,215 $2,073 $3,062 $4,513 $5,851 $7,069
Average Monthly "Final Average Salary" $7,952 $6,800 $6,844 $6,810 $7,743 $7,975 $7,931
Number of Retired Members 21 47 122 147 112 190 153
PERIOD 1/1/18 –12/31/18
Average Monthly Pension Benefits $554 $1,190 $1,943 $2,879 $4,681 $6,074 $7,439
Average Monthly "Final Average Salary" $10,584 $7,287 $6,904 $6,859 $8,134 $8,246 $8,561
Number of Retired Members 23 62 125 144 127 205 208
PERIOD 1/1/19 –12/31/19
Average Monthly Pension Benefits $367 $1,424 $2,332 $3,073 $4,831 $6,475 $7,324
Average Monthly "Final Average Salary" $7,568 $8,243 $7,509 $6,985 $8,088 $8,591 $8,249
Number of Retired Members 31 54 121 150 135 249 191
PERIOD 1/1/20 –12/31/20
Average Monthly Pension Benefits $536 $1,475 $2,149 $3,422 $4,697 $6,151 $6,825
Average Monthly "Final Average Salary" $9,267 $8,556 $6,784 $7,473 $8,046 $8,340 $7,917
Number of Retired Members 29 59 128 166 237 281 288
2009 – 2020Years of Service
Schedule of Average Monthly Pension Benefit Payments for Service Retirements
by Years of Service
OCERSbytheNumbers
29 Benefits

Benefits
Retirement Effective Dates 0-5 5-10 10-15 15-20 20-25 25-30 30 & Over
PERIOD 1/1/10 –12/31/10
Median Monthly Pension Benefits $590 $887 $1,610 $2,438 $3,721 $5,396 $6,501
Median “Final Average Salary” $2,109 $3,750 $4,688 $5,638 $6,826 $7,152 $7,451
Number of Retired Members 23 45 108 106 130 127 129
PERIOD 1/1/11 –12/31/11
Median Monthly Pension Benefits $557 $889 $1,456 $2,567 $3,994 $5,762 $5,691
Median “Final Average Salary” $2,825 $4,698 $4,987 $5,501 $6,856 $7,807 $6,409
Number of Retired Members 16 55 111 86 120 123 155
PERIOD 1/1/12 –12/31/12
Median Monthly Pension Benefits $542 $992 $1,427 $2,568 $3,659 $5,830 $5,801
Median “Final Average Salary” $3,431 $4,742 $4,730 $5,747 $6,166 $7,783 $6,831
Number of Retired Members 20 71 128 88 187 145 172
PERIOD 1/1/13 –12/31/13
Median Monthly Pension Benefits $280 $989 $1,767 $2,545 $3,225 $6,246 $6,570
Median “Final Average Salary” $6,334 $5,582 $5,783 $5,959 $7,036 $8,477 $7,742
Number of Retired Members 29 55 139 82 161 147 131
PERIOD 1/1/14 –12/31/14
Median Monthly Pension Benefits $289 $830 $1,448 $2,627 $3,721 $6,451 $5,720
Median “Final Average Salary” $8,646 $4,876 $5,188 $5,990 $6,265 $8,561 $6,319
Number of Retired Members 23 45 146 96 143 192 138
PERIOD 1/1/15 –12/31/15
Median Monthly Pension Benefits $426 $914 $1,640 $2,514 $3,511 $5,241 $5,965
Median “Final Average Salary” $7,350 $4,979 $4,926 $5,999 $5,924 $7,379 $6,869
Number of Retired Members 22 63 128 119 110 200 182
PERIOD 1/1/16 –12/31/16
Median Monthly Pension Benefits $339 $980 $1,878 $2,563 $3,933 $5,080 $6,198
Median “Final Average Salary” $9,412 $5,885 $6,015 $5,707 $6,714 $7,314 $7,020
Number of Retired Members 24 56 121 120 113 195 163
PERIOD 1/1/17 –12/31/17
Median Monthly Pension Benefits $393 $843 $1,703 $2,574 $3,845 $5,404 $6,333
Median “Final Average Salary” $8,043 $4,996 $5,560 $5,946 $6,842 $7,673 $7,058
Number of Retired Members 21 47 122 147 112 190 153
PERIOD 1/1/18 –12/31/18
Median Monthly Pension Benefits $584 $876 $1,807 $2,489 $4,367 $5,284 $6,335
Median “Final Average Salary” $10,653 $6,447 $5,795 $5,709 $7,430 $7,255 $7,151
Number of Retired Members 23 62 125 144 127 205 208
PERIOD 1/1/19 –12/31/19
Median Monthly Pension Benefits $349 $1,108 $1,956 $2,715 $4,141 $5,591 $6,524
Median “Final Average Salary” $6,738 $7,434 $6,459 $6,068 $7,308 $7,328 $7,430
Number of Retired Members 31 54 121 150 135 249 191
PERIOD 1/1/20 –12/31/20
Median Monthly Pension Benefits $411 $1,169 $1,713 $2,799 $3,944 $5,508 $5,916
Median “Final Average Salary” $7,754 $8,310 $5,501 $6,241 $6,845 $7,328 $6,860
Number of Retired Members 29 59 128 166 237 281 288
Schedule of Median Monthly Pension Benefit Payments for Service Retirements by Years of Service
2010 – 2020
Years of Service
OCERSbytheNumbers
30

Schedule of Monthly Pension Benefit for Retirees (Service and Disability Retirements)
As of December 31, 2020
Monthly Benefit Number of retirees
$1 – 500 556 $501 – 1,000 989 $1,001 – 1,500 1,315 $1,501 – 2,000 1,296 $2,001 – 2,500 1,349 $2,501 – 3,000 1,350 $3,001 – 3,500 1,236 $3,501 – 4,000 1,033 $4,001 – 4,500 916 $4,501 – 5,000 872 $5,001 – 5,500 771 $5,501 – 6,000 647 $6,001 – 6,500 593 $6,501 – 7,000 513 $7,001 – 7,500 456 $7,501 – 8,000 439 $8,001 – 8,500 368 $8,501 – 9,000 314 $9,001 – 9,500 266 $9,501 – 10,000 264 $10,001 – 10,500 194 $10,501 – 11,000 189 $11,001 – 11,500 156 $11,501 – 12,000 136 Over $12,000 646 Total 16,864
31
OCERSbytheNumbers
Benefits
1600
1400
1200
"' 1000 Qj
~ ~ Qj a: 800 .... 0 ... C: ::, 0
600 u
400
200
0
Monthly Pension Benefit for Retirees (Service and Disability Retirements)

The OCERS Fund
OCERSbytheNumbers

Funding Sources
Funding Sources for Benefits
(OCERS’ net additions for the period 1998 – 2020)
An often stated error with regard to public pension retirement benefits is that they are funded solely from the taxpayers’ back pocket. That is not true. We have illustrated here a dollar going out the door in a benefit payment from OCERS to one of our retirees. What were the source funds for that dollar? The first portion of that dollar, at 54 cents, represents earnings achieved by the OCERS investment portfolio. The OCERS Board of Trustees takes the contributions OCERS receives from both employees and employers and invests those contributions on behalf of our approximately 48,000 members. OCERS grows those “seed” contributions through careful investments to an amount likely larger than an individual employee might have done solely on his or her own. The next largest portion of that benefit dollar, at 31 cents, comes from employer contributions, such as those paid by the County of Orange, the City of San Juan Capistrano, the Public Law Library, and other public employers within Orange County. You might ask if those aren’t local taxpayer dollars then, but the answer would be no. Many of those 31 cents do come from Orange County taxpayers, without a doubt, but some might just as well be paid from various federal government grant programs or other sources. Interestingly, that figure of 31 cents paid by the employers would be even larger were it not for the fact that some OCERS employees assist in paying the employer obligation. Despite what is sometimes reported in the press, the hard working employees of the County of Orange and our other participating employers are contributing their own dollars to the retirement plan as well. The final portion of the benefit dollar in the amount of 15 cents represents the deduction taken directly from the paychecks of OCERS’ members. In addition, as noted in the prior paragraph, several employee groups pay a portion of the employer contribution out of their own pockets to further help fund their own retirement benefit. One example of this additional payment is found with the County of Orange, which some years ago contracted with labor groups to have certain employees pay a portion of the employer contribution in what is commonly termed a “reverse pick up.”
54¢ 31¢ 15¢
Employee Contributions This is the money active employees pay into the fund for future benefits
Net Investment Income This includes earnings from stocks, bonds, alternatives, real estate and other investments, minus fees.
Employer Contributions This is the money paid to OCERS from employers for pension benefits.
OCERSbytheNumbers
Funding Sources 33
Asset Allocation Policy for 2020
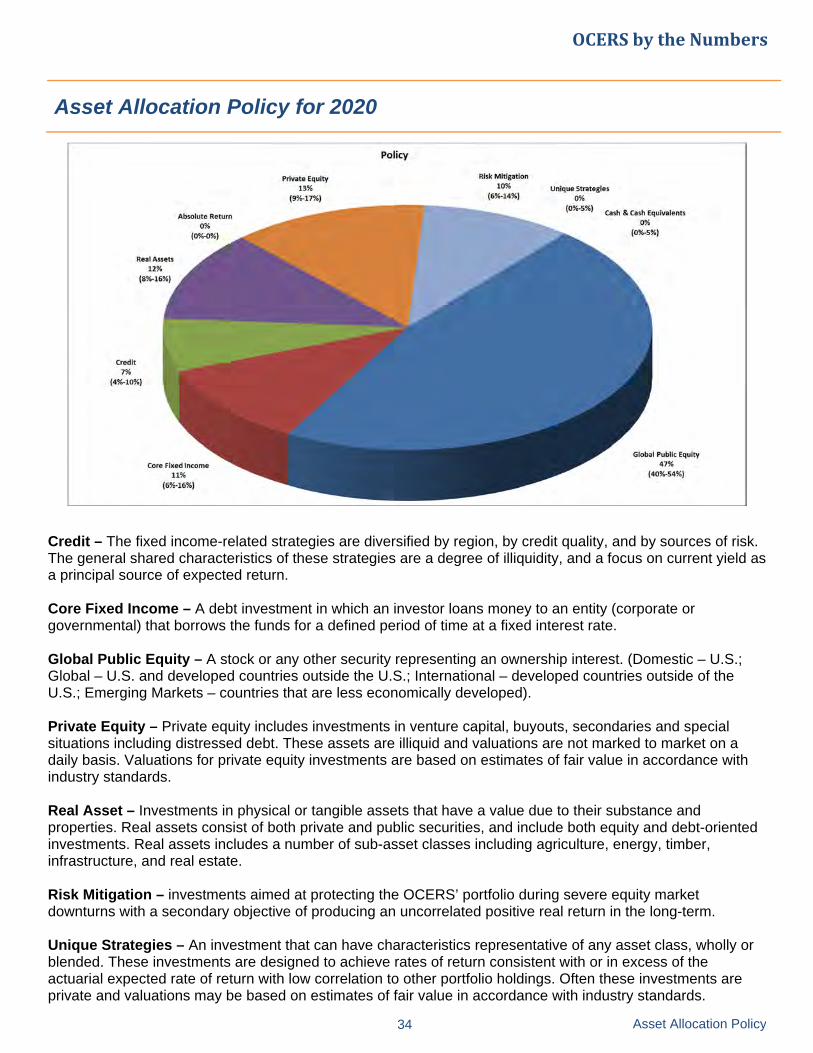
Credit – The fixed income-related strategies are diversified by region, by credit quality, and by sources of risk. The general shared characteristics of these strategies are a degree of illiquidity, and a focus on current yield as a principal source of expected return. Core Fixed Income – A debt investment in which an investor loans money to an entity (corporate or governmental) that borrows the funds for a defined period of time at a fixed interest rate. Global Public Equity – A stock or any other security representing an ownership interest. (Domestic – U.S.; Global – U.S. and developed countries outside the U.S.; International – developed countries outside of the U.S.; Emerging Markets – countries that are less economically developed). Private Equity – Private equity includes investments in venture capital, buyouts, secondaries and special situations including distressed debt. These assets are illiquid and valuations are not marked to market on a daily basis. Valuations for private equity investments are based on estimates of fair value in accordance with industry standards. Real Asset – Investments in physical or tangible assets that have a value due to their substance and properties. Real assets consist of both private and public securities, and include both equity and debt-oriented investments. Real assets includes a number of sub-asset classes including agriculture, energy, timber, infrastructure, and real estate. Risk Mitigation – investments aimed at protecting the OCERS’ portfolio during severe equity market downturns with a secondary objective of producing an uncorrelated positive real return in the long-term. Unique Strategies – An investment that can have characteristics representative of any asset class, wholly or blended. These investments are designed to achieve rates of return consistent with or in excess of the actuarial expected rate of return with low correlation to other portfolio holdings. Often these investments are private and valuations may be based on estimates of fair value in accordance with industry standards.
34 Asset Allocation Policy
OCERSbytheNumbers
Absolute Return
Real Assets
Credit 7%
(4%-10%)
Core Fixed Income 11%
(6%-16%)
Private Equity 13%
(9%-17%)
Policy
Risk Mitigation 10%
(6%-14%) -----~-- Unique Strategies 0%
(0%-5%) Cash & Cash Equivalents
0% (0%-5%)
Global Public Equity 47%
(40%-54%)
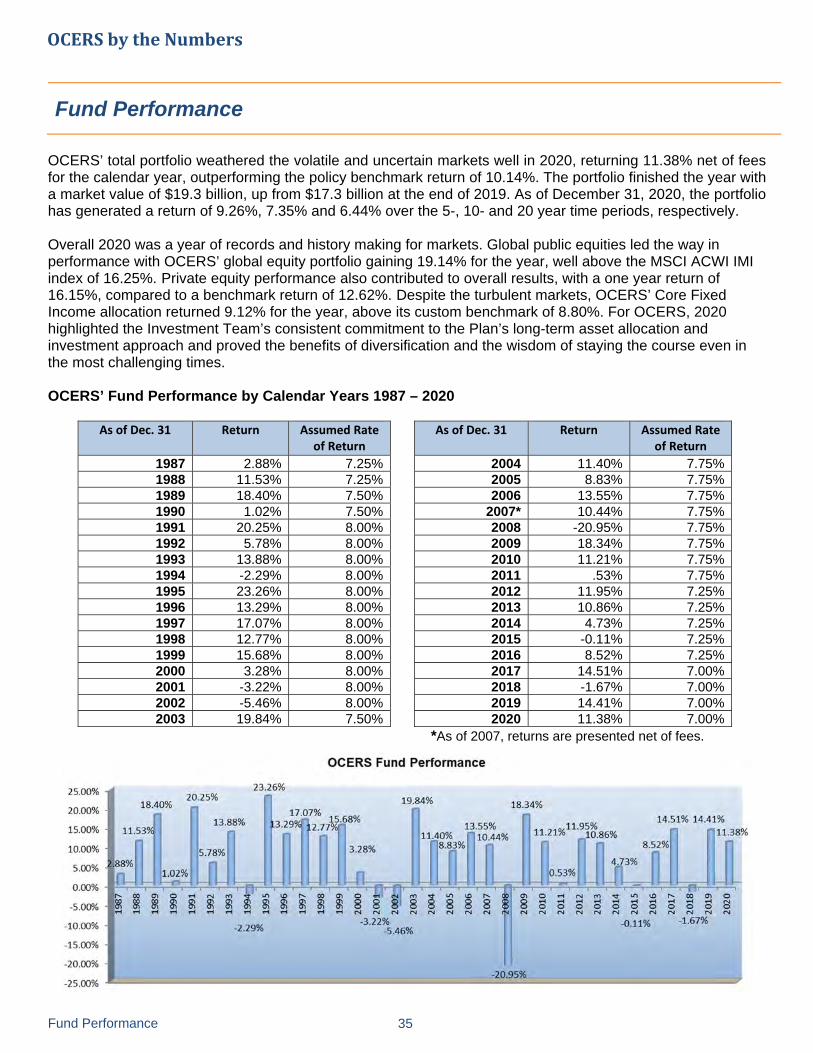
OCERS’ total portfolio weathered the volatile and uncertain markets well in 2020, returning 11.38% net of fees for the calendar year, outperforming the policy benchmark return of 10.14%. The portfolio finished the year with a market value of $19.3 billion, up from $17.3 billion at the end of 2019. As of December 31, 2020, the portfolio has generated a return of 9.26%, 7.35% and 6.44% over the 5-, 10- and 20 year time periods, respectively. Overall 2020 was a year of records and history making for markets. Global public equities led the way in performance with OCERS’ global equity portfolio gaining 19.14% for the year, well above the MSCI ACWI IMI index of 16.25%. Private equity performance also contributed to overall results, with a one year return of 16.15%, compared to a benchmark return of 12.62%. Despite the turbulent markets, OCERS’ Core Fixed Income allocation returned 9.12% for the year, above its custom benchmark of 8.80%. For OCERS, 2020 highlighted the Investment Team’s consistent commitment to the Plan’s long-term asset allocation and investment approach and proved the benefits of diversification and the wisdom of staying the course even in the most challenging times. OCERS’ Fund Performance by Calendar Years 1987 – 2020
As of Dec. 31 Return Assumed Rate of Return
As of Dec. 31 Return Assumed Rate of Return
1987 2.88% 7.25% 2004 11.40% 7.75% 1988 11.53% 7.25% 2005 8.83% 7.75% 1989 18.40% 7.50% 2006 13.55% 7.75% 1990 1.02% 7.50% 2007* 10.44% 7.75% 1991 20.25% 8.00% 2008 -20.95% 7.75% 1992 5.78% 8.00% 2009 18.34% 7.75% 1993 13.88% 8.00% 2010 11.21% 7.75% 1994 -2.29% 8.00% 2011 .53% 7.75% 1995 23.26% 8.00% 2012 11.95% 7.25% 1996 13.29% 8.00% 2013 10.86% 7.25% 1997 17.07% 8.00% 2014 4.73% 7.25% 1998 12.77% 8.00% 2015 -0.11% 7.25% 1999 15.68% 8.00% 2016 8.52% 7.25% 2000 3.28% 8.00% 2017 14.51% 7.00% 2001 -3.22% 8.00% 2018 -1.67% 7.00% 2002 -5.46% 8.00% 2019 14.41% 7.00% 2003 19.84% 7.50% 2020 11.38% 7.00%
*As of 2007, returns are presented net of fees.
Fund Performance
35 Fund Performance
OCERSbytheNumbers
25.00%
20.00%
15.00%
10.00%
5.00%
0.00%
-5.00%
-10.00%
-15.00%
-20.00%
-25.00%
18.40%
11.53%
OCERS Fund Performance
23.26% 20.25% 19.84% 18.34%
13.88% 17.07% 15 68o/c
3.29% 2.77o/c. 0 13.55% 11.40% 10.44%
11.95% 11.21% 10.86%
8.83%
-2.29%
-20.95%
14.51% 14.41%
11.38% 8.52%
-0.11%
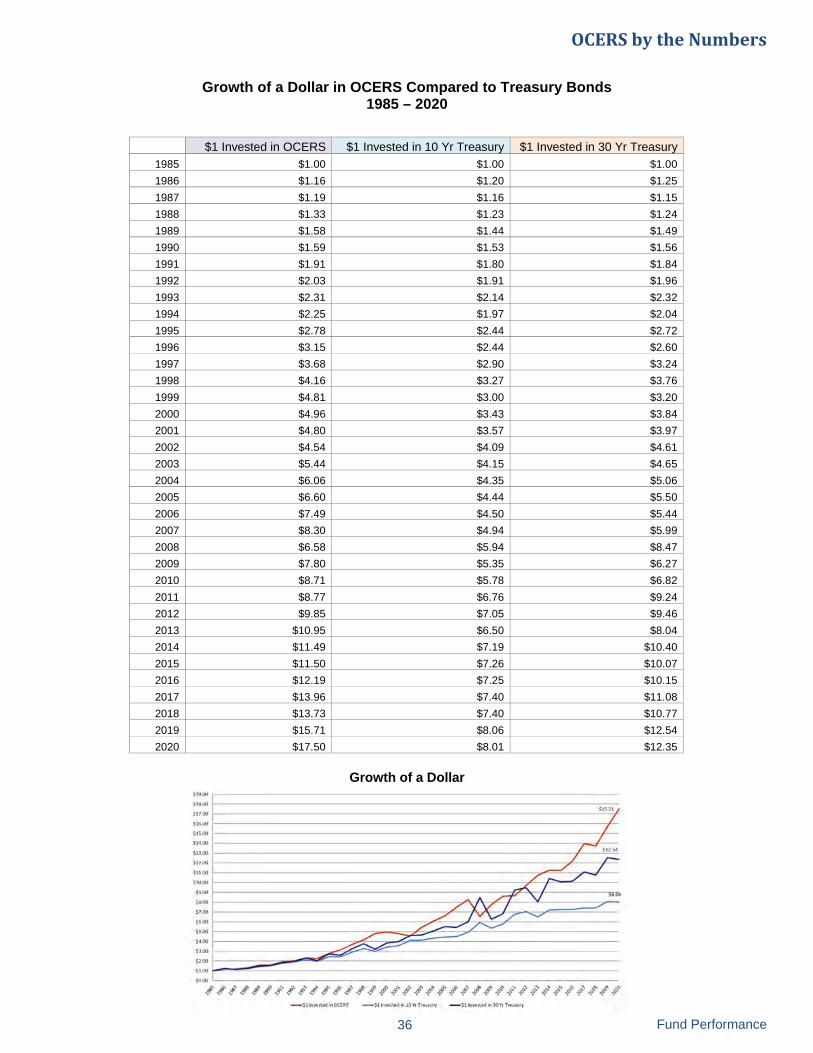
Growth of a Dollar in OCERS Compared to Treasury Bonds
1985 – 2020
36 Fund Performance
Growth of a Dollar
OCERSbytheNumbers
$1 Invested in OCERS $1 Invested in 10 Yr Treasury $1 Invested in 30 Yr Treasury
1985 $1.00 $1.00 $1.00
1986 $1.16 $1.20 $1.25
1987 $1.19 $1.16 $1.15
1988 $1.33 $1.23 $1.24
1989 $1.58 $1.44 $1.49
1990 $1.59 $1.53 $1.56
1991 $1.91 $1.80 $1.84
1992 $2.03 $1.91 $1.96
1993 $2.31 $2.14 $2.32
1994 $2.25 $1.97 $2.04
1995 $2.78 $2.44 $2.72
1996 $3.15 $2.44 $2.60
1997 $3.68 $2.90 $3.24
1998 $4.16 $3.27 $3.76
1999 $4.81 $3.00 $3.20
2000 $4.96 $3.43 $3.84
2001 $4.80 $3.57 $3.97
2002 $4.54 $4.09 $4.61
2003 $5.44 $4.15 $4.65
2004 $6.06 $4.35 $5.06
2005 $6.60 $4.44 $5.50
2006 $7.49 $4.50 $5.44
2007 $8.30 $4.94 $5.99
2008 $6.58 $5.94 $8.47
2009 $7.80 $5.35 $6.27
2010 $8.71 $5.78 $6.82
2011 $8.77 $6.76 $9.24
2012 $9.85 $7.05 $9.46
2013 $10.95 $6.50 $8.04
2014 $11.49 $7.19 $10.40
2015 $11.50 $7.26 $10.07
2016 $12.19 $7.25 $10.15
2017 $13.96 $7.40 $11.08
2018 $13.73 $7.40 $10.77
2019 $15.71 $8.06 $12.54
2020 $17.50 $8.01 $12.35
$19.00
$1K,l){l
$17.00
$16.00
$15.00
$1'1.00
$13.00
$1Hl0
$11 .00
$10.0U
$'l.00
S&OO
$7.00
,.oo $5.00
$4.00
$3.00
$2.00
$1.00
so.oo
./ ......-:::: -
/ .; - :....,,'
~
• A ./"T
./ 'LV I ./ I V \,,/ / ____,, ,,, ..._,__.....
$ 15.71 j
/ /
/ / $ 17.'.,4
/ / /
/ - /
I
"' rn;
-~
~~i~~~~~~~~~~~~~#~~~~~#~~~~~~~~~i~~~ - $11~$ted lnOCtRS - Sl lnve~led lnlOY1Trt;1$Ury - s1 1nveill:-din)OY1TrU$Ury

Revenue
Member and Employer Contributions and Investment Income and Losses to Pension Trust
Year Member Contributions
Employer Contributions
(Cash Payments Only to Pension
Trust)
Employer Contributions
from POB Funds*
Investment Income (Losses)
1998 $50,557,000 $17,977,000 $42,020,000 $493,491,000 1999 $55,693,000 $17,591,000 $47,129,000 $685,178,000 2000 $61,179,000 $15,561,000 $48,555,000 $45,284,000 2001 $68,635,000 $12,060,000 $41,319,000 ($149,858,000) 2002 $77,917,000 $13,289,000 $65,180,000 ($269,188,000) 2003 $81,581,000 $124,243,000 $26,209,000 $789,086,000 2004 $81,931,000 $194,430,000 $3,579,000 $569,000,000 2005 $107,544,000 $226,130,000 $9,675,000 $461,980,000 2006 $137,582,000 $277,368,000 $11,000,000 $830,200,000 2007 $159,476,000 $326,736,000 $11,000,000 $784,961,000 2008 $172,291,000 $360,365,000 $12,600,000 ($1,596,776,000) 2009 $171,928,000 $338,387,000 $34,900,000 $1,064,855,000 2010 $177,929,000 $372,437,000 $11,000,000 $888,542,000 2011 $183,820,000 $387,585,000 $11,000,000 $50,456,000 2012 $191,215,000 $406,521,000 $5,500,000 $1,004,770,000 2013 $209,301,000 $427,095,000 $5,000,000 $1,152,647,000 2014 $232,656,000 $625,520,000 $5,000,000 $499,195,000 2015 $249,271,000 $571,298,000 $0 ($10,873,000) 2016 $258,297,000 $567,196,000 $0 $1,061,243,000 2017 $262,294,000 $572,104,000 $0 $1,939,635,000 2018 $270,070,000 $580,905,000 $0 ($324,628,000) 2019 $279,373,000 $653,793,000 $0 $2,183,808,000 2020 $279,384,000 $659,807,000 $5,000,000 $2,173,184,000
* In September 1994, the County of Orange issued $320 million in Pension Obligation Bonds (POB’s) of which $318.3 million in proceeds were paid to OCERS to fund the County’s portion of the Unfunded Actuarial Accrued Liability (UAAL). For accounting purposes, OCERS maintains the proceeds for the POB’s in the County Investment Account. OCERS and the County of Orange, a single participating district, entered into an agreement which provided an offsetting credit based upon an amount actuarially determined to deplete the County Investment Account over the then remaining UAAL amortization period. The County determines annually how the account will be applied to contribution requirements.
37 Revenue
OCERSbytheNumbers
$2,500,000,000
$2,000,000,000
$1,500,000,000
$1,000,000,000
$500,000,000
$0
($500,000,000)
($1,000,000,000)
($1,500,000,000)
($2,000,000,000) ■ Member Contributions ■ Employer Contributions ■ Employer Contributions from POB Funds* ■ Investment Income (losses)
(Cash Payments Only)
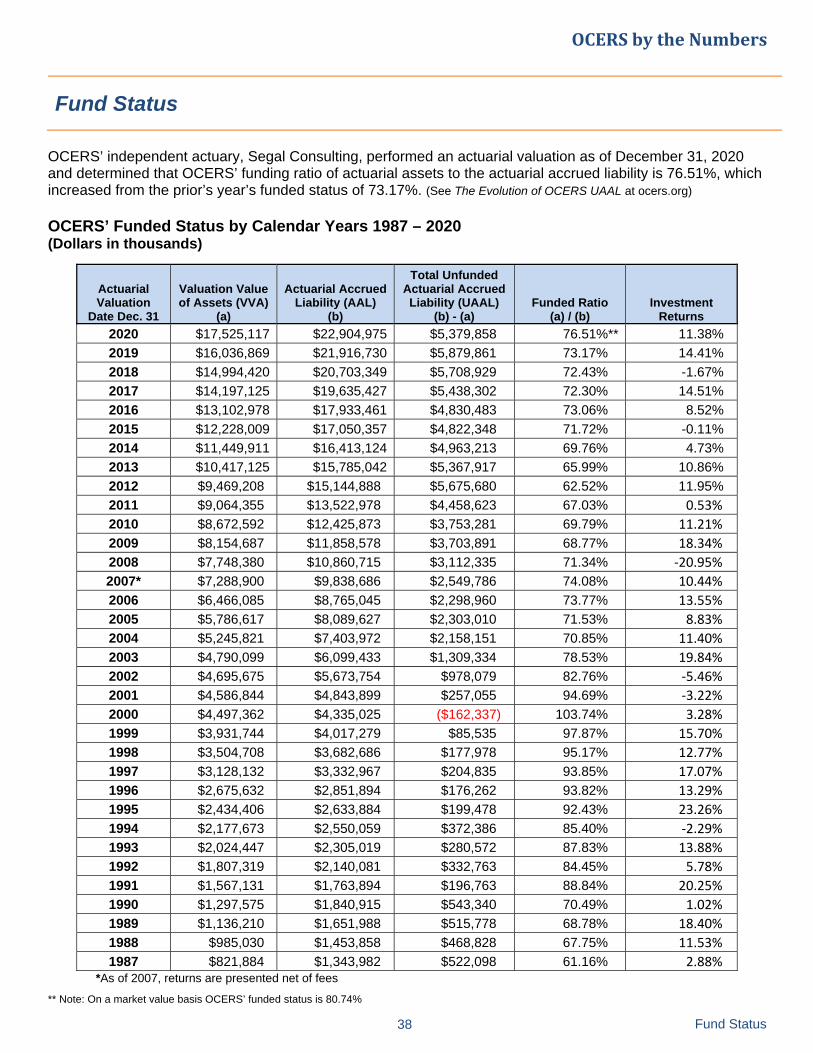
OCERS’ independent actuary, Segal Consulting, performed an actuarial valuation as of December 31, 2020 and determined that OCERS’ funding ratio of actuarial assets to the actuarial accrued liability is 76.51%, which increased from the prior’s year’s funded status of 73.17%. (See The Evolution of OCERS UAAL at ocers.org)
OCERS’ Funded Status by Calendar Years 1987 – 2020 (Dollars in thousands)
Actuarial Valuation
Date Dec. 31
Valuation Value of Assets (VVA)
(a)
Actuarial Accrued Liability (AAL)
(b)
Total Unfunded Actuarial Accrued Liability (UAAL)
(b) - (a) Funded Ratio
(a) / (b) Investment
Returns
2020 $17,525,117 $22,904,975 $5,379,858 76.51%** 11.38%
2019 $16,036,869 $21,916,730 $5,879,861 73.17% 14.41%
2018 $14,994,420 $20,703,349 $5,708,929 72.43% -1.67%
2017 $14,197,125 $19,635,427 $5,438,302 72.30% 14.51%
2016 $13,102,978 $17,933,461 $4,830,483 73.06% 8.52%
2015 $12,228,009 $17,050,357 $4,822,348 71.72% -0.11%
2014 $11,449,911 $16,413,124 $4,963,213 69.76% 4.73%
2013 $10,417,125 $15,785,042 $5,367,917 65.99% 10.86%
2012 $9,469,208 $15,144,888 $5,675,680 62.52% 11.95%
2011 $9,064,355 $13,522,978 $4,458,623 67.03% 0.53%
2010 $8,672,592 $12,425,873 $3,753,281 69.79% 11.21%
2009 $8,154,687 $11,858,578 $3,703,891 68.77% 18.34%
2008 $7,748,380 $10,860,715 $3,112,335 71.34% ‐20.95%
2007* $7,288,900 $9,838,686 $2,549,786 74.08% 10.44%
2006 $6,466,085 $8,765,045 $2,298,960 73.77% 13.55%
2005 $5,786,617 $8,089,627 $2,303,010 71.53% 8.83%
2004 $5,245,821 $7,403,972 $2,158,151 70.85% 11.40%
2003 $4,790,099 $6,099,433 $1,309,334 78.53% 19.84%
2002 $4,695,675 $5,673,754 $978,079 82.76% ‐5.46%
2001 $4,586,844 $4,843,899 $257,055 94.69% ‐3.22%
2000 $4,497,362 $4,335,025 ($162,337) 103.74% 3.28%
1999 $3,931,744 $4,017,279 $85,535 97.87% 15.70%
1998 $3,504,708 $3,682,686 $177,978 95.17% 12.77%
1997 $3,128,132 $3,332,967 $204,835 93.85% 17.07%
1996 $2,675,632 $2,851,894 $176,262 93.82% 13.29%
1995 $2,434,406 $2,633,884 $199,478 92.43% 23.26%
1994 $2,177,673 $2,550,059 $372,386 85.40% ‐2.29%
1993 $2,024,447 $2,305,019 $280,572 87.83% 13.88%
1992 $1,807,319 $2,140,081 $332,763 84.45% 5.78%
1991 $1,567,131 $1,763,894 $196,763 88.84% 20.25%
1990 $1,297,575 $1,840,915 $543,340 70.49% 1.02%
1989 $1,136,210 $1,651,988 $515,778 68.78% 18.40%
1988 $985,030 $1,453,858 $468,828 67.75% 11.53%
1987 $821,884 $1,343,982 $522,098 61.16% 2.88% *As of 2007, returns are presented net of fees
** Note: On a market value basis OCERS’ funded status is 80.74%
Fund Status
OCERSbytheNumbers
38 Fund Status

Growth of System Net Investments at Fair Value
(Dollars in Millions)
Unfunded Actuarial Accrued Liabilities (UAAL) (Dollars in Millions)
39 Fund Status
OCERSbytheNumbers
$20,000
$18,000
$16,000
$14,000
$12,000
$10,000
$8,000
$6,000
$4,000
$2,000
so
120% ' 100%
80%
)/ 8% 60% -40%
20%
$8,202 $8,429 $8,624 $6,986 $6,530 $7,190
$4 898 $5 098 $4,588 SS.357S6,0
72
6 ' ' $4,043 $4 300
$11 567S11,782 $9,501 $10,734 •
$19,167
$16,942
$14,771 $14,771 $12,891
1998 1999 2000 2001 2002 2003 2004 2005 2006 2007 2008 2009 2010 2011 2012 2013 2014 2015 2016 2017 2018 2019 2020
61%
$6,000 - ----------------------------------------------~$5,880
s~.cni
$4,000
S3,000
$1,303 $2,SSO
S1,000
51,)09
S1,UCJJ $'7
$516
'°n' TI f't' n srr $333 $372 $176 S178
11 11 'fl' n 'rl n s; n 'l"t n _ $257
n
$5,676
$4.4$9
$3,753
S)
SJ,112
$4,963
55,438 ..,
$4, ~ l' ,83
5:;,709
55,380
986 t ')87 1'3AA 198'> t <n(I l ')<) t 1<)<)7 t 'J93 1')<)4 1?95 1')')6 l ')'JJ 19'>SI 19')') 1tlll 100 1 7001 7003 100/I 1005 1(1()6 700/ 7008 7009 7010 '.)(Jlt 101 1 1013 7014 101~ ,016 101 7 W HI 701') 1010
{$162)
IS >,000) ~==================================================
89% 84% 88% 85%
I ...
68% 69% 70%
Funded Ratio by Calendar Years (Rounded)
104%
92% 94% 94% 95% 98% 95%
83% 79% 71% 72% 74% 74% 71% 69%
70% 67% 63% 66% 70% 72% 73% 72%
11
72% 73% 7?%
I
0% ' - - ,. .. .. --·- I- .. .. .. -- -- .. ,J- , ,1---1., - - ·-,_ - ·- . . ,I-·-,_ - --- -·- ~
1986 1987 1988 1989 1990 1991 1992 1993 1994 1995 1996 1997 1998 1999 2000 2001 2002 2003 2004 2005 2006 2007 2008 2009 2010 2011 2012 2013 2014 2015 2016 2017 2018 2019 2020
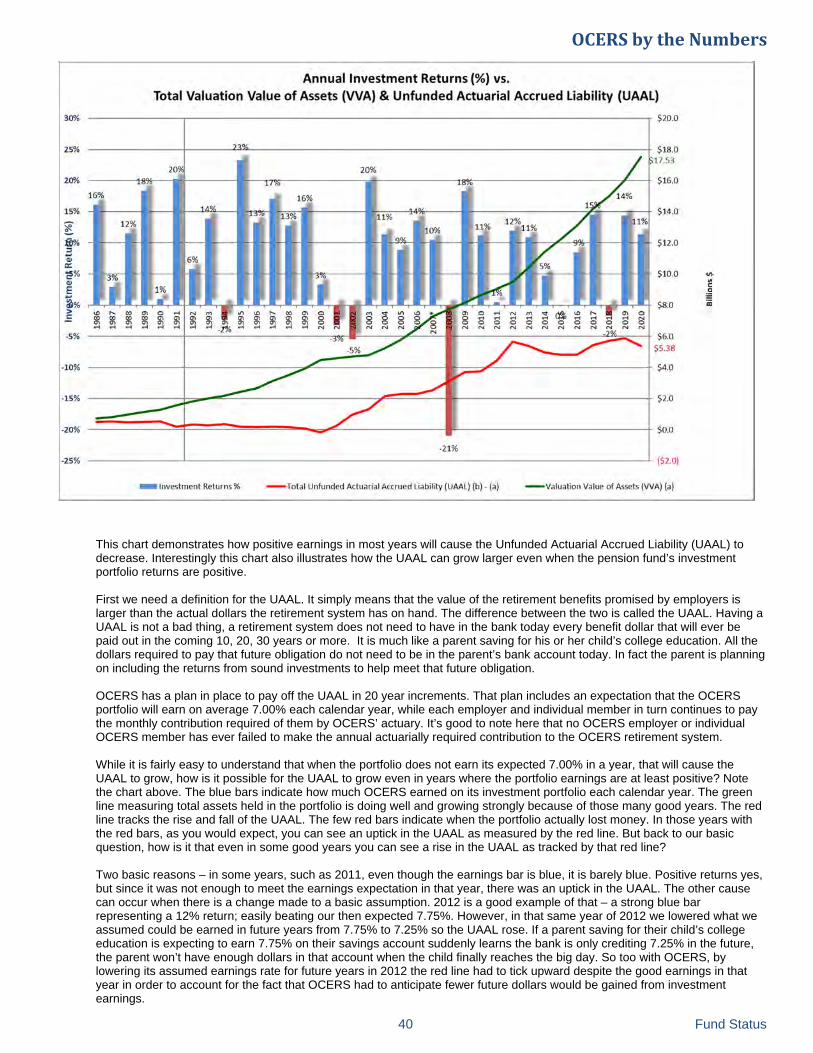
This chart demonstrates how positive earnings in most years will cause the Unfunded Actuarial Accrued Liability (UAAL) to decrease. Interestingly this chart also illustrates how the UAAL can grow larger even when the pension fund’s investment portfolio returns are positive. First we need a definition for the UAAL. It simply means that the value of the retirement benefits promised by employers is larger than the actual dollars the retirement system has on hand. The difference between the two is called the UAAL. Having a UAAL is not a bad thing, a retirement system does not need to have in the bank today every benefit dollar that will ever be paid out in the coming 10, 20, 30 years or more. It is much like a parent saving for his or her child’s college education. All the dollars required to pay that future obligation do not need to be in the parent’s bank account today. In fact the parent is planning on including the returns from sound investments to help meet that future obligation. OCERS has a plan in place to pay off the UAAL in 20 year increments. That plan includes an expectation that the OCERS portfolio will earn on average 7.00% each calendar year, while each employer and individual member in turn continues to pay the monthly contribution required of them by OCERS’ actuary. It’s good to note here that no OCERS employer or individual OCERS member has ever failed to make the annual actuarially required contribution to the OCERS retirement system. While it is fairly easy to understand that when the portfolio does not earn its expected 7.00% in a year, that will cause the UAAL to grow, how is it possible for the UAAL to grow even in years where the portfolio earnings are at least positive? Note the chart above. The blue bars indicate how much OCERS earned on its investment portfolio each calendar year. The green line measuring total assets held in the portfolio is doing well and growing strongly because of those many good years. The red line tracks the rise and fall of the UAAL. The few red bars indicate when the portfolio actually lost money. In those years with the red bars, as you would expect, you can see an uptick in the UAAL as measured by the red line. But back to our basic question, how is it that even in some good years you can see a rise in the UAAL as tracked by that red line? Two basic reasons – in some years, such as 2011, even though the earnings bar is blue, it is barely blue. Positive returns yes, but since it was not enough to meet the earnings expectation in that year, there was an uptick in the UAAL. The other cause can occur when there is a change made to a basic assumption. 2012 is a good example of that – a strong blue bar representing a 12% return; easily beating our then expected 7.75%. However, in that same year of 2012 we lowered what we assumed could be earned in future years from 7.75% to 7.25% so the UAAL rose. If a parent saving for their child’s college education is expecting to earn 7.75% on their savings account suddenly learns the bank is only crediting 7.25% in the future, the parent won’t have enough dollars in that account when the child finally reaches the big day. So too with OCERS, by lowering its assumed earnings rate for future years in 2012 the red line had to tick upward despite the good earnings in that year in order to account for the fact that OCERS had to anticipate fewer future dollars would be gained from investment earnings.
OCERSbytheNumbers
Fund Status 40
30%
25%
20%
15%
-5%
-10%
-15%
-20%
-25%
Annual Investment Returns{%) vs. Total Valuation Value of Assets (VVA) & Unfunded Actuarial Accrued Liability (UAAL)
---------,---------------------------------------r $20.0
-21%
- Investment Returns% --Total Unfunded Actuarial Accrued Liability (UAAL) (b) - (a)
$18.0 17.53
$16.0
$14.0
$6.0 $5.38
$4.0
$2.0
($2.0)
--valuation Va lue of Assets (VVA) (a)


j'
ORANG E COUNTY
EMPLOYEES RETIREMENT SYSTEM