Embed Size (px)
DESCRIPTION
Read STATSPACK Output
Citation preview
Interpret Statspack Report
Prepared by: Ramesh 1
Introduction The utlbstat.sql and utlestat.sql are Oracle provided scripts which are included with Oracle 7, 8 and 8i. These scripts lay the foundation for most tuning efforts and are executed as sys or internal from within svrmgrl(UNIX) or svrmgr23 (on NT). While no two DBA's generally agree on an assessment of every statistics reported from utlestat.sql and it's report.txt output, they should agree on the meaning of the main statistics, which is what I'll discuss here. Getting Started You should be familiar with some basic nomenclature, utilities and parameters before getting started.
TIME_STATISTICS=TRUE Set in the init.ora, it enables capturing of internal timing statistics on the database.
utlbstat.sql Oracle supplied script to initialize internal statistics capturing, I'll refer to this simply as bstat.
utlestat.sql Oracle supplied script to end internal statistics capturing and generate the report.txt output. I'll refer to this script as estat.
report.txt The output from the execution of the estat script which is spooled to its current directory
cron The UNIX job scheduler (see the main pages if your not familiar with this utility)
svrmgrl The line mode version of server manager, the DBA interface used to accomplish maintenance of the database, available after the 7.1 release of Oracle.
To be able to run the utlbstat.sql and utlestat.sql script, (normally found in the $ORACLE_HOME/rdbms/admin subdirectory in an OFA installation), you must first set TIMED_STATISTICS=TRUE in your init.ora and shutdown and restart the database, or you will need to ALTER SESSION SET TIMED_STATISTICES =TRUE from svrmgrl.
Interpret Statspack Report
Prepared by: Ramesh 2
Next, you have two choices; you can either set up a cron job to execute the two scripts during peak or scheduled times; or launch the scripts interactively from within svrmgrl. I'll discuss the interactive approach first, followed by a couple of cron scenarios you can use. Running bstat and estat interactively After assuring TIMED_STATISTICS=TRUE is set for your database;
select substr(name,1,30),value
from v$parameter
where name = 'timed_statistics'; *** Note lower case for timed_statistics
timed_statistics TRUE *** Should be the result from the query
Log into svrmgrl as SYSDBA, SYS or INTERNAL. Next, run @$ORACLE_HOME/rdbms/admin/utlbstat. This will create the temporary tables and views that will be used to collect the beginning statistics that will be saved in these tables. All of these tables contain BEGIN in their name. If your not still logged into svrmgrl, log in again as SYSDBA, SYS or INTERNAL. Run the utlestat.sql script as @$ORACLE_HOME/rdbms/admin/utlestat from the svrmgrl command prompt. The estat script will collect the ending statistics, and create an additional set of temporary tables which it will use to format the output for the report.txt statistics report. As you might guess, these tables will contain END in their name. The report.txt output, is what you are actually interested in, and it is this output which you will be doing your assessment from and making tuning decisions for your database. The duration of time between running bstat and estat is a matter of personal choice, however it should be long enough to collect sufficient statistics for the results
Interpret Statspack Report
Prepared by: Ramesh 3
to be meaningful. Generally, no less than 30 minutes should be used, and, it should also be run during a period of peak activity. You may also to choose to run it for specific tuning sessions when performance on the database is not optimal and you are troubleshooting a particular issue, which may or may not coincide with "peak activity". Running bstat and estat from UNIX cron I typically choose to run these utilities from cron at selected periods and for set duration during the normal business day. My reason for this approach is it gives me an excellent historical view of the performance of the database. This enables me to easily compare a period of poor performance today, with the same period of time previously when there were no performance problems. Also, as tuning is an iterative process, tuning changes I made recently are hopefully having a positive impact on the performance of the database, and by having historical reports to go back to, I can readily establish comparative numbers validating the changes which were made. The comparison of the two or more reports may also show, we went to far one way or the other and have introduced performance degradation as a result of the changes. (Yes this does happen) There are three methods I employ at any given time for a particular database in collecting statistics; every two hours during the normal business day; start and end of the business day; and, start of week through end of week. Let's look at each method individually. When I'm tuning a "technologically challenged" database, which is exhibiting less than optimal performance, I use the following cron entries to collect continuous 2 hour snapshots of performance which I can later manually review, or grep specific sections or lines out of.
##################################################
# Run the utlbstat and utlestat reports Mon - Fri
##################################################
Interpret Statspack Report
Prepared by: Ramesh 4
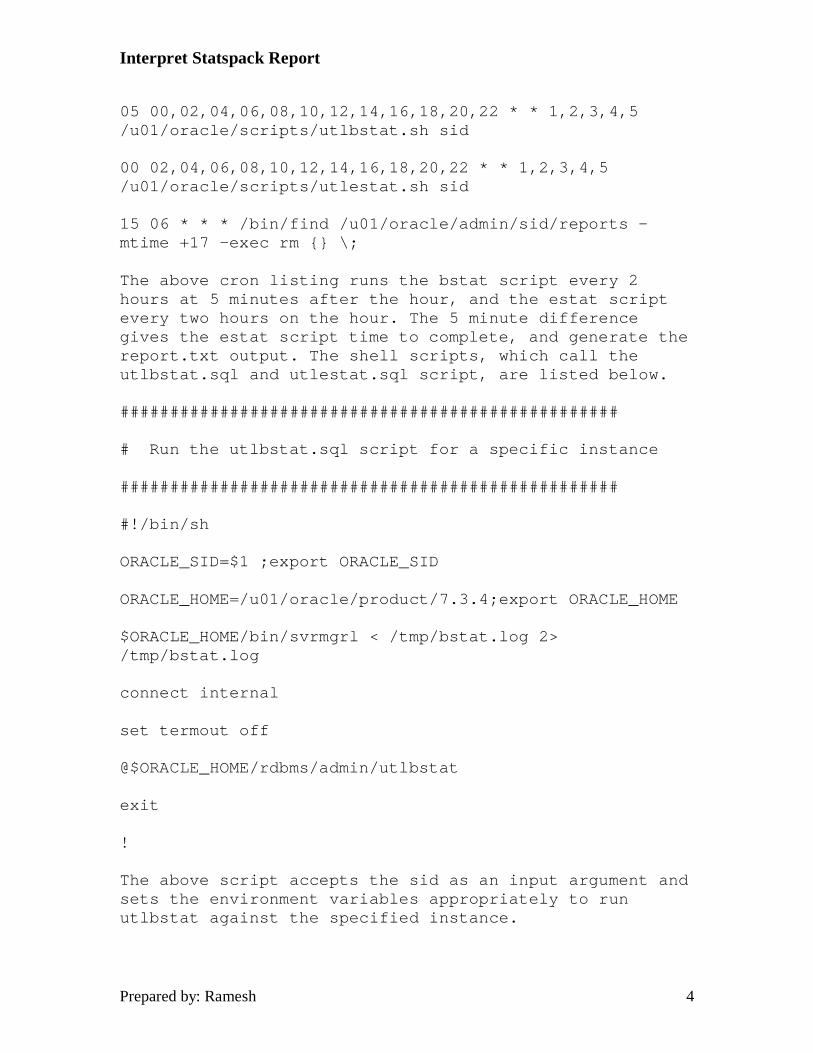
05 00,02,04,06,08,10,12,14,16,18,20,22 * * 1,2,3,4,5 /u01/oracle/scripts/utlbstat.sh sid
00 02,04,06,08,10,12,14,16,18,20,22 * * 1,2,3,4,5 /u01/oracle/scripts/utlestat.sh sid
15 06 * * * /bin/find /u01/oracle/admin/sid/reports -mtime +17 -exec rm {} \;
The above cron listing runs the bstat script every 2 hours at 5 minutes after the hour, and the estat script every two hours on the hour. The 5 minute difference gives the estat script time to complete, and generate the report.txt output. The shell scripts, which call the utlbstat.sql and utlestat.sql script, are listed below.
##################################################
# Run the utlbstat.sql script for a specific instance
##################################################
#!/bin/sh
ORACLE_SID=$1 ;export ORACLE_SID
ORACLE_HOME=/u01/oracle/product/7.3.4;export ORACLE_HOME
$ORACLE_HOME/bin/svrmgrl < /tmp/bstat.log 2> /tmp/bstat.log
connect internal
set termout off
@$ORACLE_HOME/rdbms/admin/utlbstat
exit
!
The above script accepts the sid as an input argument and sets the environment variables appropriately to run utlbstat against the specified instance.
Interpret Statspack Report
Prepared by: Ramesh 5
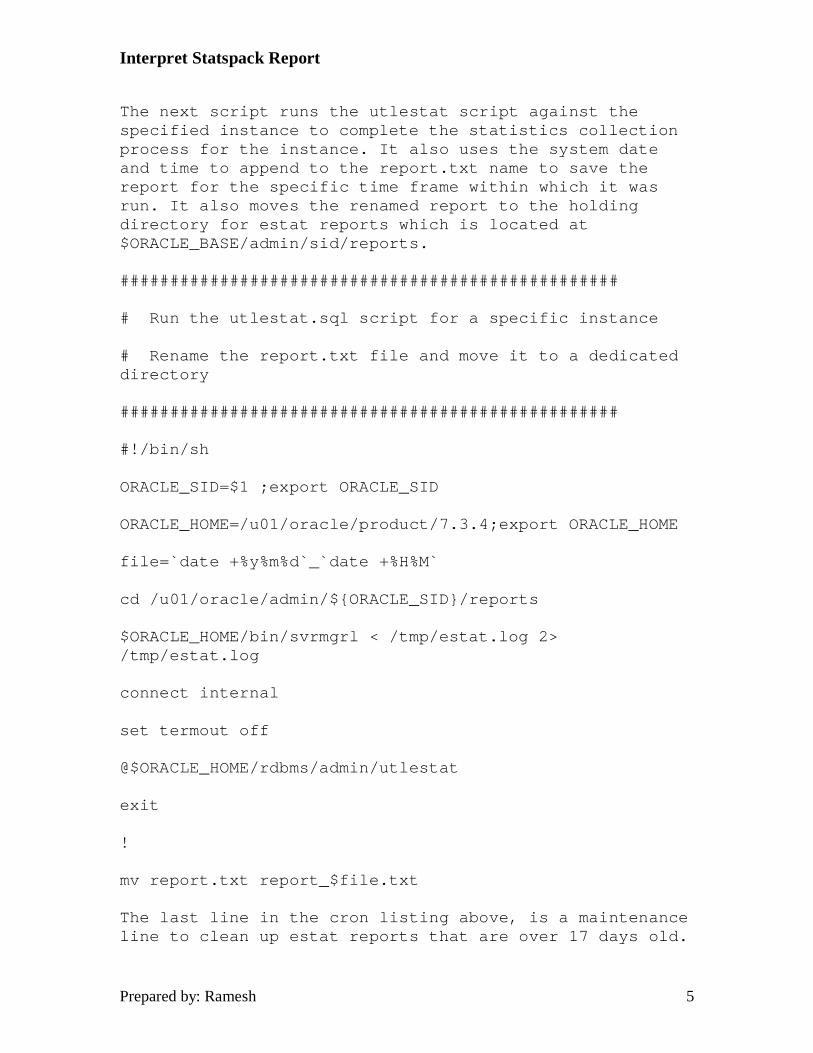
The next script runs the utlestat script against the specified instance to complete the statistics collection process for the instance. It also uses the system date and time to append to the report.txt name to save the report for the specific time frame within which it was run. It also moves the renamed report to the holding directory for estat reports which is located at $ORACLE_BASE/admin/sid/reports.
##################################################
# Run the utlestat.sql script for a specific instance
# Rename the report.txt file and move it to a dedicated directory
##################################################
#!/bin/sh
ORACLE_SID=$1 ;export ORACLE_SID
ORACLE_HOME=/u01/oracle/product/7.3.4;export ORACLE_HOME
file=`date +%y%m%d`_`date +%H%M`
cd /u01/oracle/admin/${ORACLE_SID}/reports
$ORACLE_HOME/bin/svrmgrl < /tmp/estat.log 2> /tmp/estat.log
connect internal
set termout off
@$ORACLE_HOME/rdbms/admin/utlestat
exit
!
mv report.txt report_$file.txt
The last line in the cron listing above, is a maintenance line to clean up estat reports that are over 17 days old.
Interpret Statspack Report
Prepared by: Ramesh 6
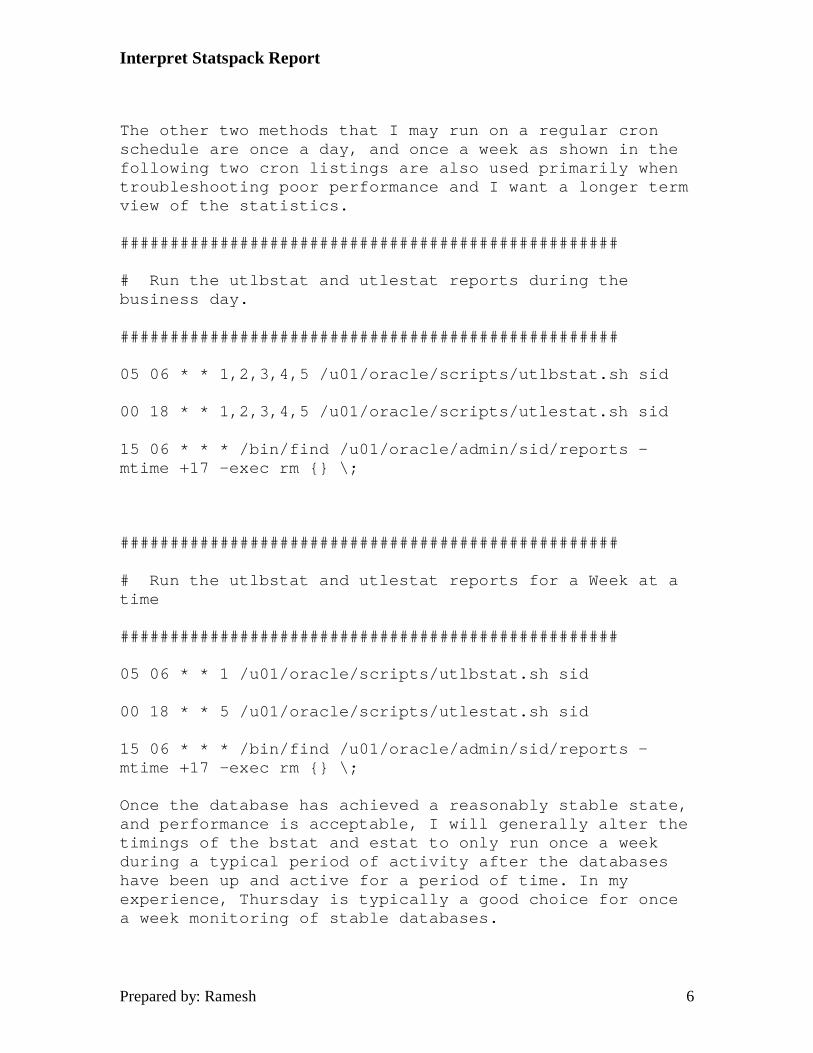
The other two methods that I may run on a regular cron schedule are once a day, and once a week as shown in the following two cron listings are also used primarily when troubleshooting poor performance and I want a longer term view of the statistics.
##################################################
# Run the utlbstat and utlestat reports during the business day.
##################################################
05 06 * * 1,2,3,4,5 /u01/oracle/scripts/utlbstat.sh sid
00 18 * * 1,2,3,4,5 /u01/oracle/scripts/utlestat.sh sid
15 06 * * * /bin/find /u01/oracle/admin/sid/reports -mtime +17 -exec rm {} \;
##################################################
# Run the utlbstat and utlestat reports for a Week at a time
##################################################
05 06 * * 1 /u01/oracle/scripts/utlbstat.sh sid
00 18 * * 5 /u01/oracle/scripts/utlestat.sh sid
15 06 * * * /bin/find /u01/oracle/admin/sid/reports -mtime +17 -exec rm {} \;
Once the database has achieved a reasonably stable state, and performance is acceptable, I will generally alter the timings of the bstat and estat to only run once a week during a typical period of activity after the databases have been up and active for a period of time. In my experience, Thursday is typically a good choice for once a week monitoring of stable databases.
Interpret Statspack Report
Prepared by: Ramesh 7
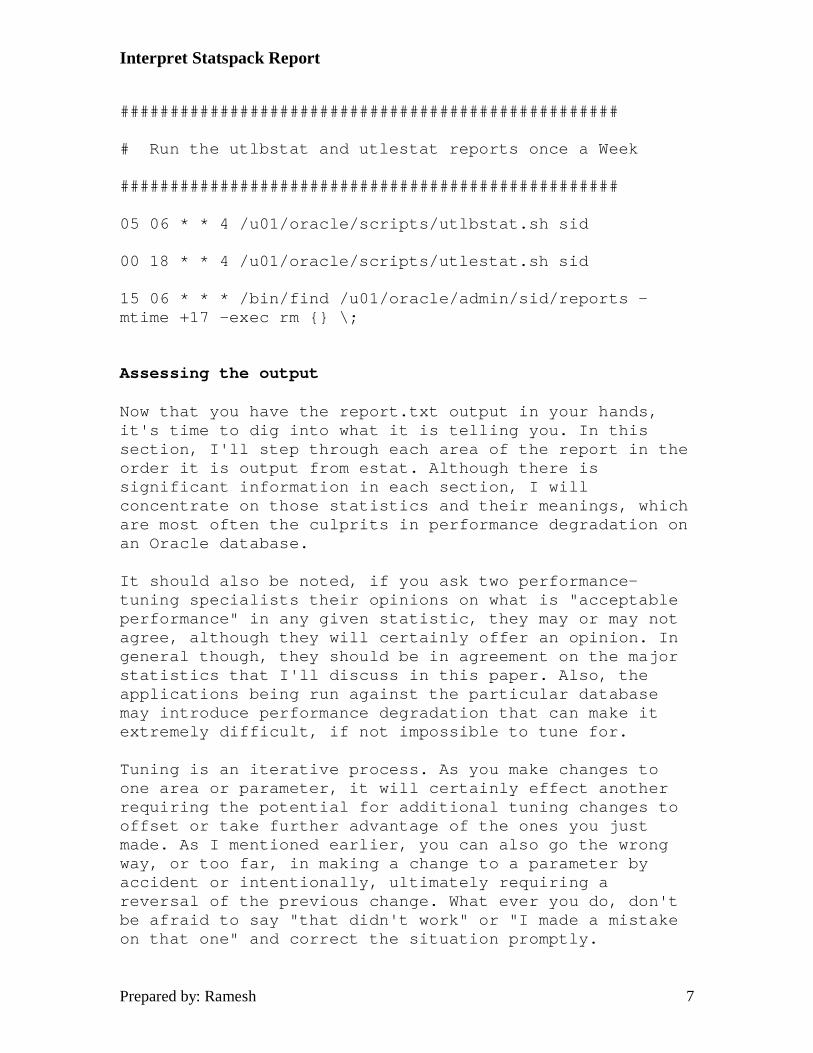
##################################################
# Run the utlbstat and utlestat reports once a Week
##################################################
05 06 * * 4 /u01/oracle/scripts/utlbstat.sh sid
00 18 * * 4 /u01/oracle/scripts/utlestat.sh sid
15 06 * * * /bin/find /u01/oracle/admin/sid/reports -mtime +17 -exec rm {} \;
Assessing the output Now that you have the report.txt output in your hands, it's time to dig into what it is telling you. In this section, I'll step through each area of the report in the order it is output from estat. Although there is significant information in each section, I will concentrate on those statistics and their meanings, which are most often the culprits in performance degradation on an Oracle database. It should also be noted, if you ask two performance-tuning specialists their opinions on what is "acceptable performance" in any given statistic, they may or may not agree, although they will certainly offer an opinion. In general though, they should be in agreement on the major statistics that I'll discuss in this paper. Also, the applications being run against the particular database may introduce performance degradation that can make it extremely difficult, if not impossible to tune for. Tuning is an iterative process. As you make changes to one area or parameter, it will certainly effect another requiring the potential for additional tuning changes to offset or take further advantage of the ones you just made. As I mentioned earlier, you can also go the wrong way, or too far, in making a change to a parameter by accident or intentionally, ultimately requiring a reversal of the previous change. What ever you do, don't be afraid to say "that didn't work" or "I made a mistake on that one" and correct the situation promptly.
Interpret Statspack Report
Prepared by: Ramesh 8
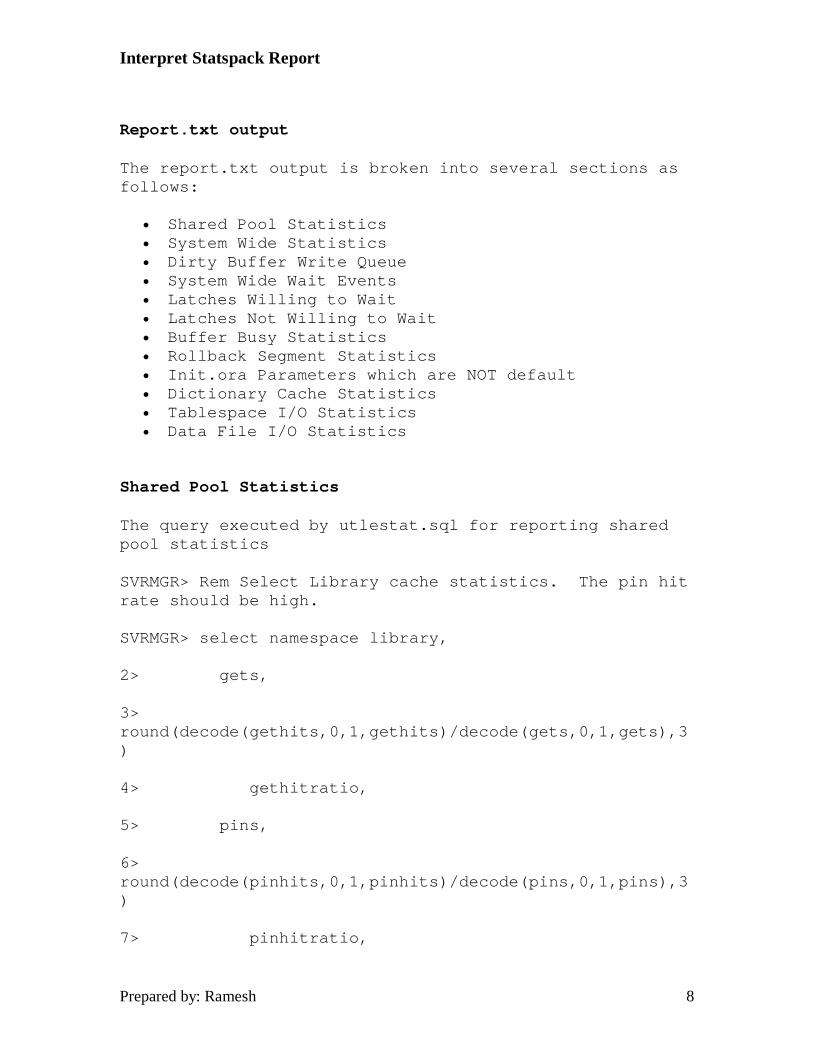
Report.txt output The report.txt output is broken into several sections as follows:
Shared Pool Statistics System Wide Statistics Dirty Buffer Write Queue System Wide Wait Events Latches Willing to Wait Latches Not Willing to Wait Buffer Busy Statistics Rollback Segment Statistics Init.ora Parameters which are NOT default Dictionary Cache Statistics Tablespace I/O Statistics Data File I/O Statistics
Shared Pool Statistics The query executed by utlestat.sql for reporting shared pool statistics
SVRMGR> Rem Select Library cache statistics. The pin hit rate should be high.
SVRMGR> select namespace library,
2> gets,
3> round(decode(gethits,0,1,gethits)/decode(gets,0,1,gets),3)
4> gethitratio,
5> pins,
6> round(decode(pinhits,0,1,pinhits)/decode(pins,0,1,pins),3)
7> pinhitratio,
Interpret Statspack Report
Prepared by: Ramesh 9
8> reloads, invalidations
9> from stats$lib;
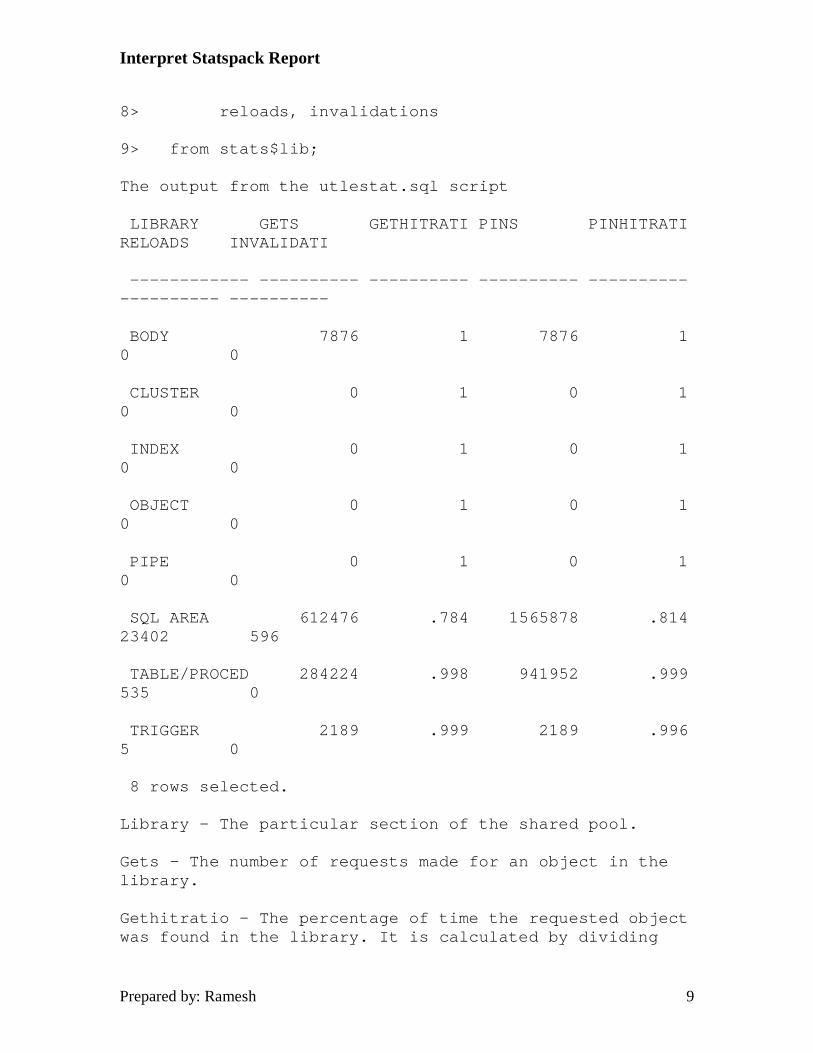
The output from the utlestat.sql script
LIBRARY GETS GETHITRATI PINS PINHITRATI RELOADS INVALIDATI
------------ ---------- ---------- ---------- ---------- ---------- ----------
BODY 7876 1 7876 1 0 0
CLUSTER 0 1 0 1 0 0
INDEX 0 1 0 1 0 0
OBJECT 0 1 0 1 0 0
PIPE 0 1 0 1 0 0
SQL AREA 612476 .784 1565878 .814 23402 596
TABLE/PROCED 284224 .998 941952 .999 535 0
TRIGGER 2189 .999 2189 .996 5 0
8 rows selected.
Library - The particular section of the shared pool. Gets - The number of requests made for an object in the library. Gethitratio - The percentage of time the requested object was found in the library. It is calculated by dividing
Interpret Statspack Report
Prepared by: Ramesh 10
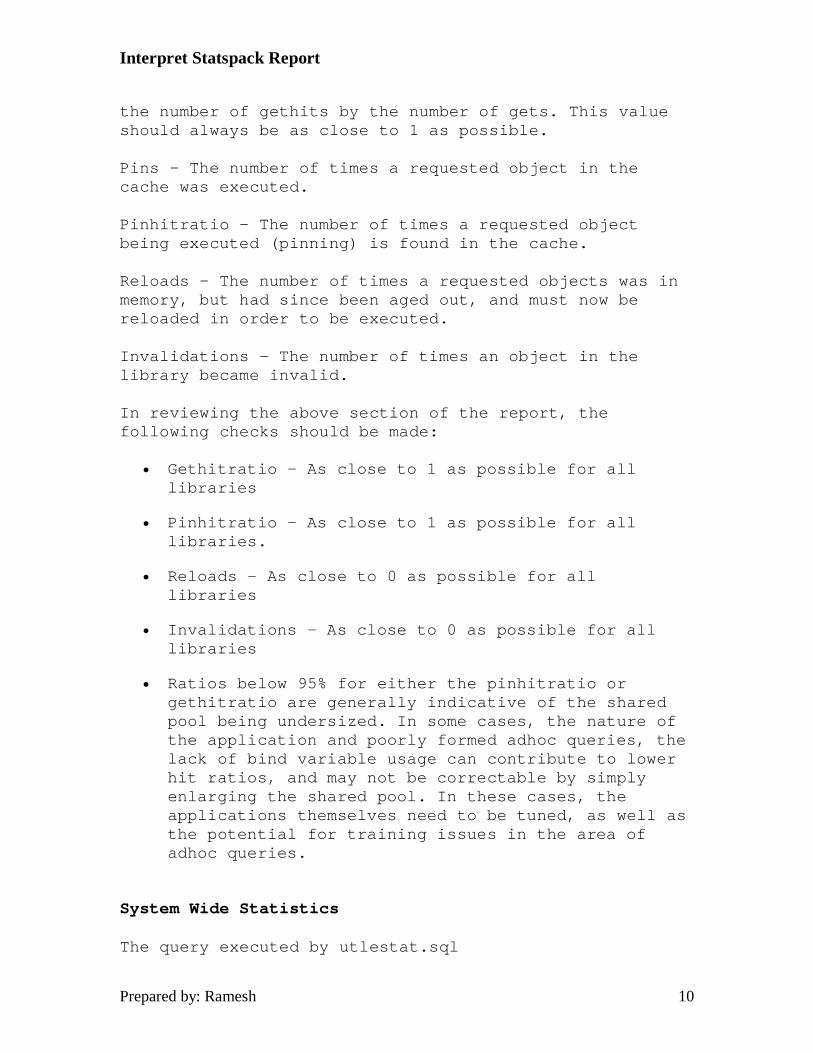
the number of gethits by the number of gets. This value should always be as close to 1 as possible. Pins - The number of times a requested object in the cache was executed. Pinhitratio - The number of times a requested object being executed (pinning) is found in the cache. Reloads - The number of times a requested objects was in memory, but had since been aged out, and must now be reloaded in order to be executed. Invalidations - The number of times an object in the library became invalid. In reviewing the above section of the report, the following checks should be made:
Gethitratio - As close to 1 as possible for all libraries
Pinhitratio - As close to 1 as possible for all libraries.
Reloads - As close to 0 as possible for all libraries
Invalidations - As close to 0 as possible for all libraries
Ratios below 95% for either the pinhitratio or gethitratio are generally indicative of the shared pool being undersized. In some cases, the nature of the application and poorly formed adhoc queries, the lack of bind variable usage can contribute to lower hit ratios, and may not be correctable by simply enlarging the shared pool. In these cases, the applications themselves need to be tuned, as well as the potential for training issues in the area of adhoc queries.
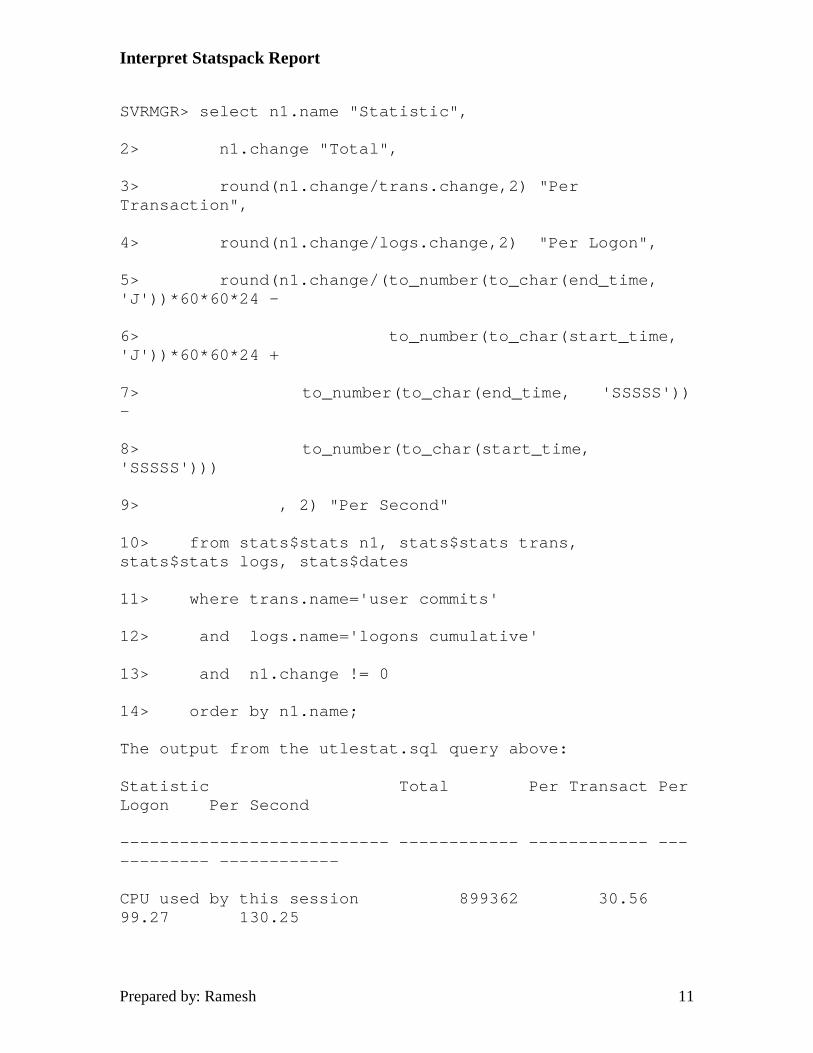
System Wide Statistics The query executed by utlestat.sql
Interpret Statspack Report
Prepared by: Ramesh 11
SVRMGR> select n1.name "Statistic",
2> n1.change "Total",
3> round(n1.change/trans.change,2) "Per Transaction",
4> round(n1.change/logs.change,2) "Per Logon",
5> round(n1.change/(to_number(to_char(end_time, 'J'))*60*60*24 -
6> to_number(to_char(start_time, 'J'))*60*60*24 +
7> to_number(to_char(end_time, 'SSSSS')) -
8> to_number(to_char(start_time, 'SSSSS')))
9> , 2) "Per Second"
10> from stats$stats n1, stats$stats trans, stats$stats logs, stats$dates
11> where trans.name='user commits'
12> and logs.name='logons cumulative'
13> and n1.change != 0
14> order by n1.name;
The output from the utlestat.sql query above:
Statistic Total Per Transact Per Logon Per Second
--------------------------- ------------ ------------ ------------ ------------
CPU used by this session 899362 30.56 99.27 130.25
Interpret Statspack Report
Prepared by: Ramesh 12
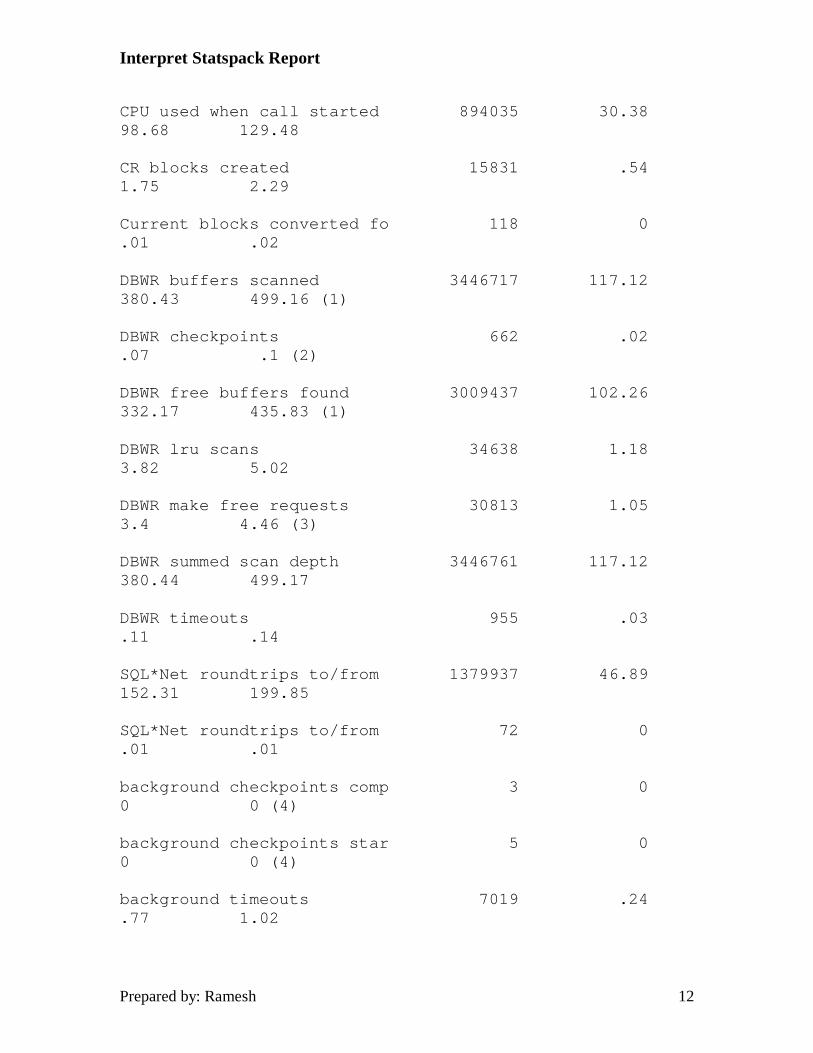
CPU used when call started 894035 30.38 98.68 129.48
CR blocks created 15831 .54 1.75 2.29
Current blocks converted fo 118 0 .01 .02
DBWR buffers scanned 3446717 117.12 380.43 499.16 (1)
DBWR checkpoints 662 .02 .07 .1 (2)
DBWR free buffers found 3009437 102.26 332.17 435.83 (1)
DBWR lru scans 34638 1.18 3.82 5.02
DBWR make free requests 30813 1.05 3.4 4.46 (3)
DBWR summed scan depth 3446761 117.12 380.44 499.17
DBWR timeouts 955 .03 .11 .14
SQL*Net roundtrips to/from 1379937 46.89 152.31 199.85
SQL*Net roundtrips to/from 72 0 .01 .01
background checkpoints comp 3 0 0 0 (4)
background checkpoints star 5 0 0 0 (4)
background timeouts 7019 .24 .77 1.02
Interpret Statspack Report
Prepared by: Ramesh 13
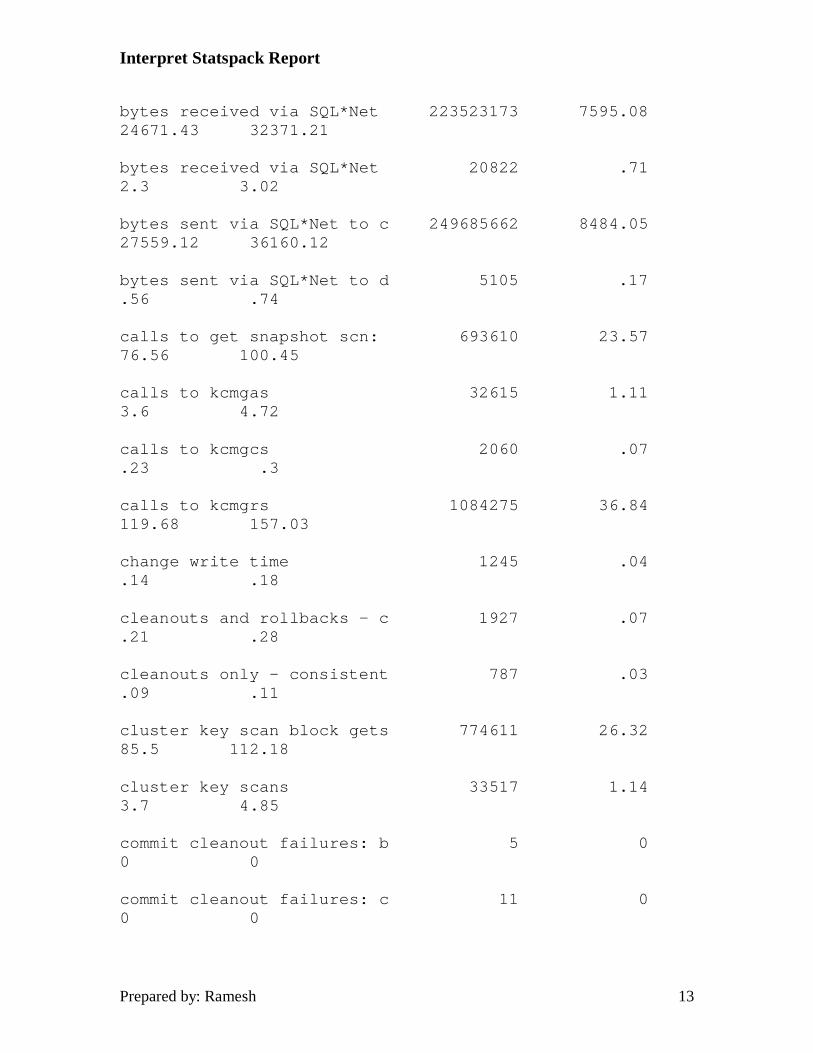
bytes received via SQL*Net 223523173 7595.08 24671.43 32371.21
bytes received via SQL*Net 20822 .71 2.3 3.02
bytes sent via SQL*Net to c 249685662 8484.05 27559.12 36160.12
bytes sent via SQL*Net to d 5105 .17 .56 .74
calls to get snapshot scn: 693610 23.57 76.56 100.45
calls to kcmgas 32615 1.11 3.6 4.72
calls to kcmgcs 2060 .07 .23 .3
calls to kcmgrs 1084275 36.84 119.68 157.03
change write time 1245 .04 .14 .18
cleanouts and rollbacks - c 1927 .07 .21 .28
cleanouts only - consistent 787 .03 .09 .11
cluster key scan block gets 774611 26.32 85.5 112.18
cluster key scans 33517 1.14 3.7 4.85
commit cleanout failures: b 5 0 0 0
commit cleanout failures: c 11 0 0 0
Interpret Statspack Report
Prepared by: Ramesh 14
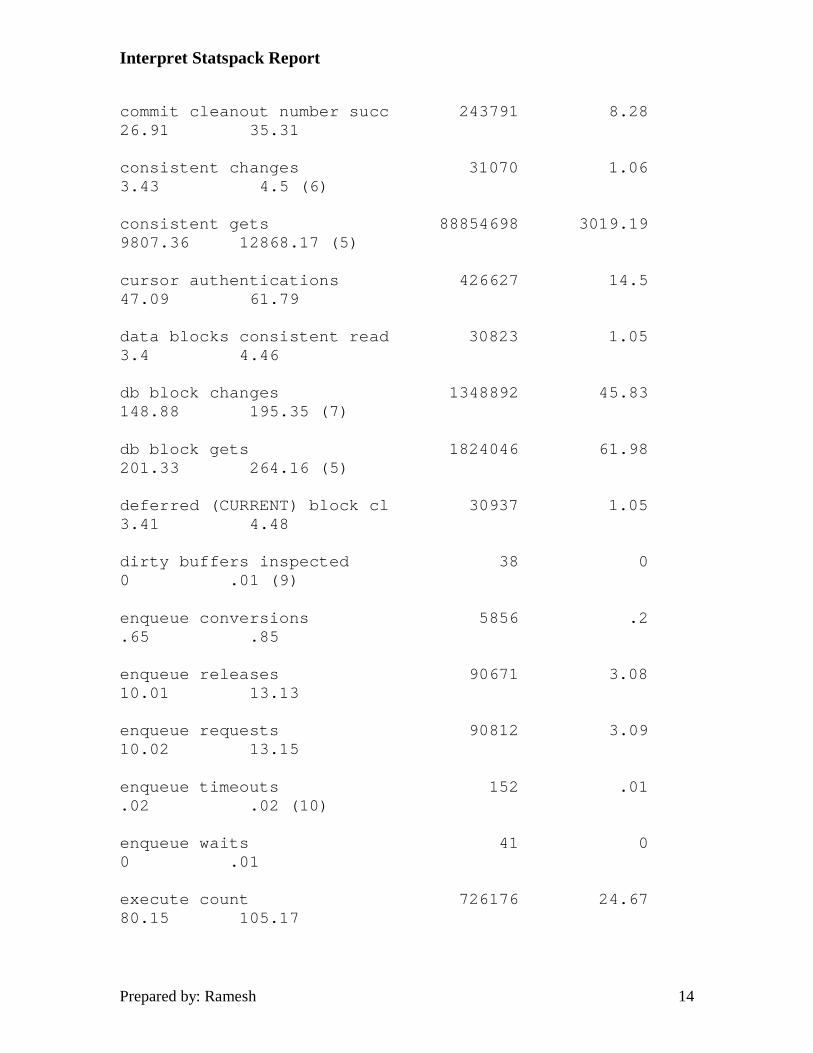
commit cleanout number succ 243791 8.28 26.91 35.31
consistent changes 31070 1.06 3.43 4.5 (6)
consistent gets 88854698 3019.19 9807.36 12868.17 (5)
cursor authentications 426627 14.5 47.09 61.79
data blocks consistent read 30823 1.05 3.4 4.46
db block changes 1348892 45.83 148.88 195.35 (7)
db block gets 1824046 61.98 201.33 264.16 (5)
deferred (CURRENT) block cl 30937 1.05 3.41 4.48
dirty buffers inspected 38 0 0 .01 (9)
enqueue conversions 5856 .2 .65 .85
enqueue releases 90671 3.08 10.01 13.13
enqueue requests 90812 3.09 10.02 13.15
enqueue timeouts 152 .01 .02 .02 (10)
enqueue waits 41 0 0 .01
execute count 726176 24.67 80.15 105.17
Interpret Statspack Report
Prepared by: Ramesh 15
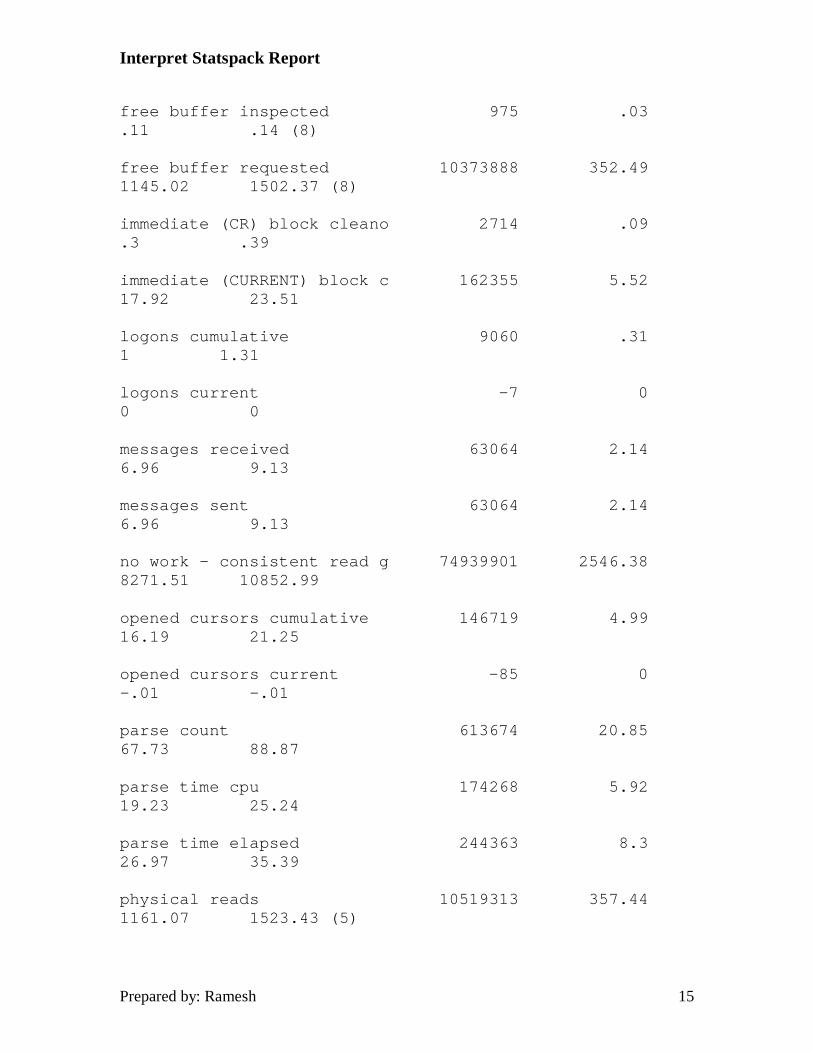
free buffer inspected 975 .03 .11 .14 (8)
free buffer requested 10373888 352.49 1145.02 1502.37 (8)
immediate (CR) block cleano 2714 .09 .3 .39
immediate (CURRENT) block c 162355 5.52 17.92 23.51
logons cumulative 9060 .31 1 1.31
logons current -7 0 0 0
messages received 63064 2.14 6.96 9.13
messages sent 63064 2.14 6.96 9.13
no work - consistent read g 74939901 2546.38 8271.51 10852.99
opened cursors cumulative 146719 4.99 16.19 21.25
opened cursors current -85 0 -.01 -.01
parse count 613674 20.85 67.73 88.87
parse time cpu 174268 5.92 19.23 25.24
parse time elapsed 244363 8.3 26.97 35.39
physical reads 10519313 357.44 1161.07 1523.43 (5)
Interpret Statspack Report
Prepared by: Ramesh 16
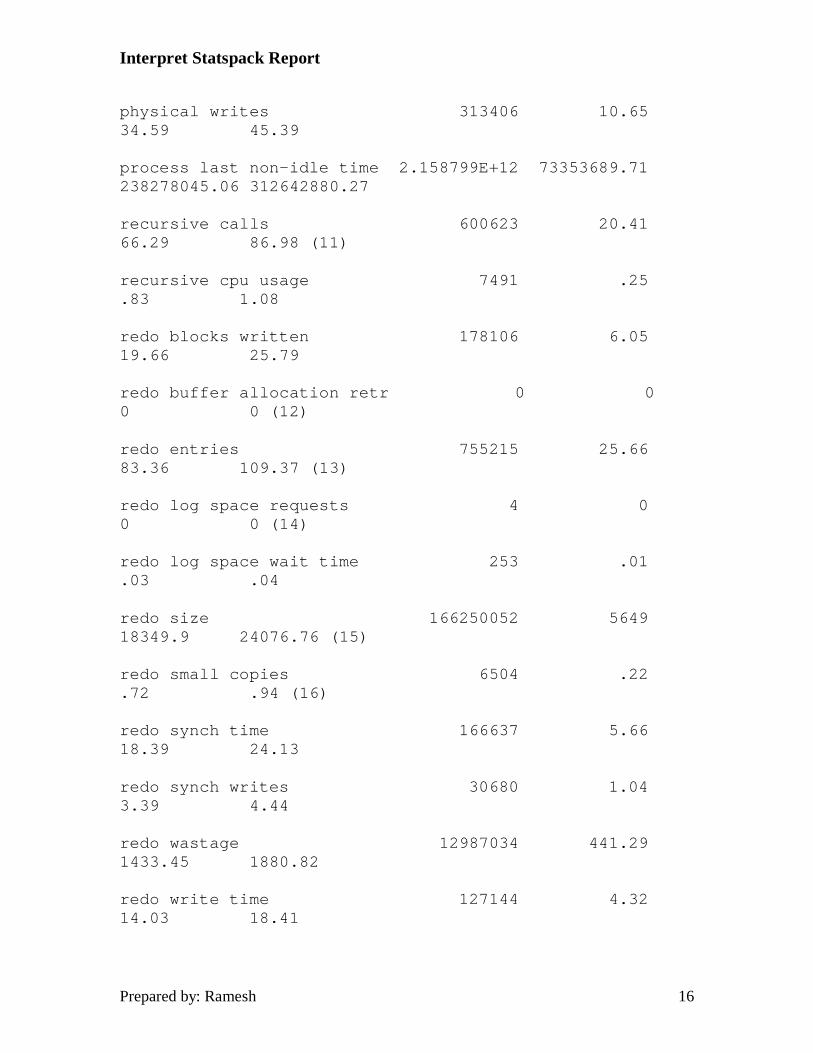
physical writes 313406 10.65 34.59 45.39
process last non-idle time 2.158799E+12 73353689.71 238278045.06 312642880.27
recursive calls 600623 20.41 66.29 86.98 (11)
recursive cpu usage 7491 .25 .83 1.08
redo blocks written 178106 6.05 19.66 25.79
redo buffer allocation retr 0 0 0 0 (12)
redo entries 755215 25.66 83.36 109.37 (13)
redo log space requests 4 0 0 0 (14)
redo log space wait time 253 .01 .03 .04
redo size 166250052 5649 18349.9 24076.76 (15)
redo small copies 6504 .22 .72 .94 (16)
redo synch time 166637 5.66 18.39 24.13
redo synch writes 30680 1.04 3.39 4.44
redo wastage 12987034 441.29 1433.45 1880.82
redo write time 127144 4.32 14.03 18.41
Interpret Statspack Report
Prepared by: Ramesh 17
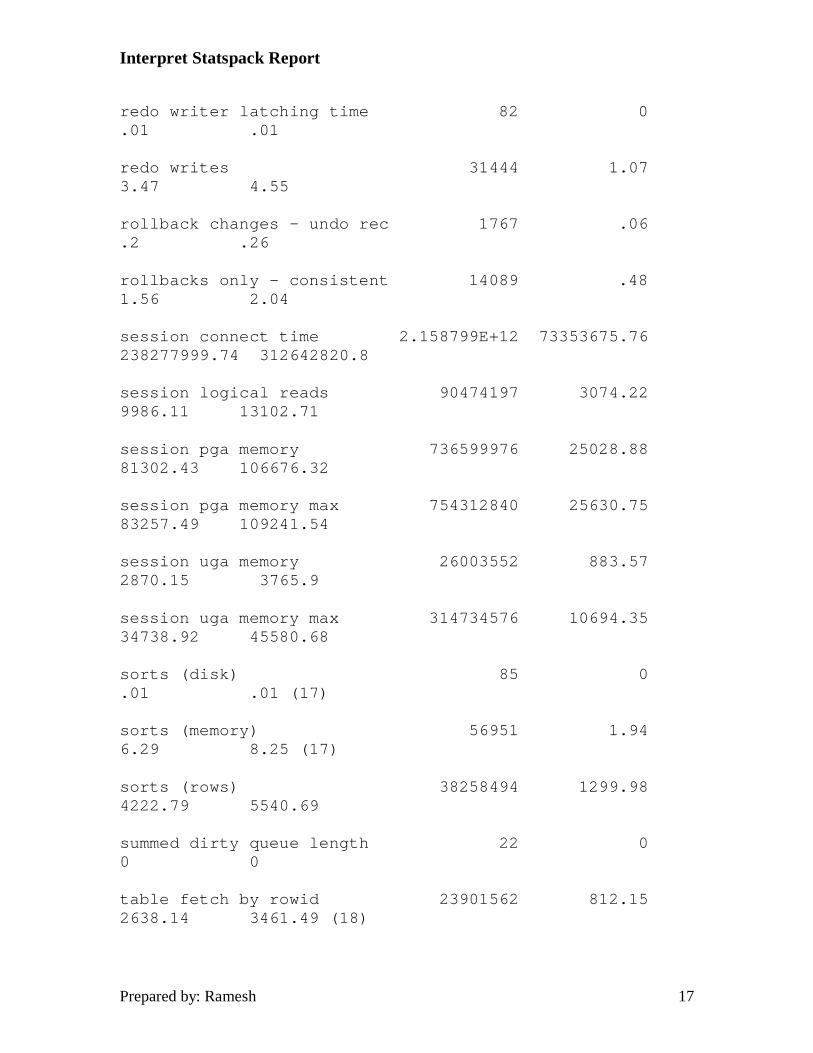
redo writer latching time 82 0 .01 .01
redo writes 31444 1.07 3.47 4.55
rollback changes - undo rec 1767 .06 .2 .26
rollbacks only - consistent 14089 .48 1.56 2.04
session connect time 2.158799E+12 73353675.76 238277999.74 312642820.8
session logical reads 90474197 3074.22 9986.11 13102.71
session pga memory 736599976 25028.88 81302.43 106676.32
session pga memory max 754312840 25630.75 83257.49 109241.54
session uga memory 26003552 883.57 2870.15 3765.9
session uga memory max 314734576 10694.35 34738.92 45580.68
sorts (disk) 85 0 .01 .01 (17)
sorts (memory) 56951 1.94 6.29 8.25 (17)
sorts (rows) 38258494 1299.98 4222.79 5540.69
summed dirty queue length 22 0 0 0
table fetch by rowid 23901562 812.15 2638.14 3461.49 (18)
Interpret Statspack Report
Prepared by: Ramesh 18
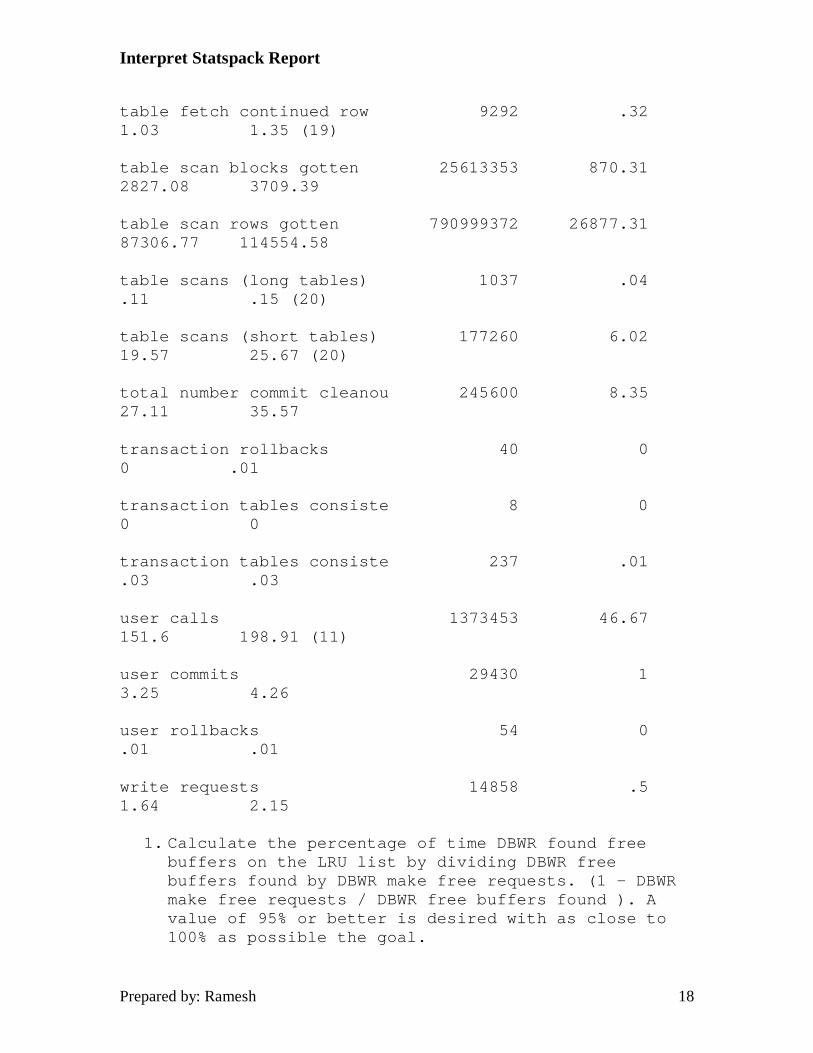
table fetch continued row 9292 .32 1.03 1.35 (19)
table scan blocks gotten 25613353 870.31 2827.08 3709.39
table scan rows gotten 790999372 26877.31 87306.77 114554.58
table scans (long tables) 1037 .04 .11 .15 (20)
table scans (short tables) 177260 6.02 19.57 25.67 (20)
total number commit cleanou 245600 8.35 27.11 35.57
transaction rollbacks 40 0 0 .01
transaction tables consiste 8 0 0 0
transaction tables consiste 237 .01 .03 .03
user calls 1373453 46.67 151.6 198.91 (11)
user commits 29430 1 3.25 4.26
user rollbacks 54 0 .01 .01
write requests 14858 .5 1.64 2.15
1. Calculate the percentage of time DBWR found free buffers on the LRU list by dividing DBWR free buffers found by DBWR make free requests. (1 - DBWR make free requests / DBWR free buffers found ). A value of 95% or better is desired with as close to 100% as possible the goal.
Interpret Statspack Report
Prepared by: Ramesh 19
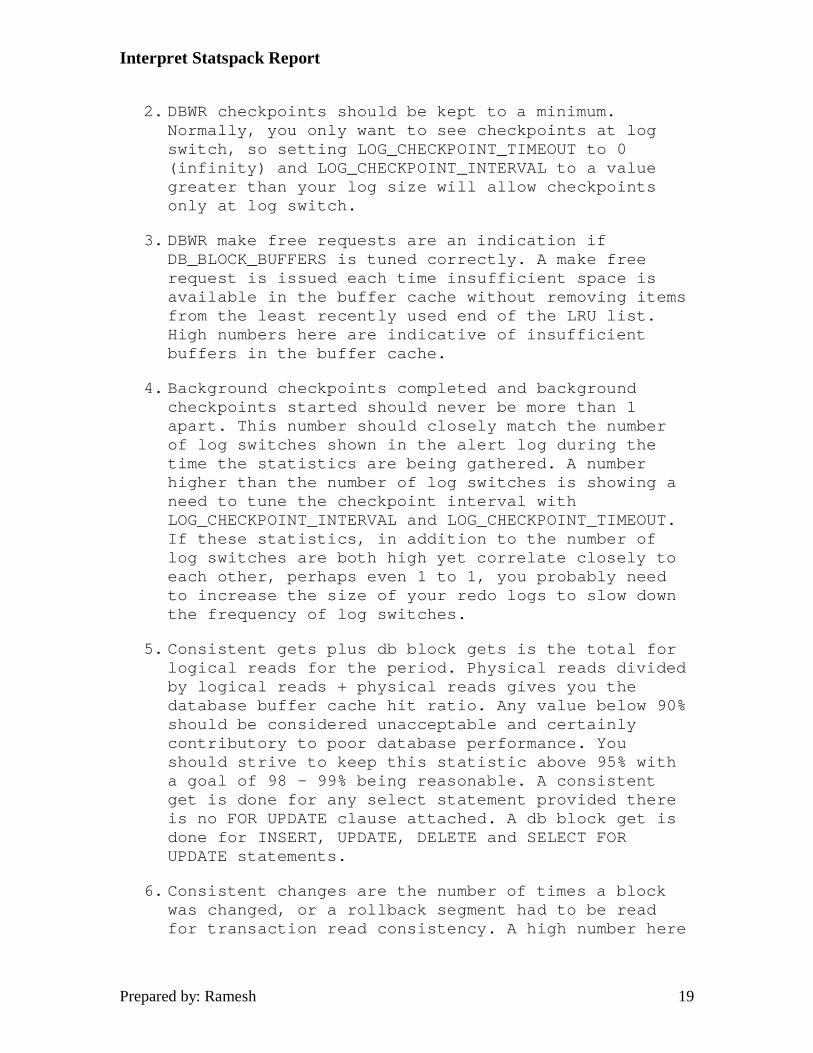
2. DBWR checkpoints should be kept to a minimum. Normally, you only want to see checkpoints at log switch, so setting LOG_CHECKPOINT_TIMEOUT to 0 (infinity) and LOG_CHECKPOINT_INTERVAL to a value greater than your log size will allow checkpoints only at log switch.
3. DBWR make free requests are an indication if DB_BLOCK_BUFFERS is tuned correctly. A make free request is issued each time insufficient space is available in the buffer cache without removing items from the least recently used end of the LRU list. High numbers here are indicative of insufficient buffers in the buffer cache.
4. Background checkpoints completed and background checkpoints started should never be more than 1 apart. This number should closely match the number of log switches shown in the alert log during the time the statistics are being gathered. A number higher than the number of log switches is showing a need to tune the checkpoint interval with LOG_CHECKPOINT_INTERVAL and LOG_CHECKPOINT_TIMEOUT. If these statistics, in addition to the number of log switches are both high yet correlate closely to each other, perhaps even 1 to 1, you probably need to increase the size of your redo logs to slow down the frequency of log switches.
5. Consistent gets plus db block gets is the total for logical reads for the period. Physical reads divided by logical reads + physical reads gives you the database buffer cache hit ratio. Any value below 90% should be considered unacceptable and certainly contributory to poor database performance. You should strive to keep this statistic above 95% with a goal of 98 - 99% being reasonable. A consistent get is done for any select statement provided there is no FOR UPDATE clause attached. A db block get is done for INSERT, UPDATE, DELETE and SELECT FOR UPDATE statements.
6. Consistent changes are the number of times a block was changed, or a rollback segment had to be read for transaction read consistency. A high number here
Interpret Statspack Report
Prepared by: Ramesh 20
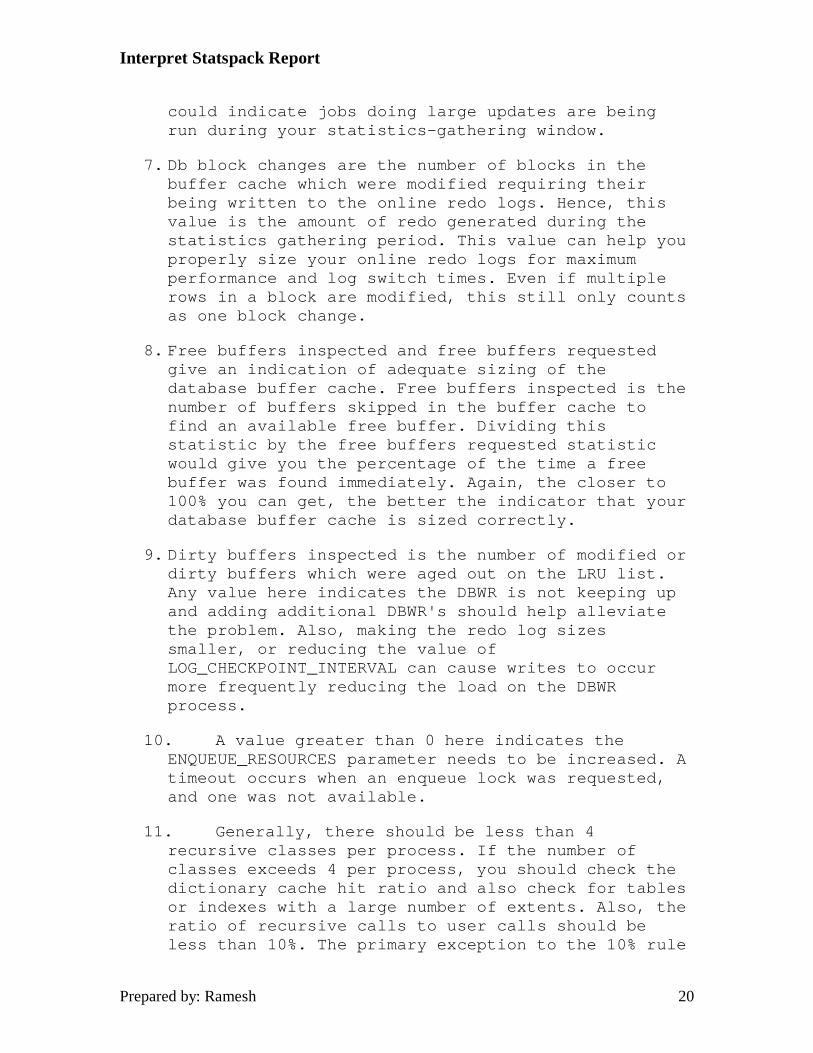
could indicate jobs doing large updates are being run during your statistics-gathering window.
7. Db block changes are the number of blocks in the buffer cache which were modified requiring their being written to the online redo logs. Hence, this value is the amount of redo generated during the statistics gathering period. This value can help you properly size your online redo logs for maximum performance and log switch times. Even if multiple rows in a block are modified, this still only counts as one block change.
8. Free buffers inspected and free buffers requested give an indication of adequate sizing of the database buffer cache. Free buffers inspected is the number of buffers skipped in the buffer cache to find an available free buffer. Dividing this statistic by the free buffers requested statistic would give you the percentage of the time a free buffer was found immediately. Again, the closer to 100% you can get, the better the indicator that your database buffer cache is sized correctly.
9. Dirty buffers inspected is the number of modified or dirty buffers which were aged out on the LRU list. Any value here indicates the DBWR is not keeping up and adding additional DBWR's should help alleviate the problem. Also, making the redo log sizes smaller, or reducing the value of LOG_CHECKPOINT_INTERVAL can cause writes to occur more frequently reducing the load on the DBWR process.
10. A value greater than 0 here indicates the ENQUEUE_RESOURCES parameter needs to be increased. A timeout occurs when an enqueue lock was requested, and one was not available.
11. Generally, there should be less than 4 recursive classes per process. If the number of classes exceeds 4 per process, you should check the dictionary cache hit ratio and also check for tables or indexes with a large number of extents. Also, the ratio of recursive calls to user calls should be less than 10%. The primary exception to the 10% rule
Interpret Statspack Report
Prepared by: Ramesh 21
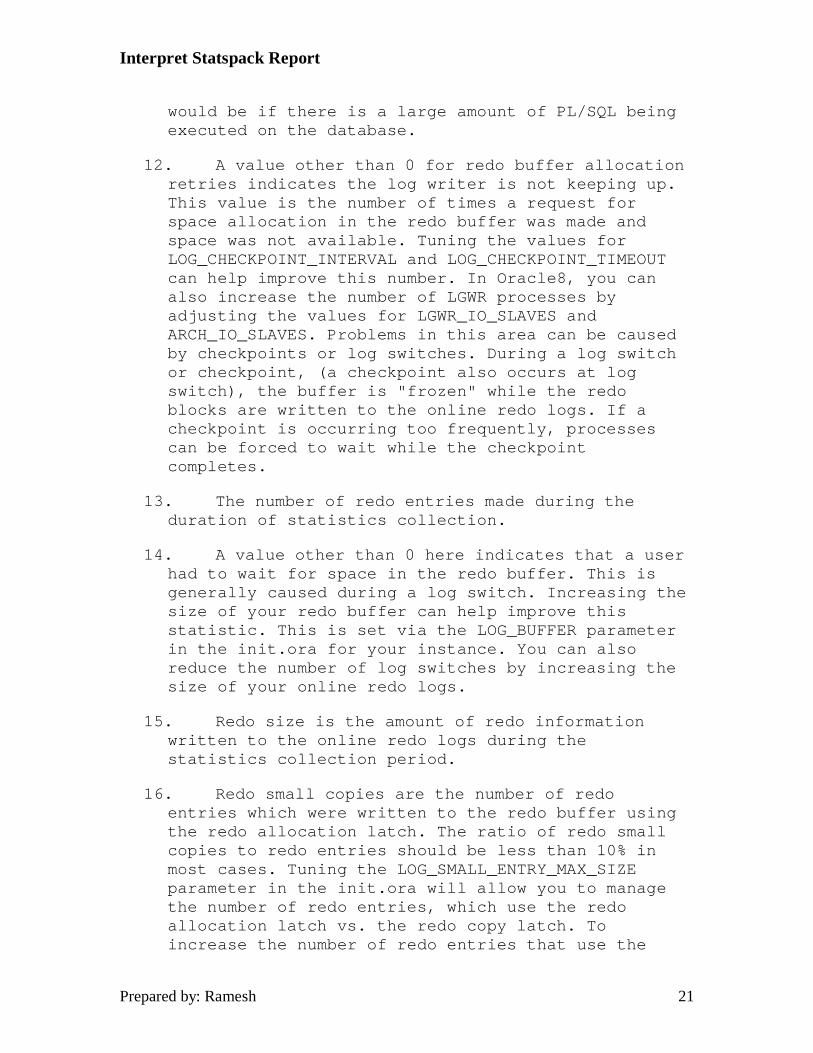
would be if there is a large amount of PL/SQL being executed on the database.
12. A value other than 0 for redo buffer allocation retries indicates the log writer is not keeping up. This value is the number of times a request for space allocation in the redo buffer was made and space was not available. Tuning the values for LOG_CHECKPOINT_INTERVAL and LOG_CHECKPOINT_TIMEOUT can help improve this number. In Oracle8, you can also increase the number of LGWR processes by adjusting the values for LGWR_IO_SLAVES and ARCH_IO_SLAVES. Problems in this area can be caused by checkpoints or log switches. During a log switch or checkpoint, (a checkpoint also occurs at log switch), the buffer is "frozen" while the redo blocks are written to the online redo logs. If a checkpoint is occurring too frequently, processes can be forced to wait while the checkpoint completes.
13. The number of redo entries made during the duration of statistics collection.
14. A value other than 0 here indicates that a user had to wait for space in the redo buffer. This is generally caused during a log switch. Increasing the size of your redo buffer can help improve this statistic. This is set via the LOG_BUFFER parameter in the init.ora for your instance. You can also reduce the number of log switches by increasing the size of your online redo logs.
15. Redo size is the amount of redo information written to the online redo logs during the statistics collection period.
16. Redo small copies are the number of redo entries which were written to the redo buffer using the redo allocation latch. The ratio of redo small copies to redo entries should be less than 10% in most cases. Tuning the LOG_SMALL_ENTRY_MAX_SIZE parameter in the init.ora will allow you to manage the number of redo entries, which use the redo allocation latch vs. the redo copy latch. To increase the number of redo entries that use the
Interpret Statspack Report
Prepared by: Ramesh 22
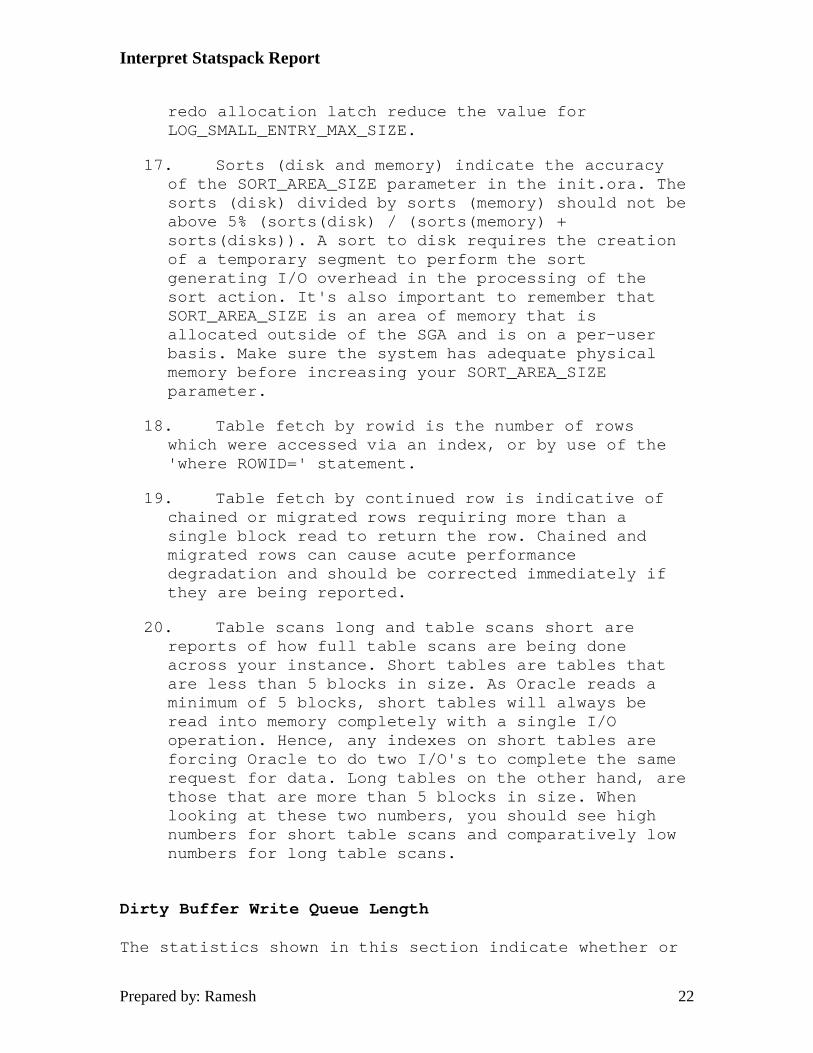
redo allocation latch reduce the value for LOG_SMALL_ENTRY_MAX_SIZE.
17. Sorts (disk and memory) indicate the accuracy of the SORT_AREA_SIZE parameter in the init.ora. The sorts (disk) divided by sorts (memory) should not be above 5% (sorts(disk) / (sorts(memory) + sorts(disks)). A sort to disk requires the creation of a temporary segment to perform the sort generating I/O overhead in the processing of the sort action. It's also important to remember that SORT_AREA_SIZE is an area of memory that is allocated outside of the SGA and is on a per-user basis. Make sure the system has adequate physical memory before increasing your SORT_AREA_SIZE parameter.
18. Table fetch by rowid is the number of rows which were accessed via an index, or by use of the 'where ROWID=' statement.
19. Table fetch by continued row is indicative of chained or migrated rows requiring more than a single block read to return the row. Chained and migrated rows can cause acute performance degradation and should be corrected immediately if they are being reported.
20. Table scans long and table scans short are reports of how full table scans are being done across your instance. Short tables are tables that are less than 5 blocks in size. As Oracle reads a minimum of 5 blocks, short tables will always be read into memory completely with a single I/O operation. Hence, any indexes on short tables are forcing Oracle to do two I/O's to complete the same request for data. Long tables on the other hand, are those that are more than 5 blocks in size. When looking at these two numbers, you should see high numbers for short table scans and comparatively low numbers for long table scans.
Dirty Buffer Write Queue Length The statistics shown in this section indicate whether or
Interpret Statspack Report
Prepared by: Ramesh 23
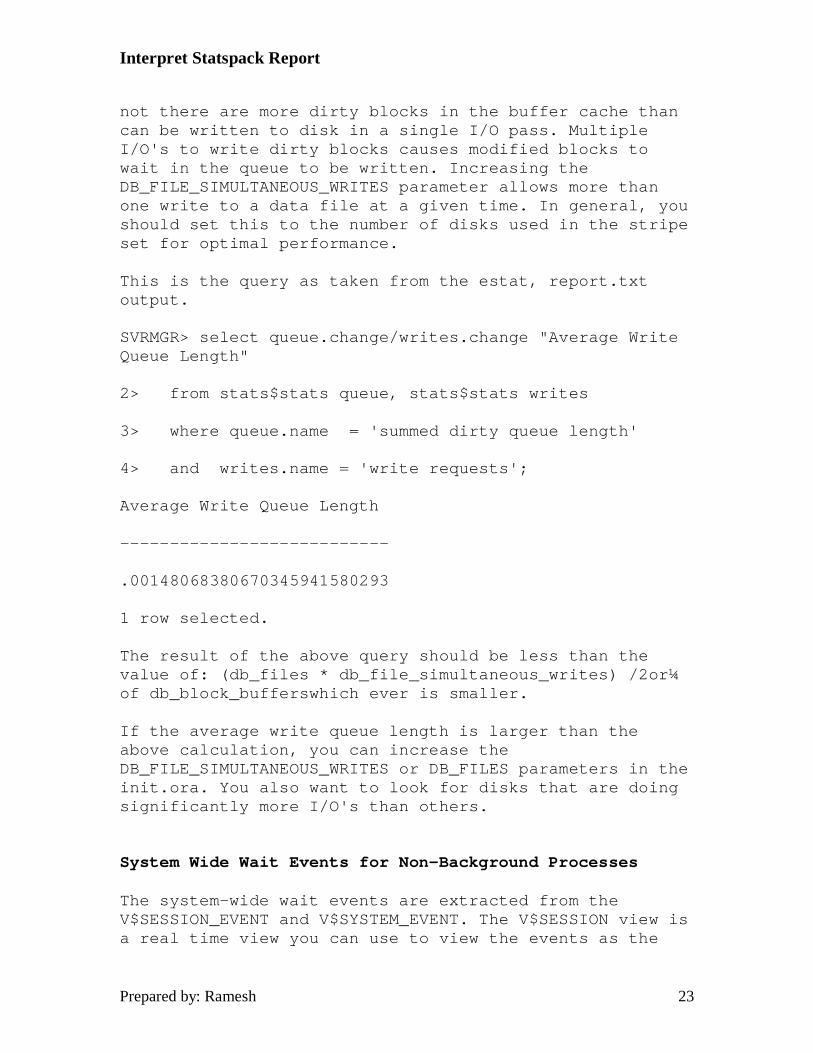
not there are more dirty blocks in the buffer cache than can be written to disk in a single I/O pass. Multiple I/O's to write dirty blocks causes modified blocks to wait in the queue to be written. Increasing the DB_FILE_SIMULTANEOUS_WRITES parameter allows more than one write to a data file at a given time. In general, you should set this to the number of disks used in the stripe set for optimal performance. This is the query as taken from the estat, report.txt output.
SVRMGR> select queue.change/writes.change "Average Write Queue Length"
2> from stats$stats queue, stats$stats writes
3> where queue.name = 'summed dirty queue length'
4> and writes.name = 'write requests';
Average Write Queue Length
---------------------------
.00148068380670345941580293
1 row selected.
The result of the above query should be less than the value of: (db_files * db_file_simultaneous_writes) /2or¼ of db_block_bufferswhich ever is smaller. If the average write queue length is larger than the above calculation, you can increase the DB_FILE_SIMULTANEOUS_WRITES or DB_FILES parameters in the init.ora. You also want to look for disks that are doing significantly more I/O's than others. System Wide Wait Events for Non-Background Processes The system-wide wait events are extracted from the V$SESSION_EVENT and V$SYSTEM_EVENT. The V$SESSION view is a real time view you can use to view the events as the
Interpret Statspack Report
Prepared by: Ramesh 24
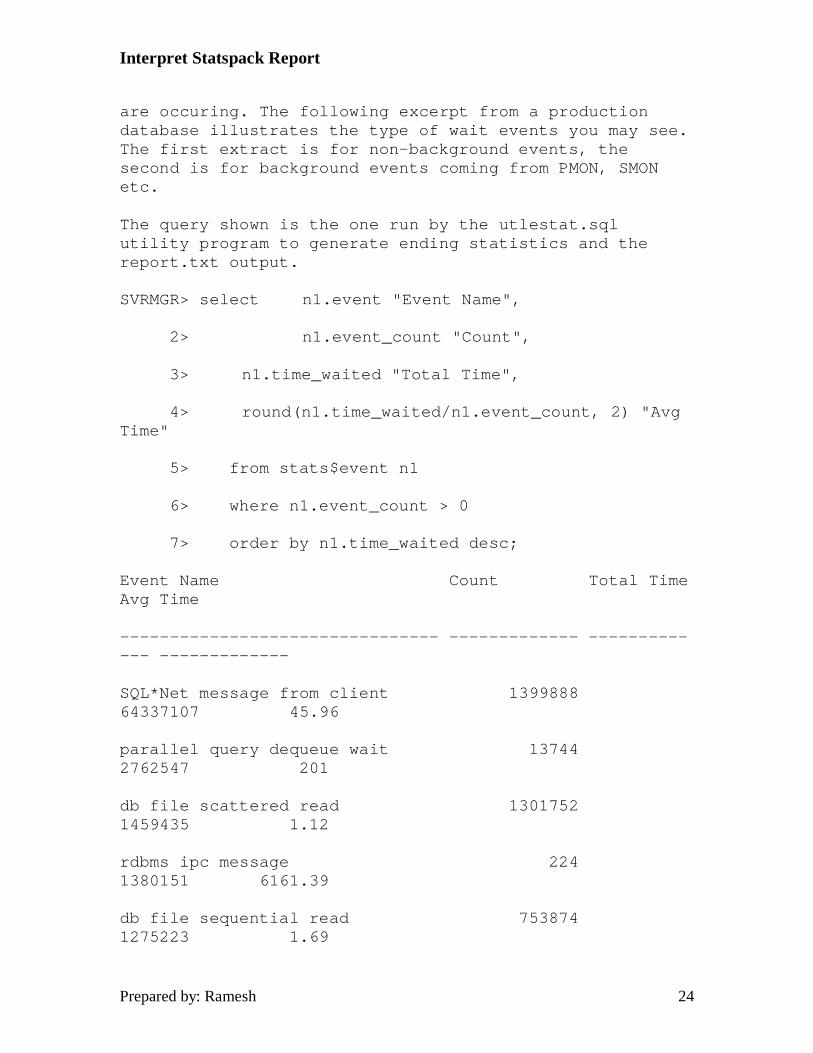
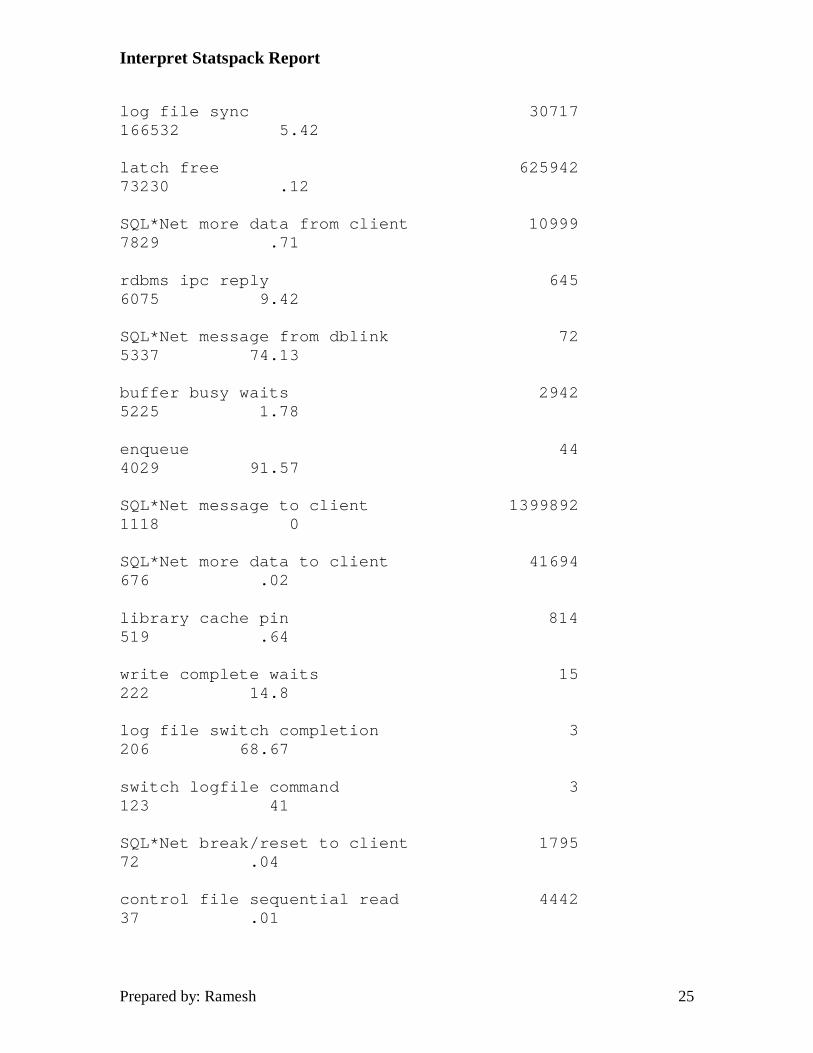
are occuring. The following excerpt from a production database illustrates the type of wait events you may see. The first extract is for non-background events, the second is for background events coming from PMON, SMON etc. The query shown is the one run by the utlestat.sql utility program to generate ending statistics and the report.txt output.
SVRMGR> select n1.event "Event Name",
2> n1.event_count "Count",
3> n1.time_waited "Total Time",
4> round(n1.time_waited/n1.event_count, 2) "Avg Time"
5> from stats$event n1
6> where n1.event_count > 0
7> order by n1.time_waited desc;
Event Name Count Total Time Avg Time
-------------------------------- ------------- ------------- -------------
SQL*Net message from client 1399888 64337107 45.96
parallel query dequeue wait 13744 2762547 201
db file scattered read 1301752 1459435 1.12
rdbms ipc message 224 1380151 6161.39
db file sequential read 753874 1275223 1.69
Interpret Statspack Report
Prepared by: Ramesh 25
log file sync 30717 166532 5.42
latch free 625942 73230 .12
SQL*Net more data from client 10999 7829 .71
rdbms ipc reply 645 6075 9.42
SQL*Net message from dblink 72 5337 74.13
buffer busy waits 2942 5225 1.78
enqueue 44 4029 91.57
SQL*Net message to client 1399892 1118 0
SQL*Net more data to client 41694 676 .02
library cache pin 814 519 .64
write complete waits 15 222 14.8
log file switch completion 3 206 68.67
switch logfile command 3 123 41
SQL*Net break/reset to client 1795 72 .04
control file sequential read 4442 37 .01
Interpret Statspack Report
Prepared by: Ramesh 26
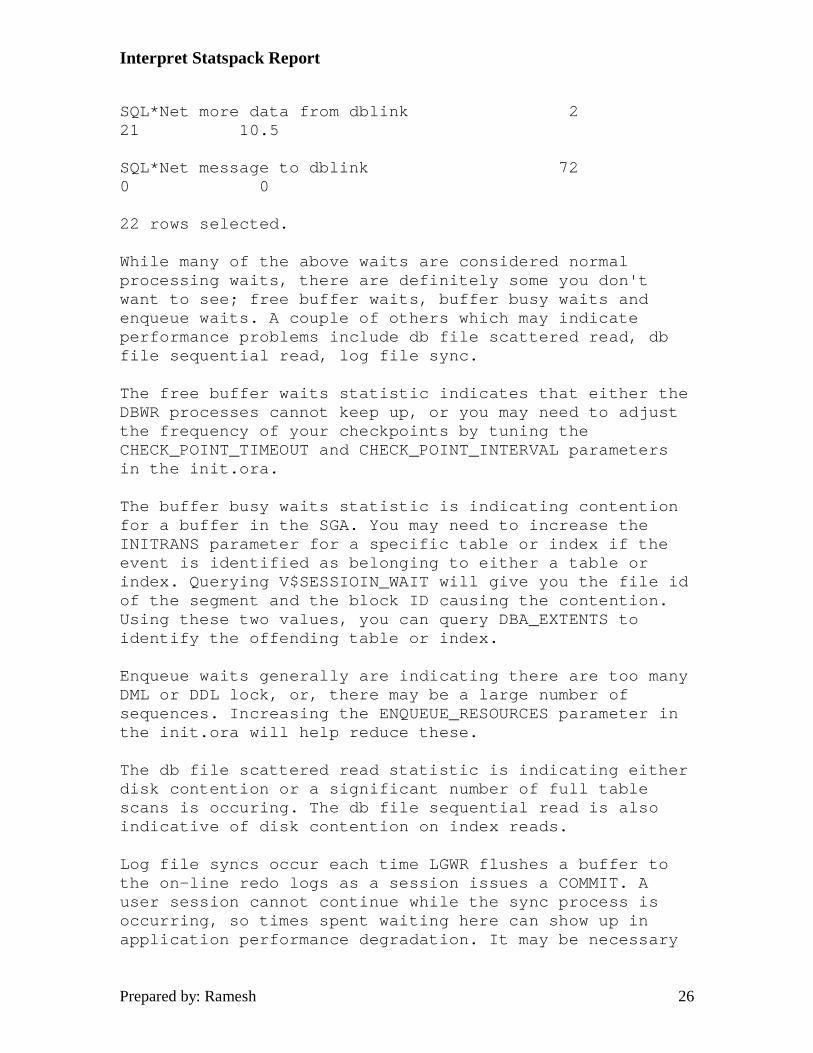
SQL*Net more data from dblink 2 21 10.5
SQL*Net message to dblink 72 0 0
22 rows selected.
While many of the above waits are considered normal processing waits, there are definitely some you don't want to see; free buffer waits, buffer busy waits and enqueue waits. A couple of others which may indicate performance problems include db file scattered read, db file sequential read, log file sync. The free buffer waits statistic indicates that either the DBWR processes cannot keep up, or you may need to adjust the frequency of your checkpoints by tuning the CHECK_POINT_TIMEOUT and CHECK_POINT_INTERVAL parameters in the init.ora. The buffer busy waits statistic is indicating contention for a buffer in the SGA. You may need to increase the INITRANS parameter for a specific table or index if the event is identified as belonging to either a table or index. Querying V$SESSIOIN_WAIT will give you the file id of the segment and the block ID causing the contention. Using these two values, you can query DBA_EXTENTS to identify the offending table or index. Enqueue waits generally are indicating there are too many DML or DDL lock, or, there may be a large number of sequences. Increasing the ENQUEUE_RESOURCES parameter in the init.ora will help reduce these. The db file scattered read statistic is indicating either disk contention or a significant number of full table scans is occuring. The db file sequential read is also indicative of disk contention on index reads. Log file syncs occur each time LGWR flushes a buffer to the on-line redo logs as a session issues a COMMIT. A user session cannot continue while the sync process is occurring, so times spent waiting here can show up in application performance degradation. It may be necessary
Interpret Statspack Report
Prepared by: Ramesh 27
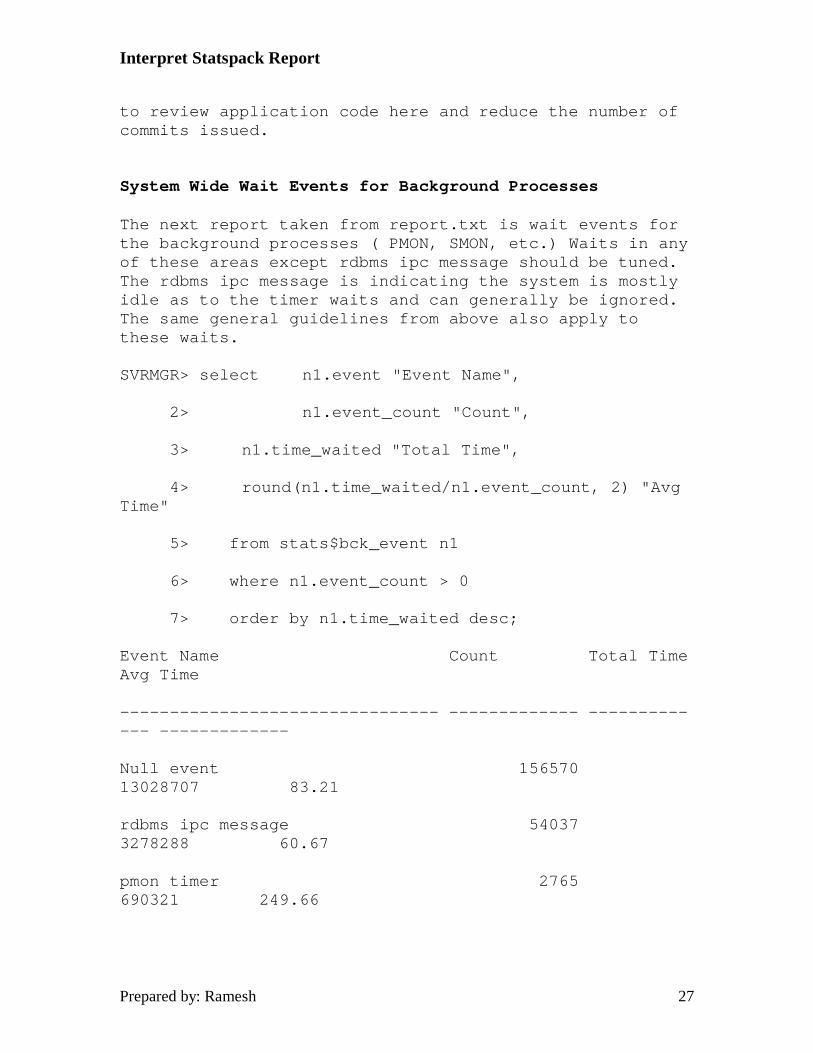
to review application code here and reduce the number of commits issued. System Wide Wait Events for Background Processes The next report taken from report.txt is wait events for the background processes ( PMON, SMON, etc.) Waits in any of these areas except rdbms ipc message should be tuned. The rdbms ipc message is indicating the system is mostly idle as to the timer waits and can generally be ignored. The same general guidelines from above also apply to these waits.
SVRMGR> select n1.event "Event Name",
2> n1.event_count "Count",
3> n1.time_waited "Total Time",
4> round(n1.time_waited/n1.event_count, 2) "Avg Time"
5> from stats$bck_event n1
6> where n1.event_count > 0
7> order by n1.time_waited desc;
Event Name Count Total Time Avg Time
-------------------------------- ------------- ------------- -------------
Null event 156570 13028707 83.21
rdbms ipc message 54037 3278288 60.67
pmon timer 2765 690321 249.66
Interpret Statspack Report
Prepared by: Ramesh 28
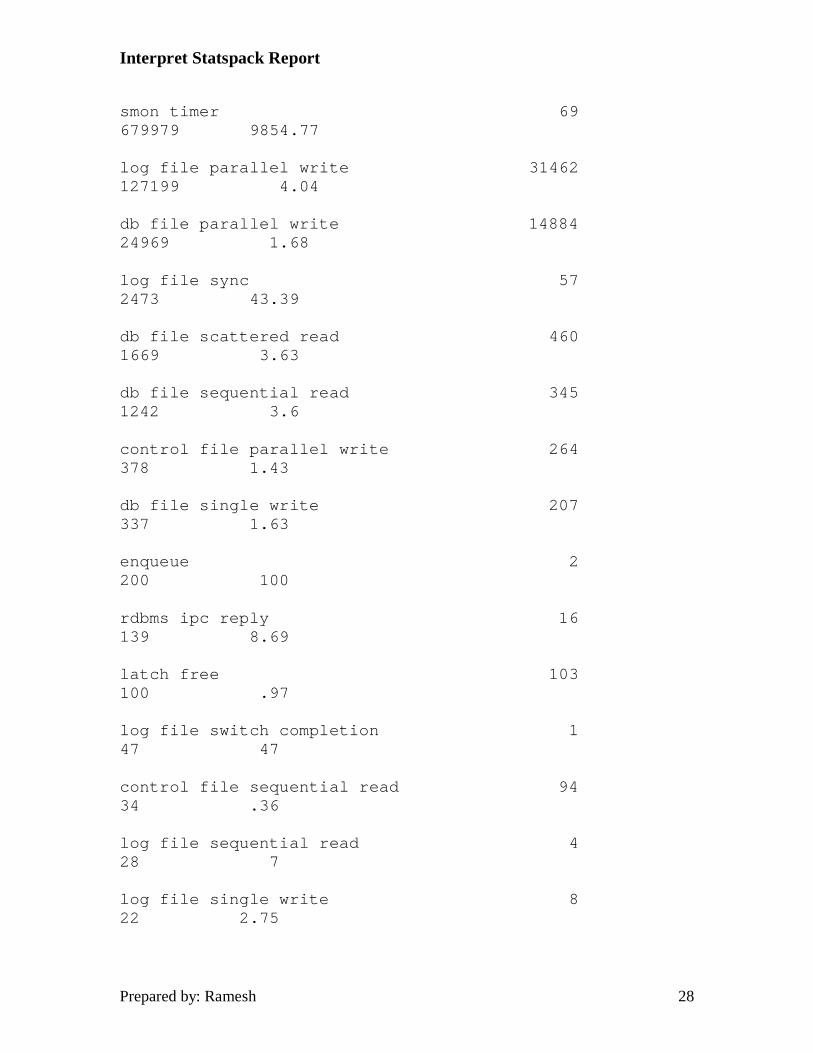
smon timer 69 679979 9854.77
log file parallel write 31462 127199 4.04
db file parallel write 14884 24969 1.68
log file sync 57 2473 43.39
db file scattered read 460 1669 3.63
db file sequential read 345 1242 3.6
control file parallel write 264 378 1.43
db file single write 207 337 1.63
enqueue 2 200 100
rdbms ipc reply 16 139 8.69
latch free 103 100 .97
log file switch completion 1 47 47
control file sequential read 94 34 .36
log file sequential read 4 28 7
log file single write 8 22 2.75
Interpret Statspack Report
Prepared by: Ramesh 29
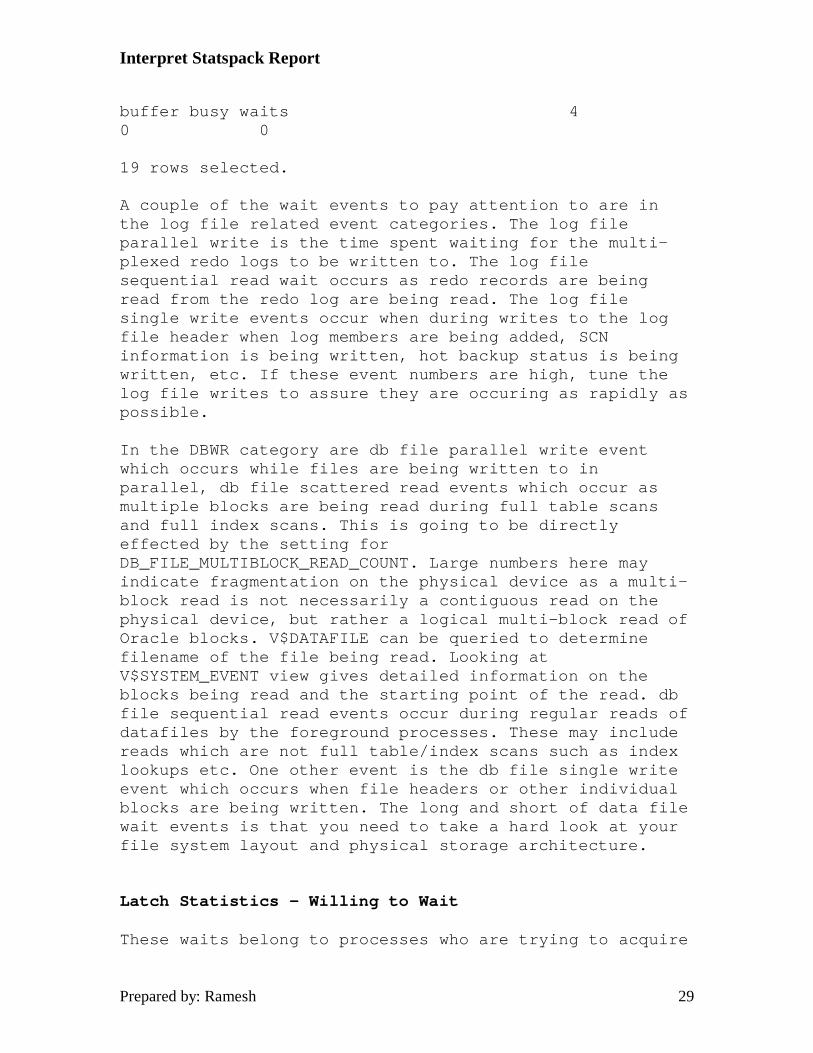
buffer busy waits 4 0 0
19 rows selected.
A couple of the wait events to pay attention to are in the log file related event categories. The log file parallel write is the time spent waiting for the multi-plexed redo logs to be written to. The log file sequential read wait occurs as redo records are being read from the redo log are being read. The log file single write events occur when during writes to the log file header when log members are being added, SCN information is being written, hot backup status is being written, etc. If these event numbers are high, tune the log file writes to assure they are occuring as rapidly as possible. In the DBWR category are db file parallel write event which occurs while files are being written to in parallel, db file scattered read events which occur as multiple blocks are being read during full table scans and full index scans. This is going to be directly effected by the setting for DB_FILE_MULTIBLOCK_READ_COUNT. Large numbers here may indicate fragmentation on the physical device as a multi-block read is not necessarily a contiguous read on the physical device, but rather a logical multi-block read of Oracle blocks. V$DATAFILE can be queried to determine filename of the file being read. Looking at V$SYSTEM_EVENT view gives detailed information on the blocks being read and the starting point of the read. db file sequential read events occur during regular reads of datafiles by the foreground processes. These may include reads which are not full table/index scans such as index lookups etc. One other event is the db file single write event which occurs when file headers or other individual blocks are being written. The long and short of data file wait events is that you need to take a hard look at your file system layout and physical storage architecture. Latch Statistics - Willing to Wait These waits belong to processes who are trying to acquire
Interpret Statspack Report
Prepared by: Ramesh 30
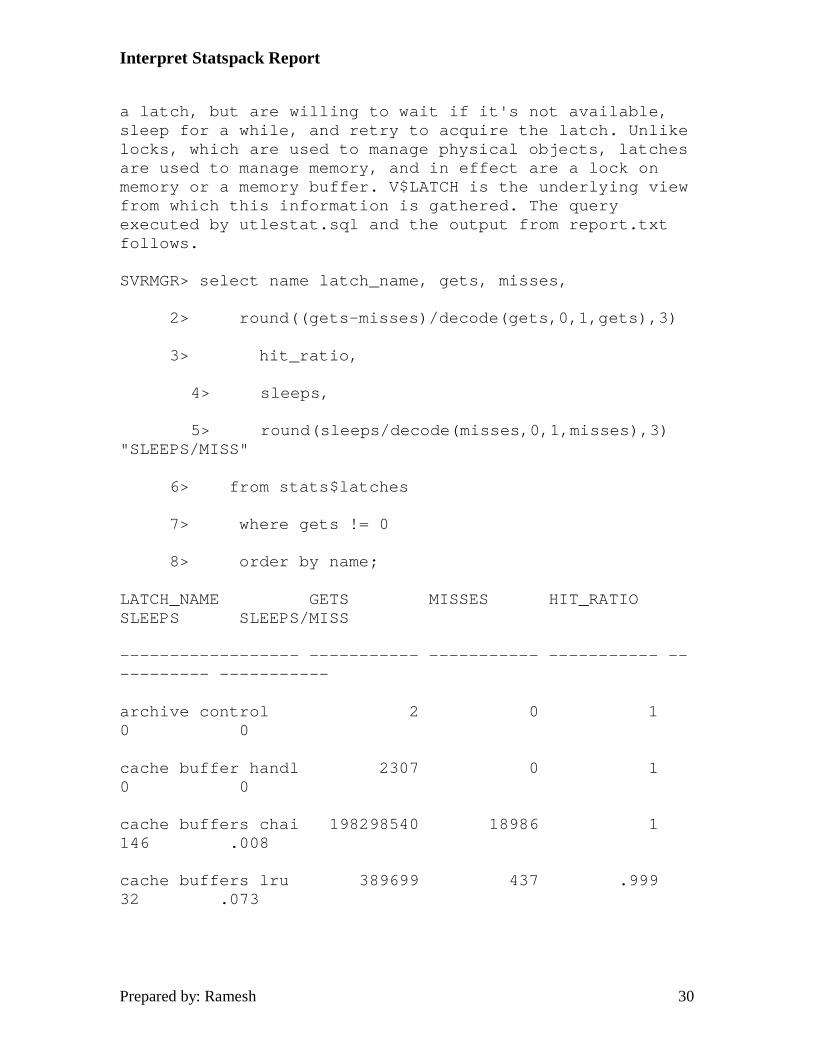
a latch, but are willing to wait if it's not available, sleep for a while, and retry to acquire the latch. Unlike locks, which are used to manage physical objects, latches are used to manage memory, and in effect are a lock on memory or a memory buffer. V$LATCH is the underlying view from which this information is gathered. The query executed by utlestat.sql and the output from report.txt follows.
SVRMGR> select name latch_name, gets, misses,
2> round((gets-misses)/decode(gets,0,1,gets),3)
3> hit_ratio,
4> sleeps,
5> round(sleeps/decode(misses,0,1,misses),3) "SLEEPS/MISS"
6> from stats$latches
7> where gets != 0
8> order by name;
LATCH_NAME GETS MISSES HIT_RATIO SLEEPS SLEEPS/MISS
------------------ ----------- ----------- ----------- ----------- -----------
archive control 2 0 1 0 0
cache buffer handl 2307 0 1 0 0
cache buffers chai 198298540 18986 1 146 .008
cache buffers lru 389699 437 .999 32 .073
Interpret Statspack Report
Prepared by: Ramesh 31
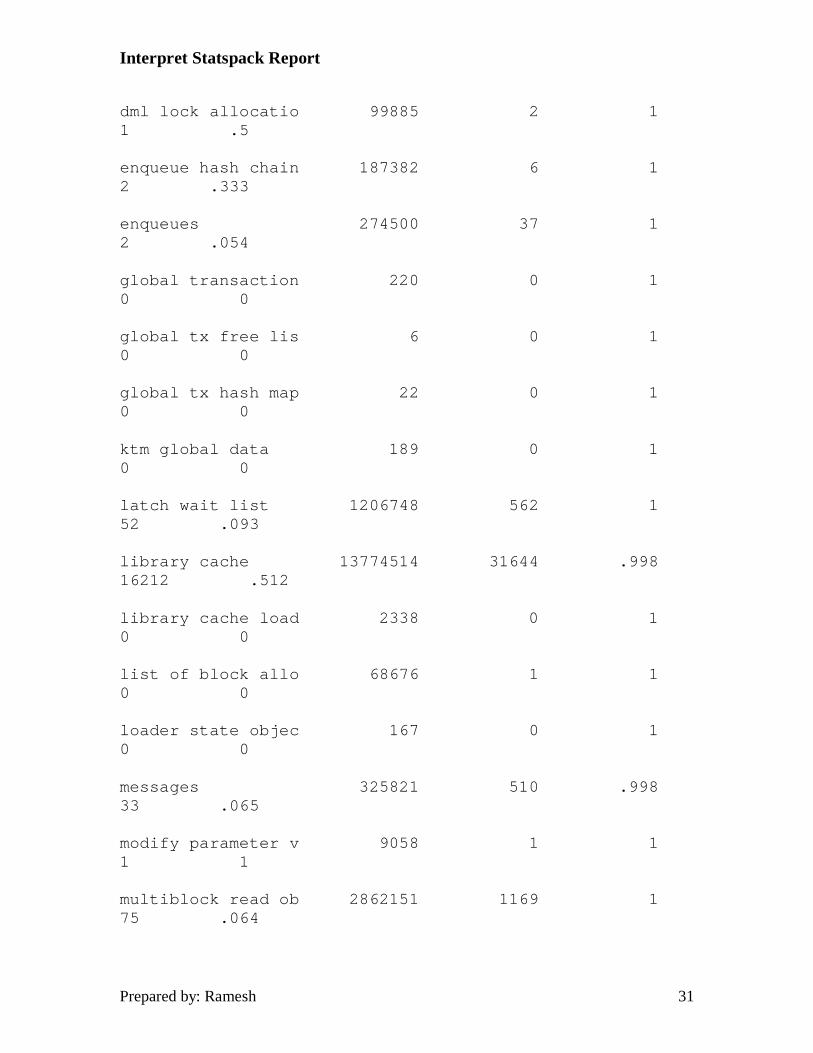
dml lock allocatio 99885 2 1 1 .5
enqueue hash chain 187382 6 1 2 .333
enqueues 274500 37 1 2 .054
global transaction 220 0 1 0 0
global tx free lis 6 0 1 0 0
global tx hash map 22 0 1 0 0
ktm global data 189 0 1 0 0
latch wait list 1206748 562 1 52 .093
library cache 13774514 31644 .998 16212 .512
library cache load 2338 0 1 0 0
list of block allo 68676 1 1 0 0
loader state objec 167 0 1 0 0
messages 325821 510 .998 33 .065
modify parameter v 9058 1 1 1 1
multiblock read ob 2862151 1169 1 75 .064
Interpret Statspack Report
Prepared by: Ramesh 32
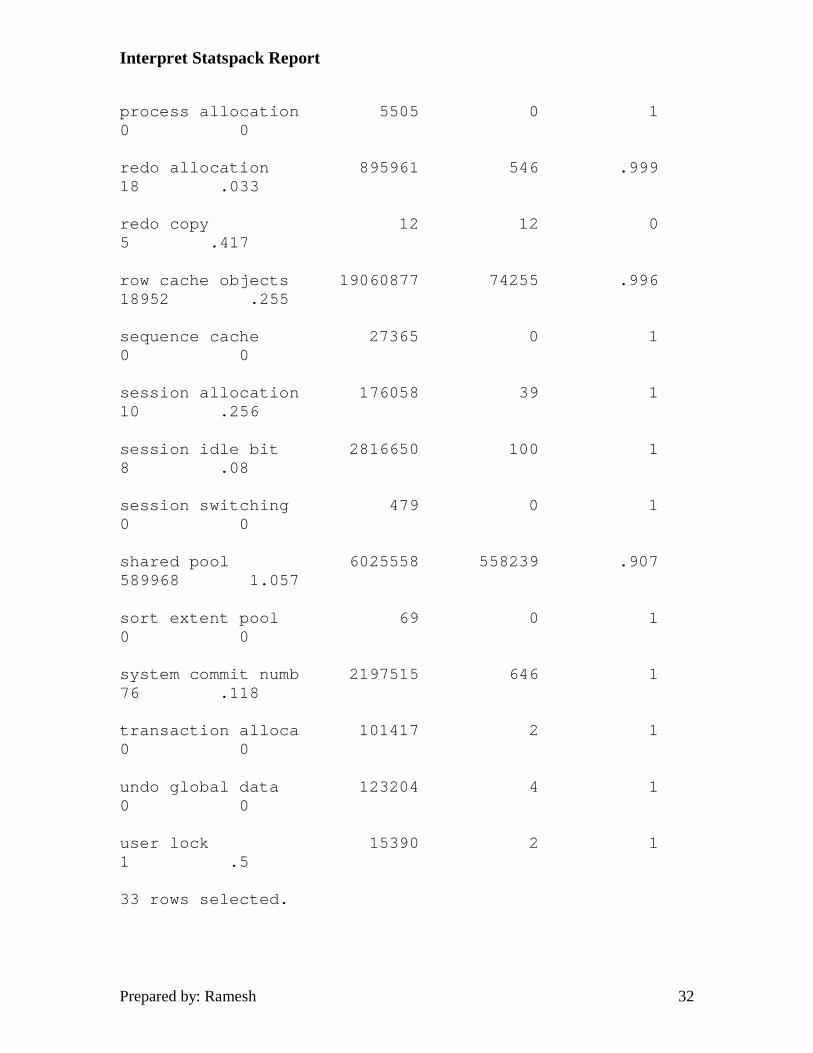
process allocation 5505 0 1 0 0
redo allocation 895961 546 .999 18 .033
redo copy 12 12 0 5 .417
row cache objects 19060877 74255 .996 18952 .255
sequence cache 27365 0 1 0 0
session allocation 176058 39 1 10 .256
session idle bit 2816650 100 1 8 .08
session switching 479 0 1 0 0
shared pool 6025558 558239 .907 589968 1.057
sort extent pool 69 0 1 0 0
system commit numb 2197515 646 1 76 .118
transaction alloca 101417 2 1 0 0
undo global data 123204 4 1 0 0
user lock 15390 2 1 1 .5
33 rows selected.
Interpret Statspack Report
Prepared by: Ramesh 33
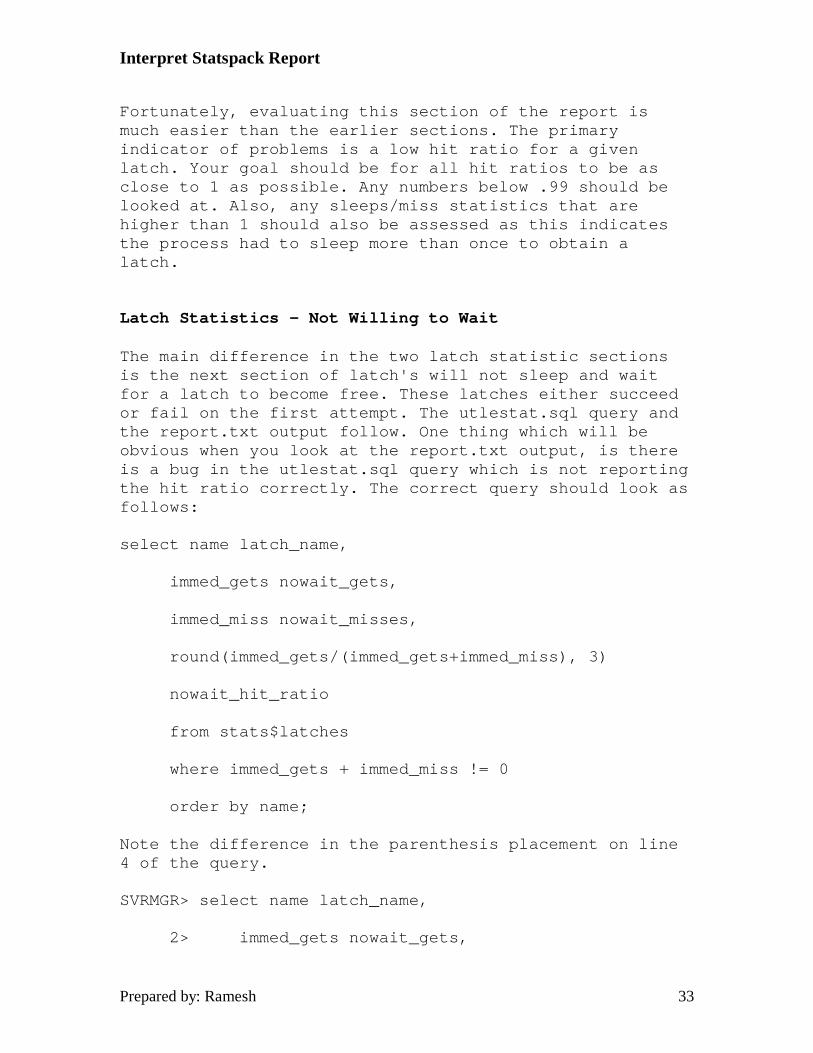
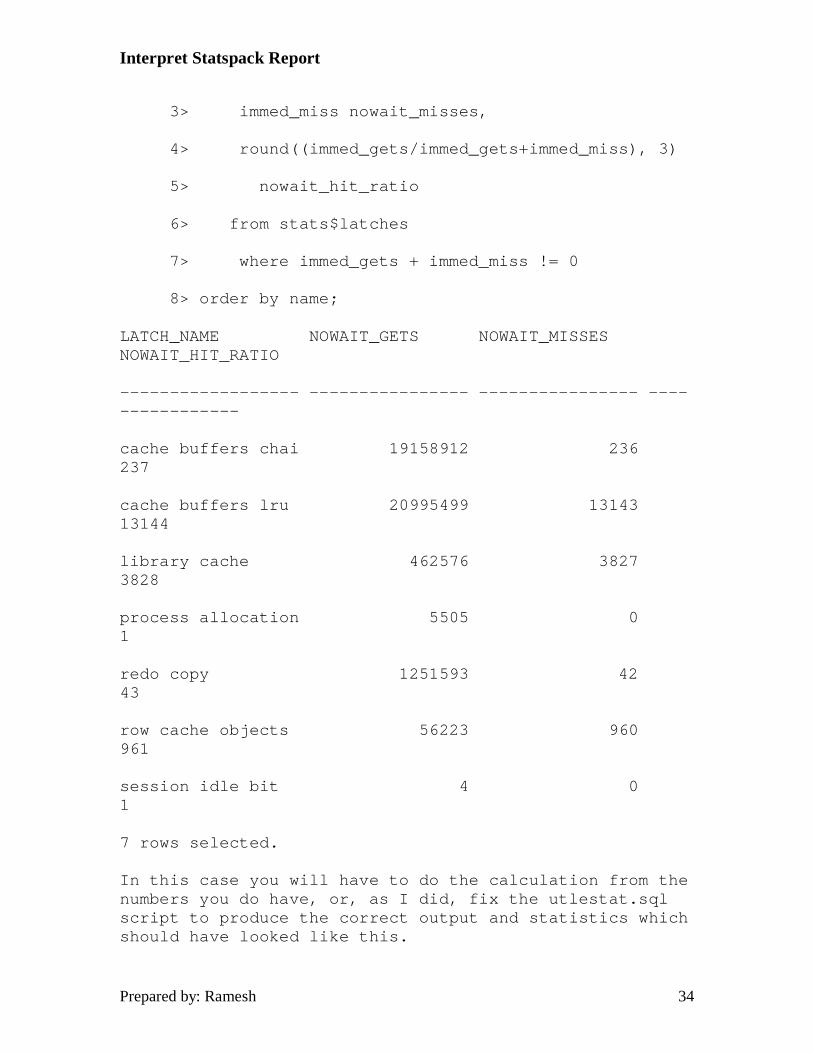
Fortunately, evaluating this section of the report is much easier than the earlier sections. The primary indicator of problems is a low hit ratio for a given latch. Your goal should be for all hit ratios to be as close to 1 as possible. Any numbers below .99 should be looked at. Also, any sleeps/miss statistics that are higher than 1 should also be assessed as this indicates the process had to sleep more than once to obtain a latch. Latch Statistics - Not Willing to Wait The main difference in the two latch statistic sections is the next section of latch's will not sleep and wait for a latch to become free. These latches either succeed or fail on the first attempt. The utlestat.sql query and the report.txt output follow. One thing which will be obvious when you look at the report.txt output, is there is a bug in the utlestat.sql query which is not reporting the hit ratio correctly. The correct query should look as follows:
select name latch_name,
immed_gets nowait_gets,
immed_miss nowait_misses,
round(immed_gets/(immed_gets+immed_miss), 3)
nowait_hit_ratio
from stats$latches
where immed_gets + immed_miss != 0
order by name;
Note the difference in the parenthesis placement on line 4 of the query.
SVRMGR> select name latch_name,
2> immed_gets nowait_gets,
Interpret Statspack Report
Prepared by: Ramesh 34
3> immed_miss nowait_misses,
4> round((immed_gets/immed_gets+immed_miss), 3)
5> nowait_hit_ratio
6> from stats$latches
7> where immed_gets + immed_miss != 0
8> order by name;
LATCH_NAME NOWAIT_GETS NOWAIT_MISSES NOWAIT_HIT_RATIO
------------------ ---------------- ---------------- ----------------
cache buffers chai 19158912 236 237
cache buffers lru 20995499 13143 13144
library cache 462576 3827 3828
process allocation 5505 0 1
redo copy 1251593 42 43
row cache objects 56223 960 961
session idle bit 4 0 1
7 rows selected.
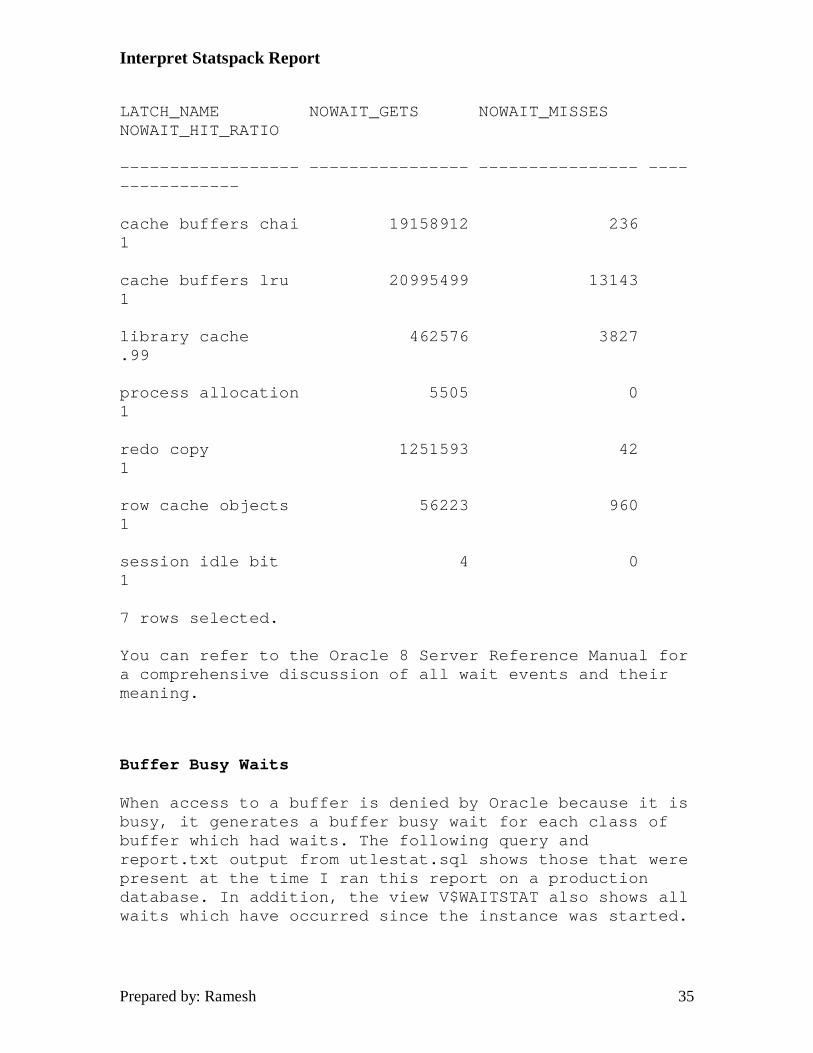
In this case you will have to do the calculation from the numbers you do have, or, as I did, fix the utlestat.sql script to produce the correct output and statistics which should have looked like this.
Interpret Statspack Report
Prepared by: Ramesh 35
LATCH_NAME NOWAIT_GETS NOWAIT_MISSES NOWAIT_HIT_RATIO
------------------ ---------------- ---------------- ----------------
cache buffers chai 19158912 236 1
cache buffers lru 20995499 13143 1
library cache 462576 3827 .99
process allocation 5505 0 1
redo copy 1251593 42 1
row cache objects 56223 960 1
session idle bit 4 0 1
7 rows selected.
You can refer to the Oracle 8 Server Reference Manual for a comprehensive discussion of all wait events and their meaning.
Buffer Busy Waits When access to a buffer is denied by Oracle because it is busy, it generates a buffer busy wait for each class of buffer which had waits. The following query and report.txt output from utlestat.sql shows those that were present at the time I ran this report on a production database. In addition, the view V$WAITSTAT also shows all waits which have occurred since the instance was started.
Interpret Statspack Report
Prepared by: Ramesh 36
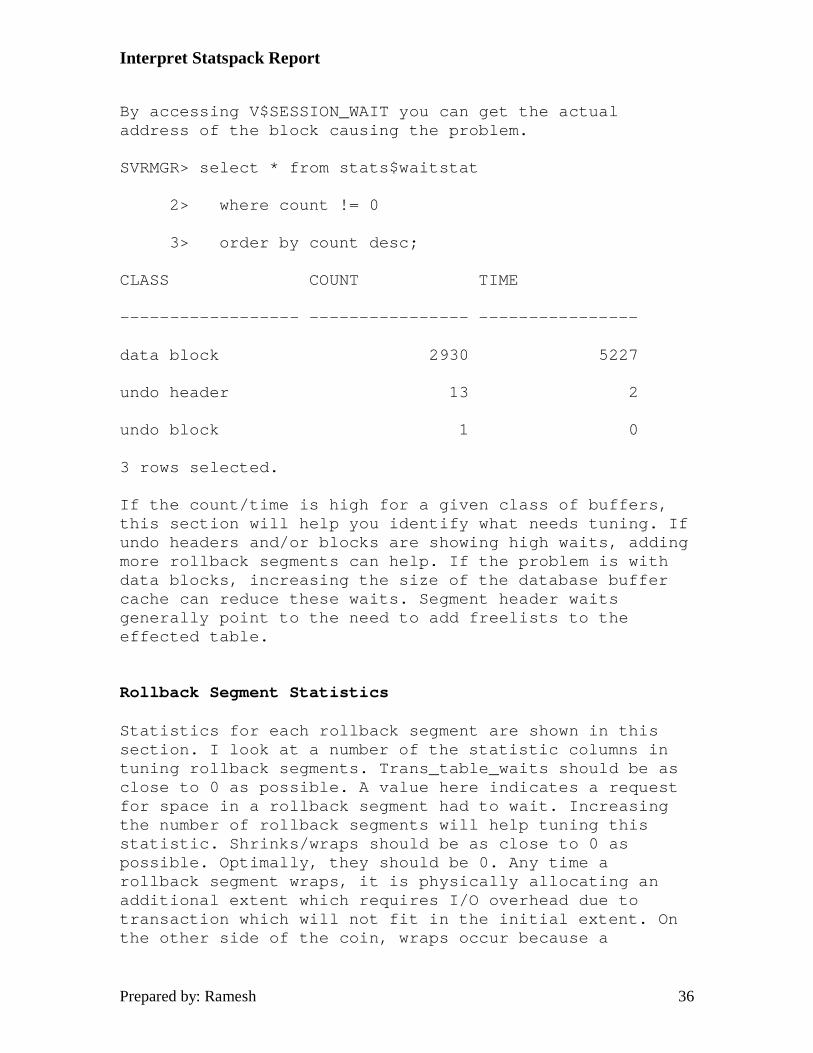
By accessing V$SESSION_WAIT you can get the actual address of the block causing the problem.
SVRMGR> select * from stats$waitstat
2> where count != 0
3> order by count desc;
CLASS COUNT TIME
------------------ ---------------- ----------------
data block 2930 5227
undo header 13 2
undo block 1 0
3 rows selected.
If the count/time is high for a given class of buffers, this section will help you identify what needs tuning. If undo headers and/or blocks are showing high waits, adding more rollback segments can help. If the problem is with data blocks, increasing the size of the database buffer cache can reduce these waits. Segment header waits generally point to the need to add freelists to the effected table. Rollback Segment Statistics Statistics for each rollback segment are shown in this section. I look at a number of the statistic columns in tuning rollback segments. Trans_table_waits should be as close to 0 as possible. A value here indicates a request for space in a rollback segment had to wait. Increasing the number of rollback segments will help tuning this statistic. Shrinks/wraps should be as close to 0 as possible. Optimally, they should be 0. Any time a rollback segment wraps, it is physically allocating an additional extent which requires I/O overhead due to transaction which will not fit in the initial extent. On the other side of the coin, wraps occur because a
Interpret Statspack Report
Prepared by: Ramesh 37
rollback segment wrapped (extended) beyond optimal, and when a second transaction caused it to wrap a second time, Oracle will shrink the segment back to it's optimal size again generating I/O overhead. This allocation/deallocation of extents in rollback segments is very expensive in terms of overhead on the Oracle database and should be avoided through tuning.
SVRMGR> select * from stats$roll;
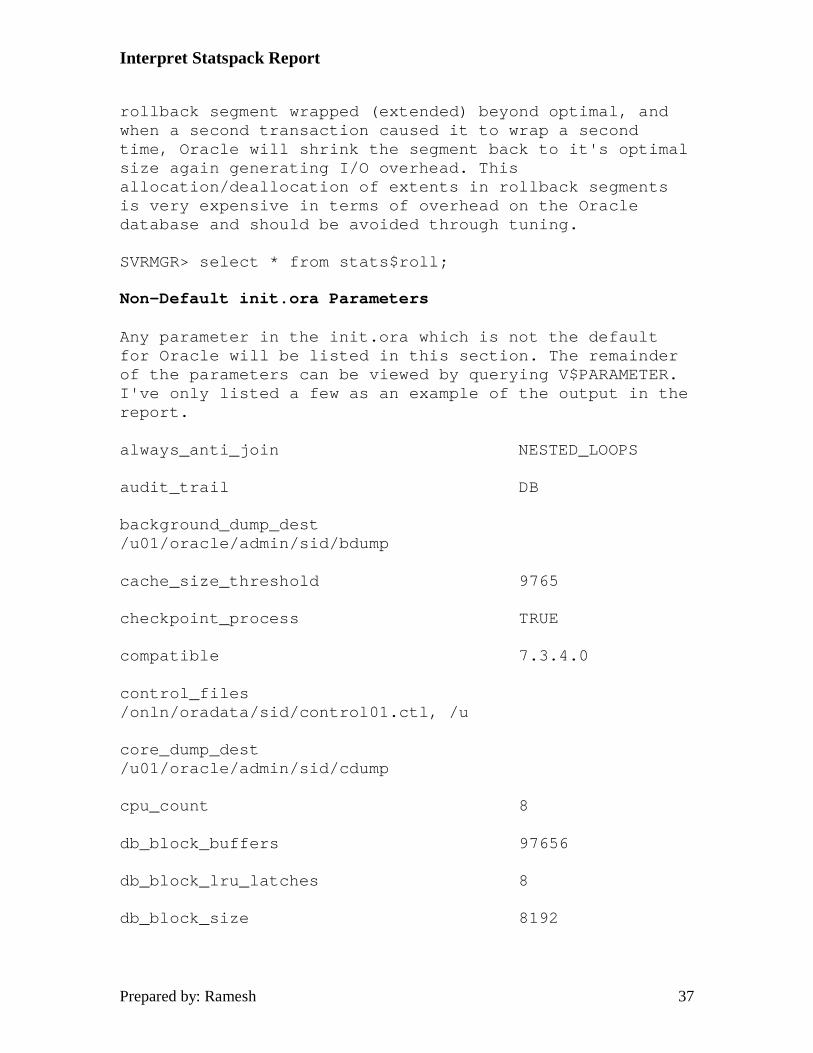
Non-Default init.ora Parameters Any parameter in the init.ora which is not the default for Oracle will be listed in this section. The remainder of the parameters can be viewed by querying V$PARAMETER. I've only listed a few as an example of the output in the report.
always_anti_join NESTED_LOOPS
audit_trail DB
background_dump_dest /u01/oracle/admin/sid/bdump
cache_size_threshold 9765
checkpoint_process TRUE
compatible 7.3.4.0
control_files /onln/oradata/sid/control01.ctl, /u
core_dump_dest /u01/oracle/admin/sid/cdump
cpu_count 8
db_block_buffers 97656
db_block_lru_latches 8
db_block_size 8192
Interpret Statspack Report
Prepared by: Ramesh 38
…
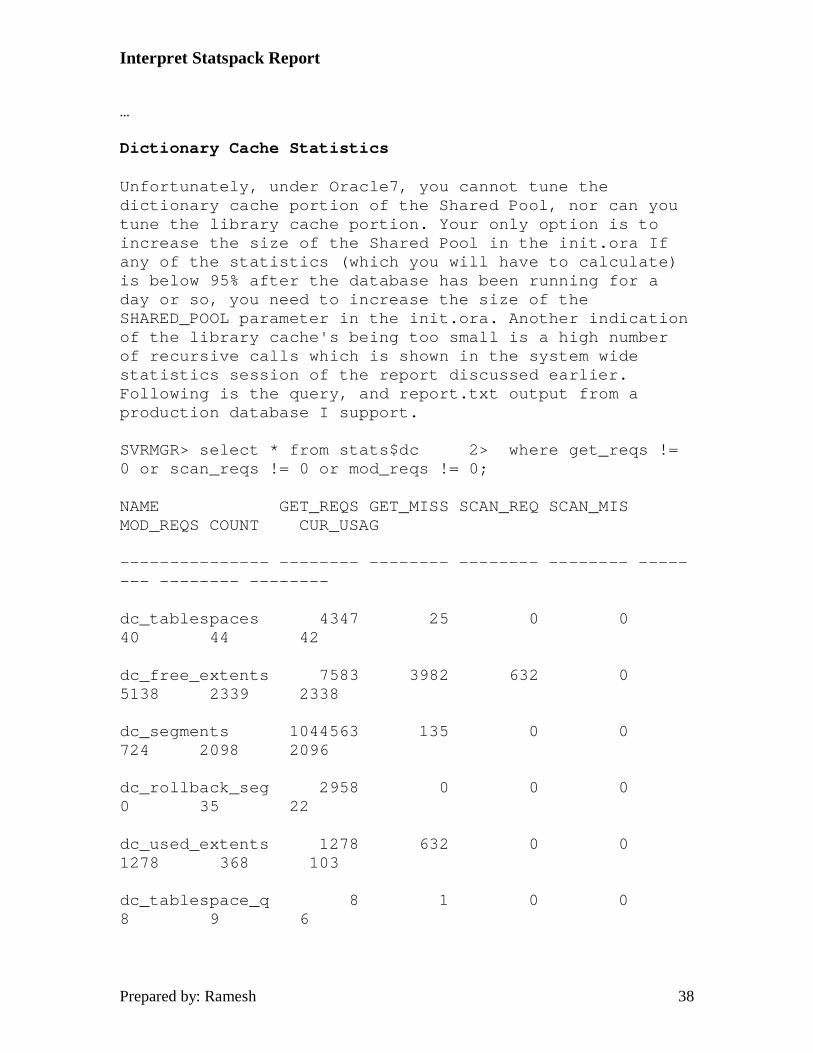
Dictionary Cache Statistics Unfortunately, under Oracle7, you cannot tune the dictionary cache portion of the Shared Pool, nor can you tune the library cache portion. Your only option is to increase the size of the Shared Pool in the init.ora If any of the statistics (which you will have to calculate) is below 95% after the database has been running for a day or so, you need to increase the size of the SHARED_POOL parameter in the init.ora. Another indication of the library cache's being too small is a high number of recursive calls which is shown in the system wide statistics session of the report discussed earlier. Following is the query, and report.txt output from a production database I support.
SVRMGR> select * from stats$dc 2> where get_reqs != 0 or scan_reqs != 0 or mod_reqs != 0;
NAME GET_REQS GET_MISS SCAN_REQ SCAN_MIS MOD_REQS COUNT CUR_USAG
--------------- -------- -------- -------- -------- -------- -------- --------
dc_tablespaces 4347 25 0 0 40 44 42
dc_free_extents 7583 3982 632 0 5138 2339 2338
dc_segments 1044563 135 0 0 724 2098 2096
dc_rollback_seg 2958 0 0 0 0 35 22
dc_used_extents 1278 632 0 0 1278 368 103
dc_tablespace_q 8 1 0 0 8 9 6
Interpret Statspack Report
Prepared by: Ramesh 39
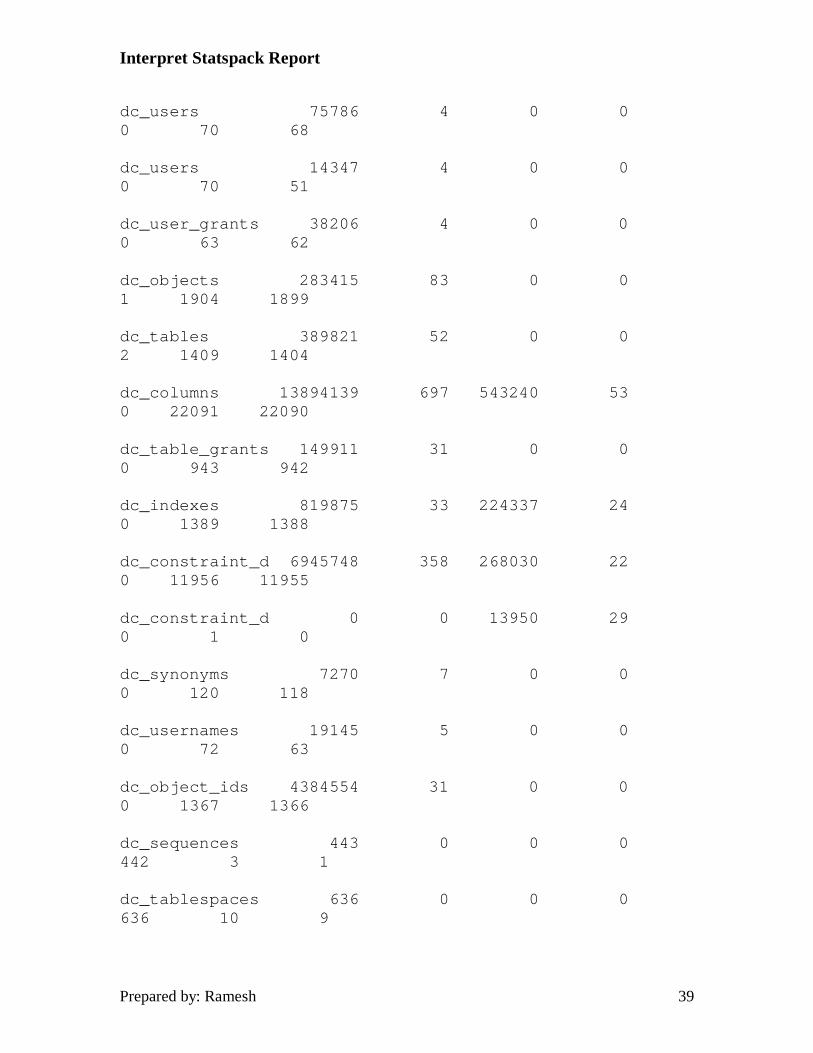
dc_users 75786 4 0 0 0 70 68
dc_users 14347 4 0 0 0 70 51
dc_user_grants 38206 4 0 0 0 63 62
dc_objects 283415 83 0 0 1 1904 1899
dc_tables 389821 52 0 0 2 1409 1404
dc_columns 13894139 697 543240 53 0 22091 22090
dc_table_grants 149911 31 0 0 0 943 942
dc_indexes 819875 33 224337 24 0 1389 1388
dc_constraint_d 6945748 358 268030 22 0 11956 11955
dc_constraint_d 0 0 13950 29 0 1 0
dc_synonyms 7270 7 0 0 0 120 118
dc_usernames 19145 5 0 0 0 72 63
dc_object_ids 4384554 31 0 0 0 1367 1366
dc_sequences 443 0 0 0 442 3 1
dc_tablespaces 636 0 0 0 636 10 9
Interpret Statspack Report
Prepared by: Ramesh 40
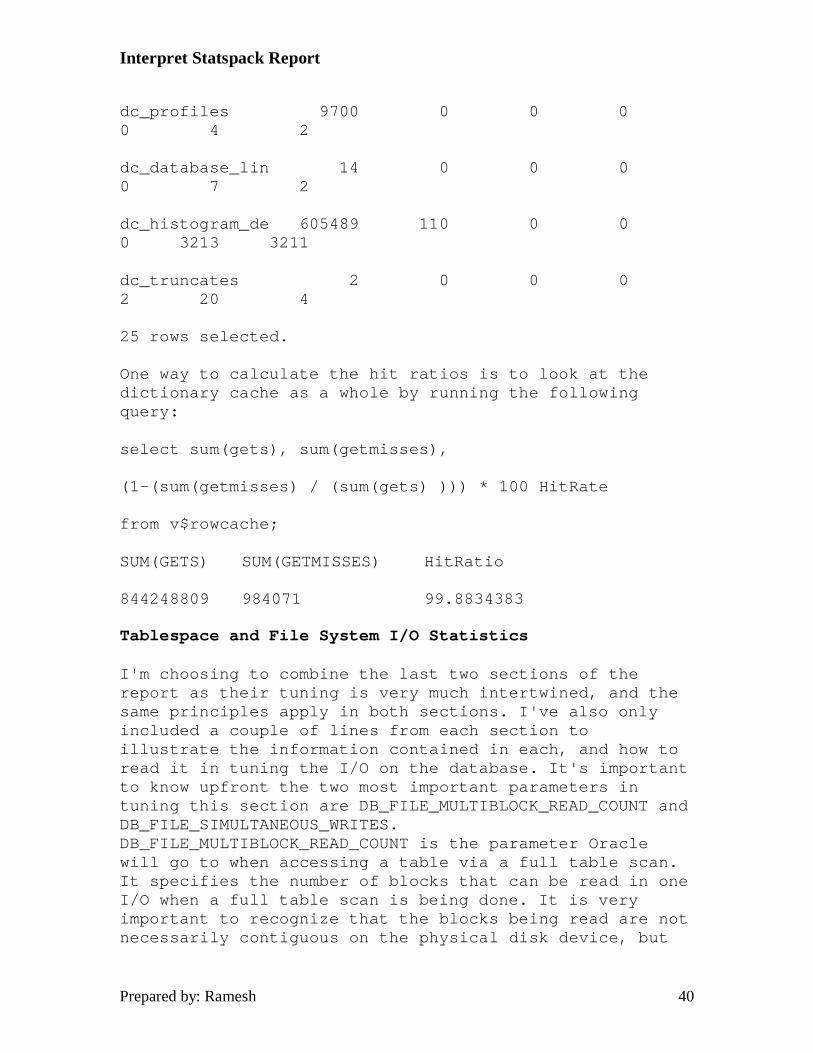
dc_profiles 9700 0 0 0 0 4 2
dc_database_lin 14 0 0 0 0 7 2
dc_histogram_de 605489 110 0 0 0 3213 3211
dc_truncates 2 0 0 0 2 20 4
25 rows selected.
One way to calculate the hit ratios is to look at the dictionary cache as a whole by running the following query:
select sum(gets), sum(getmisses),
(1-(sum(getmisses) / (sum(gets) ))) * 100 HitRate
from v$rowcache;
SUM(GETS) SUM(GETMISSES) HitRatio
844248809 984071 99.8834383
Tablespace and File System I/O Statistics I'm choosing to combine the last two sections of the report as their tuning is very much intertwined, and the same principles apply in both sections. I've also only included a couple of lines from each section to illustrate the information contained in each, and how to read it in tuning the I/O on the database. It's important to know upfront the two most important parameters in tuning this section are DB_FILE_MULTIBLOCK_READ_COUNT and DB_FILE_SIMULTANEOUS_WRITES. DB_FILE_MULTIBLOCK_READ_COUNT is the parameter Oracle will go to when accessing a table via a full table scan. It specifies the number of blocks that can be read in one I/O when a full table scan is being done. It is very important to recognize that the blocks being read are not necessarily contiguous on the physical disk device, but
Interpret Statspack Report
Prepared by: Ramesh 41
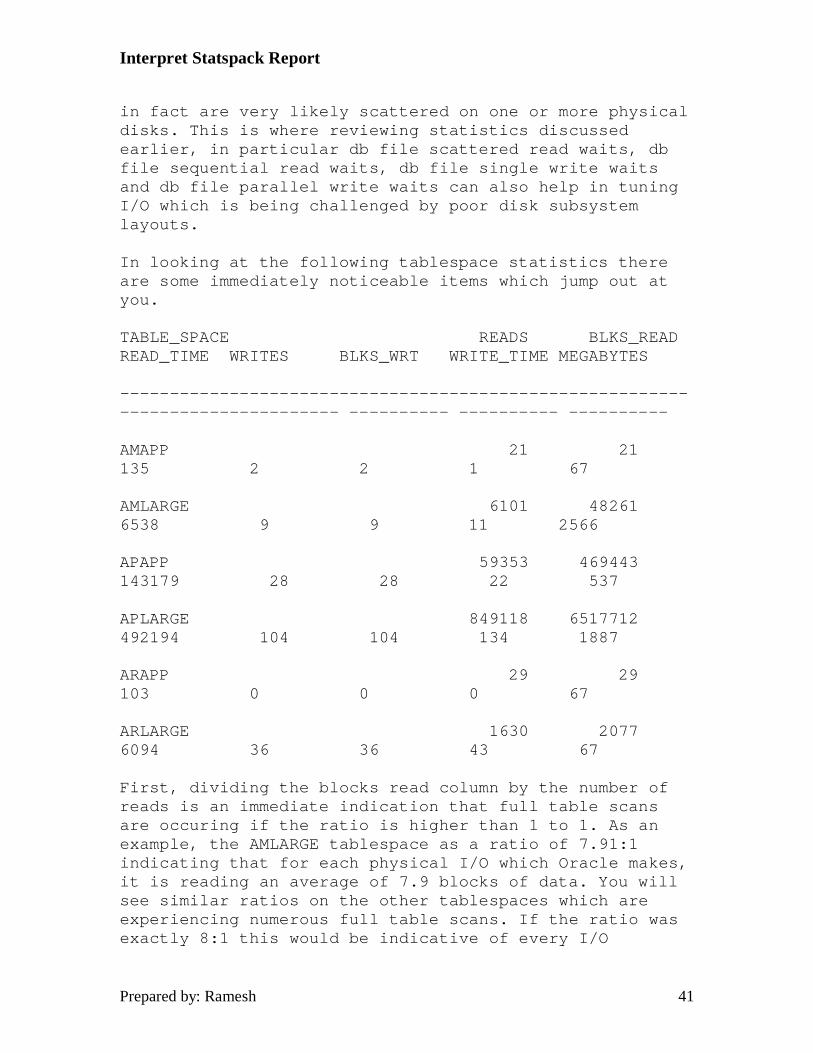
in fact are very likely scattered on one or more physical disks. This is where reviewing statistics discussed earlier, in particular db file scattered read waits, db file sequential read waits, db file single write waits and db file parallel write waits can also help in tuning I/O which is being challenged by poor disk subsystem layouts. In looking at the following tablespace statistics there are some immediately noticeable items which jump out at you.
TABLE_SPACE READS BLKS_READ READ_TIME WRITES BLKS_WRT WRITE_TIME MEGABYTES
------------------------------------------------------------------------------- ---------- ---------- ----------
AMAPP 21 21 135 2 2 1 67
AMLARGE 6101 48261 6538 9 9 11 2566
APAPP 59353 469443 143179 28 28 22 537
APLARGE 849118 6517712 492194 104 104 134 1887
ARAPP 29 29 103 0 0 0 67
ARLARGE 1630 2077 6094 36 36 43 67
First, dividing the blocks read column by the number of reads is an immediate indication that full table scans are occuring if the ratio is higher than 1 to 1. As an example, the AMLARGE tablespace as a ratio of 7.91:1 indicating that for each physical I/O which Oracle makes, it is reading an average of 7.9 blocks of data. You will see similar ratios on the other tablespaces which are experiencing numerous full table scans. If the ratio was exactly 8:1 this would be indicative of every I/O
Interpret Statspack Report
Prepared by: Ramesh 42
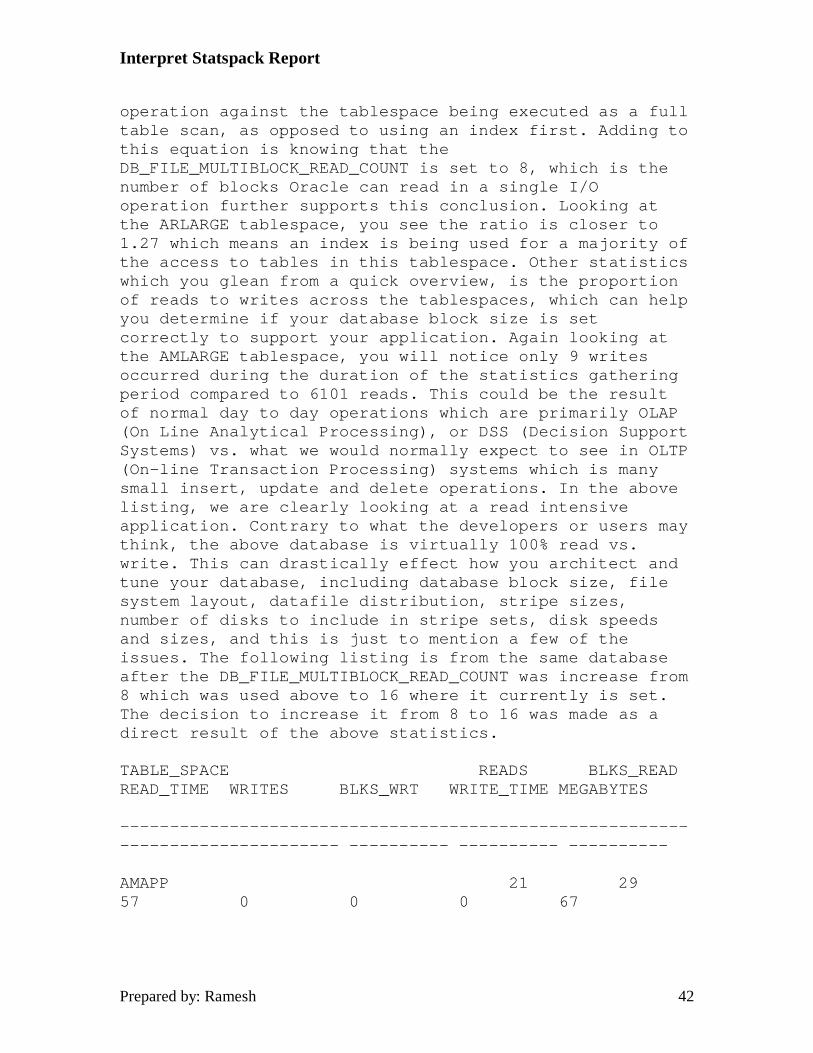
operation against the tablespace being executed as a full table scan, as opposed to using an index first. Adding to this equation is knowing that the DB_FILE_MULTIBLOCK_READ_COUNT is set to 8, which is the number of blocks Oracle can read in a single I/O operation further supports this conclusion. Looking at the ARLARGE tablespace, you see the ratio is closer to 1.27 which means an index is being used for a majority of the access to tables in this tablespace. Other statistics which you glean from a quick overview, is the proportion of reads to writes across the tablespaces, which can help you determine if your database block size is set correctly to support your application. Again looking at the AMLARGE tablespace, you will notice only 9 writes occurred during the duration of the statistics gathering period compared to 6101 reads. This could be the result of normal day to day operations which are primarily OLAP (On Line Analytical Processing), or DSS (Decision Support Systems) vs. what we would normally expect to see in OLTP (On-line Transaction Processing) systems which is many small insert, update and delete operations. In the above listing, we are clearly looking at a read intensive application. Contrary to what the developers or users may think, the above database is virtually 100% read vs. write. This can drastically effect how you architect and tune your database, including database block size, file system layout, datafile distribution, stripe sizes, number of disks to include in stripe sets, disk speeds and sizes, and this is just to mention a few of the issues. The following listing is from the same database after the DB_FILE_MULTIBLOCK_READ_COUNT was increase from 8 which was used above to 16 where it currently is set. The decision to increase it from 8 to 16 was made as a direct result of the above statistics.
TABLE_SPACE READS BLKS_READ READ_TIME WRITES BLKS_WRT WRITE_TIME MEGABYTES
------------------------------------------------------------------------------- ---------- ---------- ----------
AMAPP 21 29 57 0 0 0 67
Interpret Statspack Report
Prepared by: Ramesh 43
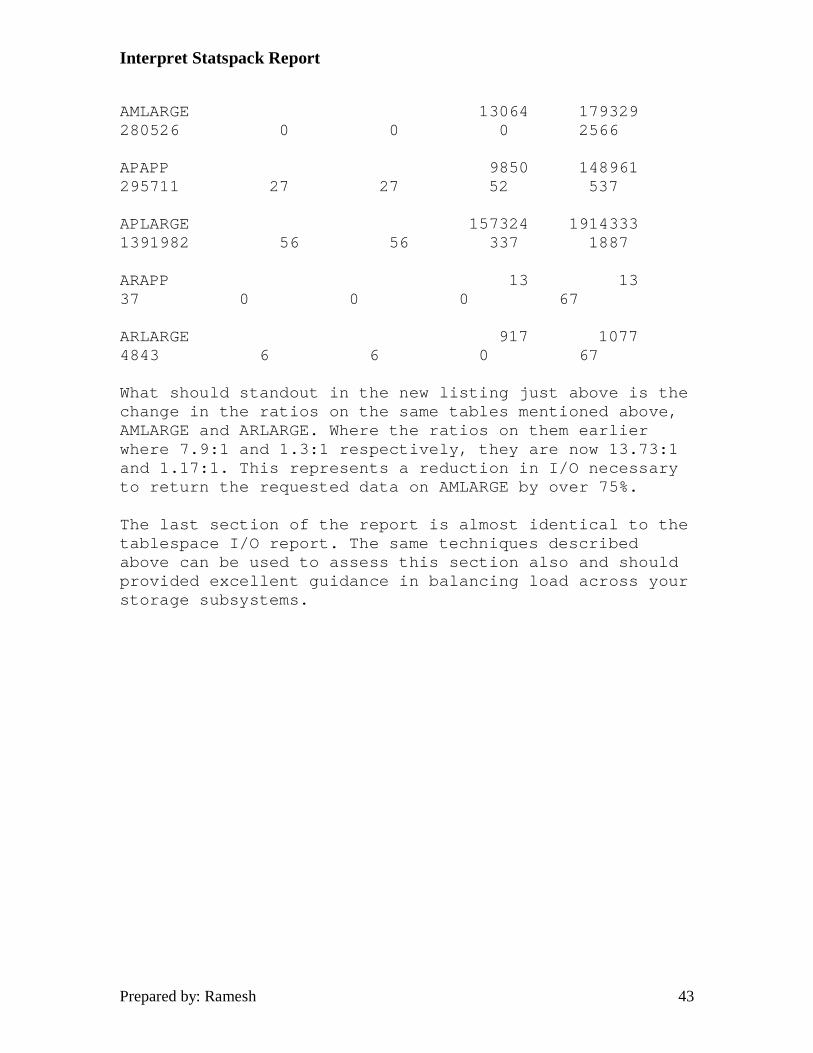
AMLARGE 13064 179329 280526 0 0 0 2566
APAPP 9850 148961 295711 27 27 52 537
APLARGE 157324 1914333 1391982 56 56 337 1887
ARAPP 13 13 37 0 0 0 67
ARLARGE 917 1077 4843 6 6 0 67
What should standout in the new listing just above is the change in the ratios on the same tables mentioned above, AMLARGE and ARLARGE. Where the ratios on them earlier where 7.9:1 and 1.3:1 respectively, they are now 13.73:1 and 1.17:1. This represents a reduction in I/O necessary to return the requested data on AMLARGE by over 75%. The last section of the report is almost identical to the tablespace I/O report. The same techniques described above can be used to assess this section also and should provided excellent guidance in balancing load across your storage subsystems.