Embed Size (px)
Citation preview

An Oracle White Paper
January 2013
Oracle Database Appliance characterization with JD Edwards EnterpriseOne
PURPOSE STATEMENT AND DISCLAIMER
THIS DOCUMENT PROVIDES FACTORS TO CONSIDER WHEN REVIEWING SYSTEM
PERFORMANCE RELATIVE TO YOUR JD EDWARDS ENTERPRISEONE SYSTEM.
MANY FACTORS CAN INFLUENCE PERFORMANCE AND YOUR RESULTS MAY
DIFFER DEPENDING ON SEVERAL DIFFERENT VARIABLES.
“This document is provided for information purposes and should not be relied upon in making a purchasing decision. The contents hereof are subject to change without notice. This document is not warranted to be error-free, nor subject to any other warranties or conditions, whether expressed orally or implied in law, including implied warranties and conditions of merchantability or fitness for a particular purpose.

Oracle Database Appliance characterization with JD Edwards EnterpriseOne
THIS DOCUMENT IS NOT PART OF A LICENSE AGREEMENT NOR CAN IT BE INCORPORATED INTO ANY CONTRACTUAL AGREEMENT WITH ORACLE CORPORATION OR ITS SUBSIDIARIES OR AFFILIATES.
Failure to adhere to these benchmarks does not constitute a breach of Oracle’s obligations.
We specifically disclaim any liability with respect to this document and no contractual
obligations are formed either directly or indirectly by this document. This document may not
be reproduced or transmitted in any form or by any means, electronic or mechanical, for any
purpose, without our prior written permission."
www.oracle.com/support/collateral/oracle-technical-support-policies.pdf

Oracle Database Appliance characterization with JD Edwards EnterpriseOne
PURPOSE STATEMENT AND DISCLAIMER ................................... 0
Executive Overview ........................................................................... 2
Introduction ....................................................................................... 2
Oracle Database Appliance ........................................................... 2
JD Edwards EnterpriseOne ........................................................... 3
Project goals and architectural setup ................................................. 3
Oracle Database Appliance sizing ..................................................... 4
Adjustments to standard Oracle Database Appliance templates .... 5
Workload and test design .................................................................. 5
Interactive workload ....................................................................... 5
Batch workload .............................................................................. 6
Test results ........................................................................................ 7
Validation testing ........................................................................... 7
Performance metrics ..................................................................... 8
Load testing ................................................................................... 9
Oracle Database Appliance resource utilization ........................... 12
EnterpriseOne server resource utilization .................................... 13
Web Server resource utilization ................................................... 14
Observations and findings ............................................................... 15
Conclusion ...................................................................................... 16

Oracle Database Appliance characterization with JD Edwards EnterpriseOne
2
Executive Overview
The purpose of this white paper is to illustrate deployment of Oracle JD Edwards EnterpriseOne applications database on Oracle Database Appliance and characterize the performance of the combined, integrated Oracle stack. Enterprise applications require robust, highly available, secure, high performance platforms. Oracle Database Appliance is a suitable platform to run enterprise class databases that typically require high availability and reliability. Oracle Database Appliance is a pre-configured, highly available Oracle database system. It is a complete system that includes hardware, software, networking, and storage, all packaged in a single 4-U rack installable box. The hardware configuration provides complete redundancy and protects against all single points of failures in the system.
Figure 1 - Oracle Database Appliance System
The information presented in this white paper is the result of a project involving extensive testing of various Oracle JD Edwards EnterpriseOne application workloads against different Oracle Database Appliance configurations.
Introduction
Oracle Database Appliance
Oracle Database Appliance is a two node RAC cluster database system running Oracle Linux operating system, Oracle Database, Oracle Clusterware and Automatic Storage Management. These components provide the foundation for the highly available databases operating on Oracle Database Appliance. Oracle Database Appliance comprises of two independent, but interconnected compute nodes and direct attached SAS and SSD storage. The storage provides about 4 TB of usable space in a highly available, fully redundant configuration. Oracle Database Appliance requires minimal configuration and almost no performance tuning. For performance intensive applications, minor tweaks may be required. Oracle Database

Oracle Database Appliance characterization with JD Edwards EnterpriseOne
3
Appliance includes Oracle Appliance Manager software to manage and maintain the database system, including patching of the entire stack, upgrades of all stack components, as well as end to end troubleshooting.
JD Edwards EnterpriseOne
Oracle's JD Edwards EnterpriseOne is an integrated suite of comprehensive enterprise resource planning applications software that combines business value, standards-based technology, and deep industry experience into a business solution with a low total cost of ownership. EnterpriseOne ERP solution is designed to run on different platforms and database architectures. JD Edwards EnterpriseOne also delivers mobile applications. It is also the first ERP solution to run all applications on Apple iPad.
Project goals and architectural setup
The objective of this project is to validate installation and configuration of Oracle JD Edwards EnterpriseOne applications in an environment with Oracle Database Appliance serving as the database host. In addition, this project is to demonstrate the performance testing of Oracle JD Edwards EnterpriseOne applications involving a combination of interactive and batch workloads. The interactive and batch workload was generated using HP LoadRunner tool version 9.52. A single controller running in a Microsoft Windows (2008) operating system environment was used for the testing. Batch processes were executed from the command line interface on the EnterpriseOne Logic Server running in an OVM (Oracle Virtual Machine) on a separate Oracle X4100 machine.
Figure 2 - Oracle JD Edwards EnterpriseOne and Oracle Database Appliance Testing Architecture

Oracle Database Appliance characterization with JD Edwards EnterpriseOne
4
Performance measurements were collected from LoadRunner controller, the database, and the operating system. For operating system level performance measurements, the following standard tools were used.
� mpstat � vmstat � iostat � free � netstat
For transaction level performance measurements, LoadRunner results were used and for database level performance Automatic Workload Repository (AWR) reports were used.
Oracle Database Appliance sizing
Oracle Database Appliance comes pre-configured with standardized configuration templates. These templates can be used to rapidly deploy databases of various sizes, from a very small configuration that activates 2 cores on each server node to a very large configuration that uses all 12 cores on each server node. The database configured using these standard templates automatically includes Oracle recommended configuration best practices and creates a pre-tuned configuration. This greatly simplifies the deployment process and results in an optimal deployment. The following matrix describes the database templates deployed on Oracle Database Appliance. This matrix is available in Oracle Database Appliance Getting Started Guide Release 2.4 (part number E22692-18)
System Component
Very Small
Small Medium Large Very Large
CPU 2 4 8 12 12 Memory (GB) 8 16 32 48 96
Database Size (GB) 136 273 546 819 1638 Log File Size (GB) 1 1 2 4 4 Number of DBs 12 6 3 2 1
IOPS 300 600 1300 2000 4000 MBPS 250 500 1000 1500 3000
Log Generation (MB/Sec)
6.83 6.83 13.65 27.30 27.30
Table 1 - Oracle Database Appliance Database Sizing Matrix for RAC Configurations
Oracle Database Appliance supports pay-as-you-grow licensing model. CPU cores are activated based on customer needs according to the matrix above. For the VERY SMALL configuration, only 2 cores were activated on each server node within the Oracle Database

Oracle Database Appliance characterization with JD Edwards EnterpriseOne
5
Appliance. For the MEDIUM configuration, 4 cores were activated on each server node within the Oracle Database Appliance, in accordance with the published sizing matrix.
Adjustments to standard Oracle Database Appliance templates
Oracle Database Appliance comes pre-configured with best practices. However, sometimes for specific workloads, minor adjustments to the configuration may be required. For the workload testing conducted during the course of writing this white paper, two specific changes were identified to increase the effective capacity of Oracle Database Appliance for Oracle JD Edwards EnterpriseOne ERP Applications workloads. Both these parameters belong to the database configuration and can be changed directly in the database.
• PROCESSES parameter – The PROCESSES database parameter was increased to 3000. The default setting of this parameter is 200 for the VERY SMALL template and 800 for MEDIUM template.
• OPEN_CURSORS parameter – The OPEN_CURSORS database parameter was increased to 5000. The default setting of this parameter is 1000.
Workload and test design
A single server managed instance process (i.e., a single JVM) was used for all tests conducted. The number of EnterpriseOne Call Object Kernel was adjusted during the tests to maintain a ratio of 10 users per Call Object Kernel. The Day-in-the-Life (DIL) kit was used for generating database workload during testing. The Day-in-the-Life kit consisted of interactive and batch workload components as detailed below. It may be noted that general system workload, was not taken into account during this testing. The general system workload may include, but is not limited to:
1. Database backups 2. Data loads and extracts 3. Data replication to external site, disaster recovery site, etc. 4. Local data validation and verification on local system, etc.
Interactive workload
Oracle JD Edwards EnterpriseOne DIL kit includes 16 interactive transactions and queries. These transactions and queries belong to 5 different modules as depicted in the table below.

Oracle Database Appliance characterization with JD Edwards EnterpriseOne
6
Process Application Description
1 P03B102 Apply Receipts 2 P0411 Supplier Ledger Inquiry 3 P051191 Daily Time Entry 4 P31114 Work Order Completion 5 P3411 MRP Messages (WO Orders) 6 P3411 MRP Messages (OP Orders) 7 P3411 MRP Messages (OT Orders) 8 P4113 Inventory Transfer 9 P42101 Sales Order Entry - 10 line items 10 P42101 Sales Order Update 11 P4310 Purchase Order Entry - 25 line items 12 P4312 Purchase Order Receipts 13 P4314 Voucher Match 14 P4915 Ship Confirm - Approval only 15 P4915 Ship Confirm - Confirm/Ship only 16 P4915 Ship Confirm - Confirm and change entry
Table 2 - Interactive workload – EnterpriseOne DIL kit
Batch workload
The Day-in-the-Life kit includes 18 batch processes. These short and medium running batch processes (also known as, Universal Batch Engine or UBEs) are listed in the tables below.
Type Process Application Description
SHORT 1 R0004P UDC Records Types Print SHORT 2 R0006P Business Unit Report SHORT 3 R00067 Business Unit Translation Report SHORT 4 R0008P Date Patterns Report SHORT 5 R0010P Company Constants Report SHORT 6 R0012P1 AAI Report SHORT 7 R0014 Payment Terms Report SHORT 8 R0018P Tax Detail Report SHORT 9 R00425 Organization Structure Report SHORT 10 R01402W Who’s Who Report SHORT 11 R03B155 A/R Summary Analysis SHORT 12 R03B31 Activity Log Report SHORT 13 R41411 Select Items Cost Count SHORT 14 R42072 Price Category Print MEDIUM 1 R31410 Generate and Print Work Orders MEDIUM 2 R3483 Multi-Facility MPS - Net Change MEDIUM 3 R42565 Print Invoice MEDIUM 4 R43500 Print Purchase Orders
Table3 - Batch workload – EnterpriseOne DIL Kit

Oracle Database Appliance characterization with JD Edwards EnterpriseOne
7
Each of the LoadRunner scripts simulated a series of web interface actions, including:
� Logging into EnterpriseOne applications � Performing a series of steps within an EnterpriseOne module � Repeating these steps for a number of iterations � Logging out of EnterpriseOne applications
The above actions simulate those of a typical user of JD Edwards EnterpriseOne applications. For example, during these test sessions, virtual users perform steps such as issuing a “find”, pressing the “OK” button, pressing the “Submit” button, and performing other such functions. For each script, LoadRunner measures and records the time and duration of each of these actions. The average end user response time metric reported in this white paper is a composite average of the 16 LoadRunner script metrics (i.e., the interactive workload). As stated previously, the workload executed during the tests consisted of both the interactive and the batch database workload elements. These processes running concurrently on Oracle Database Appliance, did not consume significant amount of computing resources. The computing resources referred here are the CPU and memory resources on the database server nodes. The maximum CPU utilization on Oracle Database Appliance server nodes during testing was less than 35%, while consumed and available memory was sufficient and remained fairly constant. The resource consumption on the web and logic tiers was relatively very significant. On the EnterpriseOne Logic Server, the interactive workload was responsible for about 5% of resource consumption while the batch job resulted in 95% of the consumed CPU and memory resources. This was expected.
Test results
Before describing the test results it is important to note the following details as these details should help understanding of the test results.
Validation testing
The setup of Oracle JD Edwards EnterpriseOne was successfully performed using standard installation and configuration processes. Performance and stress testing was also successfully performed using the standard Day-in-the-Life (DIL) kit. The standard installation and configuration process, as tested, included the following:
1. Verification of minimal technical requirements a. Oracle Database Server and Oracle Client software b. Java JRockit

Oracle Database Appliance characterization with JD Edwards EnterpriseOne
8
c. WebLogic Server software d. EnterpriseOne software e. EnterpriseOne Deployment Server
2. Installation and validation of the Deployment Server, Server Manager 3. Application of Planner ESU and upgrade of Deployment Server Tools version to
8.98.4.9 4. Performing EnterpriseOne PORTTEST 5. Upgrade of EnterpriseOne Tools version to 8.98.4.9 (Base installation is 9.0 with
Tools Release 8.98.4) on the EnterpriseOne Logic Server using Server Manager 6. Installation and Configuration of Java JRockit and WebLogic Server 7. Implementation of EnterpriseOne Tools 8.98.4.2 on the WebLogic cluster
configuration 8. Validation of web connectivity by accessing the EnterpriseOne application
through the URL 9. Testing and validation of a number of EnterpriseOne interactive applications and
completing the initiation of a batch process 10. Performing an EnterpriseOne update package build and deploy 11. Performing an EnterpriseOne full package build and deploy 12. Re-testing the EnterpriseOne interactive applications and batch case scenarios
after the EnterpriseOne software upgrade The Oracle database was expanded to simulate a real-world customer database. The database configuration was modified to ensure both the interactive and batch processes functioned as expected. Two hundred different unique users were created and used during the interactive user tests to simulate the environment of an average EnterpriseOne customer.
Performance metrics
The key metrics collected during testing were average end-user response time as well as average CPU and average memory resource consumption at operating system level on all tiers.
Average end-user response time – LoadRunner
The average end-user response time was the main performance metric collected by the LoadRunner controller to measure changes in workload execution efficiency. The 16 LoadRunner scripts driven by the controller simulated five of the major modules in the EnterpriseOne application. The average end user response time metric reported in this white paper is a composite average of the 16 LoadRunner metrics (interactive workload). This metric were used to characterize the EnterpriseOne applications’ performance on the Oracle Database Appliance.
Operating System CPU and memory metrics
Oracle Database Appliance characterization with JD Edwards EnterpriseOne
9
The operating system metrics, CPU utilization, memory utilization, disk I/O, and network statistics, typically provide other valuable measures of system performance. Operating systems metrics reported in this document are the operating system resource utilizations. They help gauge the utilization of resources across the deployed architecture and the capacity to execute additional work. The primary operating system metrics used for EnterpriseOne applications characterization were CPU and Memory utilization. Additional metrics such as disk I/O, network I/O, etc. were collected but these did not present a bottleneck or concern and were not considered key to overall performance and operational characterization.
Load testing
Please note that, in the workload mix documented in this white paper, “users” represent interactive users and “UBE” (universal batch engine) represent batch jobs. Terminology Reference Workload Type
Users Interactive Workload UBE (Universal Batch Engine) Batch Workload
Table 4 - Interactive and batch workloads - terminology
Load testing was performed to characterize the performance of Oracle Database Appliance system over an increasing user workload. Two different Oracle Database Appliance configurations were used for different rounds of testing. These were the configurations corresponding to the “VERY SMALL” and “MEDIUM” database sizing templates available with Oracle Database Appliance. Load testing was performed in a single instance database configuration environment as well as the clustered database environment. The single database instance environment consisted of the database instance running on only one of the two server nodes available within the Oracle Database Appliance. The clustered database environment consisted of Oracle Real Application Clusters (RAC) database instances running concurrently on each of the two server nodes within the Oracle Database Appliance. Database Template (Size) Attributes
VERY SMALL (RAC) 2 CPU Cores per Node, 8GB Memory, 136GB Database MEDIUM (RAC) 4 CPU Cores per Node, 32GB Memory, 546GB Database VERY SMALL (Single Instance)
2 CPU Cores total, 8GB Memory, 136GB Database
MEDIUM (Single Instance) 4 CPU Cores total, 32GB Memory, 546GB Database
Table 5 - Oracle Database Appliance – configurations used for testing

Oracle Database Appliance characterization with JD Edwards EnterpriseOne
10
The configuration of how the interactive users processed transactions was consistent across all tests performed with different user volumes. The configuration of how the UBEs processed batch jobs was consistent across all tests performed with different user volumes. The difference in performance and resource consumption measurements across different tests is thus a result of the server’s ability to process the given workload and perform the necessary work and not due to inefficiencies introduced by differences in configuration. The duration of each performance test was 30 minutes. The workload ramp up time was taken into account when starting the window of measurement. The operating system statistics collection and EnterpriseOne statistics gathering corresponds to the window when all users were running and all UBEs were fully submitted. Tests were run in two database configurations, namely - one RAC node and two RAC nodes. The tests were performed with using a single node of Oracle Database Appliance and then the same test was repeated with both server nodes up in a clustered (RAC) configuration. The results refer to these two configurations as “one RAC node” and “two RAC nodes” configurations.
Increasing user workload – OS metrics
The purpose of interactive user load testing was to determine the base scalability and stability of Oracle Database Appliance configuration with increasing EnterpriseOne applications interactive user workload. Due to middle tier server limitations testing was performed up to 400 users only. It is likely that the EnterpriseOne applications workload would continue to scale on Oracle Database Appliance, if this external resource limitation was removed. The data shown on the following charts represents the data collected during the testing runs of the DIL kit workload with increasing user loads on the Oracle Database Appliance configuration.
End-user response time
For almost all of the tests conducted, Oracle Database Appliance provided, on average, sub-second response time in terms of end user experience. Concurrent Users ���� 50 100 200 400
User Load with UBEs Very Small - One Node 0.234 0.260 0.402 2.060 Very Small - Two Nodes 0.224 0.265 0.340 0.478 Medium - One Node 0.259 0.252 0.401 1.846 Medium - Two Nodes 0.280 0.241 0.363 1.111 User Load Only Very Small - One Node 0.098 0.081 0.104 0.283 Very Small - Two Nodes 0.114 0.1 0.117 0.278
Oracle Database Appliance characterization with JD Edwards EnterpriseOne
11
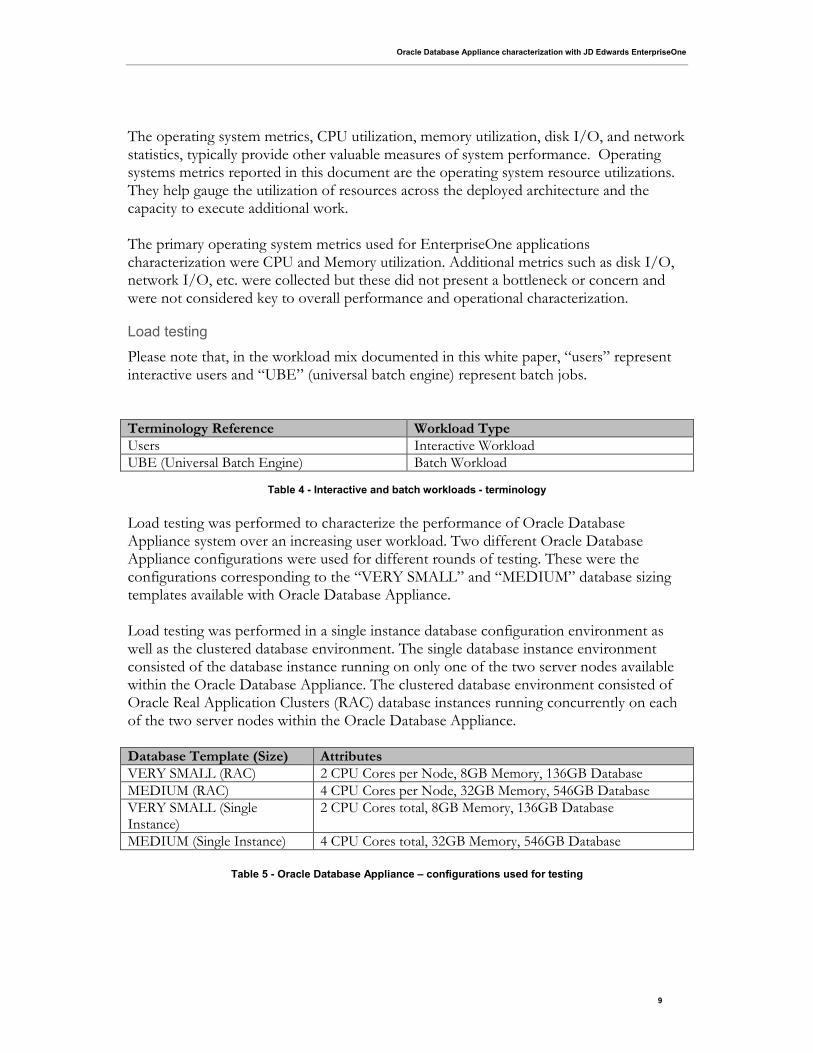
Medium - One Node 0.094 0.094 0.105 0.214 Medium - Two Nodes 0.106 0.104 0.129 0.195
Table 6 - End-user average response time for increasing concurrent users
The above metrics show that as concurrent user volume increase, in both interactive only and interactive plus batch workload execution scenarios, the end-user response time increased. However, the end-user response time remained within an acceptable limit (sub-second) for all but one 400 user scenario. For the 400 user scenario, the response time exceeded the 1 second range. There was an anomaly in this end-user response time observations. For the VERY SMALL database configuration the end-user response time was better than the MEDIUM database configuration. This was found to be due to a high level of resource consumption (and periodic saturation) at the LOGIC tier of the deployed test architecture.
Transactions per minute
Transactions per minute were measured for concurrent interactive user workload running by itself as well as for concurrent execution of interactive user workload and batch workload (UBEs). The following data illustrates that transactions per minute increased linearly (while maintaining reported performance levels) as workload increased.
Concurrent Users 50 100 200 400
User
Very Small - One Node 38 73 138 251 Very Small - Two Nodes 39 76 140 260
User & UBE
Very Small - One Node 37 72 135 218 Very Small - Two Nodes 36 75 136 219
User
Medium - One Node 39 76 142 269 Medium - Two Nodes 39 76 143 274
User & UBE
Medium - One Node 38 75 142 220 Medium - Two Nodes 36 72 135 233
Table 7 - Transactions per minute
Total UBEs (batch) processed
Batch jobs processing rate was measured as user volume was increased in both single node and two node configurations. As interactive workload increased fewer UBE batch

Oracle Database Appliance characterization with JD Edwards EnterpriseOne
12
jobs were processed, while maintaining acceptable execution time. In these sets of observations also, an anomaly was observed where more UBE batch jobs were processed in the VERY SMALL configuration than in the MEDIUM configuration.
Concurrent Users 50 100 200 400
Very Small - One Node 1624 1500 1262 1022
Very Small - Two Nodes 1501 1428 1162 1008
Medium - One Node 1620 1512 1218 940
Medium - Two Nodes 1477 1386 1162 845
Figure 8 - Total UBEs processed (with concurrent users)
Oracle Database Appliance resource utilization
Average CPU consumption on Oracle Database Appliance
The CPU consumption levels on Oracle Database Appliance were, in general, observed to be relatively low during the workload testing. The maximum CPU utilization rate observed was less than 35% when using the VERY SMALL configuration and below 15% when using the MEDIUM configuration.
Concurrent Users 50 100 200 400
Very Small Template
User-One Node 13.990 14.330 17.530 18.990 User-Two Nodes 10.930 11.670 13.970 16.310
User & UBE-One Node 33.080 34.000 32.610 32.410 User & UBE-Two Nodes 23.200 22.185 22.040 22.895
Medium Template
User-One Node 6.140 6.870 7.950 10.020 User-Two Nodes 5.575 5.830 6.630 7.870
User & UBE-One Node 15.450 14.940 15.450 15.230 User & UBE-Two Nodes 10.300 10.210 10.440 10.575
Figure 9 - Average CPU consumption on Oracle Database Appliance during DIL Kit Execution

Oracle Database Appliance characterization with JD Edwards EnterpriseOne
13
Average memory consumption on Oracle Database Appliance
The average memory consumption on Oracle Database Appliance was observed to be as follows. Note that, the memory consumption is not variant, as expected.
Concurrent Users 50 100 200 400
Very Small Template User-One Node 58.170 58.680 59.700 61.650
User-Two Nodes 57.600 57.880 58.360 59.280
User & UBE-One Node 59.520 59.730 60.760 62.460
User & UBE-Two Nodes 58.140 58.460 58.900 60.200
Medium Template User-One Node 57.930 58.570 59.670 61.590
User-Two Nodes 57.900 58.280 58.490 59.515
User & UBE-One Node 58.990 59.650 60.560 62.850
User & UBE-Two Nodes 57.890 58.085 58.835 59.840
Figure 10 - Average memory consumption on Oracle Database Appliance server nodes
EnterpriseOne server resource utilization
EnterpriseOne server average CPU consumption
The EnterpriseOne server performance showed that it was a constraining factor in the testing architecture. As the data below illustrates, execution of UBEs caused an immediate escalation in CPU consumption at the EnterpriseOne server layer, while the interactive user workload had minimal impact on CPU consumption at this layer.
Concurrent Users 50 100 200 400
Very Small Template User-One Node 3.100 5.630 12.140 27.180
User-Two Nodes 2.810 5.290 11.560 33.780
User & UBE-One Node 96.700 96.720 96.730 96.740
User & UBE-Two Nodes 96.400 96.570 96.700 96.730
Medium Template

Oracle Database Appliance characterization with JD Edwards EnterpriseOne
14
User-One Node 3.081 5.450 11.730 33.990
User-Two Nodes 2.850 5.420 11.960 33.720
User & UBE-One Node 96.760 96.760 96.760 96.780
User & UBE-Two Nodes 95.980 96.260 96.370 96.760
Figure 11 - Average CPU consumption on EnterpriseOne server
EnterpriseOne Server average memory consumption
Memory consumption at the EnterpriseOne server was significant during the testing, although it was not a limiting factor.
Concurrent Users 50 100 200 400
Very Small Template User-One Node 45.660 54.160 60.900 74.930
User-Two Nodes 38.220 45.440 53.410 73.140
User & UBE-One Node 47.960 54.810 63.670 79.760
User & UBE-Two Nodes 61.570 66.340 75.520 92.560
Medium Template User-One Node 44.670 51.680 63.180 81.780
User-Two Nodes 51.610 60.070 63.270 86.000
User & UBE-One Node 64.420 69.800 77.930 91.750
User & UBE-Two Nodes 61.060 65.370 80.170 92.440
Figure 12 - Average memory consumption on EnterpriseOne server
Web Server resource utilization
Web server CPU utilization
CPU utilization at the web server layer was relatively low and was not a limiting factor.
Concurrent Users 50 100 200 400
Very Small Template User-One Node 10.060 14.140 24.570 34.250
User-Two Nodes 10.610 13.700 25.540 54.900
User & UBE-One Node 9.310 16.290 23.350 39.130
User & UBE-Two Nodes 11.120 16.110 24.080 36.700
Medium Template User-One Node 10.030 15.340 24.400 51.410
Oracle Database Appliance characterization with JD Edwards EnterpriseOne
15
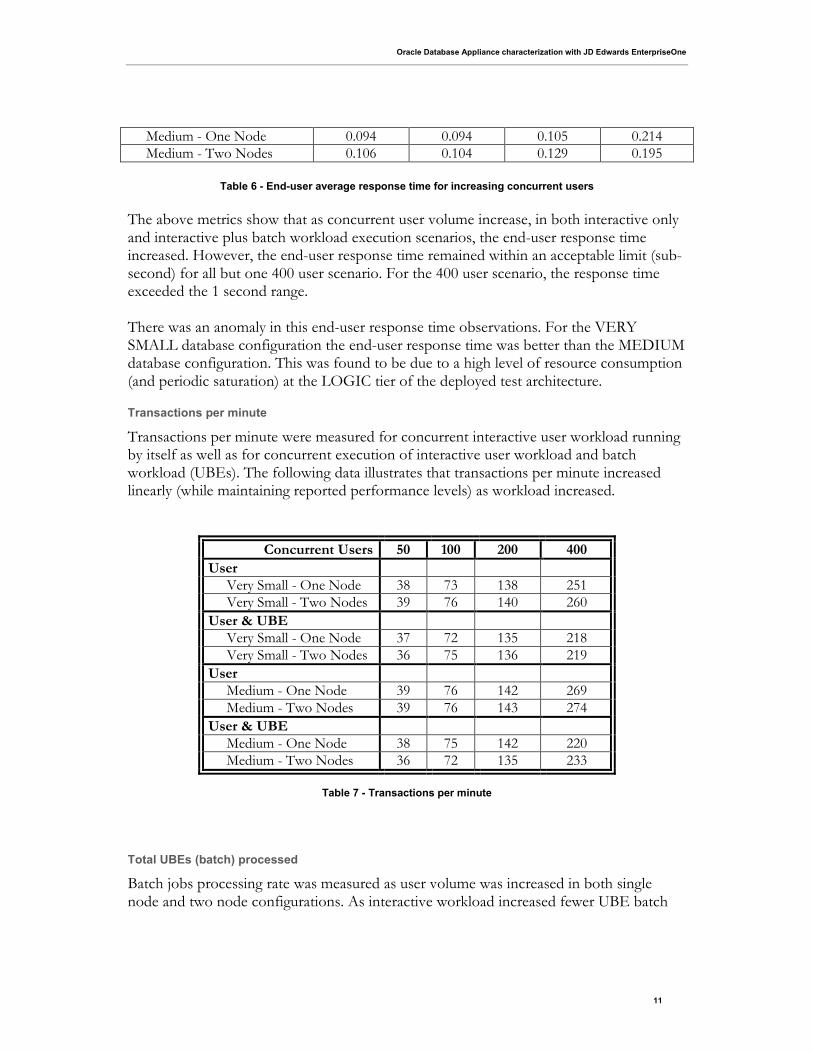
User-Two Nodes 9.620 17.840 25.810 51.080
User & UBE-One Node 9.420 12.700 16.180 35.610
User & UBE-Two Nodes 10.310 11.640 23.360 43.370
Figure 13 - Average CPU Consumption on web server
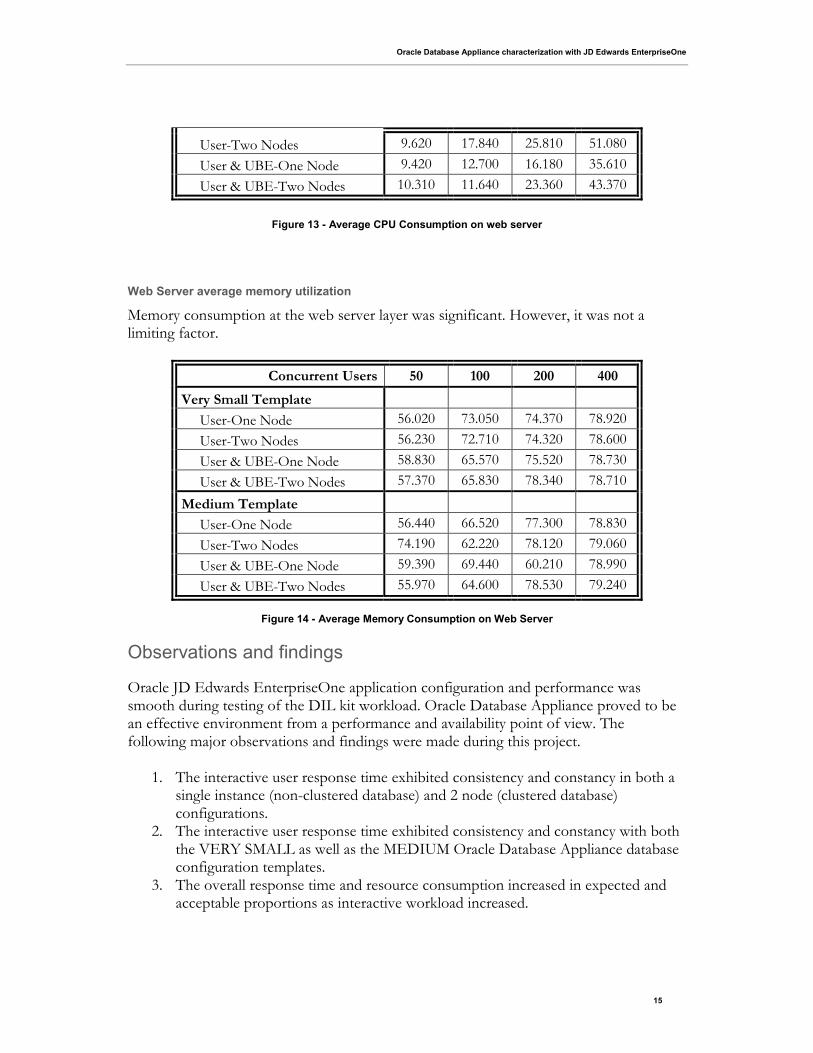
Web Server average memory utilization
Memory consumption at the web server layer was significant. However, it was not a limiting factor.
Concurrent Users 50 100 200 400
Very Small Template User-One Node 56.020 73.050 74.370 78.920
User-Two Nodes 56.230 72.710 74.320 78.600
User & UBE-One Node 58.830 65.570 75.520 78.730
User & UBE-Two Nodes 57.370 65.830 78.340 78.710
Medium Template User-One Node 56.440 66.520 77.300 78.830
User-Two Nodes 74.190 62.220 78.120 79.060
User & UBE-One Node 59.390 69.440 60.210 78.990
User & UBE-Two Nodes 55.970 64.600 78.530 79.240
Figure 14 - Average Memory Consumption on Web Server
Observations and findings
Oracle JD Edwards EnterpriseOne application configuration and performance was smooth during testing of the DIL kit workload. Oracle Database Appliance proved to be an effective environment from a performance and availability point of view. The following major observations and findings were made during this project.
1. The interactive user response time exhibited consistency and constancy in both a single instance (non-clustered database) and 2 node (clustered database) configurations.
2. The interactive user response time exhibited consistency and constancy with both the VERY SMALL as well as the MEDIUM Oracle Database Appliance database configuration templates.
3. The overall response time and resource consumption increased in expected and acceptable proportions as interactive workload increased.
Oracle Database Appliance characterization with JD Edwards EnterpriseOne
16
4. All of the testing was performed using a single Java Virtual Machine (JVM). 5. All tests were performed using dedicated connections to the Oracle database. 6. As workload increased, the PROCESSES parameter in the database configuration
was a limiting factor in both the VERY SMALL and MEDIUM configurations, and was increased from the default value to a value to 3000. The maximum number of processes invoked during testing was 1256 and thus a lower value of the PROCESSES parameter may have been adequate.
7. The OPEN_CURSORS parameter was increased from the default value to a new value of 5000. The maximum number of open cursors observed was less than 2500. A value of 2500 would have been adequate.
8. Certain minor anomalies were observed during testing. These were a result of resource limitations on the EnterpriseOne server.
Conclusion
Oracle Database Appliance proved to be a powerful, highly available, ready to deploy database solution for running Oracle JD Edwards EnterpriseOne applications. The pre-built, pre-tuned nature of Oracle Database Appliance made the process of deployment rapid and flawless. The default configurations as enabled by the pre-built database configuration templates were adequate except for two minor changes. These changes allowed for generating significantly more horse power out of the default configurations. Unleashing additional workload caused the middle tier to become a bottleneck, although Oracle Database Appliance appeared willing to take additional workload. The response time and throughput of the test workloads was adequate and well within acceptable limits. A couple of minor anomalies observed during the testing can be attributed to the insufficient resource availability of the EnterpriseOne server. Users should perform a complete end to end exercise in order to remove any such bottlenecks proactively.

Oracle Database Appliance: Characterization
with JD Edwards EnterpriseOne
January 2013
Author(s): Bill Spinuzzi, Ravi Sharma
Contributing Authors: Ruggero Citton, AJ
Schifano, Bob Stravinsky
Oracle Corporation
World Headquarters
500 Oracle Parkway
Redwood Shores, CA 94065
U.S.A.
Worldwide Inquiries:
Phone: +1.650.506.7000
Fax: +1.650.506.7200
oracle.com
Copyright © 2012, Oracle and/or its affiliates. All rights reserved. This document is provided for information purposes only and the
contents hereof are subject to change without notice. This document is not warranted to be error-free, nor subject to any other
warranties or conditions, whether expressed orally or implied in law, including implied warranties and conditions of merchantability or
fitness for a particular purpose. We specifically disclaim any liability with respect to this document and no contractual obligations are
formed either directly or indirectly by this document. This document may not be reproduced or transmitted in any form or by any
means, electronic or mechanical, for any purpose, without our prior written permission.
Oracle and Java are registered trademarks of Oracle and/or its affiliates. Other names may be trademarks of their respective owners.
Intel and Intel Xeon are trademarks or registered trademarks of Intel Corporation. All SPARC trademarks are used under license and
are trademarks or registered trademarks of SPARC International, Inc. AMD, Opteron, the AMD logo, and the AMD Opteron logo are
trademarks or registered trademarks of Advanced Micro Devices. UNIX is a registered trademark licensed through X/Open
Company, Ltd. 0112

![JD Edwards World Upgrade Guide - Oracle · [1]JD Edwards World Upgrade Guide Release A9.4 E58799-01 April 2015 Describes how to upgrade JD Edwards World software to JD Edwards World](https://img.pdfslide.us/doc/110x75/60296dee0b634579170bce18/jd-edwards-world-upgrade-guide-oracle-1jd-edwards-world-upgrade-guide-release.jpg)