Embed Size (px)
Citation preview
Options for Steam Efficiency
22nd February 2010
Datta Kuvalekar

SFC in Process Industry & our role
‐ Undertook a study across industry segments to establish “ Best”& Average for Specific Fuel Consumption & utilities. Published the study in association with CII in 2003‐04.
‐ Identified the opportunities for savings in each of the IndustrySectors factually.
Establishing the Current data to create awareness is key!

Benchmarks : Utility consumptionAs per the study we conducted in 2003‐04
Industry Fuel:Percentage
saving from Avg to Best in sample
Electricity:Percentage saving form Avg to Best
in sample
Water:Percentage
saving from Avg to Best in sample
Brewery 25 35 13
Tyre 22 13 40
Textile 54 77 85
Paper 44 60 90

Benchmarks: SFC
Industry Units Best Average Worst
Brewery FO Lit/KL Beer 44 58 75
Tyre FO Kg/Ton Finished Tyre 162 210 353
Textile Coal Kg/ 1,000 Mts 168 390 666
Paper* Coal Kg/Ton Paper 230 408 574
SEP Soya Coal Ton / Ton Seed Crushed 47 70 93
SEP Rice Bran Husk Ton / Ton Seed Crushed 100 115 124
Hotels Boiler Fuel Lt x 10/OR 9 30
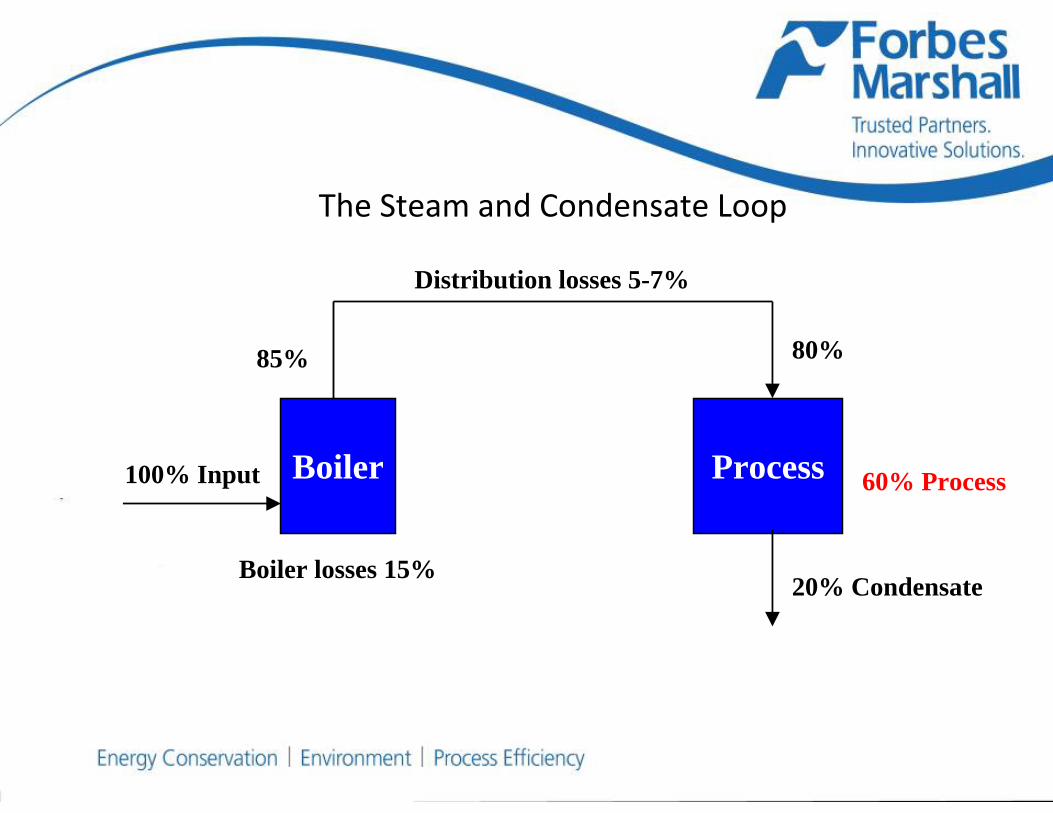
The Steam and Condensate Loop
Boiler100% Input Process
Distribution losses 5-7%
85% 80%
Boiler losses 15%20% Condensate
60% Process

Factors affecting SFC
Going ahead with the exercise of benchmarking, the potential of savings in a plant were distributed into:
- Steam Generation - Distribution & utilization- Condensate & Flash Recovery - Capacity Utilisation
This enabled to identify priorities to bridge the gap for each Industry and we published the 2nd Study in 2004-05 in association with CII.

Going Ahead
‐ Worked with plants in each industry Segment to:
1. Spread Awareness.
2. Share knowledge & established solutions to improve averages.
3. Come up with innovative solutions to bridge gaps to set a new benchmark in Specific Fuel consumption.

Benchmarks: Brewery
As per the CII Forbes Marshall Study(2004‐05) in Brewery
Best SFC: 41FO Lt/KL Beer Avg SFC: 58FO Lt/KL Beer
We have worked jointly with the Industry groupsand have audited and / or consulted 24 Breweries.

Brewery: Potential
Savings potential 2.5% 1.5%
7%13.5%
Condensate & Flash recoverySteam distribution & UtilizationSteam GenerationCapacity Utilization
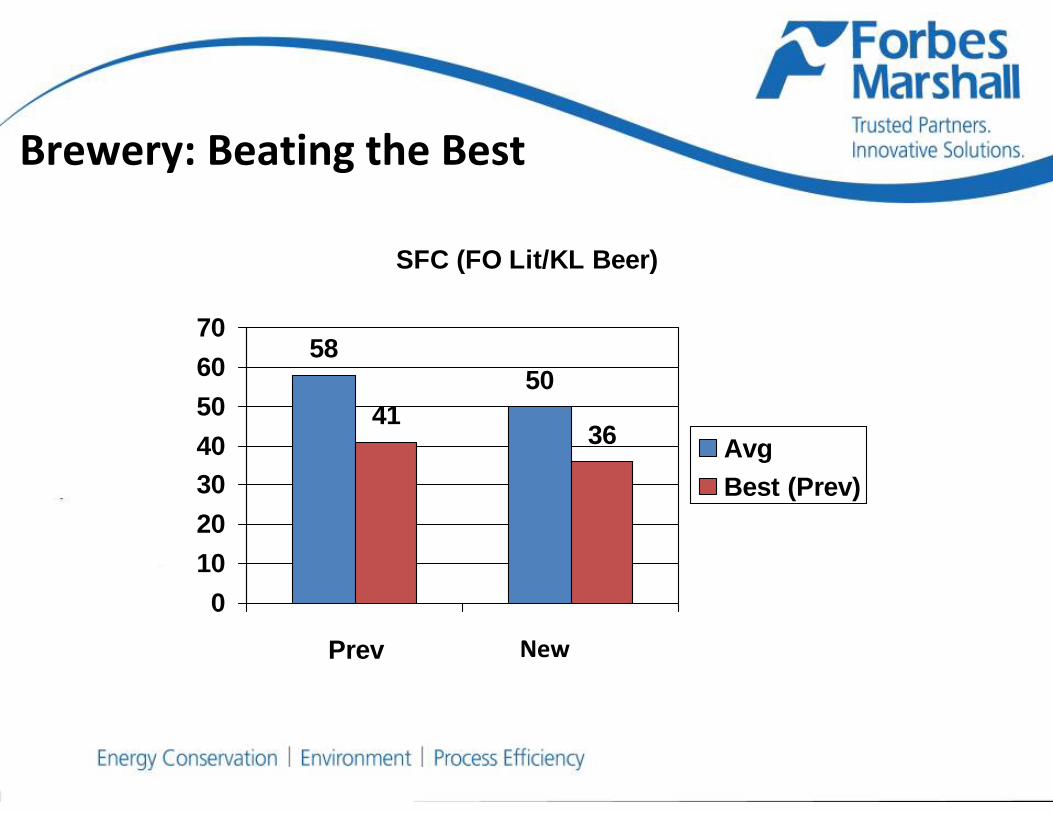
Brewery: Beating the Best
SFC (FO Lit/KL Beer)
5850
4136
010203040506070
Prev
AvgBest (Prev)
New

Case: Brewery
At a Brewery in South of India,
1. SFC improved from 52 Lt/KL Beer to 48 and then to 36. 2. Boiler efficiency improved from 79% ‐ 84% 3. O2 maintained in range of 4% and improved from 7‐11%.4. Feedwater temp raised by 15’c5. Recovered 11,000 kg of condensate and later bettered it to
14,000 kgs.6. Reduced blowdown steam loss by 100kg/day.

Benchmarks: Paper
As per the CII Forbes Marshall Study(2004‐05) in Paper industry Best SSC: 1.5 ton (steam)/ ton Avg SSC: 1.9 ton (steam)/ton
We have worked jointly with the Industry groups and our systems are running in 139 paper industries.

Paper: Potential
Savings potential
10%
3%8%
15%
Steam Generation Distribution Condensate & Flash Recovery Utilization

Beating the Best: Paper
SFC (Ton Steam/Ton Paper)
1.9 1.771.5 1.4
0
0.4
0.8
1.2
1.6
2
Prev New
AvgBest (prev)

Case: Paper
In case of a Paper plant in Nashik, by continuous partnership,1. In 2004: SSC 2.2 Production 25TPD
‐ Supplied a BTC, Production improves to 30TPD and SSC to 1.65
2. In 2005: Implemented ‘Online Boiler Efficiency Monitoring’ and CRS‐ Feedwater temp improves from 70 to 87’C‐ Improve boiler operation and monitoring helps decide the fuel mix
SOP to extract best efficiencies constantly.
3. Plant expands. Pre‐drier group of 4 cylinders with one more independent TC system added. Production raises to 40TPD
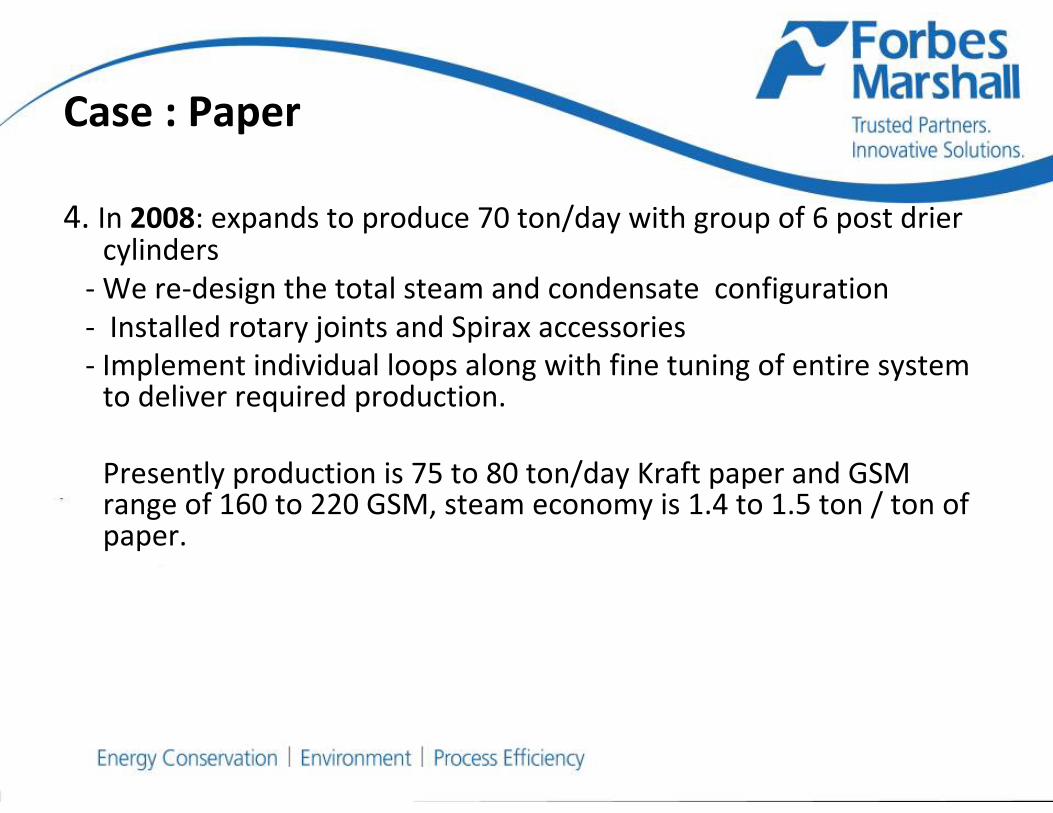
Case : Paper
4. In 2008: expands to produce 70 ton/day with group of 6 post drier cylinders
‐We re‐design the total steam and condensate configuration‐ Installed rotary joints and Spirax accessories ‐ Implement individual loops along with fine tuning of entire system to deliver required production.
Presently production is 75 to 80 ton/day Kraft paper and GSM range of 160 to 220 GSM, steam economy is 1.4 to 1.5 ton / ton of paper.

Benchmarks: Starch
At a Starch Plant in Maharashtra,
1. 55TPD production (200TPD installed)
2. Total savings : Rs. 20.21 lakhs/annum on a fuel bill of 122 lakhs. % Savings : 16.56%
3. 200kg/hr of flash steam being utilized due to Thermo‐compressor based system.

Starch: Potential
Savings potential 7%
13.5%
7%
Condensate & Flash recoverySteam distribution & UtilizationSteam Generation


Benchmarks :Tyre
As per the CII Forbes Marshall Study in Tyre IndustryBest SFC: 162kg FO/KL Avg SFC: 210FO kg/KL
Forbes Marshall is currently in the process of conducting energyaudits for major Tyre groups & partnering them to improve fuel efficiency in India & Sri Lanka.

Tyre: Potential
Savings potential
7%
7%
9%
Condensate & Flash recoverySteam distribution & UtilizationSteam Generation

Beating the Best: Tyre
SFC(FO Kg/Ton Finished Tyre)
210190
162140
0
50
100
150
200
250
Previous Current
Avg SFCBest SFC

Case: Tyre
At a Tyre plant in Maharashtra,
1. SFC of 187FO kg/ton rubber improved to 167
2. Plant processes 62MT of rubber/day
3. Feedwater temperature of 96’ C


Benchmarks: Textile (Tirupur)
As per the CII Forbes Marshall Study(2004‐05) in Textile Industry in Tirupur cluster,
Best SFC: 1.57kg wood/kg cloth Avg SFC: 2.75
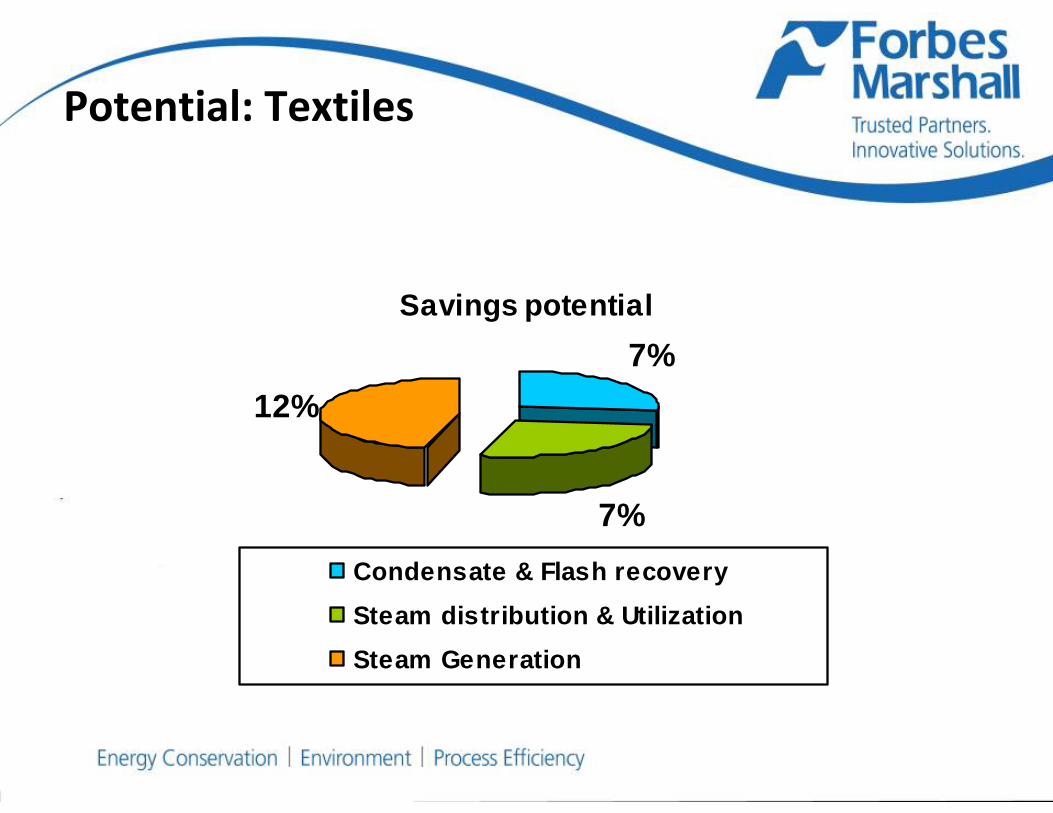
Potential: Textiles
Savings potential 7%
7%
12%
Condensate & Flash recoverySteam distribution & UtilizationSteam Generation

Benchmarks: Textile (Tirupur)
SFC(Firewood Kg/ Kg)
1.461.57
2.26
2.75
0
0.5
1
1.5
2
2.5
3
Prev New
BestAvg
Apart from Tirupur, FM has audited 100+ textile processing plants & similarly partnered clusters in Burhanpur, Pali, Ludhiana, Bhilwara, Panipat, Surat.

Benchmarks : SEP
As per the CII Forbes Marshall Study(2004‐05) in SEP IndustryBest SFC: 100 kg husk/ton seed Avg SFC: 115
FM involvement in Nagpur SEP plants has improved the Best to 80 & average to 110

SEP: Potential
Savings potential to bridge the gap
7.5%
3.5%3%
12%
Steam Generation Distribution & utilizationCondensate & Flash Recovery Capacity Utilization

Beating the Best:SEP
Rice Bran SFC (Husk Ton / Ton Seed Crushed)
61
100111115
0
20
40
60
80
100
120
140
Prev New
BestAvg
Soya SFC(Coal Ton / Ton Seed Crushed)
4747
5863
0
10
20
30
40
50
60
70
Prev N ew
BestAvg

Benchmarks : SEP
Plants Customers having
No FM Influence
Customers having trapping and condensate system designed
by FM
Customer having entire steam & condensate systems
designed by FM
Rice Bran
Kg husk/ton 142 100 80
Soya
Kg husk/ton 88 66 47

Benchmarks: Pharma
In the Forbes Marshall CII Study 2004‐05, we tried to benchmark the Pharma sector. However a true benchmark in this sector cannot be created as :
1. The processes vary with formulations.
2. The variation in the bulk drugs

Pharma: Potential
Savings potential 4%
5%4%
8%
Steam Generation Distribution & utilizationCondensate & Flash Recovery Steam trapping

Pharma: Potential
1. Gap between direct & indirect boiler efficiency
a. On‐Off operation is frequent
b. Running of Boiler on Low loads
c. Low feedwater temp.
The avg Direct efficiency in the sector is 72.4 and avg indirect efficiency is 77.5%


Pharma: Potential
2. Gap between theoretical & actual steam consumption
a. Supply steam pressure variationb. Improper trap selection & by‐pass kept openc. Air venting provision manuald. Steam flow control manual
Pharma: Potential
3. Incorrect steam trapping:
Only 35% of the traps selected in the industry are correct
4. The CRF in the sector varies from 0% ‐ 60%a. Multi utility reactor jackets – fear of condensate
contamination
b. Captive consumption

Coil vs. Shell
The CII Forbes Marshall study (2004‐05) on the comparison of coil type and 3pass wet back smoke tube boilers reveals:
1. The efficiency of the coil type boiler ranges from 65‐76% where as the shell type has 83‐84%
2. The dryness fraction of the coil type is in range of 50‐70%
3. The poor quality of steam also leads to extended batch timings.
4. Condensate return is not possible in coil type boilers due to limitations of positive displacement pump.

Coil vs. Shell
A study on the comparison of coil type and 3pass wet back smoke tube boilers reveals:
Parameter Coil Boiler
3 pass wet back Smoke tube Shell
BoilerImpact
Efficiency 65 – 76% 83 – 84% Reduced fuel bill
Dryness Fraction
50‐70% 98% Reduced process time
Condensate return
Drained because of temp limitations of
positive displacement pump
Achieved Reduces fuel consumption by
about 10%

Coil vs. Shell
At a soft drinks manufacturing plant in Nagpur,
Parameter Unit Before
(Coil Boiler)
After(3 pass wet back Smoke tube Shell
Boiler)
Boiler capacity Kg/Hr 3 x 600 2000 x 1
Efficiency % ‐ 89
Dryness fraction % 60 98
Fuel consumption Litres/ Annum 1.74 lacs 1.2 lacs
A saving of Rs.36,00,000/yr!

Coil vs. Shell
At a bottling plant in Goa,
Parameter Before
(Coil Boiler)
After(3 pass wet back Smoke
tube Shell Boiler)
Boiler Capacity 600 kg/hr x 3 2000 kg/hr x 1
Fuel Furnace Oil Furnace Oil
Condensate Recovery Nil 100 %
Feed Water Temperature Ambient 50’C (5KL FWT not insulated)
Bottles produced per minute BPM
340 500
SFC (Lit of FO per case of beverage)
0.1 0.065 –0.075
A savings of Rs.12,00,000/ yr!

Coil vs. Shell
At a Cattle feed and Poultry feed manufacturing plant in Maharashtra, the present production capacity is 40,000 Tons of product annually.
Parameter Before
(Coil Boiler)
After(3 pass wet back Smoke
tube Shell Boiler)
Boiler Capacity 1 x 400 kg/hr + 1 x 300 kg/hr
750 kg/hr
Fuel LDO FO
Efficiency (NCV) 75 % 89 %
Dryness Fraction 50 % 98 %
Line Traps Absent TD traps
Production Capacity 40, 000 Tons 46,000 Tons

Coil vs. Shell
• Conversion from Coil to Shell, caused a reduction in specific fuel consumption and thereby increased the production form 40,000 to 46,000.
• The production cost per ton of product improved from Rs93 to Rs58.
• Due to better quality of product (because of better steam), the power consumption reduced by 4 kWh per ton of product, = saving of Rs 16 per ton of product.
• Annual Monetary Savings = Rs.20,40,000 /‐

Numbers Speak
Our efforts in reducing the average SFC across sectors have yielded quantum fuel savings. For instance,
‐ 1 Crore Litres of Furnace Oil in the Breweries in India
‐ 1.5 Crore Kgs of rice husk in the SEP (Rice Bran) in India
‐ 35,000 tonnes of wood in the textile cluster of Tirupur

“Real”ized savings across plants
Many more sectors , Many more industries
Food, Dairy, Distillery:McCain, Cadbury, Nutrine, Perfetti, Tilaknagar Distilleries, Metro dairy, …
Starch : Anil Starch, Maize Products, Sahyadri Starch, Riddhi Siddhi, …
Oil & Petro: RIL, IOCL, BPCL, HPCL, BRPL, IPCL, Essar, MRL,..
Fertilizers: RCF, Deepak fertilizer, MCF, NFL,KRIBHCO, …

What it means in the end1. Monitoring helps in identifying the potential for savings and
sustaining it.
2. Everyday, companies focusing on steam energy conservation are saving Lakhs on their annual fuel bills.
3. In each of the sectors we have worked closely with the industry and raised the averages and improved benchmarks.

Partnering all the way
1. Spreading best practices to bridge the most common gaps‐ Right trap selection‐ Line sizing‐ Condensate recovery
2. Innovative solutions for improving the benchmarks.‐ Boiler efficiency monitoring‐ Recompression of Flash steam‐ Industry specific solutions. E.g. BrewMax
3. Sustain the best by managing the steam systems.
Awareness and Knowledge is key !

Thank You