Embed Size (px)
Citation preview
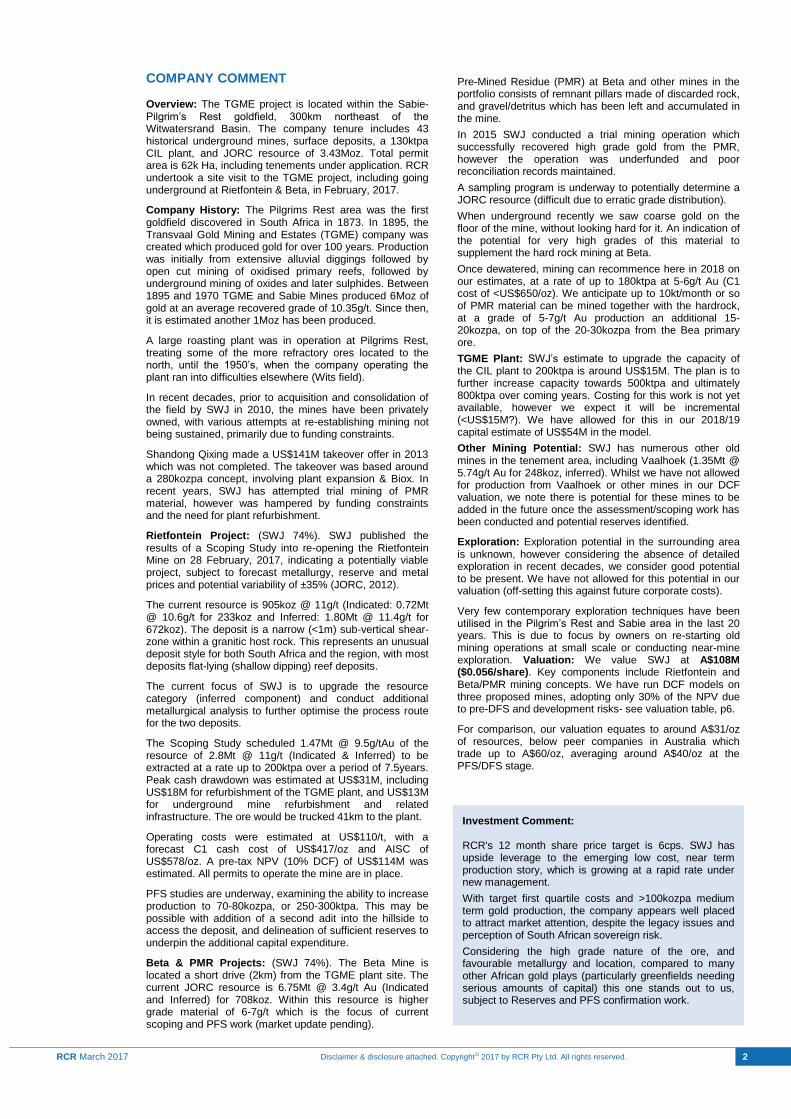
EQUITY RESEARCH
RCR March 2017 Disclaimer & disclosure attached. Copyright© 2017 by RCR Pty Ltd. All rights reserved. 1
INVESTMENT POINTS
Large and Growing Resource Base: (Feb '17) Recently upgraded JORC resource of 28.7Mt @ 3.72g/t Au for 3.43Moz. Rietfontein JORC resource of 2.55Mt @ 11g/t Au for 905koz.
Potential lowest quartile costs: Rietfontein Scoping Study (ASX release dated 28/02/2017) highlighted potential for a 60kozpa mine over 7.5 years at a cash cost of US$417/oz (C1).
Fully Permitted: All mines in the portfolio are fully permitted, and development ready subject to confirmation of reserves and funding (2H’17 target).
High operating margin: Rietfontein mine has a potential US$600/oz operating margin based on LOM forecast AISC of US$578/oz and US$1,200/oz gold price.
Multiple Mines: Strategy to bring multiple mines into production, feeding the central processing plant at TGME. The Beta Mine may commence first in 2018, including Pre-Mined Residue (PMR) followed by Rietfontein ore in 2019.
Low capital development: Pre-development capital estimated at Rietfontein of US$37M (US$31M peak funding anticipated in Scoping Study). This includes US$15M to refurbish the plant. Some additional capital will be required to re-start the Beta Mine.
EV/oz cheap on comparable metrics: Pre-development gold companies on the ASX trade on between US$20 to US$50/oz typically, hence with SWJ trading on <US$7/oz, this stands out as relatively undervalued to us.
COMPANY STATISTICS
Exporation/Development (A$M)
Corporate (A$M)
Exploration/(Expl.+ Corporate) (%)
Funding duration at current burn (years)
Shares on issue (pr end) (M shares)
Drilling - RAB/Aircore (m)
Drilling - RC/Diamond (m)
Land holding ('000 ha)*
Capital raisings (A$M)
Funding from JV partners (A$M)
Cash (A$M)
Cash backing (Ac/share)
* Tenements held and under application. Quarters refer to calendar year. Drill metres are RCR estimates.
0.1 0.6 0.2 0.8 5.0
0.2
0.0 0.0 0.0 0.0 0.0
0.0 0.0 0.0 0.0
8.000.17 0.60 4.51 6.51
62
0 0 0 0 2,000
62 62 62 62
0
1809 1942 640 1736 2192
0 0 0 0
0.7
320 55 56 0
5.00
Year End June Dec-16A Mar-17F FY'15A FY'16A
0.22 0.25 3.89 6.59
FY'17F
0.00 0.30 5.03 0.00 2.35
9 March 2017
SOUTH AFRICA
GOLD
DEVELOPMENT
EXCHANGE: ASX:SWJ
CAPITAL PROFILE
0.7
0.9
1.1
1.3
1.5
1.7
1.9
2.1
Share
Price (
cps)
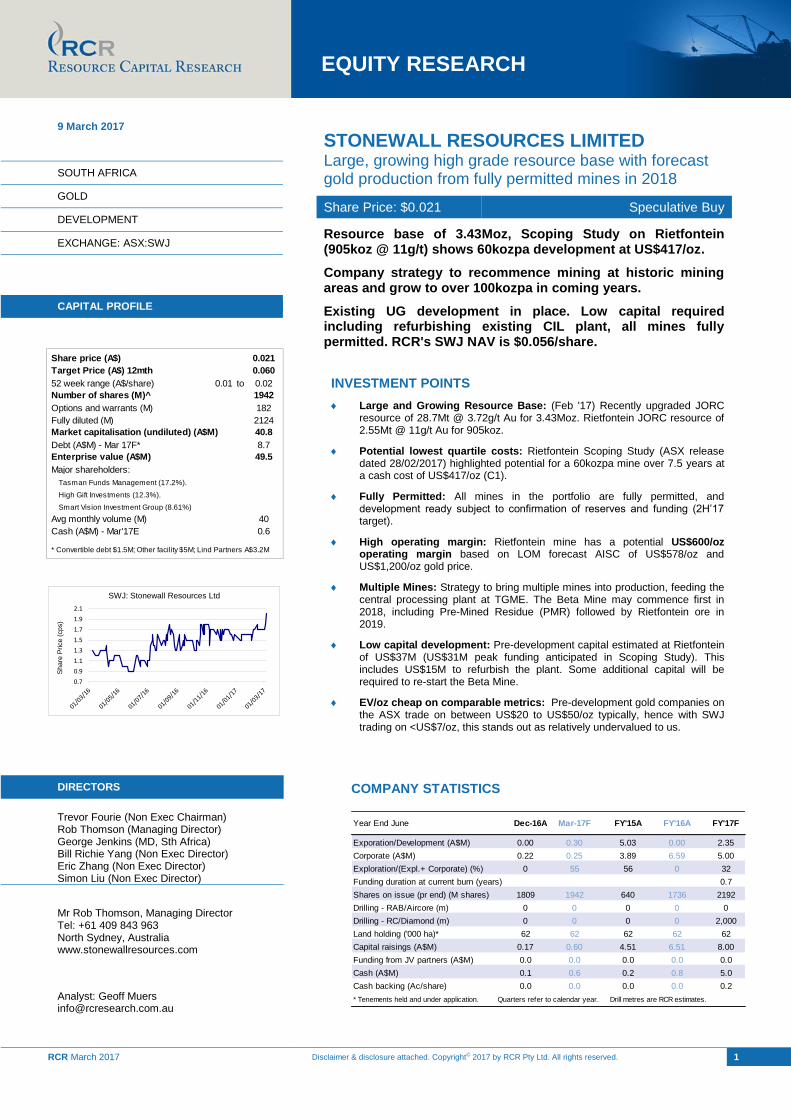
SWJ: Stonewall Resources Ltd
DIRECTORS
Trevor Fourie (Non Exec Chairman) Rob Thomson (Managing Director) George Jenkins (MD, Sth Africa) Bill Richie Yang (Non Exec Director) Eric Zhang (Non Exec Director) Simon Liu (Non Exec Director)
Mr Rob Thomson, Managing Director Tel: +61 409 843 963 North Sydney, Australia www.stonewallresources.com
Analyst: Geoff Muers [email protected]
Target Price (A$) 12mth
52 week range (A$/share) 0.01 to
Debt (A$M) - Mar 17F*
Enterprise value (A$M)
Tasman Funds Management (17.2%).
High Gift Investments (12.3%).
Smart Vision Investment Group (8.61%)
Avg monthly volume (M)
Cash (A$M) - Mar'17E
* Convertible debt $1.5M; Other facility $5M; Lind Partners A$3.2M
40
0.6
Fully diluted (M) 2124
Options and warrants (M) 182
0.060
Number of shares (M)^ 1942
Major shareholders:
Market capitalisation (undiluted) (A$M) 40.8
8.7
49.5
Share price (A$) 0.021
0.02
STONEWALL RESOURCES LIMITED Large, growing high grade resource base with forecast gold production from fully permitted mines in 2018
Share Price: $0.021 Speculative Buy
Resource base of 3.43Moz, Scoping Study on Rietfontein (905koz @ 11g/t) shows 60kozpa development at US$417/oz.
Company strategy to recommence mining at historic mining areas and grow to over 100kozpa in coming years.
Existing UG development in place. Low capital required including refurbishing existing CIL plant, all mines fully permitted. RCR's SWJ NAV is $0.056/share.
EQUITY RESEARCH
RCR March 2017 Disclaimer & disclosure attached. Copyright© 2017 by RCR Pty Ltd. All rights reserved. 2
COMPANY COMMENT Overview: The TGME project is located within the Sabie-Pilgrim’s Rest goldfield, 300km northeast of the Witwatersrand Basin. The company tenure includes 43 historical underground mines, surface deposits, a 130ktpa CIL plant, and JORC resource of 3.43Moz. Total permit area is 62k Ha, including tenements under application. RCR undertook a site visit to the TGME project, including going underground at Rietfontein & Beta, in February, 2017.
Company History: The Pilgrims Rest area was the first goldfield discovered in South Africa in 1873. In 1895, the Transvaal Gold Mining and Estates (TGME) company was created which produced gold for over 100 years. Production was initially from extensive alluvial diggings followed by open cut mining of oxidised primary reefs, followed by underground mining of oxides and later sulphides. Between 1895 and 1970 TGME and Sabie Mines produced 6Moz of gold at an average recovered grade of 10.35g/t. Since then, it is estimated another 1Moz has been produced.
A large roasting plant was in operation at Pilgrims Rest, treating some of the more refractory ores located to the north, until the 1950’s, when the company operating the plant ran into difficulties elsewhere (Wits field).
In recent decades, prior to acquisition and consolidation of the field by SWJ in 2010, the mines have been privately owned, with various attempts at re-establishing mining not being sustained, primarily due to funding constraints.
Shandong Qixing made a US$141M takeover offer in 2013 which was not completed. The takeover was based around a 280kozpa concept, involving plant expansion & Biox. In recent years, SWJ has attempted trial mining of PMR material, however was hampered by funding constraints and the need for plant refurbishment.
Rietfontein Project: (SWJ 74%). SWJ published the results of a Scoping Study into re-opening the Rietfontein Mine on 28 February, 2017, indicating a potentially viable project, subject to forecast metallurgy, reserve and metal prices and potential variability of ±35% (JORC, 2012).
The current resource is 905koz @ 11g/t (Indicated: 0.72Mt @ 10.6g/t for 233koz and Inferred: 1.80Mt @ 11.4g/t for 672koz). The deposit is a narrow (<1m) sub-vertical shear-zone within a granitic host rock. This represents an unusual deposit style for both South Africa and the region, with most deposits flat-lying (shallow dipping) reef deposits.
The current focus of SWJ is to upgrade the resource category (inferred component) and conduct additional metallurgical analysis to further optimise the process route for the two deposits.
The Scoping Study scheduled 1.47Mt @ 9.5g/tAu of the resource of 2.8Mt @ 11g/t (Indicated & Inferred) to be extracted at a rate up to 200ktpa over a period of 7.5years. Peak cash drawdown was estimated at US$31M, including US$18M for refurbishment of the TGME plant, and US$13M for underground mine refurbishment and related infrastructure. The ore would be trucked 41km to the plant.
Operating costs were estimated at US$110/t, with a forecast C1 cash cost of US$417/oz and AISC of US$578/oz. A pre-tax NPV (10% DCF) of US$114M was estimated. All permits to operate the mine are in place.
PFS studies are underway, examining the ability to increase production to 70-80kozpa, or 250-300ktpa. This may be possible with addition of a second adit into the hillside to access the deposit, and delineation of sufficient reserves to underpin the additional capital expenditure.
Beta & PMR Projects: (SWJ 74%). The Beta Mine is located a short drive (2km) from the TGME plant site. The current JORC resource is 6.75Mt @ 3.4g/t Au (Indicated and Inferred) for 708koz. Within this resource is higher grade material of 6-7g/t which is the focus of current scoping and PFS work (market update pending).
Pre-Mined Residue (PMR) at Beta and other mines in the portfolio consists of remnant pillars made of discarded rock, and gravel/detritus which has been left and accumulated in the mine.
In 2015 SWJ conducted a trial mining operation which successfully recovered high grade gold from the PMR, however the operation was underfunded and poor reconciliation records maintained.
A sampling program is underway to potentially determine a JORC resource (difficult due to erratic grade distribution).
When underground recently we saw coarse gold on the floor of the mine, without looking hard for it. An indication of the potential for very high grades of this material to supplement the hard rock mining at Beta.
Once dewatered, mining can recommence here in 2018 on our estimates, at a rate of up to 180ktpa at 5-6g/t Au (C1 cost of <US$650/oz). We anticipate up to 10kt/month or so of PMR material can be mined together with the hardrock, at a grade of 5-7g/t Au production an additional 15-20kozpa, on top of the 20-30kozpa from the Bea primary ore.
TGME Plant: SWJ’s estimate to upgrade the capacity of the CIL plant to 200ktpa is around US$15M. The plan is to further increase capacity towards 500ktpa and ultimately 800ktpa over coming years. Costing for this work is not yet available, however we expect it will be incremental (<US$15M?). We have allowed for this in our 2018/19 capital estimate of US$54M in the model.
Other Mining Potential: SWJ has numerous other old mines in the tenement area, including Vaalhoek (1.35Mt @ 5.74g/t Au for 248koz, inferred). Whilst we have not allowed for production from Vaalhoek or other mines in our DCF valuation, we note there is potential for these mines to be added in the future once the assessment/scoping work has been conducted and potential reserves identified.
Exploration: Exploration potential in the surrounding area is unknown, however considering the absence of detailed exploration in recent decades, we consider good potential to be present. We have not allowed for this potential in our valuation (off-setting this against future corporate costs).
Very few contemporary exploration techniques have been utilised in the Pilgrim’s Rest and Sabie area in the last 20 years. This is due to focus by owners on re-starting old mining operations at small scale or conducting near-mine exploration. Valuation: We value SWJ at A$108M ($0.056/share). Key components include Rietfontein and Beta/PMR mining concepts. We have run DCF models on three proposed mines, adopting only 30% of the NPV due to pre-DFS and development risks- see valuation table, p6.
For comparison, our valuation equates to around A$31/oz of resources, below peer companies in Australia which trade up to A$60/oz, averaging around A$40/oz at the PFS/DFS stage.
Investment Comment: RCR's 12 month share price target is 6cps. SWJ has upside leverage to the emerging low cost, near term production story, which is growing at a rapid rate under new management.
With target first quartile costs and >100kozpa medium term gold production, the company appears well placed to attract market attention, despite the legacy issues and perception of South African sovereign risk.
Considering the high grade nature of the ore, and favourable metallurgy and location, compared to many other African gold plays (particularly greenfields needing serious amounts of capital) this one stands out to us, subject to Reserves and PFS confirmation work.

EQUITY RESEARCH
RCR March 2017 Disclaimer & disclosure attached. Copyright© 2017 by RCR Pty Ltd. All rights reserved. 3
KEY PROJECTS
RESERVES AND RESOURCES
INVESTMENT THESIS
Stonewall Resources is a fully permitted, multi-million ounce gold developer in South Africa, positioning itself at the lower end of the cost curve.
We anticipate should the development scenario at Rietfontein evolve through drilling and PFS work as we expect, there is good potential for a re-rating closer to our target price.
This will be driven by the near-term production focus, low capital cost and the outlook for a potential lowest quartile gold producer of mid-tier status (>100kozpa) on the ASX in coming years.
Figure 1) Regional location map of gold district controlled by SWJ
Source: SWJ, 2017
Pre-Prod South Africa
Target Process
* 43 Historic Mines w ith over 7Moz historic production, JORC Resource of 3.4Moz
JV
Project Option
74%
Ownership/
TGME Gold Project*
Partner Type Route
Project
ResourceLucky Draw Project 100% na NSWAu na
Location
BEE Au
Status
CIP
Inferred 17,300
Sub Total
Tailings
Rock Dumps Inferred
Total Mineral Resources
* Slight variations from announcement dated 7/02/17 primarily due to rounding errors
(JORC 2012)
3,424
74% 27 1.11 0.86
74% 28,437
UG 74% 4.57 2,542
52% Measured 74% 4,440 1.87 267
3.72
26UG Measured 74% 170 4.77
Total - Residual 8,560
129
395
460
1.44
Surface Dumps 77% Indicated 74% 4,120 0.97
UG Indicated 74% 2,380 6.01
0
Resources
Au Equity Kt (100%) g/t g/t Koz (100%)
Au
Reserves
Classification Project Ore Grade
Code for reporting mineral resources - Australian:
Gold
19,850 4.74 3,028
Cut Off
EQUITY RESEARCH
RCR March 2017 Disclaimer & disclosure attached. Copyright© 2017 by RCR Pty Ltd. All rights reserved. 4
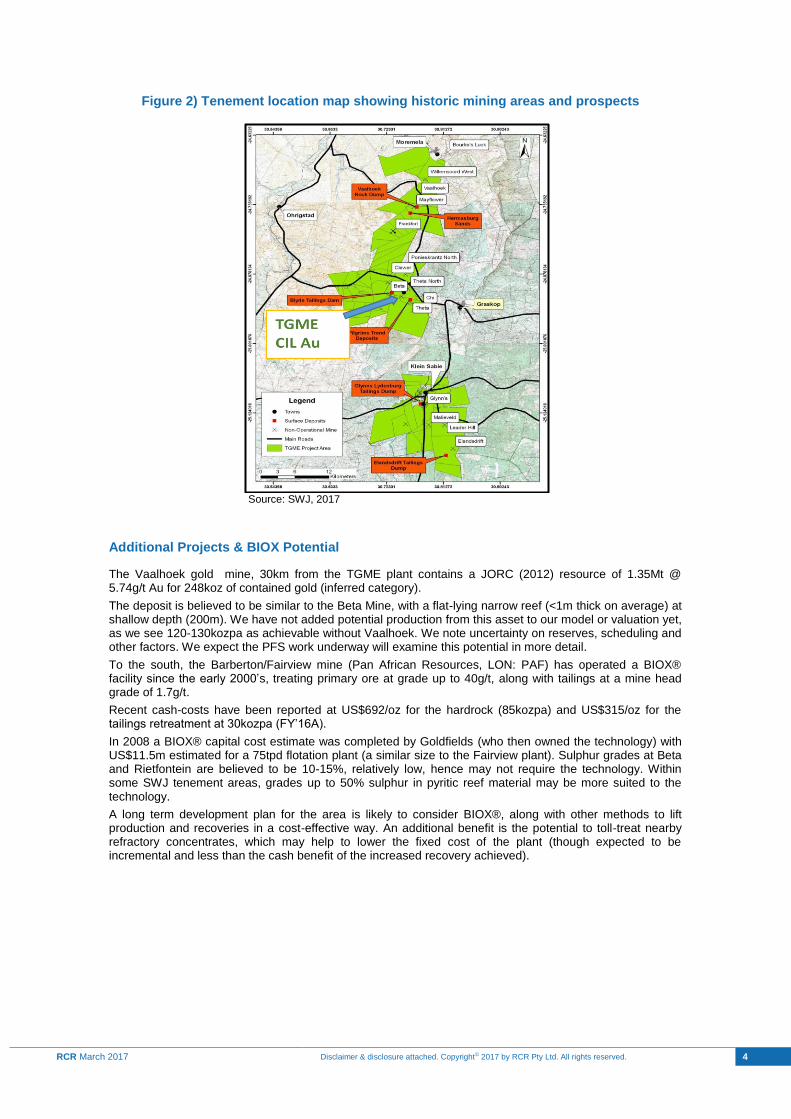
Figure 2) Tenement location map showing historic mining areas and prospects
Source: SWJ, 2017
Additional Projects & BIOX Potential
The Vaalhoek gold mine, 30km from the TGME plant contains a JORC (2012) resource of 1.35Mt @ 5.74g/t Au for 248koz of contained gold (inferred category).
The deposit is believed to be similar to the Beta Mine, with a flat-lying narrow reef (<1m thick on average) at shallow depth (200m). We have not added potential production from this asset to our model or valuation yet, as we see 120-130kozpa as achievable without Vaalhoek. We note uncertainty on reserves, scheduling and other factors. We expect the PFS work underway will examine this potential in more detail.
To the south, the Barberton/Fairview mine (Pan African Resources, LON: PAF) has operated a BIOX® facility since the early 2000’s, treating primary ore at grade up to 40g/t, along with tailings at a mine head grade of 1.7g/t.
Recent cash-costs have been reported at US$692/oz for the hardrock (85kozpa) and US$315/oz for the tailings retreatment at 30kozpa (FY’16A).
In 2008 a BIOX® capital cost estimate was completed by Goldfields (who then owned the technology) with US$11.5m estimated for a 75tpd flotation plant (a similar size to the Fairview plant). Sulphur grades at Beta and Rietfontein are believed to be 10-15%, relatively low, hence may not require the technology. Within some SWJ tenement areas, grades up to 50% sulphur in pyritic reef material may be more suited to the technology.
A long term development plan for the area is likely to consider BIOX®, along with other methods to lift production and recoveries in a cost-effective way. An additional benefit is the potential to toll-treat nearby refractory concentrates, which may help to lower the fixed cost of the plant (though expected to be incremental and less than the cash benefit of the increased recovery achieved).
EQUITY RESEARCH
RCR March 2017 Disclaimer & disclosure attached. Copyright© 2017 by RCR Pty Ltd. All rights reserved. 5
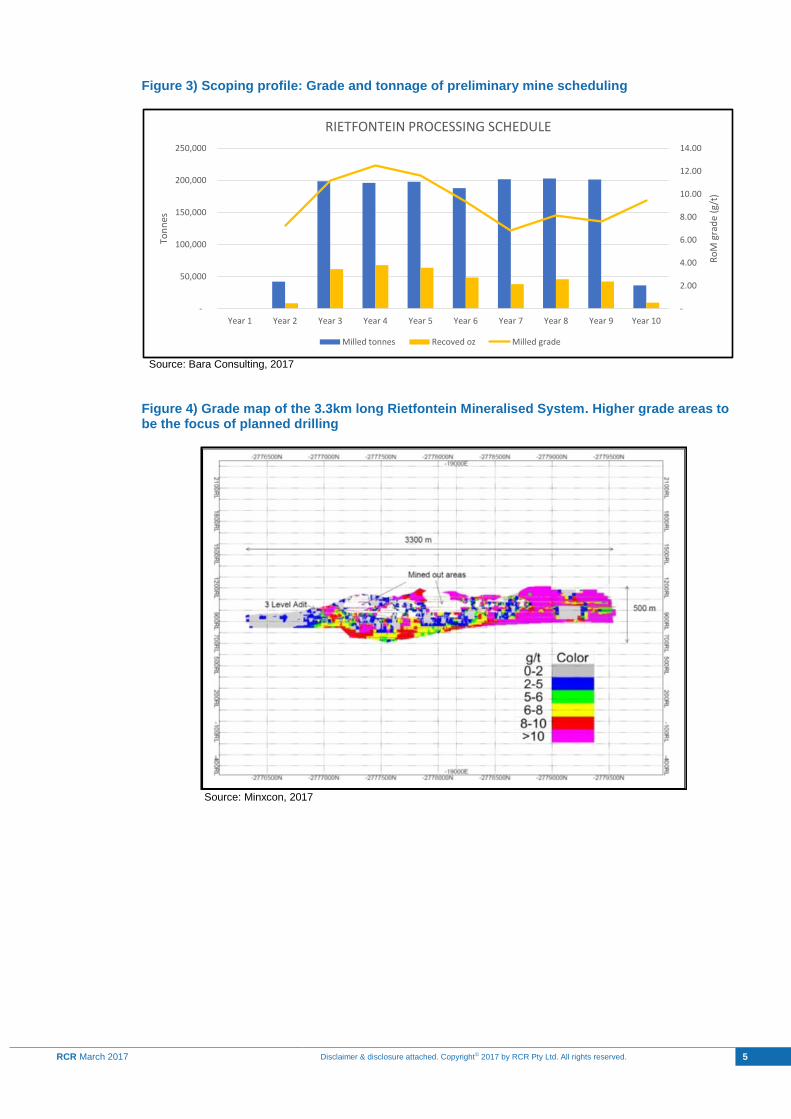
Figure 3) Scoping profile: Grade and tonnage of preliminary mine scheduling
Source: Bara Consulting, 2017
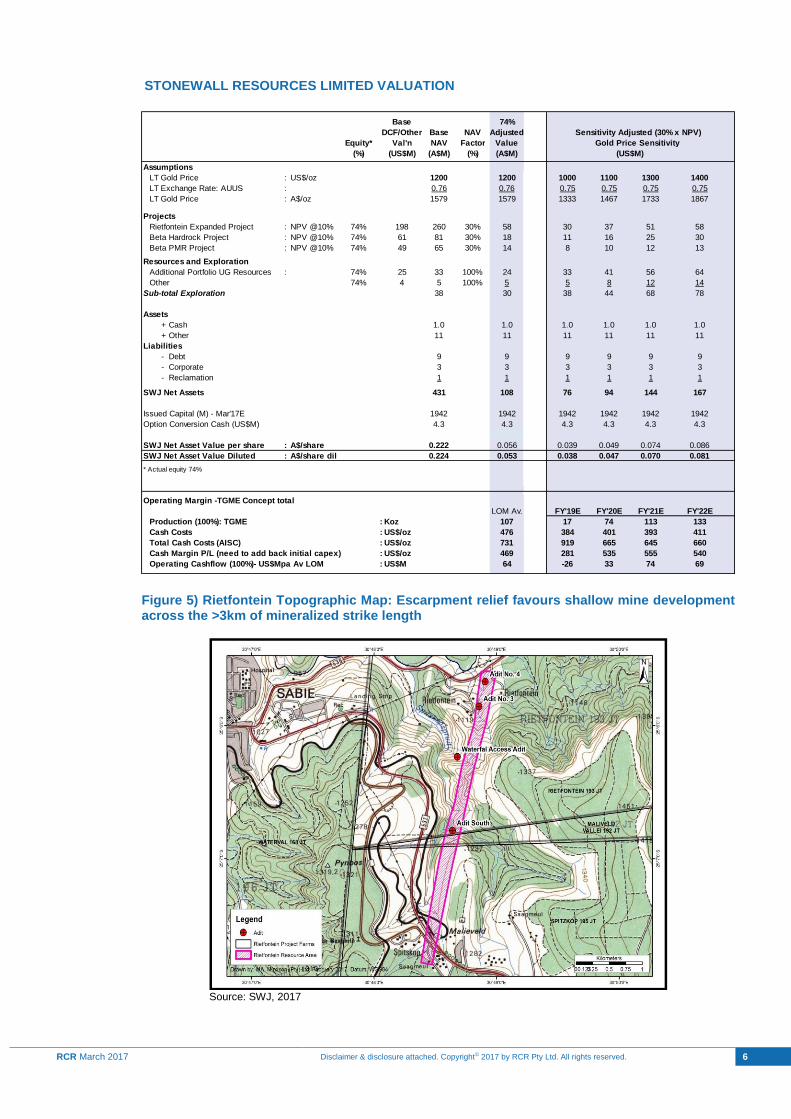
Figure 4) Grade map of the 3.3km long Rietfontein Mineralised System. Higher grade areas to be the focus of planned drilling
Source: Minxcon, 2017
-
2.00
4.00
6.00
8.00
10.00
12.00
14.00
-
50,000
100,000
150,000
200,000
250,000
Year 1 Year 2 Year 3 Year 4 Year 5 Year 6 Year 7 Year 8 Year 9 Year 10
Ro
M g
rad
e (g
/t)
Ton
nes
RIETFONTEIN PROCESSING SCHEDULE
Milled tonnes Recoved oz Milled grade
EQUITY RESEARCH
RCR March 2017 Disclaimer & disclosure attached. Copyright© 2017 by RCR Pty Ltd. All rights reserved. 6
STONEWALL RESOURCES LIMITED VALUATION
Figure 5) Rietfontein Topographic Map: Escarpment relief favours shallow mine development across the >3km of mineralized strike length
Source: SWJ, 2017
Base 74%
DCF/Other Base NAV Adjusted
Equity* Val'n NAV Factor Value
(%) (US$M) (A$M) (%) (A$M)
Assumptions
LT Gold Price : US$/oz 1200 1200 1000 1100 1300 1400
LT Exchange Rate: AUUS : 0.76 0.76 0.75 0.75 0.75 0.75
LT Gold Price : A$/oz 1579 1579 1333 1467 1733 1867
Projects
Rietfontein Expanded Project : NPV @10% 74% 198 260 30% 58 30 37 51 58
Beta Hardrock Project : NPV @10% 74% 61 81 30% 18 11 16 25 30
Beta PMR Project : NPV @10% 74% 49 65 30% 14 8 10 12 13
Resources and Exploration
Additional Portfolio UG Resources : 74% 25 33 100% 24 33 41 56 64
Other 74% 4 5 100% 5 5 8 12 14
Sub-total Exploration 38 30 38 44 68 78
Assets
+ Cash 1.0 1.0 1.0 1.0 1.0 1.0
+ Other 11 11 11 11 11 11
Liabilities
- Debt 9 9 9 9 9 9
- Corporate 3 3 3 3 3 3
- Reclamation 1 1 1 1 1 1
SWJ Net Assets 431 108 76 94 144 167
Issued Capital (M) - Mar'17E 1942 1942 1942 1942 1942 1942
Option Conversion Cash (US$M) 4.3 4.3 4.3 4.3 4.3 4.3
SWJ Net Asset Value per share : A$/share 0.222 0.056 0.039 0.049 0.074 0.086
SWJ Net Asset Value Diluted : A$/share dil 0.224 0.053 0.038 0.047 0.070 0.081
* Actual equity 74%
Operating Margin -TGME Concept total
LOM Av. FY'19E FY'20E FY'21E FY'22E
Production (100%): TGME : Koz 107 17 74 113 133
Cash Costs : US$/oz 476 384 401 393 411
Total Cash Costs (AISC) : US$/oz 731 919 665 645 660
Cash Margin P/L (need to add back initial capex) : US$/oz 469 281 535 555 540
Operating Cashflow (100%)- US$Mpa Av LOM : US$M 64 -26 33 74 69
Gold Price Sensitivity
Sensitivity Adjusted (30% x NPV)
(US$M)
EQUITY RESEARCH
RCR March 2017 Disclaimer & disclosure attached. Copyright© 2017 by RCR Pty Ltd. All rights reserved. 7
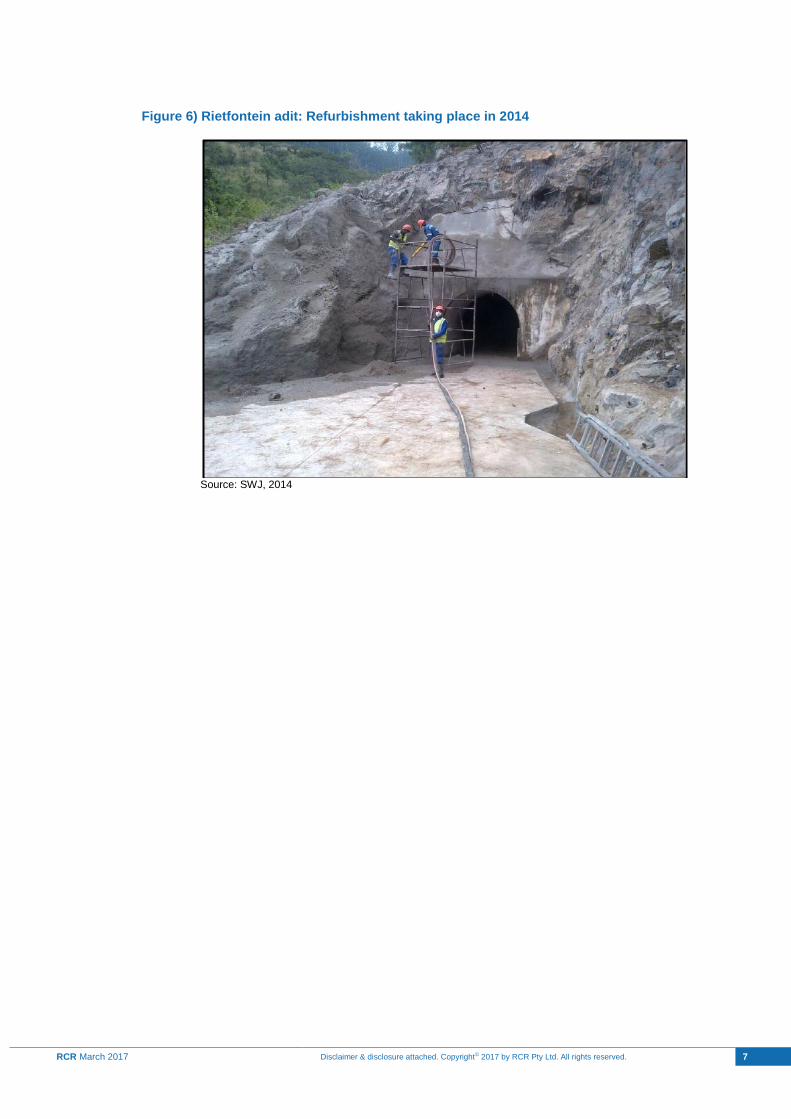
Figure 6) Rietfontein adit: Refurbishment taking place in 2014
Source: SWJ, 2014
EQUITY RESEARCH
RCR March 2017 Disclaimer & disclosure attached. Copyright© 2017 by RCR Pty Ltd. All rights reserved. 8
DISCLOSURE AND DISCLAIMER Important Information
Resource Capital Research Pty Limited (referred to as “we”, “our”, or “RCR” herein) ACN 111 622 489 holds an Australian Financial Services Licence (AFS Licence number 325340). General advice is provided by RCR’s Authorised Representatives Dr Tony Parry (Authorised Representative number 328842) and Mr Geoff Muers (Authorised Representative number 001252594). The FSG is available at www.rcresearch.com.au. All references to currency are in Australian dollars unless otherwise noted.
This report and its contents are intended to be used or viewed only by persons resident and located in Australia and therein only where RCR’s services and products may lawfully be offered. The information provided in this report is not intended for distribution to, or use by, any person or entity in any jurisdiction or country where such distribution or use would be contrary to law or regulation or which would subject RCR or its affiliates to any registration requirement within such jurisdiction or country.
This report and its contents are not intended to constitute a solicitation for the purchase of securities or an offer of securities. The information provided in this report has been prepared without taking account of your particular objectives, financial situation or needs. You should, before acting on the information provided in this report, consider the appropriateness of the purchase or sale of the securities of the companies that are the subject of this report having regard to these matters and, if appropriate, seek professional financial, investment and taxation advice. RCR does not guarantee the performance of any investment discussed or recommended in this report. Any information in this report relating to the distribution history or performance history of the securities of the companies that are the subject of this report, should not be taken as an indication of the future value or performance of the relevant securities.
In preparing this report, RCR analysts have relied upon certain information provided by management of the companies that are the subject of this report or otherwise made publicly available by such companies. The information presented and opinions expressed herein are given as of the date hereof and are subject to change. We hereby disclaim any obligation to advise you of any change after the date hereof in any matter set forth in this report. THE INFORMATION PRESENTED, WHILE OBTAINED FROM SOURCES WE BELIEVE RELIABLE, IS CHECKED BUT NOT GUARANTEED AGAINST ERRORS OR OMISSIONS AND WE MAKE NO WARRANTY OR REPRESENTATION, EXPRESSED OR IMPLIED, AND DISCLAIM AND NEGATE ALL OTHER WARRANTIES OR LIABILITY CONCERNING THE ACCURACY, COMPLETENESS OR RELIABILITY OF, OR ANY FAILURE TO UPDATE, ANY CONTENT OR INFORMATION HEREIN.
This report and the information filed on which it is based may include estimates and projections which constitute forward looking statements that express an expectation or belief as to future events, results or returns. No guarantee of future events, results or returns is given or implied by RCR. Estimates and projections contained herein, whether or not our own, are based on assumptions that we believe to be reasonable at the time of publication, however, such forward-looking statements are subject to risks, uncertainties and other factors which could cause actual results to differ materially from the estimates and projections provided to RCR or contained within this report.
This report may, from time to time, contain information or material obtained from outside sources with the permission of the original author or links to web sites or references to products, services or publications other than those of RCR. The use or inclusion of such information, material, links or references does not imply our endorsement or approval thereof, nor do we warrant, in any manner, the accuracy of completeness of any information presented therein.
RCR, its affiliates and their respective officers, directors and employees may hold positions in the securities of the companies featured in this report and may purchase and/or sell them from time to time and RCR and its affiliates may also from time to time perform investment banking or other services for, or solicit investment banking or other business from, entities mentioned in this report. Stonewall Resources Limited commissioned the author and RCR to compile this report and visit the site in South Africa. In consideration, the author and RCR received from the company a cash consultancy fee of <$15,000. RCR may receive ongoing consulting fees, and/or referral fees from issuing companies or their advisors in respect of investors that RCR refers to companies looking to
raise capital. Those fees vary, but are generally between 0 - 6% of the value of capital raised either directly or from referrals made by RCR. At the date of this report, neither RCR, nor any of its associates, hold any interests or entitlements in shares mentioned in this report.
Analyst Certification: All observations, conclusions and opinions expressed in this report reflect the personal views of RCR analysts and no part of the analyst’s or RCR’s compensation was, is, or will be, directly or indirectly related to specific recommendations or views expressed in the report. Officers, directors, consultants, employees and independent contractors of RCR are prohibited from trading in the securities of U.S. companies that are, or are expected to be, the subject of research reports or other investment advice transmitted to RCR clients for a blackout window of 14 days extending before and after the date such report is transmitted to clients or released to the market.
Cautionary Note to Foreign Investors Concerning Estimates of Measured, Indicated and Inferred Resources: RCR publishes mineral resources based on standards recognized and required under securities legislation where listed mining and exploration companies make their exchange filings and uses the terms “measured", "indicated" and "inferred" mineral resources. Foreign investors are advised that while such terms are recognized and required under foreign securities legislation, certain foreign exchanges (such as the U.S. SEC) allows disclosure only of mineral deposits that can be economically and legally extracted. Foreign investors are cautioned not to assume that all or any part of measured, indicated or inferred resources can be converted into reserves or economically or legally mined.
Not For Distribution Or Release In The United States.
CONTACT
Resource Capital Research ACN 111 622 489
Level 21, 68 Pitt Street Sydney NSW 2000
T +612 9439 1919 E [email protected]
www.rcresearch.com.au


![Warrants[1] Copy](https://img.pdfslide.us/doc/110x75/547ee4985906b5a1718b46fe/warrants1-copy.jpg)