Embed Size (px)
Citation preview
1
Curriculum Management System
Monroe Township Schools
Course Name: Probability and Statistics Grade: 12
For adoption by all regular education programs Board Approved: as specified and for adoption or adaptation by all Special Education Programs in accordance with Board of Education Policy # 2220.
2
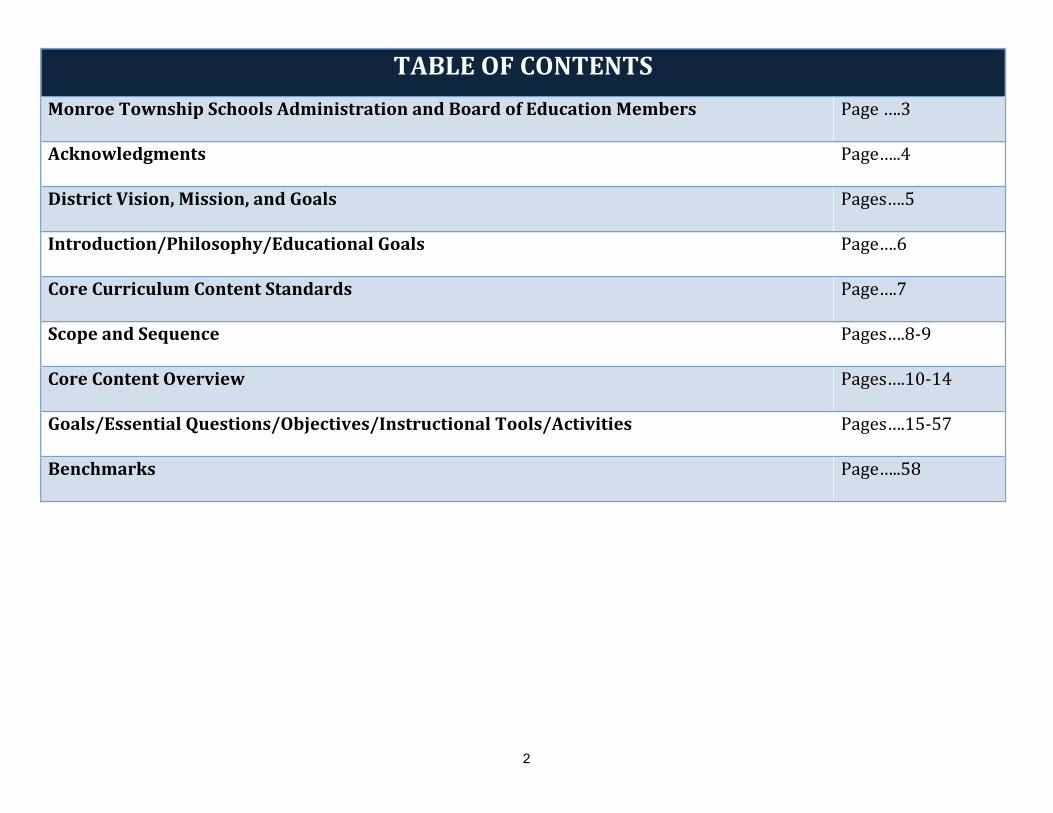
TABLEOFCONTENTSMonroeTownshipSchoolsAdministrationandBoardofEducationMembers Page….3
Acknowledgments Page…..4
DistrictVision,Mission,andGoals Pages….5
Introduction/Philosophy/EducationalGoals Page….6
CoreCurriculumContentStandards Page….7
ScopeandSequence Pages….8‐9
CoreContentOverview Pages….10‐14
Goals/EssentialQuestions/Objectives/InstructionalTools/Activities Pages….15‐57
Benchmarks Page…..58
3
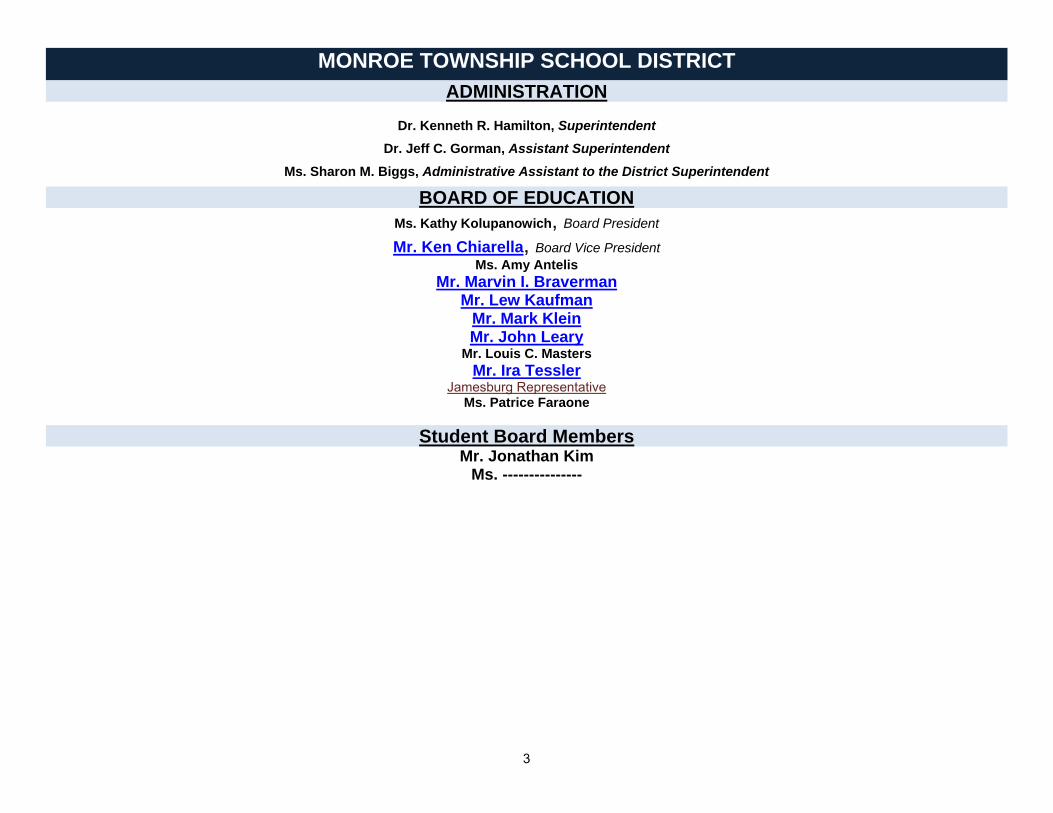
MONROE TOWNSHIP SCHOOL DISTRICT ADMINISTRATION
Dr. Kenneth R. Hamilton, Superintendent Dr. Jeff C. Gorman, Assistant Superintendent
Ms. Sharon M. Biggs, Administrative Assistant to the District Superintendent
BOARD OF EDUCATION Ms. Kathy Kolupanowich, Board President
Mr. Ken Chiarella, Board Vice President Ms. Amy Antelis
Mr. Marvin I. Braverman Mr. Lew Kaufman
Mr. Mark Klein Mr. John Leary
Mr. Louis C. Masters Mr. Ira Tessler
Jamesburg Representative Ms. Patrice Faraone
Student Board Members
Mr. Jonathan Kim Ms. ---------------
4
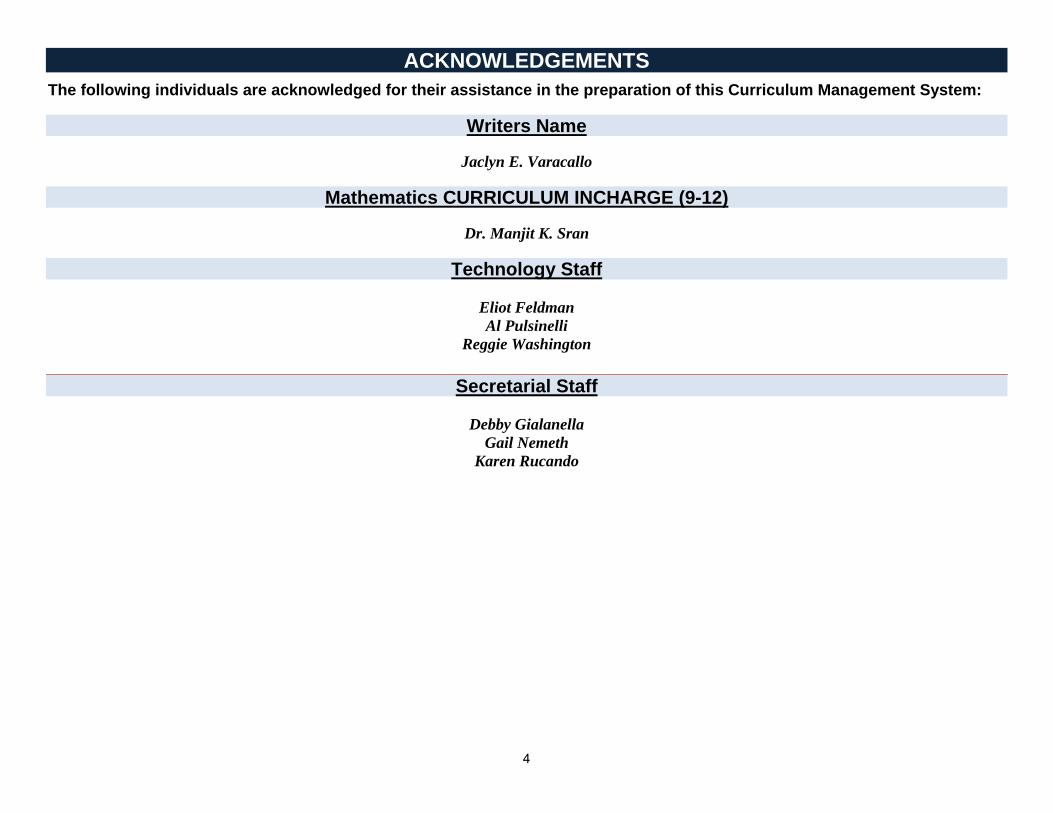
ACKNOWLEDGEMENTS The following individuals are acknowledged for their assistance in the preparation of this Curriculum Management System:
Writers Name
Jaclyn E. Varacallo
Mathematics CURRICULUM INCHARGE (9-12)
Dr. Manjit K. Sran
Technology Staff
Eliot Feldman Al Pulsinelli
Reggie Washington
Secretarial Staff
Debby Gialanella Gail Nemeth
Karen Rucando
5
Monroe Township Schools Vision, Mission, and Goals
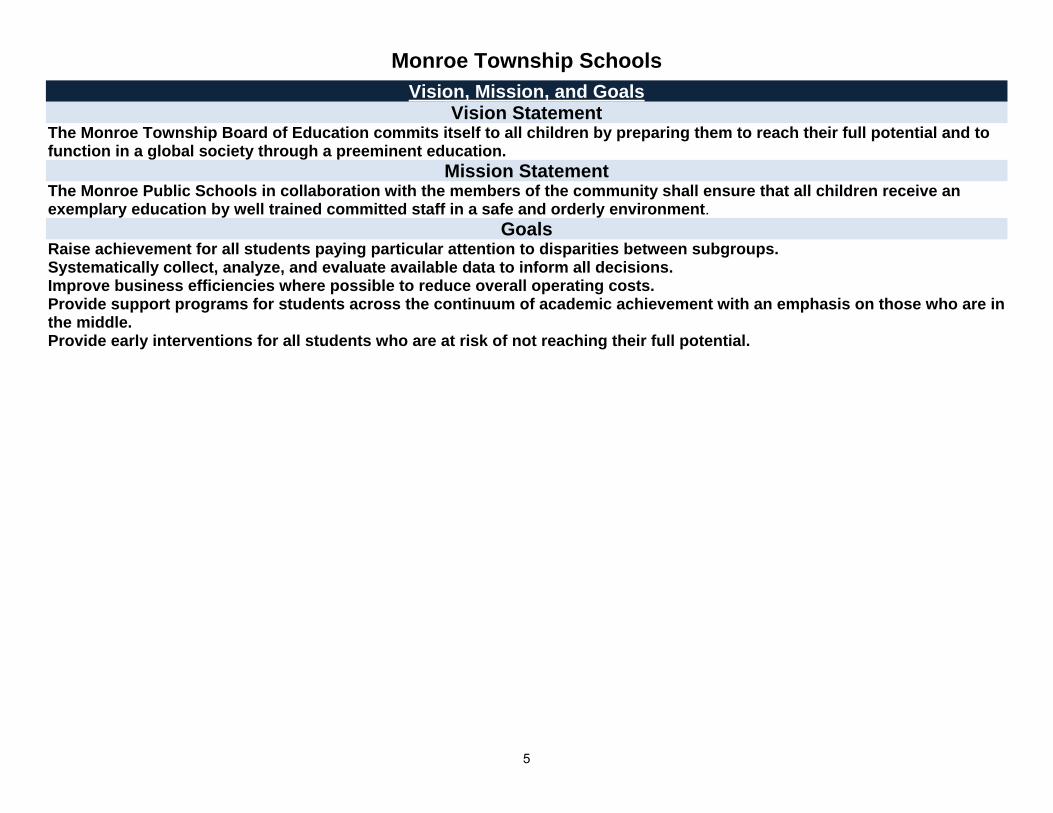
Vision Statement The Monroe Township Board of Education commits itself to all children by preparing them to reach their full potential and to function in a global society through a preeminent education.
Mission Statement The Monroe Public Schools in collaboration with the members of the community shall ensure that all children receive an exemplary education by well trained committed staff in a safe and orderly environment.
Goals Raise achievement for all students paying particular attention to disparities between subgroups. Systematically collect, analyze, and evaluate available data to inform all decisions. Improve business efficiencies where possible to reduce overall operating costs. Provide support programs for students across the continuum of academic achievement with an emphasis on those who are in the middle. Provide early interventions for all students who are at risk of not reaching their full potential.
6
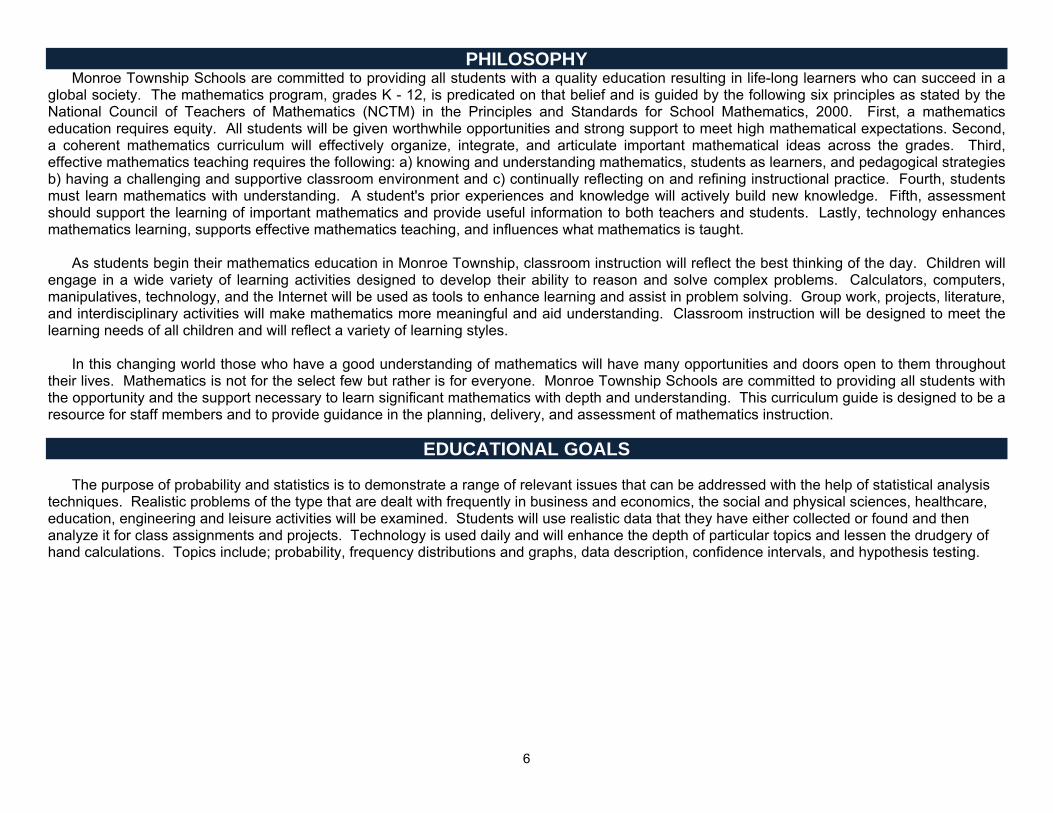
PHILOSOPHY Monroe Township Schools are committed to providing all students with a quality education resulting in life-long learners who can succeed in a
global society. The mathematics program, grades K - 12, is predicated on that belief and is guided by the following six principles as stated by the National Council of Teachers of Mathematics (NCTM) in the Principles and Standards for School Mathematics, 2000. First, a mathematics education requires equity. All students will be given worthwhile opportunities and strong support to meet high mathematical expectations. Second, a coherent mathematics curriculum will effectively organize, integrate, and articulate important mathematical ideas across the grades. Third, effective mathematics teaching requires the following: a) knowing and understanding mathematics, students as learners, and pedagogical strategies b) having a challenging and supportive classroom environment and c) continually reflecting on and refining instructional practice. Fourth, students must learn mathematics with understanding. A student's prior experiences and knowledge will actively build new knowledge. Fifth, assessment should support the learning of important mathematics and provide useful information to both teachers and students. Lastly, technology enhances mathematics learning, supports effective mathematics teaching, and influences what mathematics is taught.
As students begin their mathematics education in Monroe Township, classroom instruction will reflect the best thinking of the day. Children will engage in a wide variety of learning activities designed to develop their ability to reason and solve complex problems. Calculators, computers, manipulatives, technology, and the Internet will be used as tools to enhance learning and assist in problem solving. Group work, projects, literature, and interdisciplinary activities will make mathematics more meaningful and aid understanding. Classroom instruction will be designed to meet the learning needs of all children and will reflect a variety of learning styles.
In this changing world those who have a good understanding of mathematics will have many opportunities and doors open to them throughout their lives. Mathematics is not for the select few but rather is for everyone. Monroe Township Schools are committed to providing all students with the opportunity and the support necessary to learn significant mathematics with depth and understanding. This curriculum guide is designed to be a resource for staff members and to provide guidance in the planning, delivery, and assessment of mathematics instruction. EDUCATIONAL GOALS
The purpose of probability and statistics is to demonstrate a range of relevant issues that can be addressed with the help of statistical analysis techniques. Realistic problems of the type that are dealt with frequently in business and economics, the social and physical sciences, healthcare, education, engineering and leisure activities will be examined. Students will use realistic data that they have either collected or found and then analyze it for class assignments and projects. Technology is used daily and will enhance the depth of particular topics and lessen the drudgery of hand calculations. Topics include; probability, frequency distributions and graphs, data description, confidence intervals, and hypothesis testing.
7
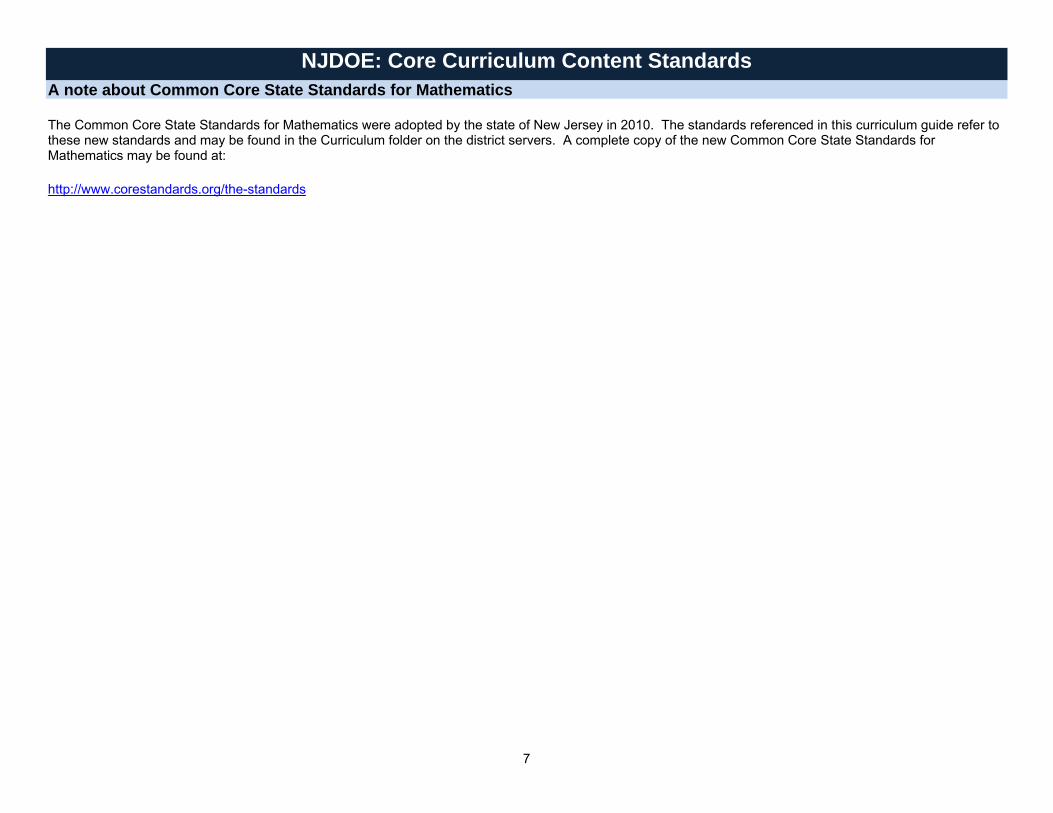
NJDOE: Core Curriculum Content Standards A note about Common Core State Standards for Mathematics The Common Core State Standards for Mathematics were adopted by the state of New Jersey in 2010. The standards referenced in this curriculum guide refer to these new standards and may be found in the Curriculum folder on the district servers. A complete copy of the new Common Core State Standards for Mathematics may be found at: http://www.corestandards.org/the-standards
8
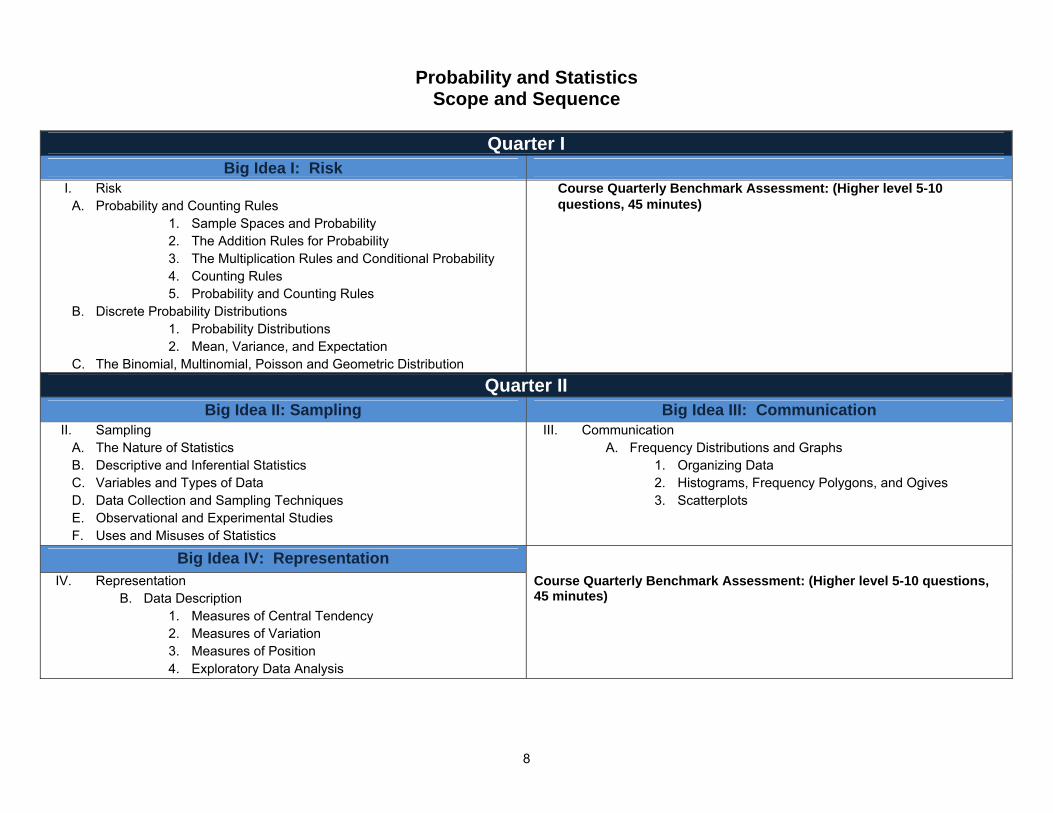
Probability and Statistics
Scope and Sequence
Quarter I Big Idea I: Risk
I. Risk A. Probability and Counting Rules
1. Sample Spaces and Probability 2. The Addition Rules for Probability 3. The Multiplication Rules and Conditional Probability 4. Counting Rules 5. Probability and Counting Rules
B. Discrete Probability Distributions 1. Probability Distributions 2. Mean, Variance, and Expectation
C. The Binomial, Multinomial, Poisson and Geometric Distribution
Course Quarterly Benchmark Assessment: (Higher level 5-10 questions, 45 minutes)
Quarter II Big Idea II: Sampling Big Idea III: Communication
II. Sampling A. The Nature of Statistics B. Descriptive and Inferential Statistics C. Variables and Types of Data D. Data Collection and Sampling Techniques E. Observational and Experimental Studies F. Uses and Misuses of Statistics
III. Communication A. Frequency Distributions and Graphs
1. Organizing Data 2. Histograms, Frequency Polygons, and Ogives 3. Scatterplots
Big Idea IV: Representation
IV. Representation B. Data Description
1. Measures of Central Tendency 2. Measures of Variation 3. Measures of Position 4. Exploratory Data Analysis
Course Quarterly Benchmark Assessment: (Higher level 5-10 questions, 45 minutes)
9
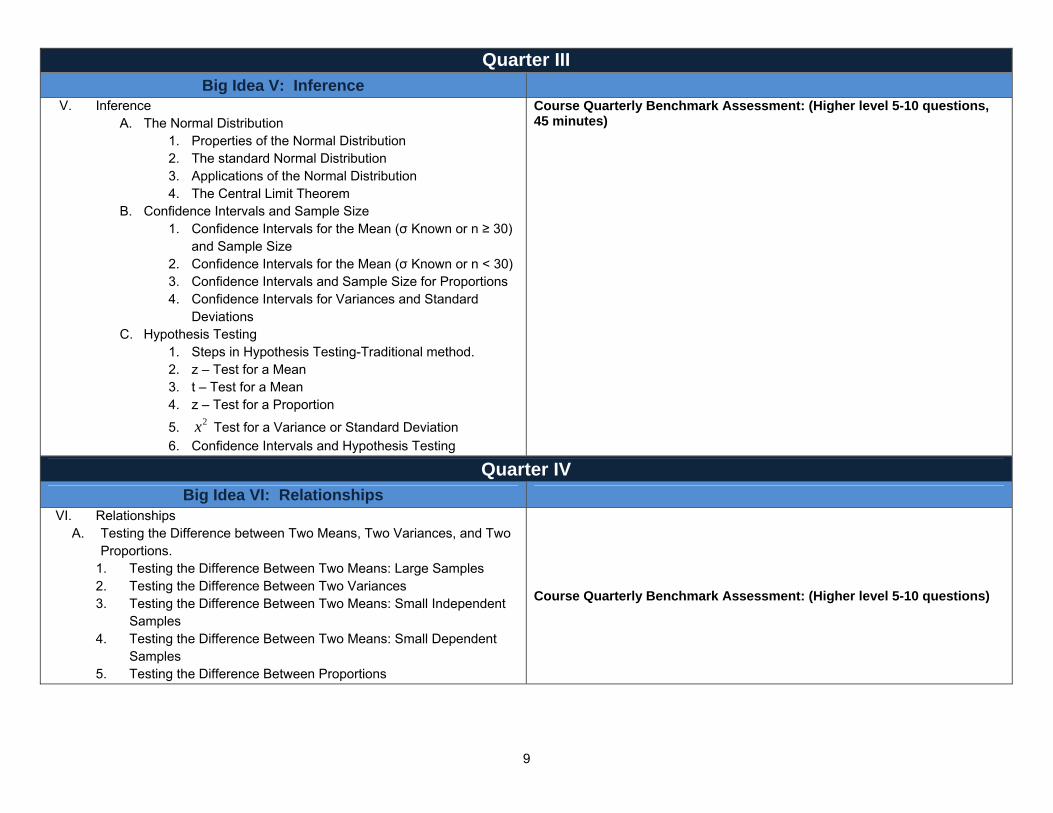
Quarter III Big Idea V: Inference
V. Inference A. The Normal Distribution
1. Properties of the Normal Distribution 2. The standard Normal Distribution 3. Applications of the Normal Distribution 4. The Central Limit Theorem
B. Confidence Intervals and Sample Size 1. Confidence Intervals for the Mean (σ Known or n ≥ 30)
and Sample Size 2. Confidence Intervals for the Mean (σ Known or n < 30) 3. Confidence Intervals and Sample Size for Proportions 4. Confidence Intervals for Variances and Standard
Deviations C. Hypothesis Testing
1. Steps in Hypothesis Testing-Traditional method. 2. z – Test for a Mean 3. t – Test for a Mean 4. z – Test for a Proportion
5. 2x Test for a Variance or Standard Deviation 6. Confidence Intervals and Hypothesis Testing
Course Quarterly Benchmark Assessment: (Higher level 5-10 questions, 45 minutes)
Quarter IV
Big Idea VI: Relationships VI. Relationships
A. Testing the Difference between Two Means, Two Variances, and Two Proportions.
1. Testing the Difference Between Two Means: Large Samples 2. Testing the Difference Between Two Variances 3. Testing the Difference Between Two Means: Small Independent
Samples 4. Testing the Difference Between Two Means: Small Dependent
Samples 5. Testing the Difference Between Proportions
Course Quarterly Benchmark Assessment: (Higher level 5-10 questions)
10
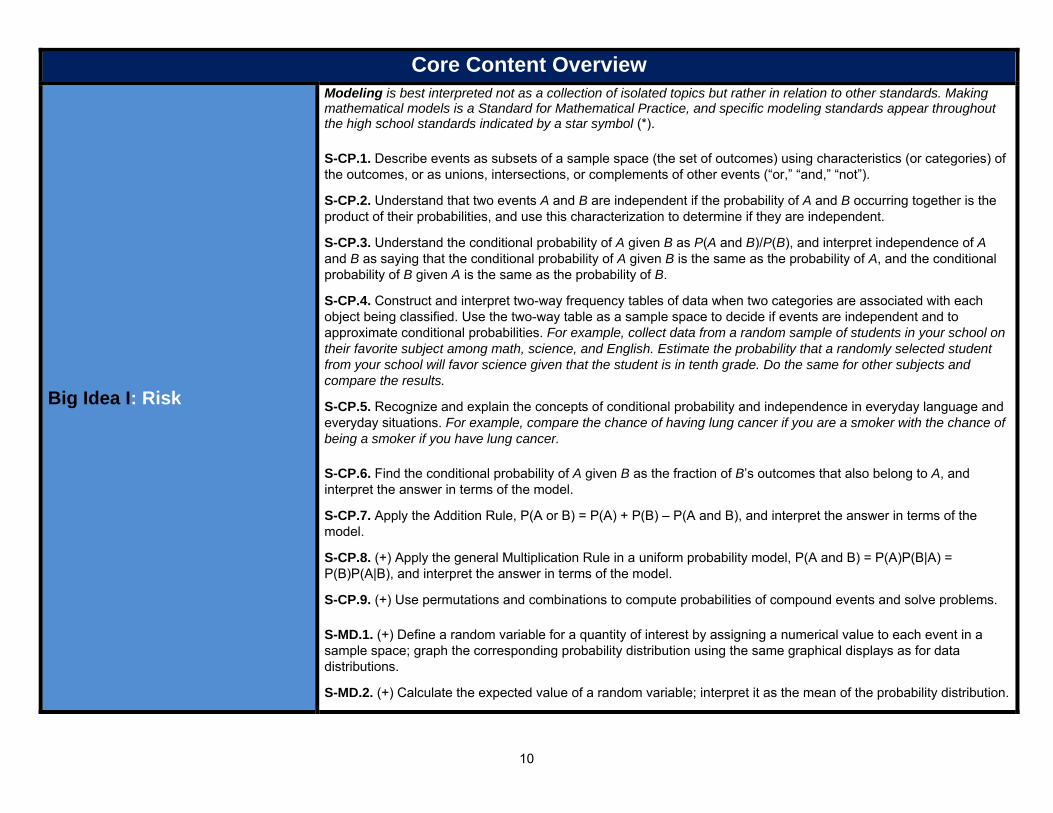
Core Content Overview
Big Idea I: Risk
Modeling is best interpreted not as a collection of isolated topics but rather in relation to other standards. Making mathematical models is a Standard for Mathematical Practice, and specific modeling standards appear throughout the high school standards indicated by a star symbol (*).
S-CP.1. Describe events as subsets of a sample space (the set of outcomes) using characteristics (or categories) of the outcomes, or as unions, intersections, or complements of other events (“or,” “and,” “not”).
S-CP.2. Understand that two events A and B are independent if the probability of A and B occurring together is the product of their probabilities, and use this characterization to determine if they are independent.
S-CP.3. Understand the conditional probability of A given B as P(A and B)/P(B), and interpret independence of A and B as saying that the conditional probability of A given B is the same as the probability of A, and the conditional probability of B given A is the same as the probability of B.
S-CP.4. Construct and interpret two-way frequency tables of data when two categories are associated with each object being classified. Use the two-way table as a sample space to decide if events are independent and to approximate conditional probabilities. For example, collect data from a random sample of students in your school on their favorite subject among math, science, and English. Estimate the probability that a randomly selected student from your school will favor science given that the student is in tenth grade. Do the same for other subjects and compare the results.
S-CP.5. Recognize and explain the concepts of conditional probability and independence in everyday language and everyday situations. For example, compare the chance of having lung cancer if you are a smoker with the chance of being a smoker if you have lung cancer.
S-CP.6. Find the conditional probability of A given B as the fraction of B’s outcomes that also belong to A, and interpret the answer in terms of the model.
S-CP.7. Apply the Addition Rule, P(A or B) = P(A) + P(B) – P(A and B), and interpret the answer in terms of the model.
S-CP.8. (+) Apply the general Multiplication Rule in a uniform probability model, P(A and B) = P(A)P(B|A) = P(B)P(A|B), and interpret the answer in terms of the model.
S-CP.9. (+) Use permutations and combinations to compute probabilities of compound events and solve problems.
S-MD.1. (+) Define a random variable for a quantity of interest by assigning a numerical value to each event in a sample space; graph the corresponding probability distribution using the same graphical displays as for data distributions.
S-MD.2. (+) Calculate the expected value of a random variable; interpret it as the mean of the probability distribution.
11
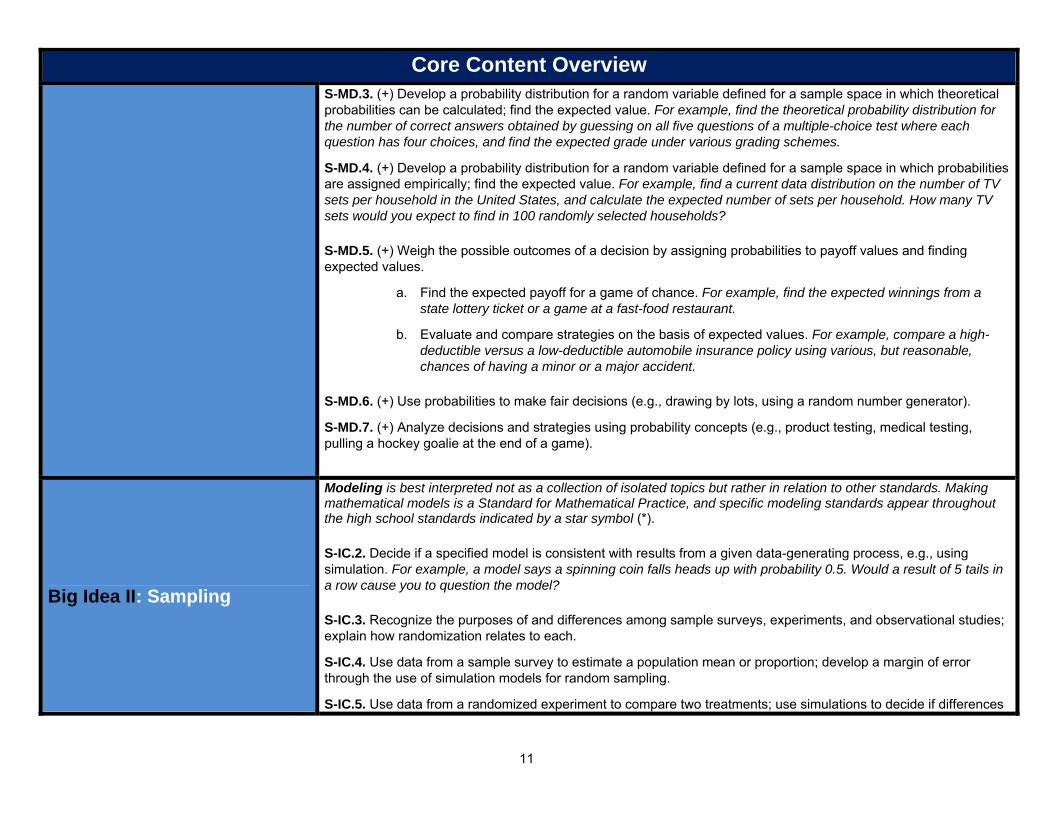
Core Content Overview S-MD.3. (+) Develop a probability distribution for a random variable defined for a sample space in which theoretical probabilities can be calculated; find the expected value. For example, find the theoretical probability distribution for the number of correct answers obtained by guessing on all five questions of a multiple-choice test where each question has four choices, and find the expected grade under various grading schemes.
S-MD.4. (+) Develop a probability distribution for a random variable defined for a sample space in which probabilities are assigned empirically; find the expected value. For example, find a current data distribution on the number of TV sets per household in the United States, and calculate the expected number of sets per household. How many TV sets would you expect to find in 100 randomly selected households?
S-MD.5. (+) Weigh the possible outcomes of a decision by assigning probabilities to payoff values and finding expected values.
a. Find the expected payoff for a game of chance. For example, find the expected winnings from a state lottery ticket or a game at a fast-food restaurant.
b. Evaluate and compare strategies on the basis of expected values. For example, compare a high-deductible versus a low-deductible automobile insurance policy using various, but reasonable, chances of having a minor or a major accident.
S-MD.6. (+) Use probabilities to make fair decisions (e.g., drawing by lots, using a random number generator).
S-MD.7. (+) Analyze decisions and strategies using probability concepts (e.g., product testing, medical testing, pulling a hockey goalie at the end of a game).
Big Idea II: Sampling
Modeling is best interpreted not as a collection of isolated topics but rather in relation to other standards. Making mathematical models is a Standard for Mathematical Practice, and specific modeling standards appear throughout the high school standards indicated by a star symbol (*).
S-IC.2. Decide if a specified model is consistent with results from a given data-generating process, e.g., using simulation. For example, a model says a spinning coin falls heads up with probability 0.5. Would a result of 5 tails in a row cause you to question the model?
S-IC.3. Recognize the purposes of and differences among sample surveys, experiments, and observational studies; explain how randomization relates to each.
S-IC.4. Use data from a sample survey to estimate a population mean or proportion; develop a margin of error through the use of simulation models for random sampling.
S-IC.5. Use data from a randomized experiment to compare two treatments; use simulations to decide if differences
12
Core Content Overview between parameters are significant.
S-IC.6. Evaluate reports based on data.
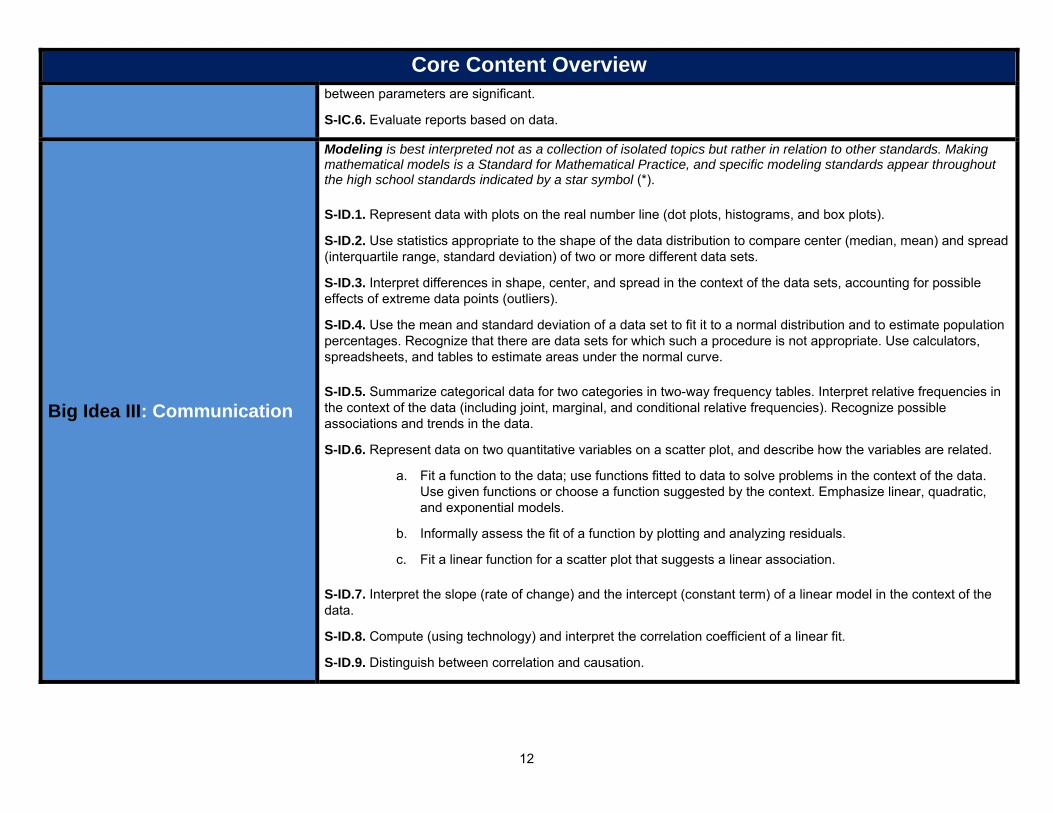
Big Idea III: Communication
Modeling is best interpreted not as a collection of isolated topics but rather in relation to other standards. Making mathematical models is a Standard for Mathematical Practice, and specific modeling standards appear throughout the high school standards indicated by a star symbol (*).
S-ID.1. Represent data with plots on the real number line (dot plots, histograms, and box plots).
S-ID.2. Use statistics appropriate to the shape of the data distribution to compare center (median, mean) and spread (interquartile range, standard deviation) of two or more different data sets.
S-ID.3. Interpret differences in shape, center, and spread in the context of the data sets, accounting for possible effects of extreme data points (outliers).
S-ID.4. Use the mean and standard deviation of a data set to fit it to a normal distribution and to estimate population percentages. Recognize that there are data sets for which such a procedure is not appropriate. Use calculators, spreadsheets, and tables to estimate areas under the normal curve.
S-ID.5. Summarize categorical data for two categories in two-way frequency tables. Interpret relative frequencies in the context of the data (including joint, marginal, and conditional relative frequencies). Recognize possible associations and trends in the data.
S-ID.6. Represent data on two quantitative variables on a scatter plot, and describe how the variables are related.
a. Fit a function to the data; use functions fitted to data to solve problems in the context of the data. Use given functions or choose a function suggested by the context. Emphasize linear, quadratic, and exponential models.
b. Informally assess the fit of a function by plotting and analyzing residuals.
c. Fit a linear function for a scatter plot that suggests a linear association.
S-ID.7. Interpret the slope (rate of change) and the intercept (constant term) of a linear model in the context of the data.
S-ID.8. Compute (using technology) and interpret the correlation coefficient of a linear fit.
S-ID.9. Distinguish between correlation and causation.
13
Core Content Overview
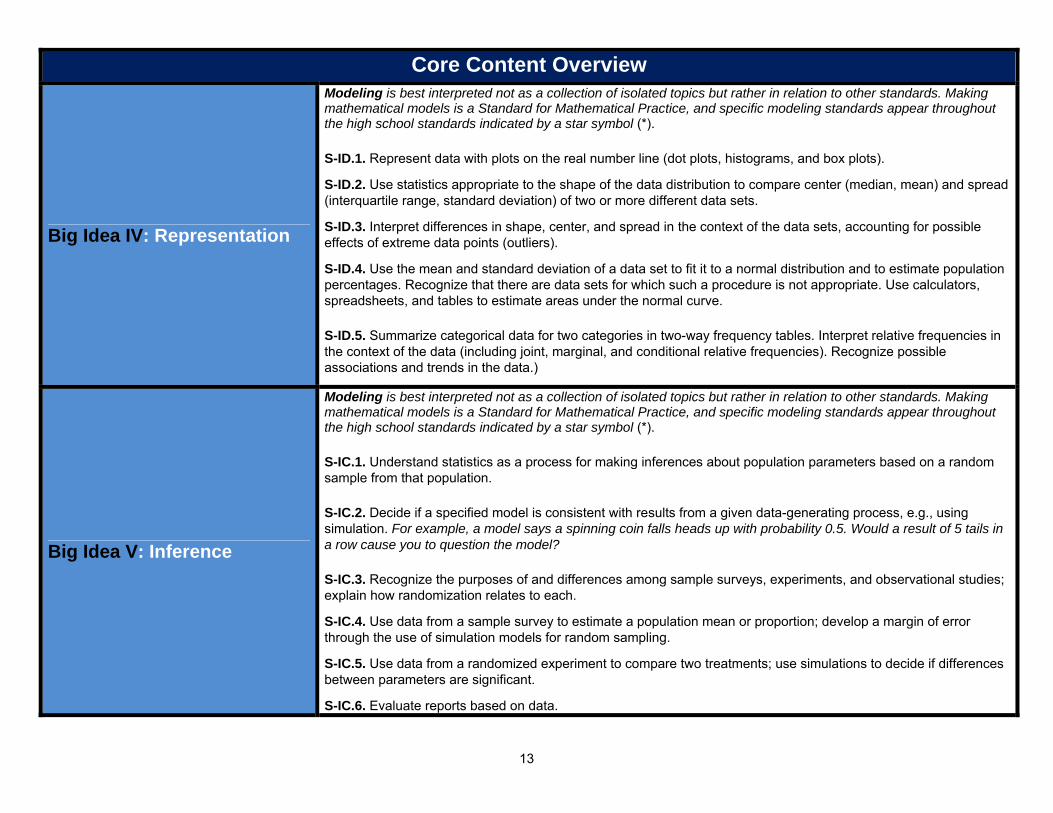
Big Idea IV: Representation
Modeling is best interpreted not as a collection of isolated topics but rather in relation to other standards. Making mathematical models is a Standard for Mathematical Practice, and specific modeling standards appear throughout the high school standards indicated by a star symbol (*).
S-ID.1. Represent data with plots on the real number line (dot plots, histograms, and box plots).
S-ID.2. Use statistics appropriate to the shape of the data distribution to compare center (median, mean) and spread (interquartile range, standard deviation) of two or more different data sets.
S-ID.3. Interpret differences in shape, center, and spread in the context of the data sets, accounting for possible effects of extreme data points (outliers).
S-ID.4. Use the mean and standard deviation of a data set to fit it to a normal distribution and to estimate population percentages. Recognize that there are data sets for which such a procedure is not appropriate. Use calculators, spreadsheets, and tables to estimate areas under the normal curve.
S-ID.5. Summarize categorical data for two categories in two-way frequency tables. Interpret relative frequencies in the context of the data (including joint, marginal, and conditional relative frequencies). Recognize possible associations and trends in the data.)
Big Idea V: Inference
Modeling is best interpreted not as a collection of isolated topics but rather in relation to other standards. Making mathematical models is a Standard for Mathematical Practice, and specific modeling standards appear throughout the high school standards indicated by a star symbol (*).
S-IC.1. Understand statistics as a process for making inferences about population parameters based on a random sample from that population.
S-IC.2. Decide if a specified model is consistent with results from a given data-generating process, e.g., using simulation. For example, a model says a spinning coin falls heads up with probability 0.5. Would a result of 5 tails in a row cause you to question the model?
S-IC.3. Recognize the purposes of and differences among sample surveys, experiments, and observational studies; explain how randomization relates to each.
S-IC.4. Use data from a sample survey to estimate a population mean or proportion; develop a margin of error through the use of simulation models for random sampling.
S-IC.5. Use data from a randomized experiment to compare two treatments; use simulations to decide if differences between parameters are significant.
S-IC.6. Evaluate reports based on data.
14
Core Content Overview
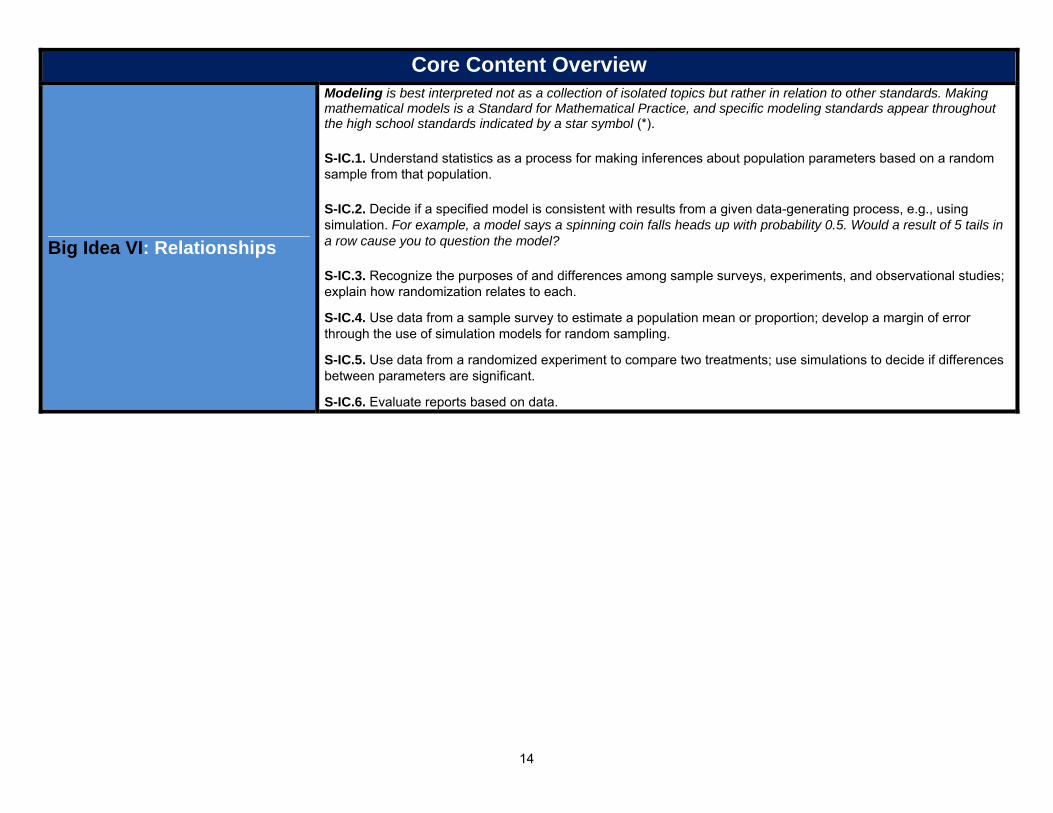
Big Idea VI: Relationships
Modeling is best interpreted not as a collection of isolated topics but rather in relation to other standards. Making mathematical models is a Standard for Mathematical Practice, and specific modeling standards appear throughout the high school standards indicated by a star symbol (*).
S-IC.1. Understand statistics as a process for making inferences about population parameters based on a random sample from that population.
S-IC.2. Decide if a specified model is consistent with results from a given data-generating process, e.g., using simulation. For example, a model says a spinning coin falls heads up with probability 0.5. Would a result of 5 tails in a row cause you to question the model?
S-IC.3. Recognize the purposes of and differences among sample surveys, experiments, and observational studies; explain how randomization relates to each.
S-IC.4. Use data from a sample survey to estimate a population mean or proportion; develop a margin of error through the use of simulation models for random sampling.
S-IC.5. Use data from a randomized experiment to compare two treatments; use simulations to decide if differences between parameters are significant.
S-IC.6. Evaluate reports based on data.
15
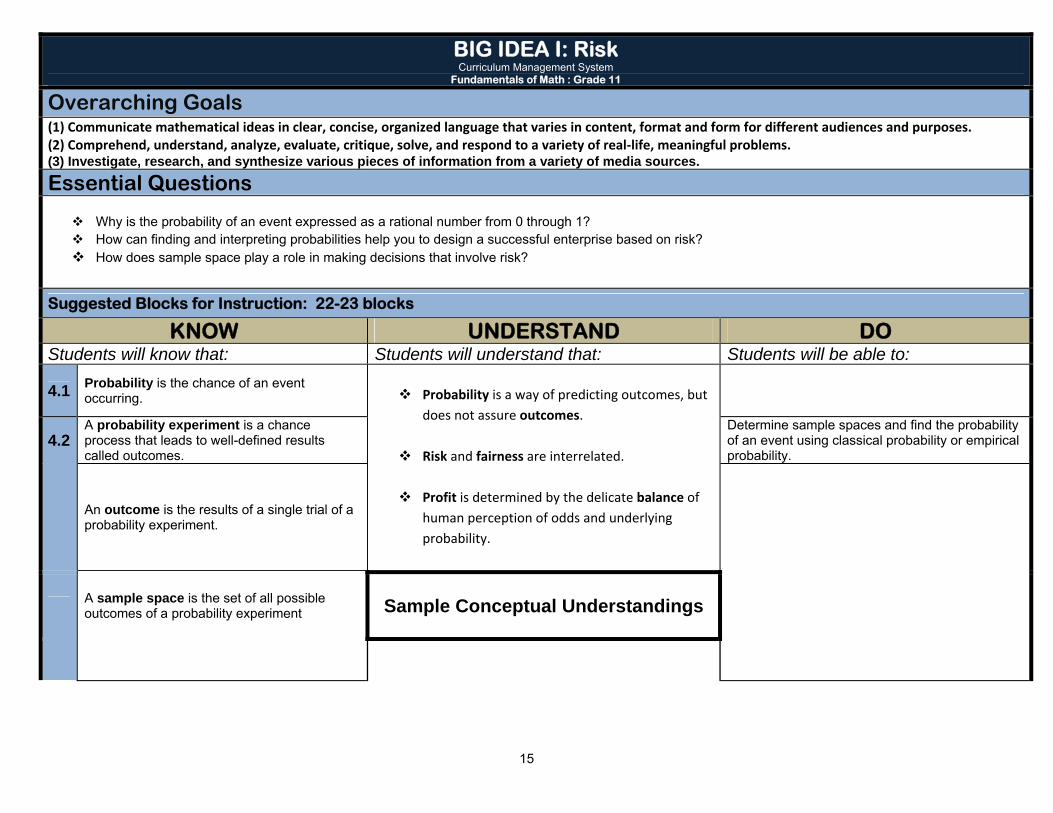
BIG IDEA I: Risk Curriculum Management System
Fundamentals of Math : Grade 11 Overarching Goals (1) Communicate mathematical ideas in clear, concise, organized language that varies in content, format and form for different audiences and purposes. (2) Comprehend, understand, analyze, evaluate, critique, solve, and respond to a variety of real‐life, meaningful problems. (3) Investigate, research, and synthesize various pieces of information from a variety of media sources. Essential Questions
Why is the probability of an event expressed as a rational number from 0 through 1? How can finding and interpreting probabilities help you to design a successful enterprise based on risk? How does sample space play a role in making decisions that involve risk?
Suggested Blocks for Instruction: 22-23 blocks
KNOW UNDERSTAND DO Students will know that: Students will understand that: Students will be able to:
4.1 Probability is the chance of an event occurring.
Probability is a way of predicting outcomes, but
does not assure outcomes.
Risk and fairness are interrelated.
Profit is determined by the delicate balance of human perception of odds and underlying probability.
4.2 A probability experiment is a chance process that leads to well-defined results called outcomes.
Determine sample spaces and find the probability of an event using classical probability or empirical probability.
An outcome is the results of a single trial of a probability experiment.
A sample space is the set of all possible outcomes of a probability experiment Sample Conceptual Understandings
16
A tree diagram is a device consisting of line segments emanating from a starting point and also from the outcome point. It used to determine all possible outcomes of a probability experiment.
In a survey conducted a local restaurant during breakfast hours, 20 people preferred orange juice, 16 preferred grapefruit juice, and 9 preferred apple juice with breakfast. If a person is selected at random, find the probability that a person prefers:
a. Grapefruit juice b. Apple or orange juice c. Did not prefer orange juice d. Neither orange nor grapefruit juice.
Use a tree diagram to outline the outcomes.
An event consists of a set of outcomes of a probability experiment.
There is a 0.39 probability that John will purchase a new car, a 0.73 probability that Mary will purchase a new car, and a 0.36 probability that both will purchase a new car. Find the probability that neither will purchase a new car.
An event with one outcome is called a simple event.
A coin is tossed and a card is drawn from a deck. Find the probability of getting
a. A head and a 6. b. A tail and a red card. c. A diamond and a club.
An event with two or more outcomes is called a compound event.
Of the members of the Blue River Health Club, 43% have a lifetime membership and exercise regularly (three or more times a week). If 75% of the club members exercise regularly find the probability that a randomly selected member is a life member, given that he or she exercises regularly.
Classical probability uses sample spaces to determine the numerical probability than an event will happen.
An automobile license plate consists of 3 letters followed by 4 digits. How many different plates can be made if:
a. repetitions are allowed? b. Repetitions are not allowed?
Equally likely events are events that have the same probability of occurring.
How many ways can 3 outfielders and 4 infielders be chosen from 5 outfielders and 7 infielders if:
a. if positions are not regarded? b. if positions are regarded?
Probability Rule #1: A candy store allows customers to select 3 different candies to be packaged and mailed. If there are 13 varieties available, how many possible selections can be made/
17
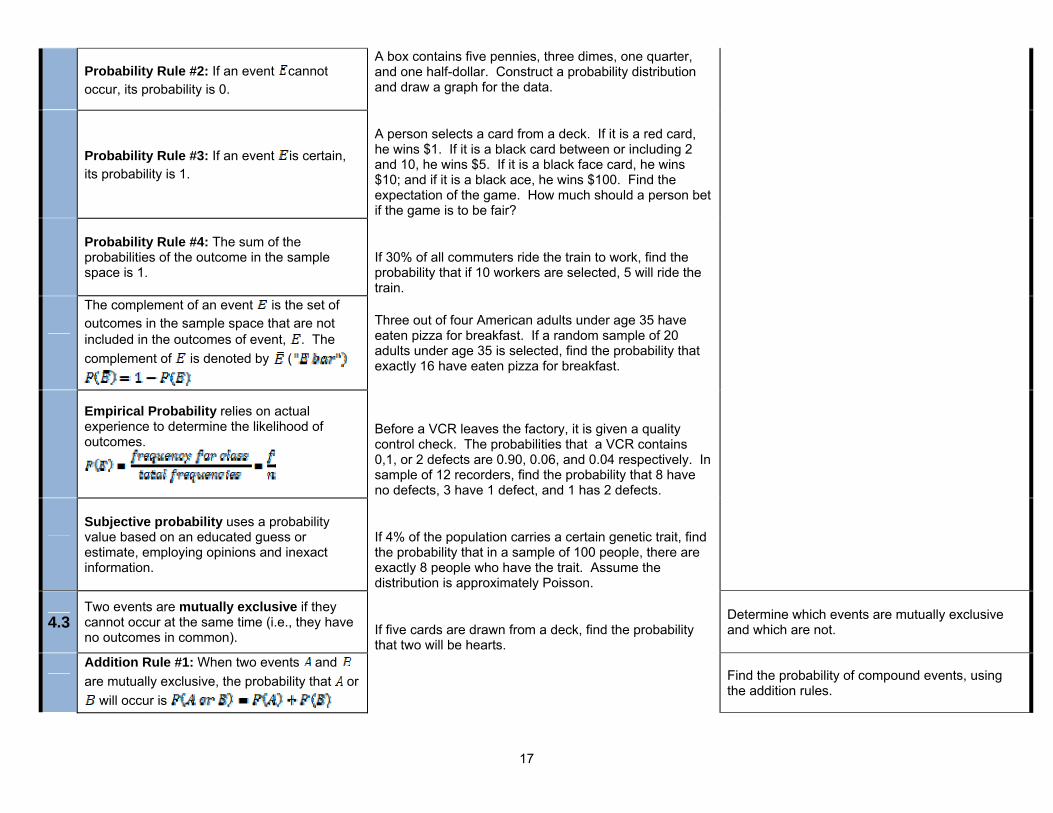
Probability Rule #2: If an event cannot occur, its probability is 0.
A box contains five pennies, three dimes, one quarter, and one half-dollar. Construct a probability distribution and draw a graph for the data.
Probability Rule #3: If an event is certain, its probability is 1.
A person selects a card from a deck. If it is a red card, he wins $1. If it is a black card between or including 2 and 10, he wins $5. If it is a black face card, he wins $10; and if it is a black ace, he wins $100. Find the expectation of the game. How much should a person bet if the game is to be fair?
Probability Rule #4: The sum of the probabilities of the outcome in the sample space is 1.
If 30% of all commuters ride the train to work, find the probability that if 10 workers are selected, 5 will ride the train.
The complement of an event is the set of outcomes in the sample space that are not included in the outcomes of event, . The complement of is denoted by (
Three out of four American adults under age 35 have eaten pizza for breakfast. If a random sample of 20 adults under age 35 is selected, find the probability that exactly 16 have eaten pizza for breakfast.
Empirical Probability relies on actual experience to determine the likelihood of outcomes.
Before a VCR leaves the factory, it is given a quality control check. The probabilities that a VCR contains 0,1, or 2 defects are 0.90, 0.06, and 0.04 respectively. In sample of 12 recorders, find the probability that 8 have no defects, 3 have 1 defect, and 1 has 2 defects.
Subjective probability uses a probability value based on an educated guess or estimate, employing opinions and inexact information.
If 4% of the population carries a certain genetic trait, find the probability that in a sample of 100 people, there are exactly 8 people who have the trait. Assume the distribution is approximately Poisson.
4.3 Two events are mutually exclusive if they cannot occur at the same time (i.e., they have no outcomes in common).
If five cards are drawn from a deck, find the probability that two will be hearts.
Determine which events are mutually exclusive and which are not.
Addition Rule #1: When two events and are mutually exclusive, the probability that or
will occur is Find the probability of compound events, using
the addition rules.
18
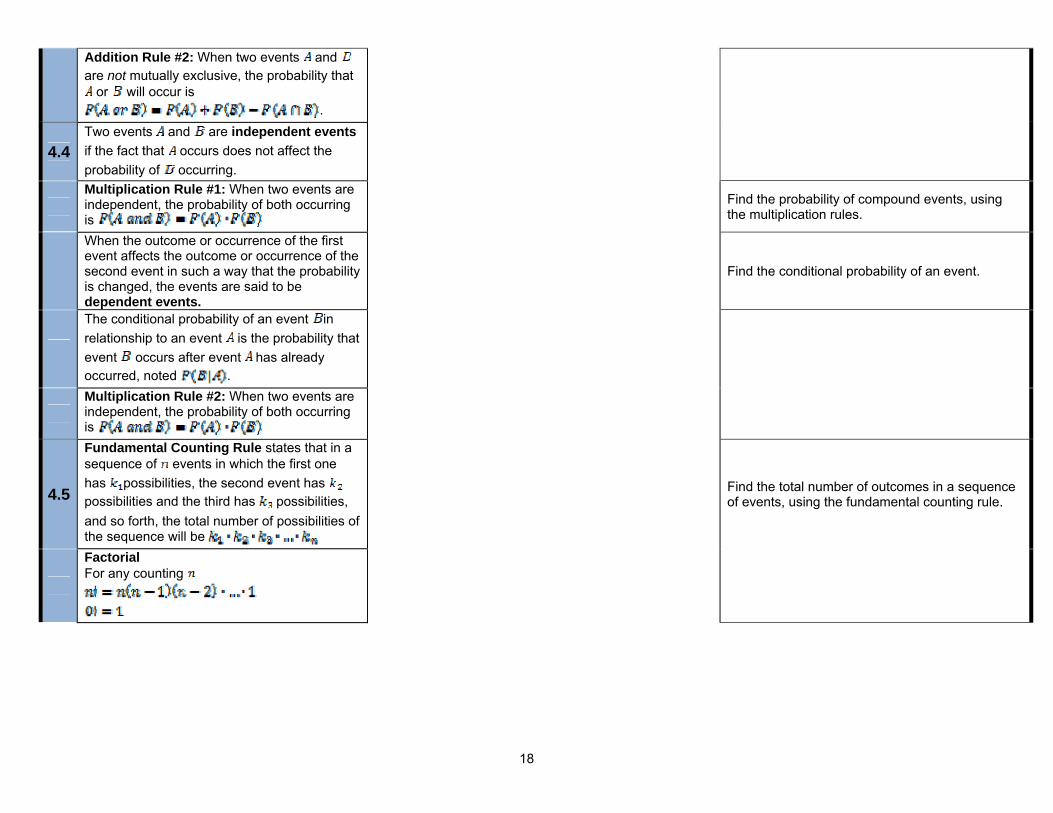
Addition Rule #2: When two events and are not mutually exclusive, the probability that
or will occur is .
4.4 Two events and are independent events if the fact that occurs does not affect the probability of occurring.
Multiplication Rule #1: When two events are independent, the probability of both occurring is
Find the probability of compound events, using the multiplication rules.
When the outcome or occurrence of the first event affects the outcome or occurrence of the second event in such a way that the probability is changed, the events are said to be dependent events.
Find the conditional probability of an event.
The conditional probability of an event in relationship to an event is the probability that event occurs after event has already occurred, noted .
Multiplication Rule #2: When two events are independent, the probability of both occurring is
4.5
Fundamental Counting Rule states that in a sequence of events in which the first one has possibilities, the second event has possibilities and the third has possibilities, and so forth, the total number of possibilities of the sequence will be
Find the total number of outcomes in a sequence of events, using the fundamental counting rule.
Factorial For any counting
19
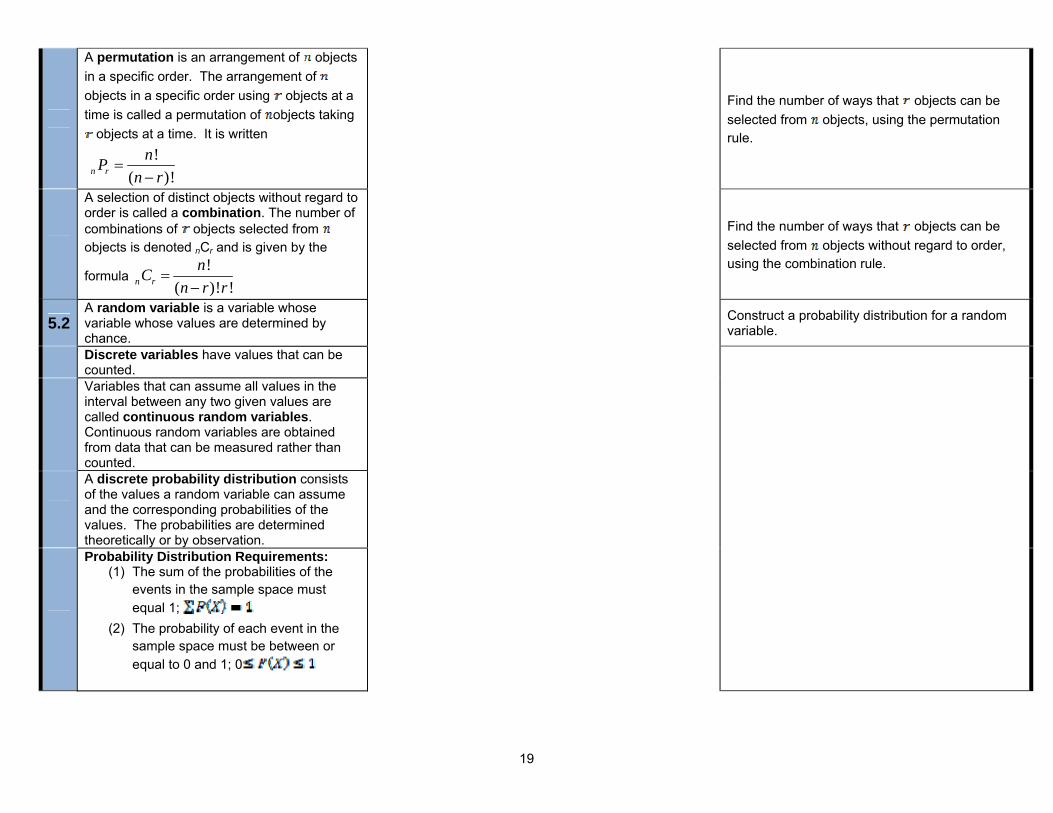
A permutation is an arrangement of objects in a specific order. The arrangement of objects in a specific order using objects at a time is called a permutation of objects taking
objects at a time. It is written
!
( )!n rnP
n r
Find the number of ways that objects can be selected from objects, using the permutation rule.
A selection of distinct objects without regard to order is called a combination. The number of combinations of objects selected from objects is denoted nCr and is given by the
formula !
( )! !n rnC
n r r
Find the number of ways that objects can be selected from objects without regard to order, using the combination rule.
5.2 A random variable is a variable whose variable whose values are determined by chance.
Construct a probability distribution for a random variable.
Discrete variables have values that can be counted.
Variables that can assume all values in the interval between any two given values are called continuous random variables. Continuous random variables are obtained from data that can be measured rather than counted.
A discrete probability distribution consists of the values a random variable can assume and the corresponding probabilities of the values. The probabilities are determined theoretically or by observation.
Probability Distribution Requirements: (1) The sum of the probabilities of the
events in the sample space must equal 1;
(2) The probability of each event in the sample space must be between or equal to 0 and 1; 0
20
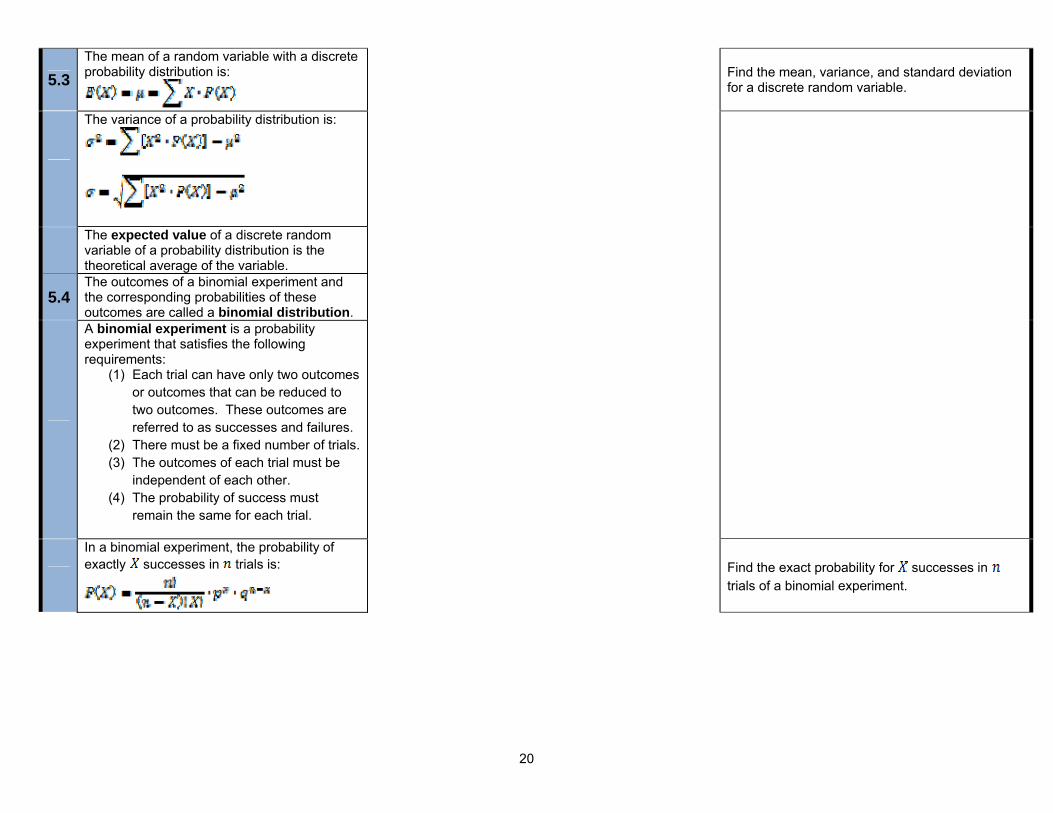
5.3 The mean of a random variable with a discrete probability distribution is:
Find the mean, variance, and standard deviation for a discrete random variable.
The variance of a probability distribution is:
The expected value of a discrete random variable of a probability distribution is the theoretical average of the variable.
5.4 The outcomes of a binomial experiment and the corresponding probabilities of these outcomes are called a binomial distribution.
A binomial experiment is a probability experiment that satisfies the following requirements:
(1) Each trial can have only two outcomes or outcomes that can be reduced to two outcomes. These outcomes are referred to as successes and failures.
(2) There must be a fixed number of trials.(3) The outcomes of each trial must be
independent of each other. (4) The probability of success must
remain the same for each trial.
In a binomial experiment, the probability of exactly successes in trials is:
Find the exact probability for successes in trials of a binomial experiment.
21
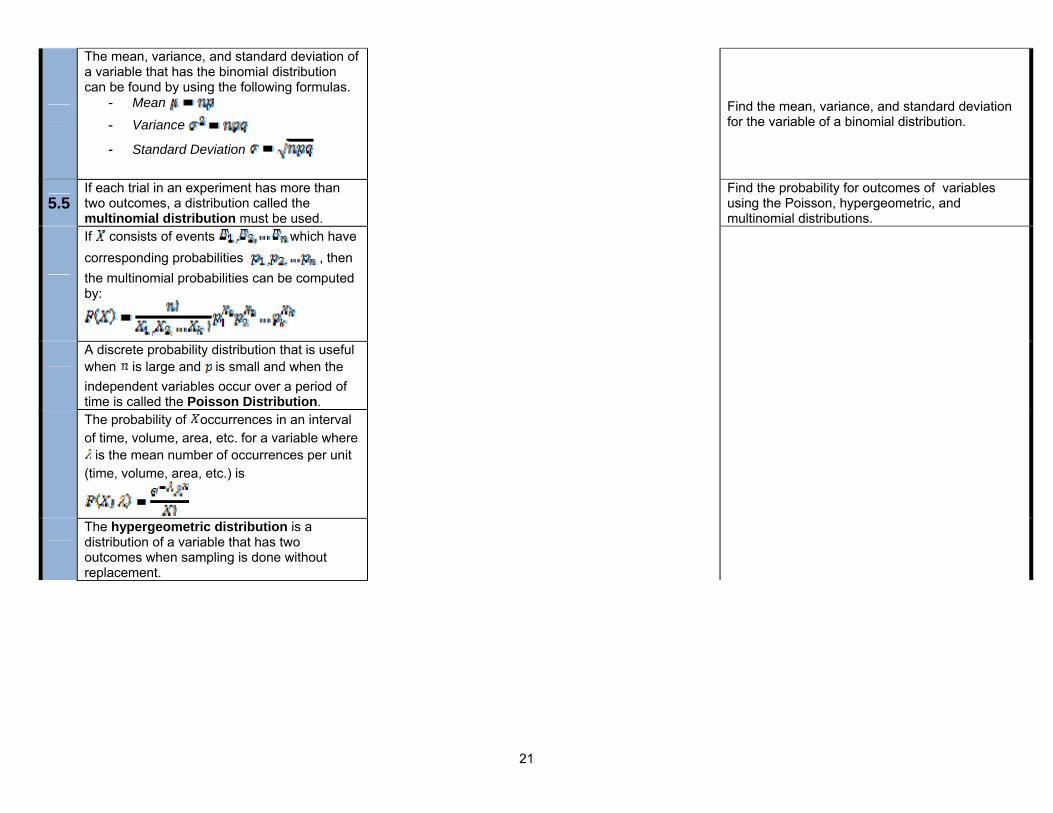
The mean, variance, and standard deviation of a variable that has the binomial distribution can be found by using the following formulas.
- Mean
- Variance
- Standard Deviation
Find the mean, variance, and standard deviation for the variable of a binomial distribution.
5.5 If each trial in an experiment has more than two outcomes, a distribution called the multinomial distribution must be used.
Find the probability for outcomes of variables using the Poisson, hypergeometric, and multinomial distributions.
If consists of events which have corresponding probabilities , then the multinomial probabilities can be computed by:
A discrete probability distribution that is useful when is large and is small and when the independent variables occur over a period of time is called the Poisson Distribution.
The probability of occurrences in an interval of time, volume, area, etc. for a variable where is the mean number of occurrences per unit
(time, volume, area, etc.) is
The hypergeometric distribution is a distribution of a variable that has two outcomes when sampling is done without replacement.
22
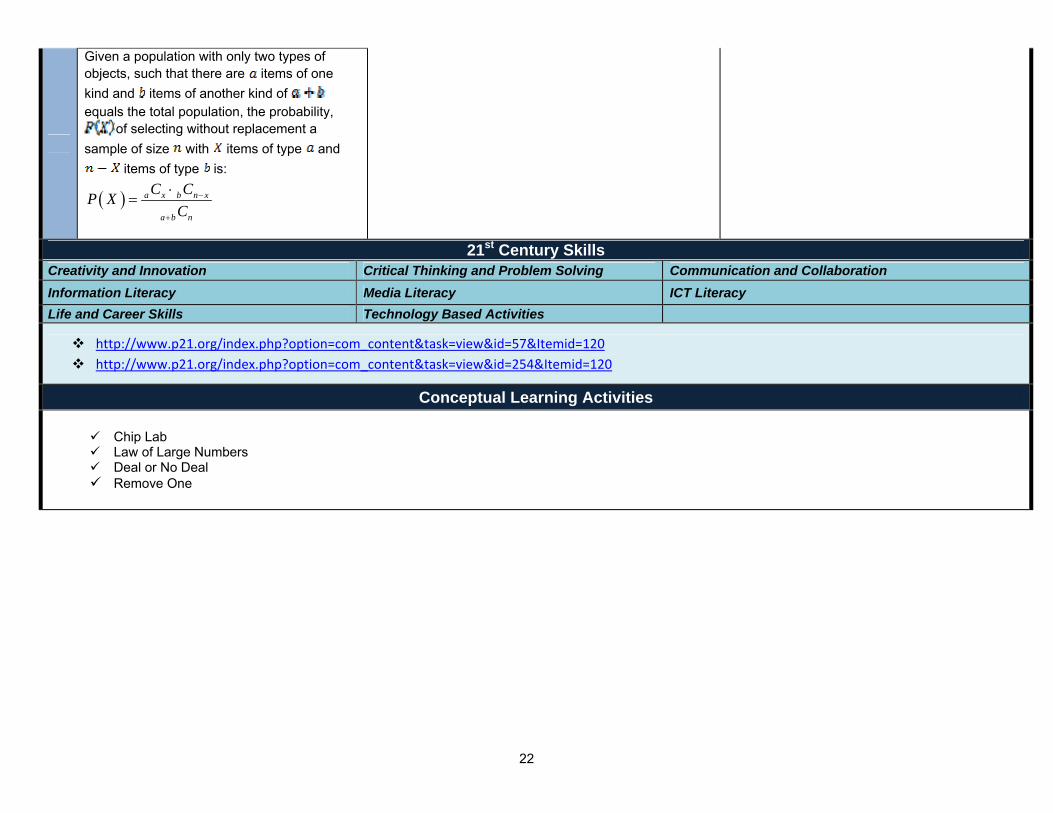
Given a population with only two types of objects, such that there are items of one kind and items of another kind of equals the total population, the probability,
of selecting without replacement a sample of size with items of type and
items of type is:
a x b n x
a b n
C CP XC
21st Century Skills Creativity and Innovation Critical Thinking and Problem Solving Communication and Collaboration
Information Literacy Media Literacy ICT Literacy Life and Career Skills Technology Based Activities
http://www.p21.org/index.php?option=com_content&task=view&id=57&Itemid=120 http://www.p21.org/index.php?option=com_content&task=view&id=254&Itemid=120
Conceptual Learning Activities
Chip Lab Law of Large Numbers Deal or No Deal Remove One
23
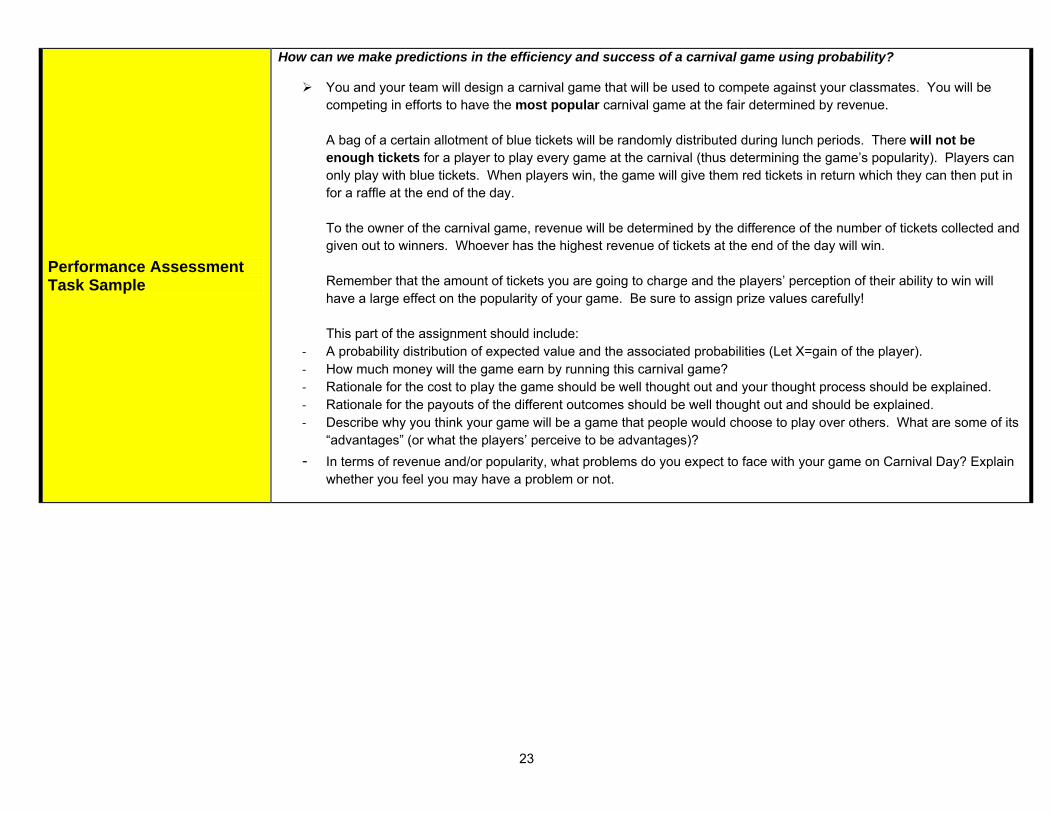
Performance Assessment Task Sample
How can we make predictions in the efficiency and success of a carnival game using probability?
You and your team will design a carnival game that will be used to compete against your classmates. You will be competing in efforts to have the most popular carnival game at the fair determined by revenue. A bag of a certain allotment of blue tickets will be randomly distributed during lunch periods. There will not be enough tickets for a player to play every game at the carnival (thus determining the game’s popularity). Players can only play with blue tickets. When players win, the game will give them red tickets in return which they can then put in for a raffle at the end of the day. To the owner of the carnival game, revenue will be determined by the difference of the number of tickets collected and given out to winners. Whoever has the highest revenue of tickets at the end of the day will win. Remember that the amount of tickets you are going to charge and the players’ perception of their ability to win will have a large effect on the popularity of your game. Be sure to assign prize values carefully! This part of the assignment should include:
‐ A probability distribution of expected value and the associated probabilities (Let X=gain of the player). ‐ How much money will the game earn by running this carnival game? ‐ Rationale for the cost to play the game should be well thought out and your thought process should be explained. ‐ Rationale for the payouts of the different outcomes should be well thought out and should be explained. ‐ Describe why you think your game will be a game that people would choose to play over others. What are some of its
“advantages” (or what the players’ perceive to be advantages)? ‐ In terms of revenue and/or popularity, what problems do you expect to face with your game on Carnival Day? Explain
whether you feel you may have a problem or not.
24
Ass
essm
ent
Mod
els
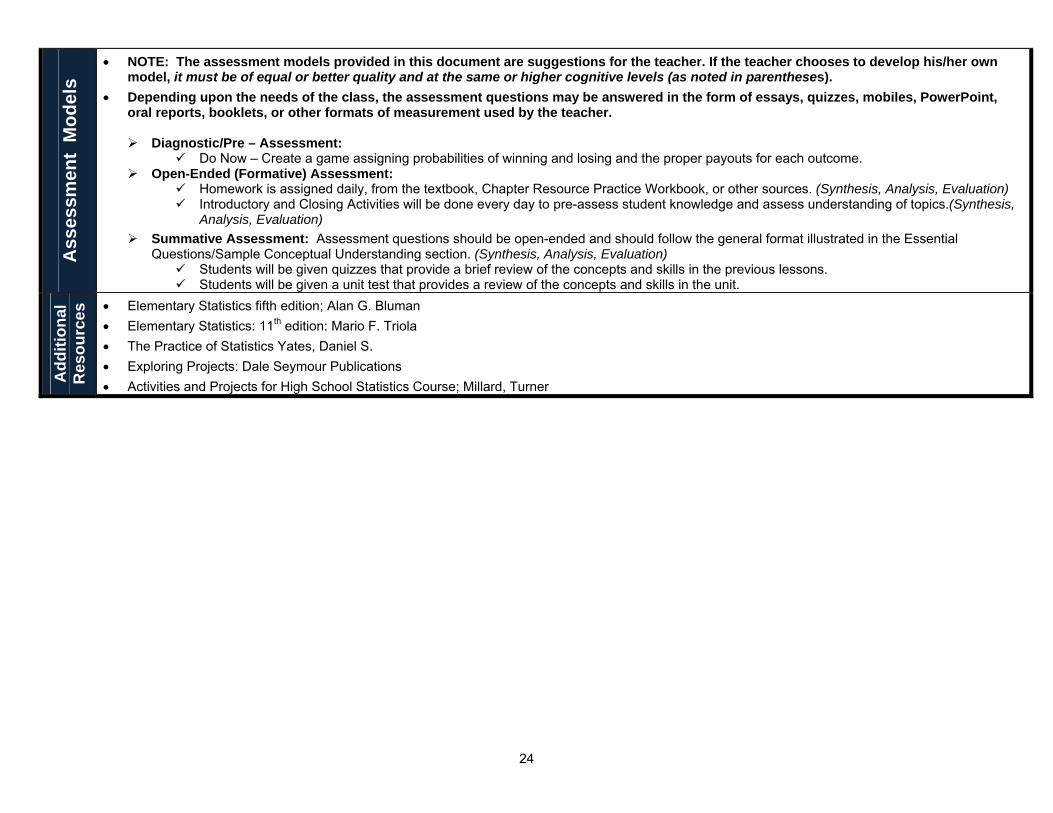
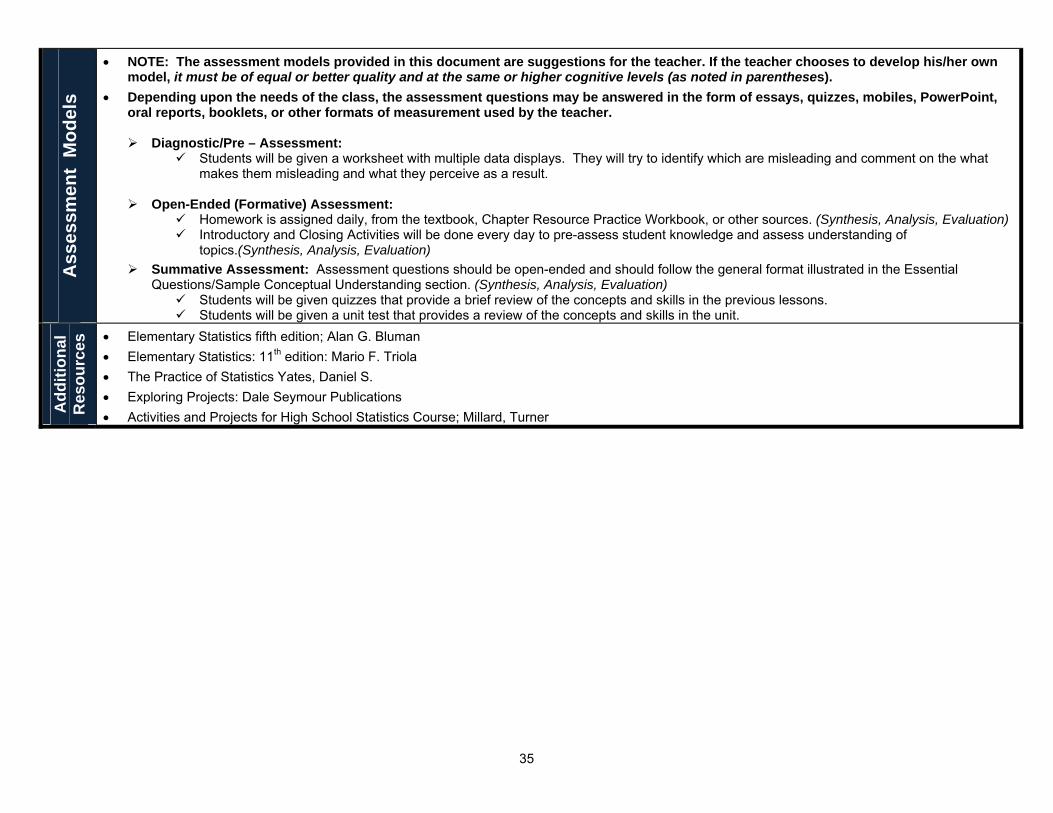
NOTE: The assessment models provided in this document are suggestions for the teacher. If the teacher chooses to develop his/her own model, it must be of equal or better quality and at the same or higher cognitive levels (as noted in parentheses).
Depending upon the needs of the class, the assessment questions may be answered in the form of essays, quizzes, mobiles, PowerPoint, oral reports, booklets, or other formats of measurement used by the teacher.
Diagnostic/Pre – Assessment:
Do Now – Create a game assigning probabilities of winning and losing and the proper payouts for each outcome. Open-Ended (Formative) Assessment:
Homework is assigned daily, from the textbook, Chapter Resource Practice Workbook, or other sources. (Synthesis, Analysis, Evaluation) Introductory and Closing Activities will be done every day to pre-assess student knowledge and assess understanding of topics.(Synthesis,
Analysis, Evaluation) Summative Assessment: Assessment questions should be open-ended and should follow the general format illustrated in the Essential
Questions/Sample Conceptual Understanding section. (Synthesis, Analysis, Evaluation) Students will be given quizzes that provide a brief review of the concepts and skills in the previous lessons. Students will be given a unit test that provides a review of the concepts and skills in the unit.
Add
ition
al
Res
ourc
es Elementary Statistics fifth edition; Alan G. Bluman
Elementary Statistics: 11th edition: Mario F. Triola The Practice of Statistics Yates, Daniel S. Exploring Projects: Dale Seymour Publications Activities and Projects for High School Statistics Course; Millard, Turner
25
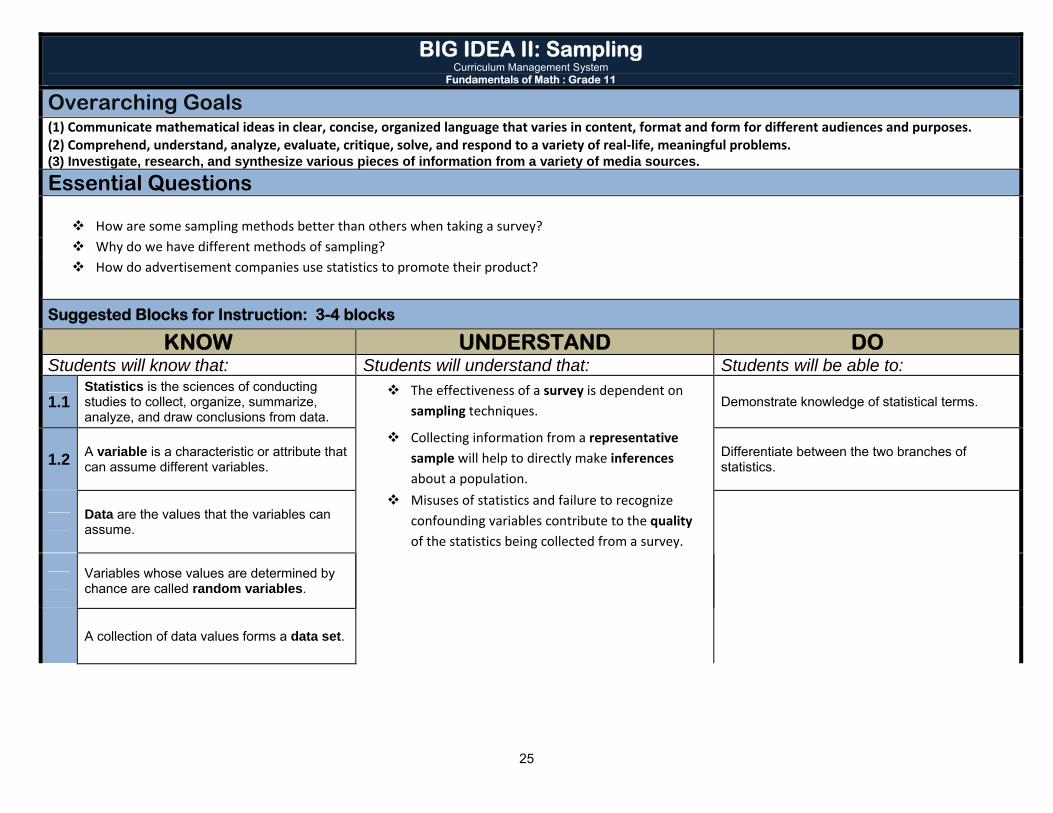
BIG IDEA II: Sampling Curriculum Management System
Fundamentals of Math : Grade 11 Overarching Goals (1) Communicate mathematical ideas in clear, concise, organized language that varies in content, format and form for different audiences and purposes. (2) Comprehend, understand, analyze, evaluate, critique, solve, and respond to a variety of real‐life, meaningful problems. (3) Investigate, research, and synthesize various pieces of information from a variety of media sources. Essential Questions
How are some sampling methods better than others when taking a survey? Why do we have different methods of sampling? How do advertisement companies use statistics to promote their product?
Suggested Blocks for Instruction: 3-4 blocks
KNOW UNDERSTAND DO Students will know that: Students will understand that: Students will be able to:
1.1 Statistics is the sciences of conducting studies to collect, organize, summarize, analyze, and draw conclusions from data.
The effectiveness of a survey is dependent on sampling techniques.
Demonstrate knowledge of statistical terms.
1.2 A variable is a characteristic or attribute that can assume different variables.
Collecting information from a representative sample will help to directly make inferences about a population.
Differentiate between the two branches of statistics.
Data are the values that the variables can assume.
Misuses of statistics and failure to recognize confounding variables contribute to the quality of the statistics being collected from a survey.
Variables whose values are determined by chance are called random variables.
A collection of data values forms a data set.
26
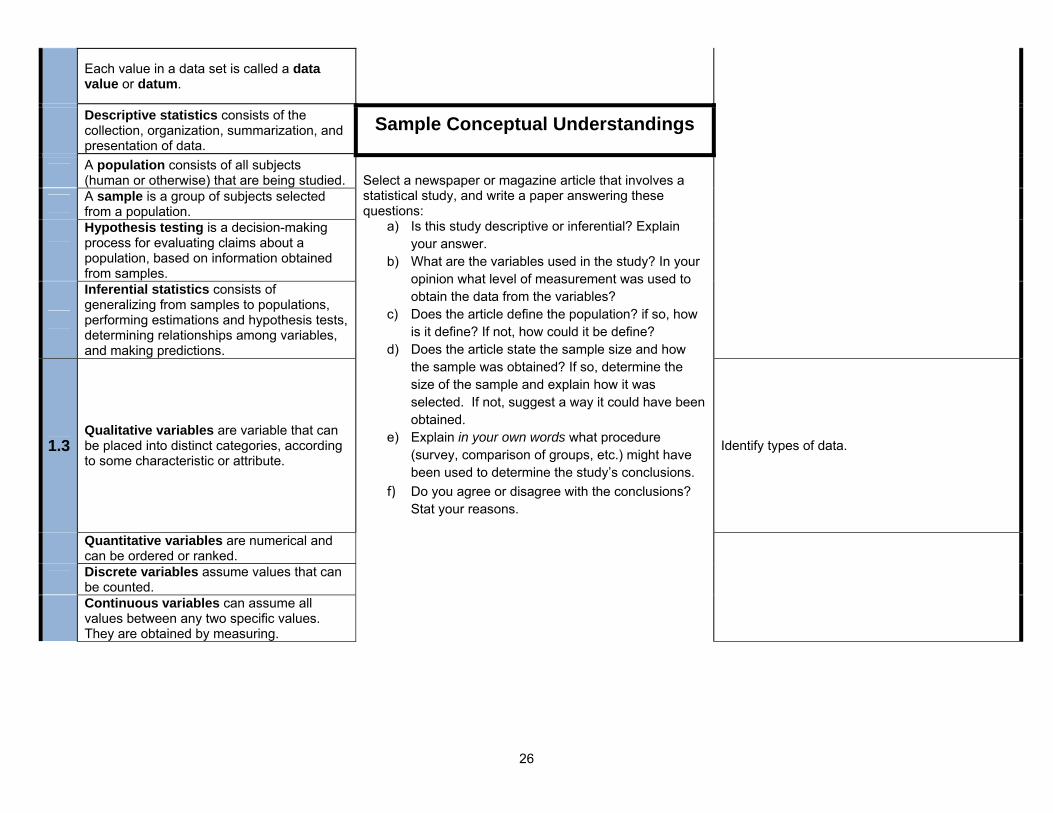
Each value in a data set is called a data value or datum.
Descriptive statistics consists of the collection, organization, summarization, and presentation of data.
Sample Conceptual Understandings
A population consists of all subjects (human or otherwise) that are being studied.
Select a newspaper or magazine article that involves a statistical study, and write a paper answering these questions:
a) Is this study descriptive or inferential? Explain your answer.
b) What are the variables used in the study? In your opinion what level of measurement was used to obtain the data from the variables?
c) Does the article define the population? if so, how is it define? If not, how could it be define?
d) Does the article state the sample size and how the sample was obtained? If so, determine the size of the sample and explain how it was selected. If not, suggest a way it could have been obtained.
e) Explain in your own words what procedure (survey, comparison of groups, etc.) might have been used to determine the study’s conclusions.
f) Do you agree or disagree with the conclusions? Stat your reasons.
A sample is a group of subjects selected from a population.
Hypothesis testing is a decision-making process for evaluating claims about a population, based on information obtained from samples.
Inferential statistics consists of generalizing from samples to populations, performing estimations and hypothesis tests, determining relationships among variables, and making predictions.
1.3 Qualitative variables are variable that can be placed into distinct categories, according to some characteristic or attribute.
Identify types of data.
Quantitative variables are numerical and can be ordered or ranked.
Discrete variables assume values that can be counted.
Continuous variables can assume all values between any two specific values. They are obtained by measuring.
27
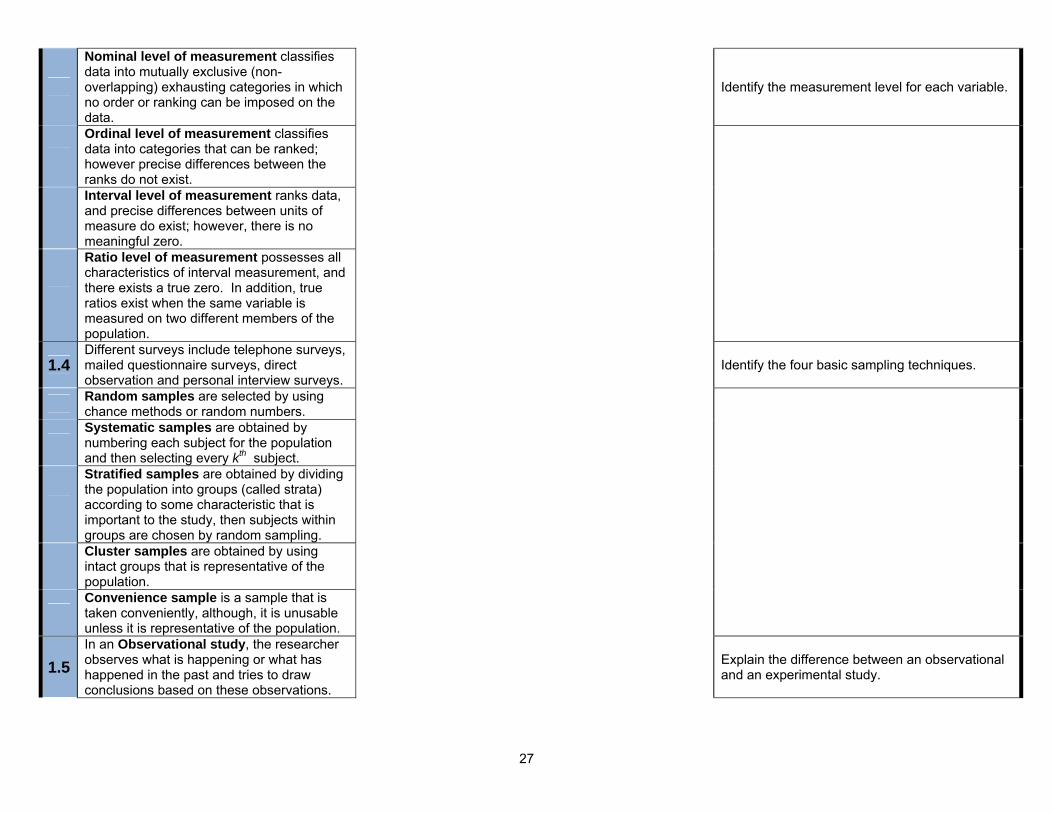
Nominal level of measurement classifies data into mutually exclusive (non-overlapping) exhausting categories in which no order or ranking can be imposed on the data.
Identify the measurement level for each variable.
Ordinal level of measurement classifies data into categories that can be ranked; however precise differences between the ranks do not exist.
Interval level of measurement ranks data, and precise differences between units of measure do exist; however, there is no meaningful zero.
Ratio level of measurement possesses all characteristics of interval measurement, and there exists a true zero. In addition, true ratios exist when the same variable is measured on two different members of the population.
1.4 Different surveys include telephone surveys, mailed questionnaire surveys, direct observation and personal interview surveys.
Identify the four basic sampling techniques.
Random samples are selected by using chance methods or random numbers.
Systematic samples are obtained by numbering each subject for the population and then selecting every kth subject.
Stratified samples are obtained by dividing the population into groups (called strata) according to some characteristic that is important to the study, then subjects within groups are chosen by random sampling.
Cluster samples are obtained by using intact groups that is representative of the population.
Convenience sample is a sample that is taken conveniently, although, it is unusable unless it is representative of the population.
1.5 In an Observational study, the researcher observes what is happening or what has happened in the past and tries to draw conclusions based on these observations.
Explain the difference between an observational and an experimental study.
28
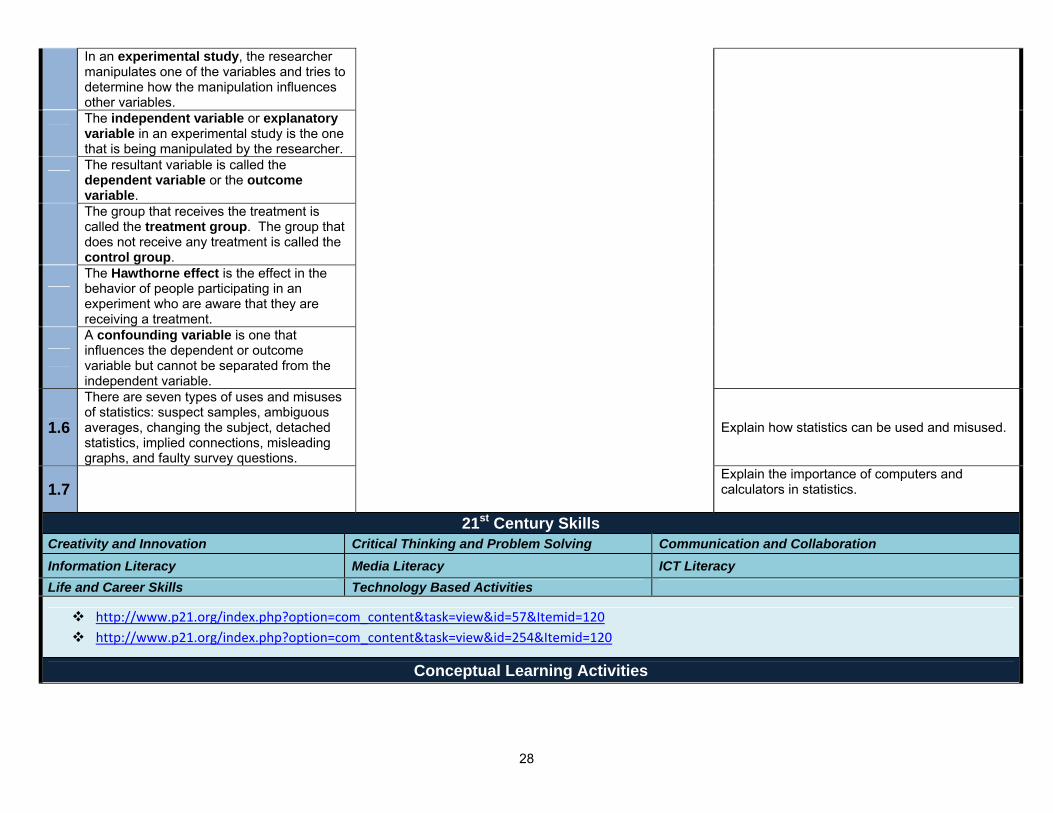
In an experimental study, the researcher manipulates one of the variables and tries to determine how the manipulation influences other variables.
The independent variable or explanatory variable in an experimental study is the one that is being manipulated by the researcher.
The resultant variable is called the dependent variable or the outcome variable.
The group that receives the treatment is called the treatment group. The group that does not receive any treatment is called the control group.
The Hawthorne effect is the effect in the behavior of people participating in an experiment who are aware that they are receiving a treatment.
A confounding variable is one that influences the dependent or outcome variable but cannot be separated from the independent variable.
1.6
There are seven types of uses and misuses of statistics: suspect samples, ambiguous averages, changing the subject, detached statistics, implied connections, misleading graphs, and faulty survey questions.
Explain how statistics can be used and misused.
1.7 Explain the importance of computers and calculators in statistics.
21st Century Skills Creativity and Innovation Critical Thinking and Problem Solving Communication and Collaboration
Information Literacy Media Literacy ICT Literacy Life and Career Skills Technology Based Activities
http://www.p21.org/index.php?option=com_content&task=view&id=57&Itemid=120 http://www.p21.org/index.php?option=com_content&task=view&id=254&Itemid=120
Conceptual Learning Activities
29
Centers Activity: Have students go to different centers and collect different types of data. At each center, they should create an appropriate data display and describe the data using measures of center and dispersion.
Sampling Techniques Have students compare and contrast the different surveying techniques by having them survey topics around the school. Assign students to use two different sampling techniques and compare and contrast the effectiveness/bias of each.
Chapter 1 Jigsaw Presentation
Performance Assessment Task Sample
How can different surveying and sampling techniques help to increase customer attraction to and satisfaction of a carnival game? Students will create a survey that will aid the popularity of their carnival game. The assignment is graded on a rubric. Students will actually conduct the surveys and later in the year, organize them into a data display, and make the appropriate changes to their carnival game as suggested by the survey. The question survey should be constructive in the design of your carnival game. Along with the question, give a clear explanation of why you chose the survey question you did is clear. Develop a pilot survey and make appropriate changes to your survey after Ms. V makes suggestions for edits. The design of the survey should be well thought out- addressing important details of how the survey will be conducted.
Ass
essm
ent
Mod
els
NOTE: The assessment models provided in this document are suggestions for the teacher. If the teacher chooses to develop his/her own model, it must be of equal or better quality and at the same or higher cognitive levels (as noted in parentheses).
Depending upon the needs of the class, the assessment questions may be answered in the form of essays, quizzes, mobiles, PowerPoint, oral reports, booklets, or other formats of measurement used by the teacher. Diagnostic/Pre – Assessment:
Students will be given a research topic that they will hypothetically survey. Ask students to describe, in detail, how they would go about collecting data so that they get the information that they need.
Open-Ended (Formative) Assessment: Homework is assigned daily, from the textbook, Chapter Resource Practice Workbook, or other sources. (Synthesis, Analysis, Evaluation) Introductory and Closing Activities will be done every day to pre-assess student knowledge and assess understanding of
topics.(Synthesis, Analysis, Evaluation) Summative Assessment: Assessment questions should be open-ended and should follow the general format illustrated in the Essential
Questions/Sample Conceptual Understanding section. (Synthesis, Analysis, Evaluation) Students will be given quizzes that provide a brief review of the concepts and skills in the previous lessons. Students will be given a unit test that provides a review of the concepts and skills in the unit.
Add
ition
al
Res
ourc
es Elementary Statistics fifth edition; Alan G. Bluman
Elementary Statistics: 11th edition: Mario F. Triola The Practice of Statistics Yates, Daniel S. Exploring Projects: Dale Seymour Publications Activities and Projects for High School Statistics Course; Millard, Turner
30
BIG IDEA III: Communication Curriculum Management System
Fundamentals of Math : Grade 11 Overarching Goals (1) Communicate mathematical ideas in clear, concise, organized language that varies in content, format and form for different audiences and purposes. (2) Comprehend, understand, analyze, evaluate, critique, solve, and respond to a variety of real‐life, meaningful problems. (3) Investigate, research, and synthesize various pieces of information from a variety of media sources. Essential Questions
How do graphs help companies to help represent data to promote a product? What are the advantages/disadvantages of using graphs to support your data?
Suggested Blocks for Instruction: 8-9 blocks
KNOW UNDERSTAND DO Students will know that: Students will understand that: Students will be able to:
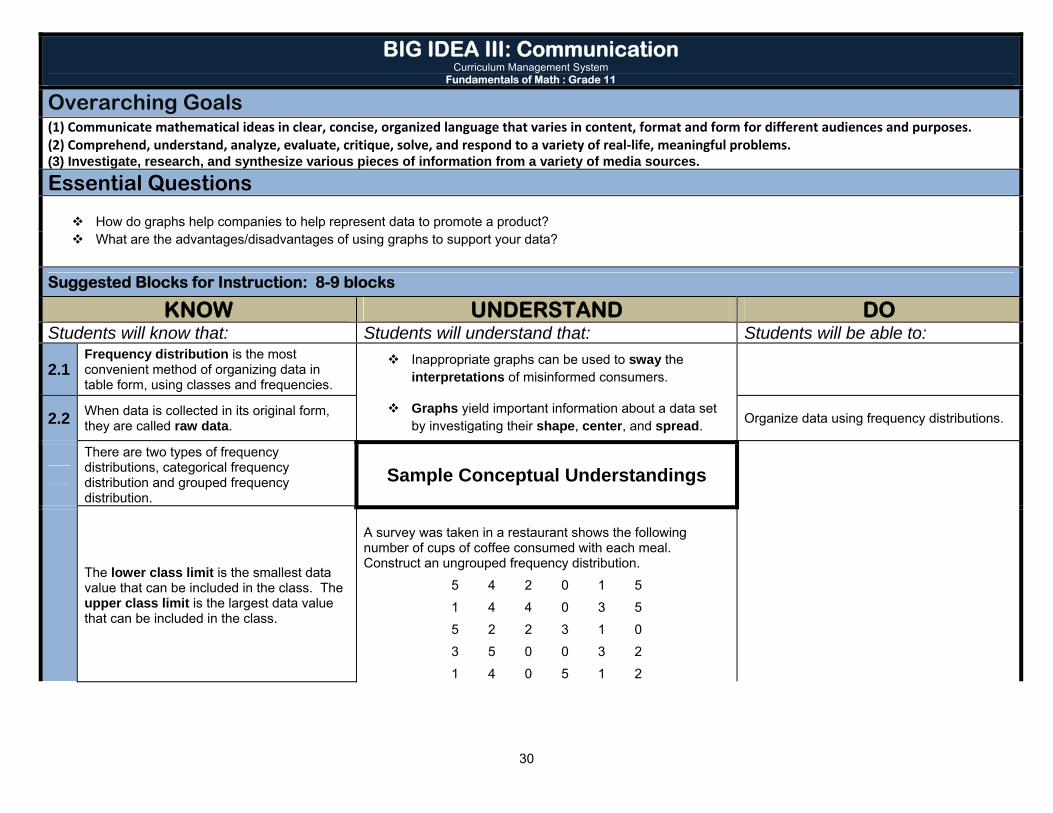
2.1 Frequency distribution is the most convenient method of organizing data in table form, using classes and frequencies.
Inappropriate graphs can be used to sway the interpretations of misinformed consumers.
2.2 When data is collected in its original form, they are called raw data.
Graphs yield important information about a data set by investigating their shape, center, and spread. Organize data using frequency distributions.
There are two types of frequency distributions, categorical frequency distribution and grouped frequency distribution.
Sample Conceptual Understandings
The lower class limit is the smallest data value that can be included in the class. The upper class limit is the largest data value that can be included in the class.
A survey was taken in a restaurant shows the following number of cups of coffee consumed with each meal. Construct an ungrouped frequency distribution.
5 4 2 0 1 5 1 4 4 0 3 5
5 2 2 3 1 0 3 5 0 0 3 2
1 4 0 5 1 2
31
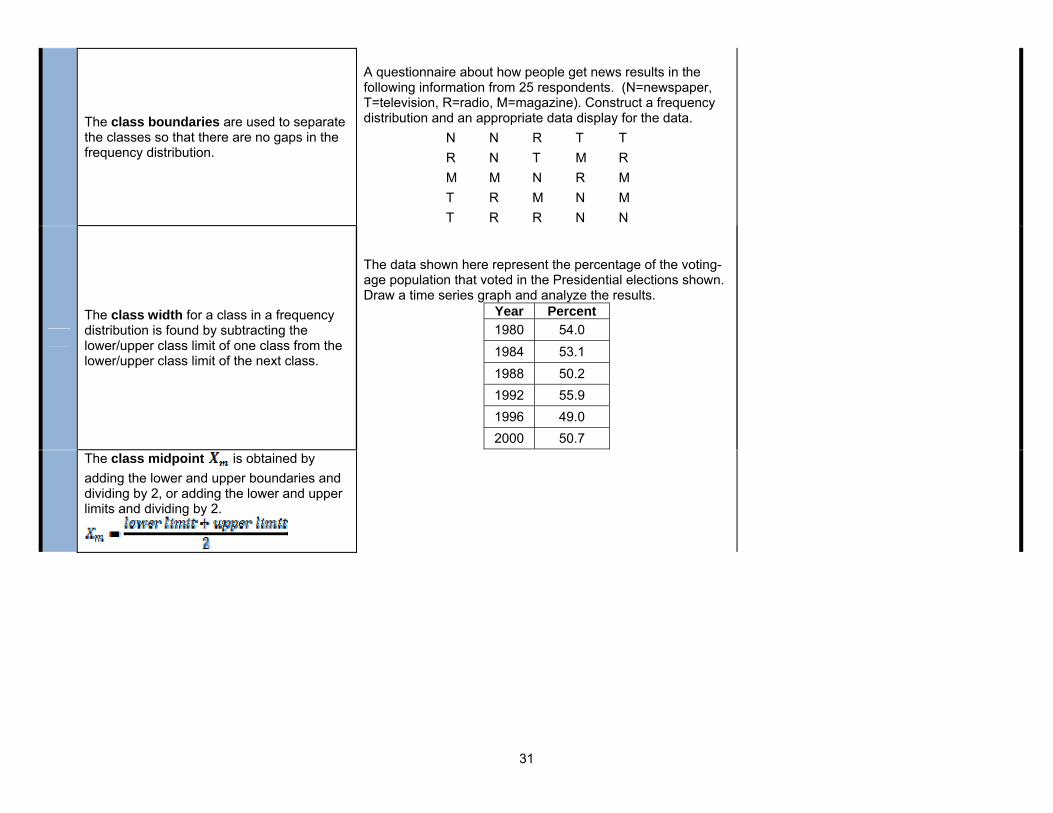
The class boundaries are used to separate the classes so that there are no gaps in the frequency distribution.
A questionnaire about how people get news results in the following information from 25 respondents. (N=newspaper, T=television, R=radio, M=magazine). Construct a frequency distribution and an appropriate data display for the data.
N N R T T R N T M R M M N R M T R M N M T R R N N
The class width for a class in a frequency distribution is found by subtracting the lower/upper class limit of one class from the lower/upper class limit of the next class.
The data shown here represent the percentage of the voting-age population that voted in the Presidential elections shown. Draw a time series graph and analyze the results.
Year Percent 1980 54.0 1984 53.1 1988 50.2 1992 55.9 1996 49.0 2000 50.7
The class midpoint is obtained by adding the lower and upper boundaries and dividing by 2, or adding the lower and upper limits and dividing by 2.
32
Rules for a frequency distribution: 1. There should be between 5 and 20
classes. 2. The class width should be an odd
number. 3. The classes must be mutually exclusive. 4. The classes must be continuous. 5. The classes must be exhaustive. 6. The classes must be equal in width.
Open-ended distributions occur when there is no specific beginning or no specific ending value.
The reasons for constructing a frequency distribution are: 1. To organize the data in a meaningful
way. 2. To enable the reader to determine the
nature or shape of the distribution. 3. To facilitate computational procedures
for measures of center and spread. 4. To enable the researcher to draw charts
and graphs for the presentation of data. 5. To enable the reader to make
comparisons among different data sets.
2.3 The three most commonly used graphs in research are the histogram, the frequency polygon, and the ogive.
Represent data in frequency distributions graphically using histograms, frequency polygons, and ogives.
The histogram is a graph that displays the data by using contiguous vertical bars (unless the frequency of a class is 0) of various heights to represent the frequencies of the classes.
The frequency polygon is a graph that displays the data by using lines that connect points plotted for the frequencies at the midpoints of the classes. The frequencies are represented by the heights of the points.
33
The ogive is a graph that represents the cumulative frequencies for the classes in a frequency distribution.
Graphs that use proportions (%) to display data instead of raw values are called relative frequency graphs.
The most common shapes used to describe a frequency graph are: bell shaped, uniform, J-shaped, reverse J-shaped, right/left skewed, bimodal and U-Shaped.
2.4
A Pareto chart is used to represent a frequency distribution for a categorical variable and the frequencies are displayed by the heights of vertical bars, which are arranged in order from highest to lowest.
Represent data using Pareto charts, time series graphs, and pie graphs.
A time series graph represents data that occurs over a specific period of time.
A pie graph is a circle that is divided into sections or wedges according to the percentage of frequencies in each category of the distribution.
Misuses of graphs include: 1. Vertical scales 2. Exaggerating one-dimensional increase
by showing it in two dimensions. 3. Omitting labels or units on the aces of
the graph.
A stem and leaf plot is a data plot that uses part of the data value as the stem and part of the data value as the leaf to form groups or classes.
Draw and interpret a stem and leaf plot.
Scatterplots are used to graph two quantitative variables to measure a relationship.
34
Positive correlation is when as the independent variable is increasing, the dependent variable is also increasing. Negative correlation is when as the independent variable is increasing, the dependent variable is decreasing. No correlation is when there is no apparent relationship between the variables.
The slope of the line of best fit measures the rate of change per one unit increase in the independent variable.
The y-intercept is the starting point when the independent variable is set to 0.
21st Century Skills Creativity and Innovation Critical Thinking and Problem Solving Communication and Collaboration
Information Literacy Media Literacy ICT Literacy Life and Career Skills Technology Based Activities
http://www.p21.org/index.php?option=com_content&task=view&id=57&Itemid=120 http://www.p21.org/index.php?option=com_content&task=view&id=254&Itemid=120
Conceptual Learning Activities
Dice Poster Project Frequency Lab
Performance Assessment Task Sample
How can data be used to a carnival game’s advantage to improve public opinion? Students will take the data they collected from the Performance Task in the previous surveying unit. They will organize the information into a frequency distribution (either grouped or categorical depending on question asked). Students will then create a graph (or many graphs) of the data and commentary on what it shows. Use a stem and leaf plot, histogram, Pareto Chart, and/or pie chart. (Time series graph is not really relevant here unless you are conducting the survey over time.) Students will then draw conclusions based on the survey. Then students will be asked to give an explanation of how the survey question will help you to improve your game is clear and well thought out. The changes will be made to the carnival game blueprint/rules/etc. to demonstrate the changes in the game.
35
Ass
essm
ent
Mod
els
NOTE: The assessment models provided in this document are suggestions for the teacher. If the teacher chooses to develop his/her own model, it must be of equal or better quality and at the same or higher cognitive levels (as noted in parentheses).
Depending upon the needs of the class, the assessment questions may be answered in the form of essays, quizzes, mobiles, PowerPoint, oral reports, booklets, or other formats of measurement used by the teacher.
Diagnostic/Pre – Assessment:
Students will be given a worksheet with multiple data displays. They will try to identify which are misleading and comment on the what makes them misleading and what they perceive as a result.
Open-Ended (Formative) Assessment: Homework is assigned daily, from the textbook, Chapter Resource Practice Workbook, or other sources. (Synthesis, Analysis, Evaluation) Introductory and Closing Activities will be done every day to pre-assess student knowledge and assess understanding of
topics.(Synthesis, Analysis, Evaluation) Summative Assessment: Assessment questions should be open-ended and should follow the general format illustrated in the Essential
Questions/Sample Conceptual Understanding section. (Synthesis, Analysis, Evaluation) Students will be given quizzes that provide a brief review of the concepts and skills in the previous lessons. Students will be given a unit test that provides a review of the concepts and skills in the unit.
Add
ition
al
Res
ourc
es Elementary Statistics fifth edition; Alan G. Bluman
Elementary Statistics: 11th edition: Mario F. Triola The Practice of Statistics Yates, Daniel S. Exploring Projects: Dale Seymour Publications Activities and Projects for High School Statistics Course; Millard, Turner
36
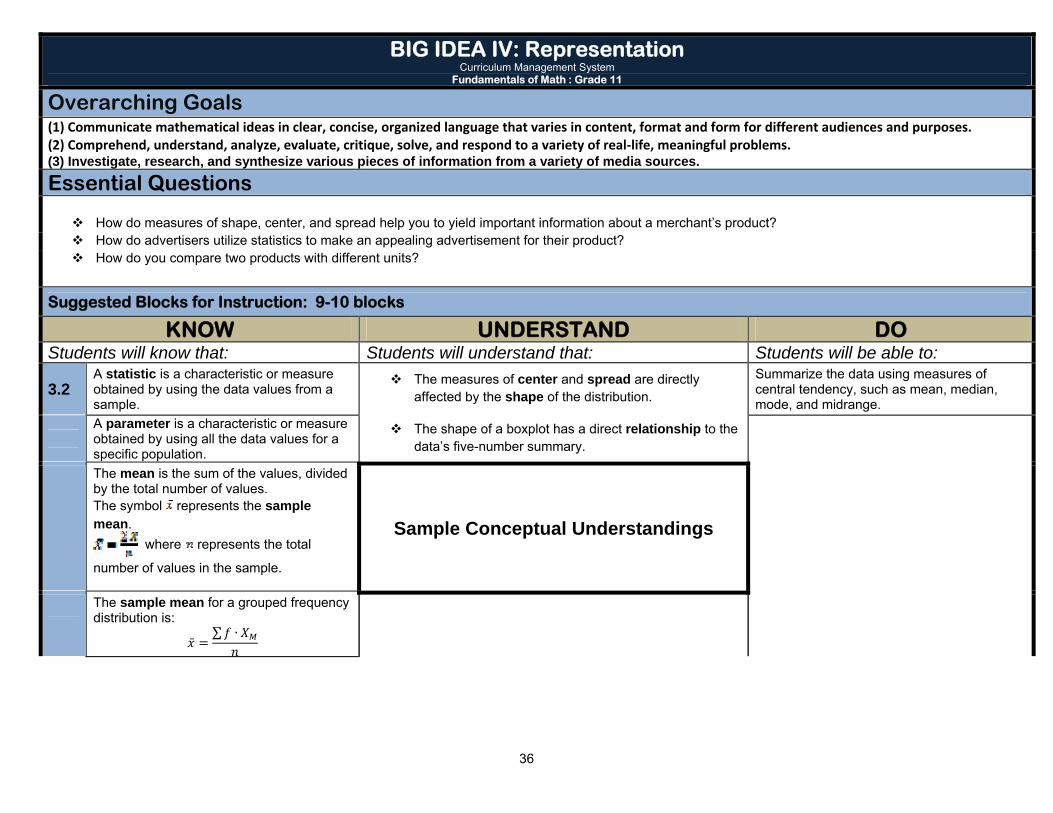
BIG IDEA IV: Representation Curriculum Management System
Fundamentals of Math : Grade 11 Overarching Goals (1) Communicate mathematical ideas in clear, concise, organized language that varies in content, format and form for different audiences and purposes. (2) Comprehend, understand, analyze, evaluate, critique, solve, and respond to a variety of real‐life, meaningful problems. (3) Investigate, research, and synthesize various pieces of information from a variety of media sources. Essential Questions
How do measures of shape, center, and spread help you to yield important information about a merchant’s product? How do advertisers utilize statistics to make an appealing advertisement for their product? How do you compare two products with different units?
Suggested Blocks for Instruction: 9-10 blocks
KNOW UNDERSTAND DO Students will know that: Students will understand that: Students will be able to:
3.2 A statistic is a characteristic or measure obtained by using the data values from a sample.
The measures of center and spread are directly affected by the shape of the distribution.
Summarize the data using measures of central tendency, such as mean, median, mode, and midrange.
A parameter is a characteristic or measure obtained by using all the data values for a specific population.
The shape of a boxplot has a direct relationship to the data’s five-number summary.
The mean is the sum of the values, divided by the total number of values. The symbol represents the sample mean.
where represents the total
number of values in the sample.
Sample Conceptual Understandings
∑ ∙
The sample mean for a grouped frequency distribution is:
37
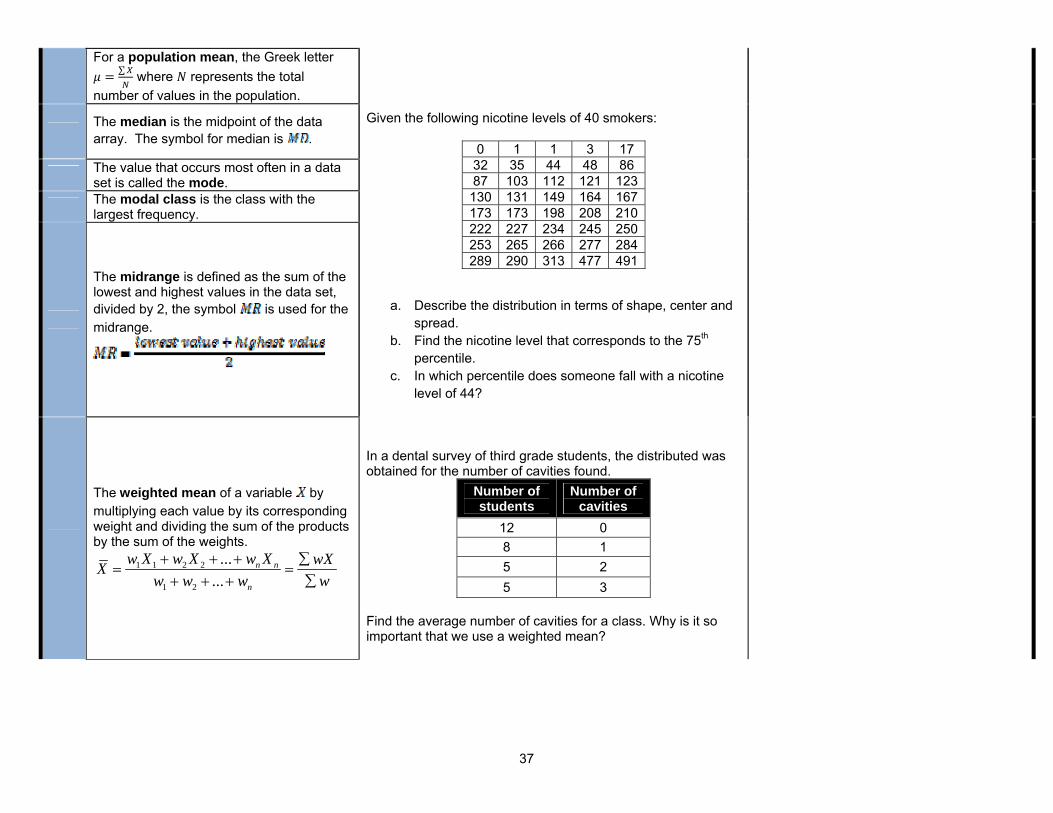
For a population mean, the Greek letter
∑ where represents the total number of values in the population.
Given the following nicotine levels of 40 smokers:
0 1 1 3 17 32 35 44 48 86 87 103 112 121 123 130 131 149 164 167 173 173 198 208 210 222 227 234 245 250 253 265 266 277 284 289 290 313 477 491
a. Describe the distribution in terms of shape, center and spread.
b. Find the nicotine level that corresponds to the 75th percentile.
c. In which percentile does someone fall with a nicotine level of 44?
The median is the midpoint of the data array. The symbol for median is .
The value that occurs most often in a data set is called the mode.
The modal class is the class with the largest frequency.
The midrange is defined as the sum of the lowest and highest values in the data set, divided by 2, the symbol is used for the midrange.
The weighted mean of a variable by multiplying each value by its corresponding weight and dividing the sum of the products by the sum of the weights.
1 1 2 2
1 2
......
n n
n
w X w X w X wXXw w w w
In a dental survey of third grade students, the distributed was obtained for the number of cavities found.
Number of students
Number of cavities
12 0 8 1 5 2 5 3
Find the average number of cavities for a class. Why is it so important that we use a weighted mean?
38
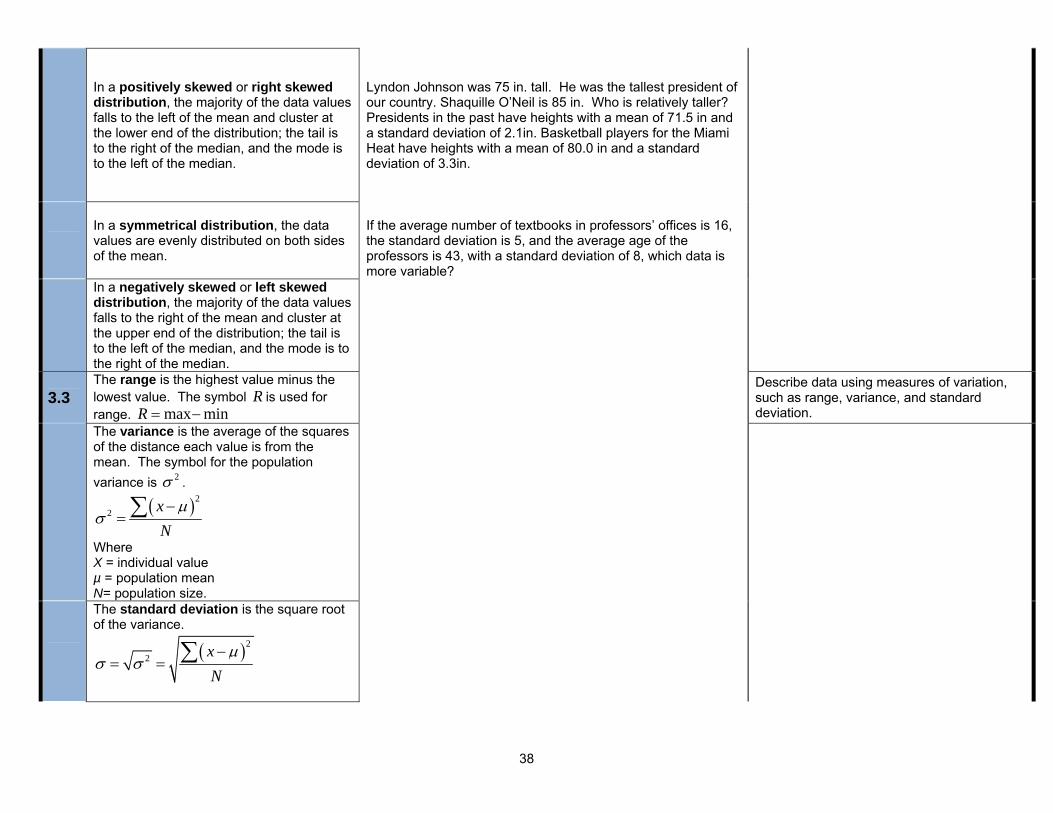
In a positively skewed or right skewed distribution, the majority of the data values falls to the left of the mean and cluster at the lower end of the distribution; the tail is to the right of the median, and the mode is to the left of the median.
Lyndon Johnson was 75 in. tall. He was the tallest president of our country. Shaquille O’Neil is 85 in. Who is relatively taller? Presidents in the past have heights with a mean of 71.5 in and a standard deviation of 2.1in. Basketball players for the Miami Heat have heights with a mean of 80.0 in and a standard deviation of 3.3in.
In a symmetrical distribution, the data values are evenly distributed on both sides of the mean.
If the average number of textbooks in professors’ offices is 16, the standard deviation is 5, and the average age of the professors is 43, with a standard deviation of 8, which data is more variable?
In a negatively skewed or left skewed distribution, the majority of the data values falls to the right of the mean and cluster at the upper end of the distribution; the tail is to the left of the median, and the mode is to the right of the median.
3.3 The range is the highest value minus the lowest value. The symbol R is used for range. max minR
Describe data using measures of variation, such as range, variance, and standard deviation.
The variance is the average of the squares of the distance each value is from the mean. The symbol for the population variance is 2 .
22 x
N
Where X = individual value µ = population mean N= population size.
The standard deviation is the square root of the variance.
22 x
N
39
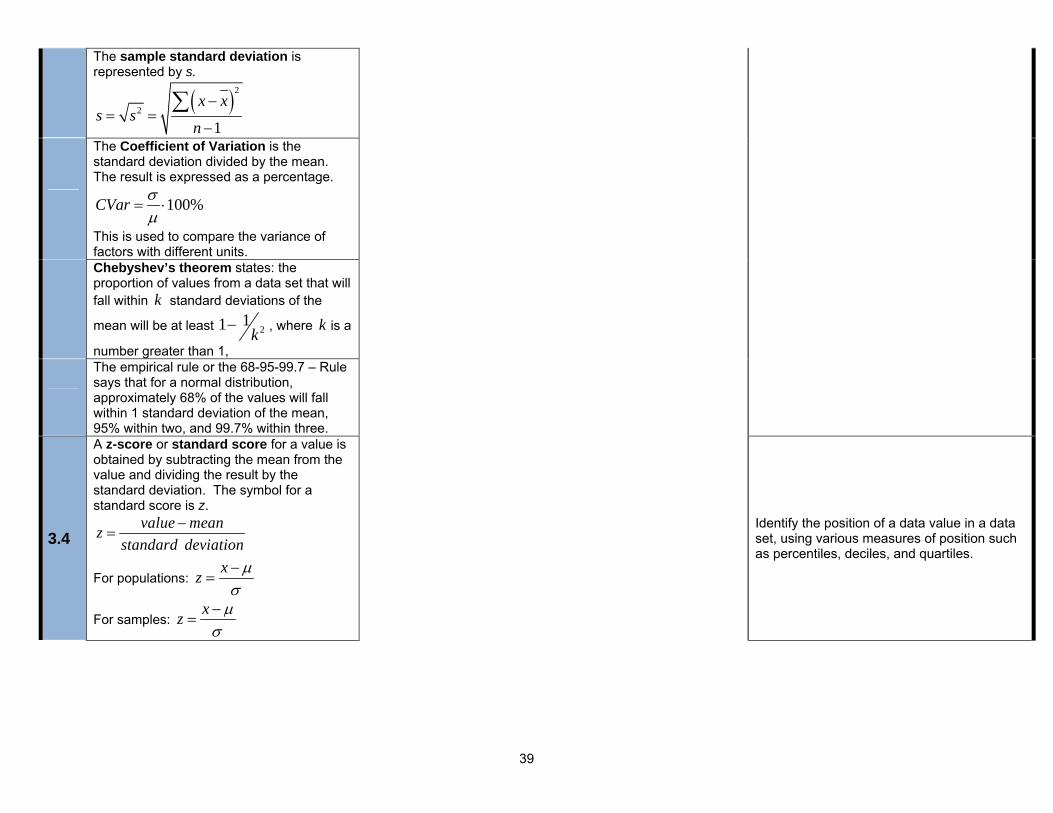
The sample standard deviation is represented by s.
2
2
1
x xs s
n
The Coefficient of Variation is the standard deviation divided by the mean. The result is expressed as a percentage.
100%CVar
This is used to compare the variance of factors with different units.
Chebyshev’s theorem states: the proportion of values from a data set that will fall within k standard deviations of the
mean will be at least 211 k , where k is a
number greater than 1,
The empirical rule or the 68-95-99.7 – Rule says that for a normal distribution, approximately 68% of the values will fall within 1 standard deviation of the mean, 95% within two, and 99.7% within three.
3.4
A z-score or standard score for a value is obtained by subtracting the mean from the value and dividing the result by the standard deviation. The symbol for a standard score is z.
value meanzstandard deviation
For populations: xz
For samples: xz
Identify the position of a data value in a data set, using various measures of position such as percentiles, deciles, and quartiles.
40
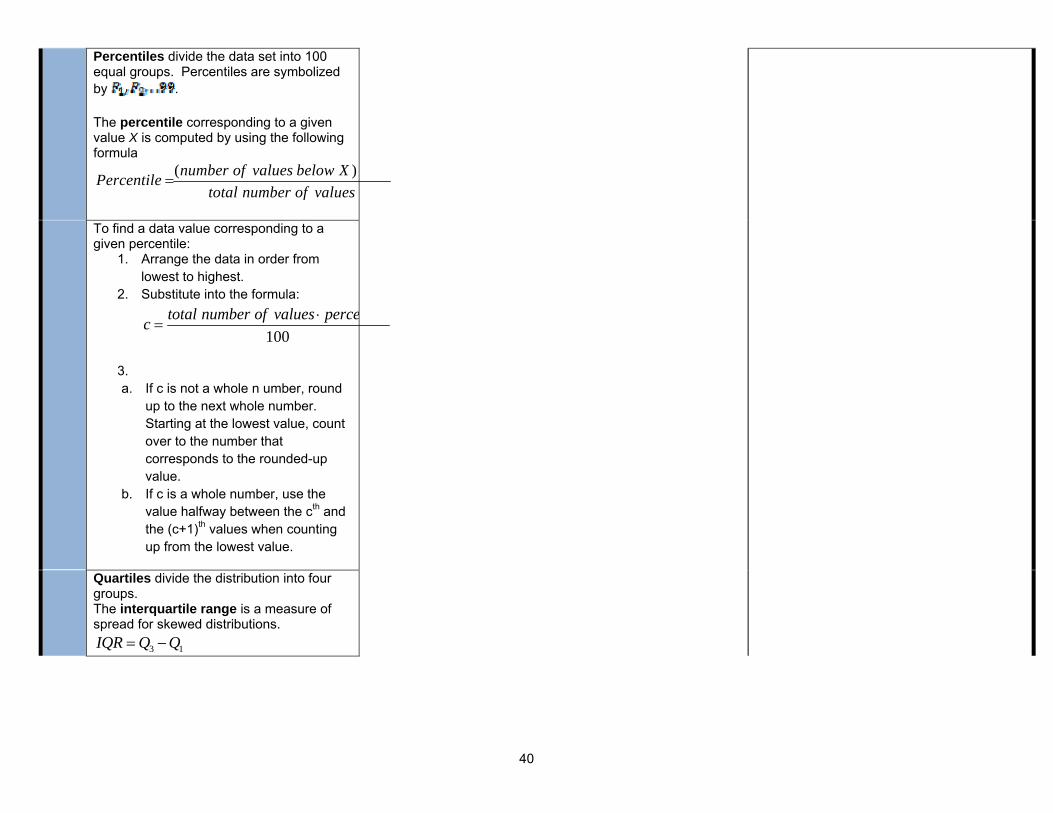
Percentiles divide the data set into 100 equal groups. Percentiles are symbolized by . The percentile corresponding to a given value X is computed by using the following formula
( )number of values below XPercentiletotal number of values
To find a data value corresponding to a given percentile:
1. Arrange the data in order from lowest to highest.
2. Substitute into the formula:
100total number of values percec
3. a. If c is not a whole n umber, round
up to the next whole number. Starting at the lowest value, count over to the number that corresponds to the rounded-up value.
b. If c is a whole number, use the value halfway between the cth and the (c+1)th values when counting up from the lowest value.
Quartiles divide the distribution into four groups. The interquartile range is a measure of spread for skewed distributions.
3 1IQR Q Q
41
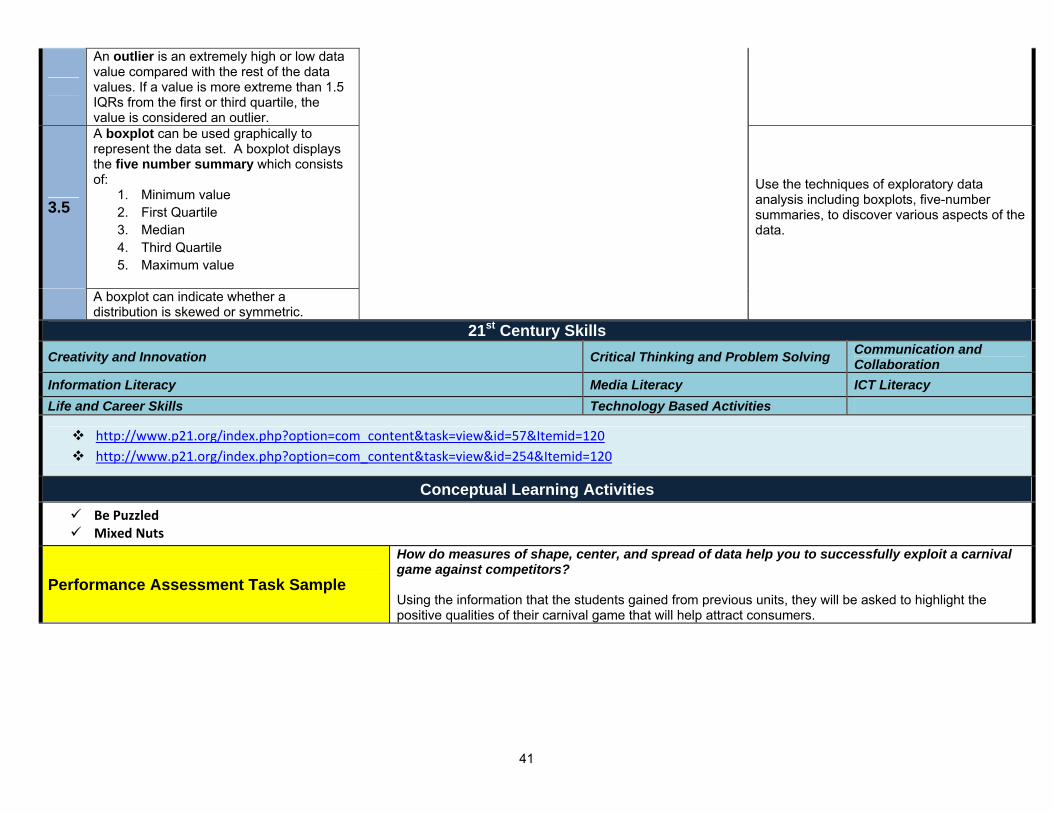
An outlier is an extremely high or low data value compared with the rest of the data values. If a value is more extreme than 1.5 IQRs from the first or third quartile, the value is considered an outlier.
3.5
A boxplot can be used graphically to represent the data set. A boxplot displays the five number summary which consists of:
1. Minimum value 2. First Quartile 3. Median 4. Third Quartile 5. Maximum value
Use the techniques of exploratory data analysis including boxplots, five-number summaries, to discover various aspects of the data.
A boxplot can indicate whether a distribution is skewed or symmetric.
21st Century Skills Creativity and Innovation Critical Thinking and Problem Solving Communication and
CollaborationInformation Literacy Media Literacy ICT Literacy Life and Career Skills Technology Based Activities
http://www.p21.org/index.php?option=com_content&task=view&id=57&Itemid=120 http://www.p21.org/index.php?option=com_content&task=view&id=254&Itemid=120
Conceptual Learning Activities
Be Puzzled Mixed Nuts
Performance Assessment Task Sample
How do measures of shape, center, and spread of data help you to successfully exploit a carnival game against competitors? Using the information that the students gained from previous units, they will be asked to highlight the positive qualities of their carnival game that will help attract consumers.
42
Ass
essm
ent
Mod
els
NOTE: The assessment models provided in this document are suggestions for the teacher. If the teacher chooses to develop his/her own model, it must be of equal or better quality and at the same or higher cognitive levels (as noted in parentheses).
Depending upon the needs of the class, the assessment questions may be answered in the form of essays, quizzes, mobiles, PowerPoint, oral reports, booklets, or other formats of measurement used by the teacher.
Diagnostic/Pre – Assessment:
Students will be given a set of data and ask them to organize it the best they can and explain their methodologies. Then the students will be instructed to “draw a picture” of the information to the best of their ability.
Open-Ended (Formative) Assessment: Homework is assigned daily, from the textbook, Chapter Resource Practice Workbook, or other sources. (Synthesis, Analysis,
Evaluation) Introductory and Closing Activities will be done every day to pre-assess student knowledge and assess understanding of
topics.(Synthesis, Analysis, Evaluation)
Summative Assessment: Assessment questions should be open-ended and should follow the general format illustrated in the Essential Questions/Sample Conceptual Understanding section. (Synthesis, Analysis, Evaluation)
Students will be given quizzes that provide a brief review of the concepts and skills in the previous lessons. Students will be given a unit test that provides a review of the concepts and skills in the unit.
Add
ition
al
Res
ourc
es Elementary Statistics fifth edition; Alan G. Bluman
Elementary Statistics: 11th edition: Mario F. Triola The Practice of Statistics Yates, Daniel S. Exploring Projects: Dale Seymour Publications Activities and Projects for High School Statistics Course; Millard, Turner
43
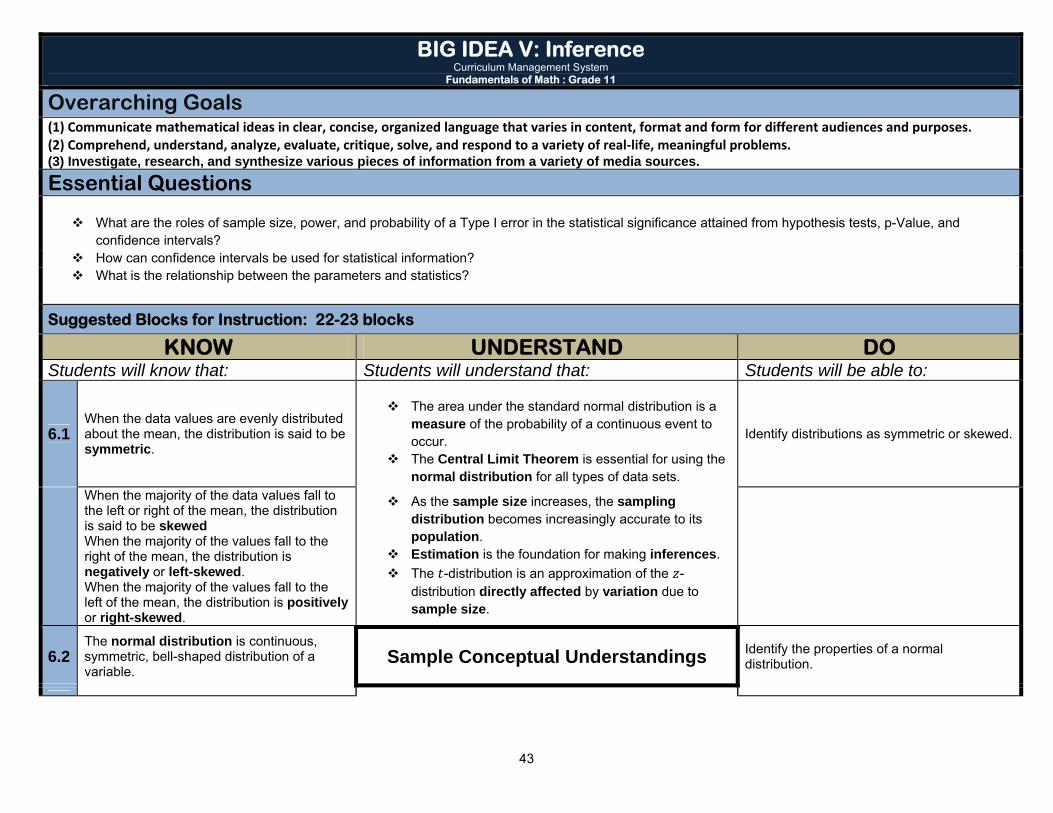
BIG IDEA V: Inference Curriculum Management System
Fundamentals of Math : Grade 11 Overarching Goals (1) Communicate mathematical ideas in clear, concise, organized language that varies in content, format and form for different audiences and purposes. (2) Comprehend, understand, analyze, evaluate, critique, solve, and respond to a variety of real‐life, meaningful problems. (3) Investigate, research, and synthesize various pieces of information from a variety of media sources. Essential Questions
What are the roles of sample size, power, and probability of a Type I error in the statistical significance attained from hypothesis tests, p-Value, and
confidence intervals? How can confidence intervals be used for statistical information? What is the relationship between the parameters and statistics?
Suggested Blocks for Instruction: 22-23 blocks
KNOW UNDERSTAND DO Students will know that: Students will understand that: Students will be able to:
6.1 When the data values are evenly distributed about the mean, the distribution is said to be symmetric.
The area under the standard normal distribution is a
measure of the probability of a continuous event to occur.
The Central Limit Theorem is essential for using the normal distribution for all types of data sets.
Identify distributions as symmetric or skewed.
When the majority of the data values fall to the left or right of the mean, the distribution is said to be skewed When the majority of the values fall to the right of the mean, the distribution is negatively or left-skewed. When the majority of the values fall to the left of the mean, the distribution is positively or right-skewed.
As the sample size increases, the sampling distribution becomes increasingly accurate to its population.
Estimation is the foundation for making inferences. The -distribution is an approximation of the -
distribution directly affected by variation due to sample size.
6.2 The normal distribution is continuous, symmetric, bell-shaped distribution of a variable.
Sample Conceptual Understandings Identify the properties of a normal distribution.
44
6.3 The standard normal distribution is a
normal distribution with a mean of 0 and a standard deviation of 1.
The time it takes for a certain pain reliever to begin to reduce symptoms is 30 minutes, with a standard deviation of 4 minutes. Assuming the variable is normally distributed, find the probability that it will take the medication:
a. Between 34 and 35 minutes to begin to work. b. More than 35 minutes to begin to work. c. Less than 35 minutes to begin to work.
The properties of the normal distribution include:
1. The curve is bell shaped. 2. The mean, median, and mode are
equal and located at the center. 3. The curve is unimodal, it has only one
mode. 4. The curve is symmetric about the
mean. 5. The curve is continuous. 6. The curve never touches the x axis. 7. The total area under the curve is equal
to 1.00 or 100%. The area which lie within 1 standard deviation is 68%, 2 standard deviations is 95% and 3 standard deviations is 99.7%.
The average thickness of books on a library shelf is 8.3 centimeters. The standard deviation is 0.6 centimeters. If 20% of the books are oversized, find the minimum thickness of the oversized books on the library shelf. Assume the variable is normally distributed.
The z-score is the number of standard deviation s that a particular value is away from the mean.
The number of calories contained in a selection of fast-food sandwiches is shown here. Check for normality.
390 405 580 300 320 540 225 720 470 560 535 660 530 290 440 390 675 530 1010 450 320 460 290 340 610 430 530
45
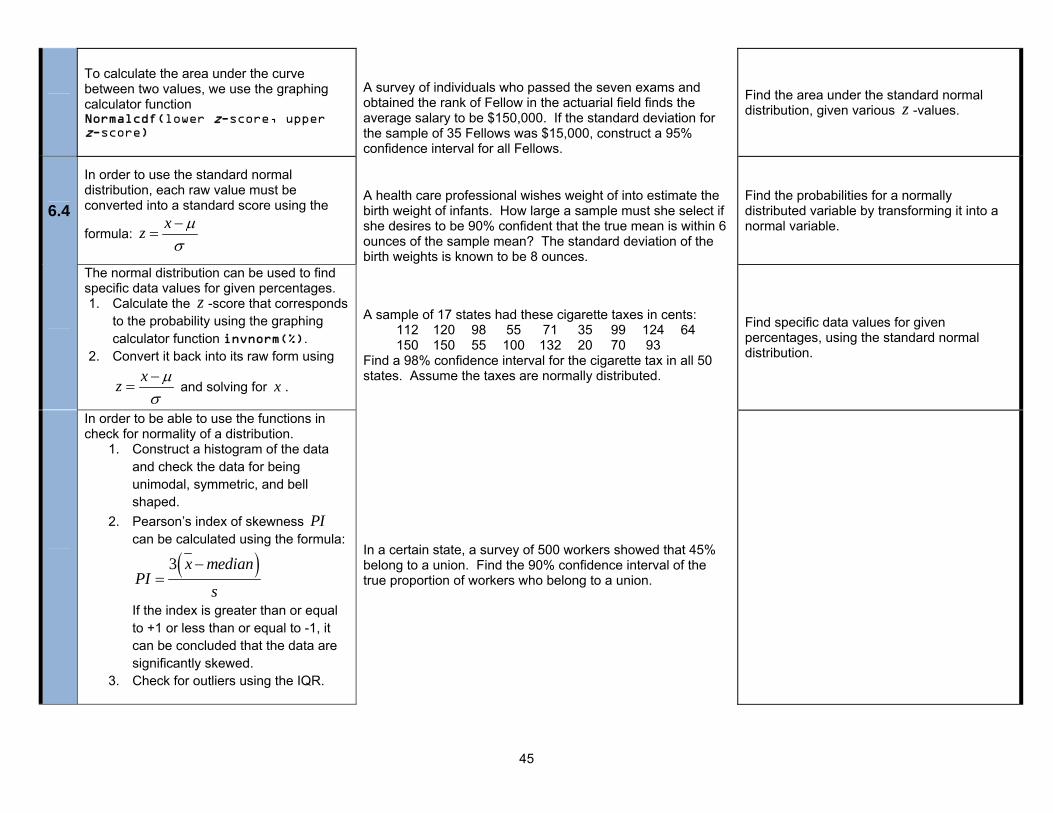
To calculate the area under the curve between two values, we use the graphing calculator function Normalcdf(lower z-score, upper z-score)
A survey of individuals who passed the seven exams and obtained the rank of Fellow in the actuarial field finds the average salary to be $150,000. If the standard deviation for the sample of 35 Fellows was $15,000, construct a 95% confidence interval for all Fellows.
Find the area under the standard normal distribution, given various z -values.
6.4
In order to use the standard normal distribution, each raw value must be converted into a standard score using the
formula: xz
A health care professional wishes weight of into estimate the birth weight of infants. How large a sample must she select if she desires to be 90% confident that the true mean is within 6 ounces of the sample mean? The standard deviation of the birth weights is known to be 8 ounces.
Find the probabilities for a normally distributed variable by transforming it into a normal variable.
The normal distribution can be used to find specific data values for given percentages. 1. Calculate the z -score that corresponds
to the probability using the graphing calculator function invnorm(%).
2. Convert it back into its raw form using xz
and solving for x .
A sample of 17 states had these cigarette taxes in cents:
112 120 98 55 71 35 99 124 64 150 150 55 100 132 20 70 93
Find a 98% confidence interval for the cigarette tax in all 50 states. Assume the taxes are normally distributed.
Find specific data values for given percentages, using the standard normal distribution.
In order to be able to use the functions in check for normality of a distribution.
1. Construct a histogram of the data and check the data for being unimodal, symmetric, and bell shaped.
2. Pearson’s index of skewness PIcan be calculated using the formula:
3 x medianPI
s
If the index is greater than or equal to +1 or less than or equal to -1, it can be concluded that the data are significantly skewed.
3. Check for outliers using the IQR.
In a certain state, a survey of 500 workers showed that 45% belong to a union. Find the 90% confidence interval of the true proportion of workers who belong to a union.
46
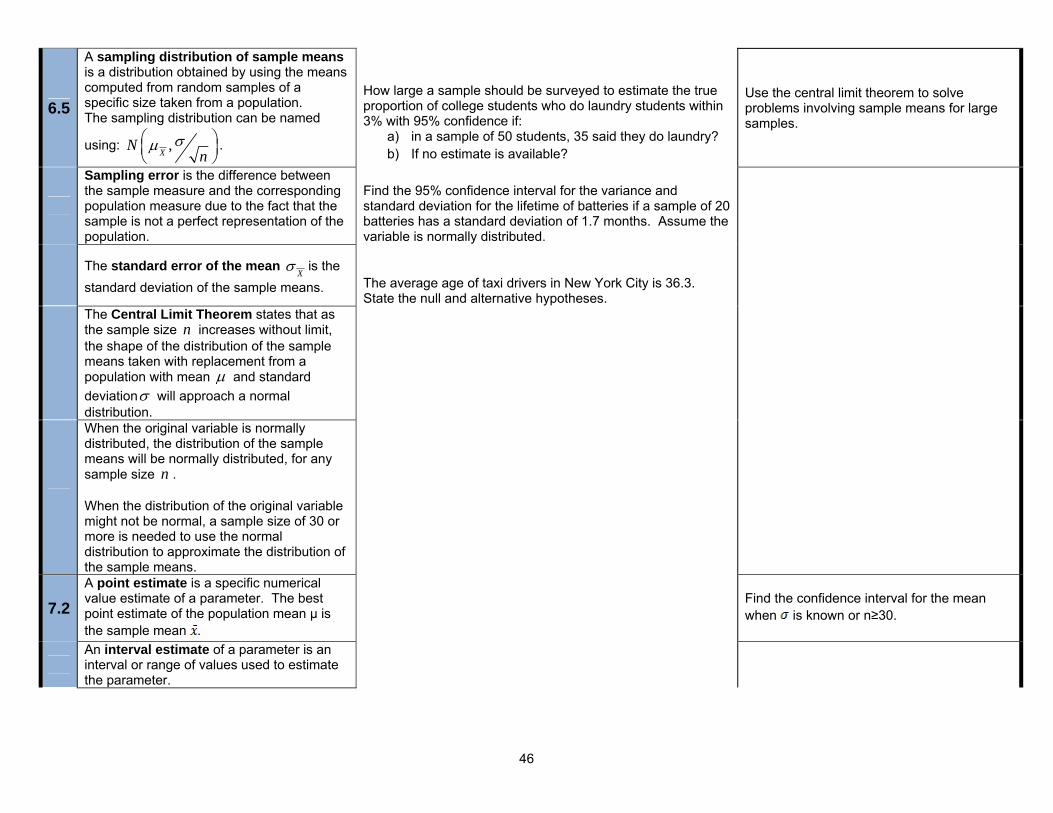
6.5
A sampling distribution of sample means is a distribution obtained by using the means computed from random samples of a specific size taken from a population. The sampling distribution can be named
using: ,XNn
.
How large a sample should be surveyed to estimate the true proportion of college students who do laundry students within 3% with 95% confidence if:
a) in a sample of 50 students, 35 said they do laundry? b) If no estimate is available?
Use the central limit theorem to solve problems involving sample means for large samples.
Sampling error is the difference between the sample measure and the corresponding population measure due to the fact that the sample is not a perfect representation of the population.
Find the 95% confidence interval for the variance and standard deviation for the lifetime of batteries if a sample of 20 batteries has a standard deviation of 1.7 months. Assume the variable is normally distributed.
The standard error of the mean X is the
standard deviation of the sample means.
The average age of taxi drivers in New York City is 36.3. State the null and alternative hypotheses.
The Central Limit Theorem states that as the sample size n increases without limit, the shape of the distribution of the sample means taken with replacement from a population with mean and standard deviation will approach a normal distribution.
When the original variable is normally distributed, the distribution of the sample means will be normally distributed, for any sample size n . When the distribution of the original variable might not be normal, a sample size of 30 or more is needed to use the normal distribution to approximate the distribution of the sample means.
7.2 A point estimate is a specific numerical value estimate of a parameter. The best point estimate of the population mean µ is the sample mean .
Find the confidence interval for the mean when is known or n≥30.
An interval estimate of a parameter is an interval or range of values used to estimate the parameter.
47
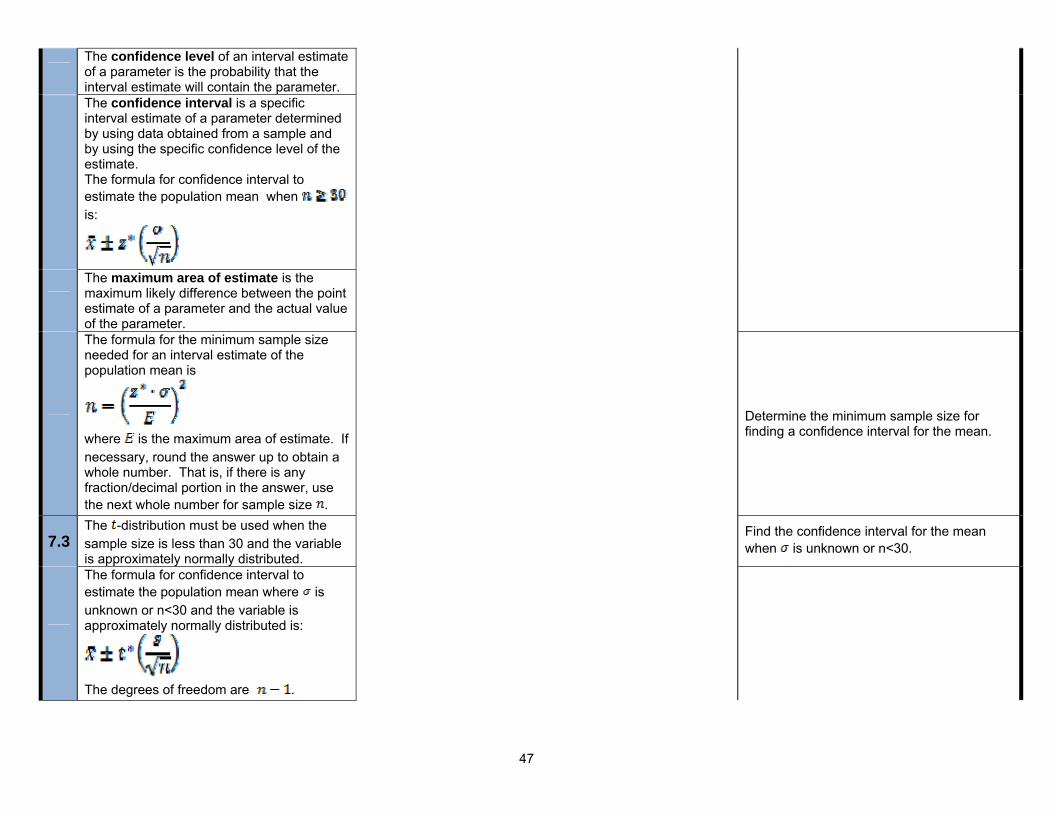
The confidence level of an interval estimate of a parameter is the probability that the interval estimate will contain the parameter.
The confidence interval is a specific interval estimate of a parameter determined by using data obtained from a sample and by using the specific confidence level of the estimate. The formula for confidence interval to estimate the population mean when is:
The maximum area of estimate is the maximum likely difference between the point estimate of a parameter and the actual value of the parameter.
The formula for the minimum sample size needed for an interval estimate of the population mean is
where is the maximum area of estimate. If necessary, round the answer up to obtain a whole number. That is, if there is any fraction/decimal portion in the answer, use the next whole number for sample size .
Determine the minimum sample size for finding a confidence interval for the mean.
7.3 The -distribution must be used when the sample size is less than 30 and the variable is approximately normally distributed.
Find the confidence interval for the mean when is unknown or n<30.
The formula for confidence interval to estimate the population mean where is unknown or n<30 and the variable is approximately normally distributed is:
The degrees of freedom are .
48
7.4
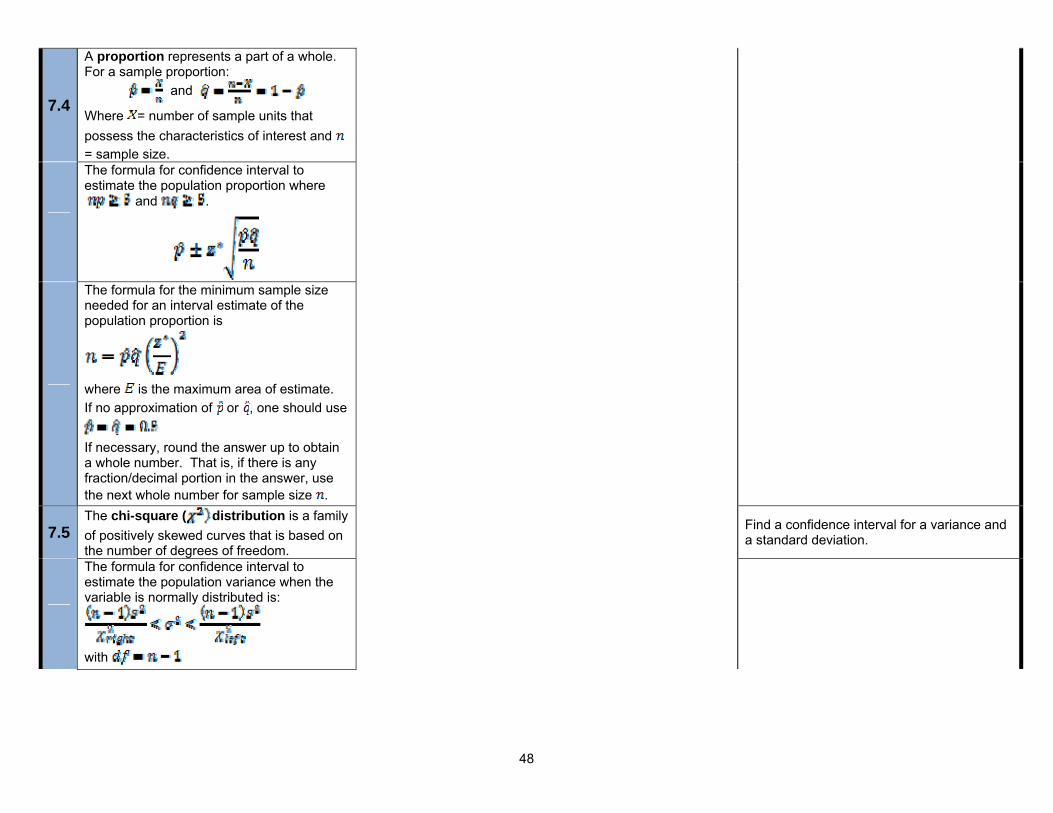
A proportion represents a part of a whole. For a sample proportion:
and
Where = number of sample units that possess the characteristics of interest and = sample size.
The formula for confidence interval to estimate the population proportion where
and .
The formula for the minimum sample size needed for an interval estimate of the population proportion is
where is the maximum area of estimate. If no approximation of or , one should use
If necessary, round the answer up to obtain a whole number. That is, if there is any fraction/decimal portion in the answer, use the next whole number for sample size .
7.5 The chi-square ( distribution is a family of positively skewed curves that is based on the number of degrees of freedom.
Find a confidence interval for a variance and a standard deviation.
The formula for confidence interval to estimate the population variance when the variable is normally distributed is:
with
49
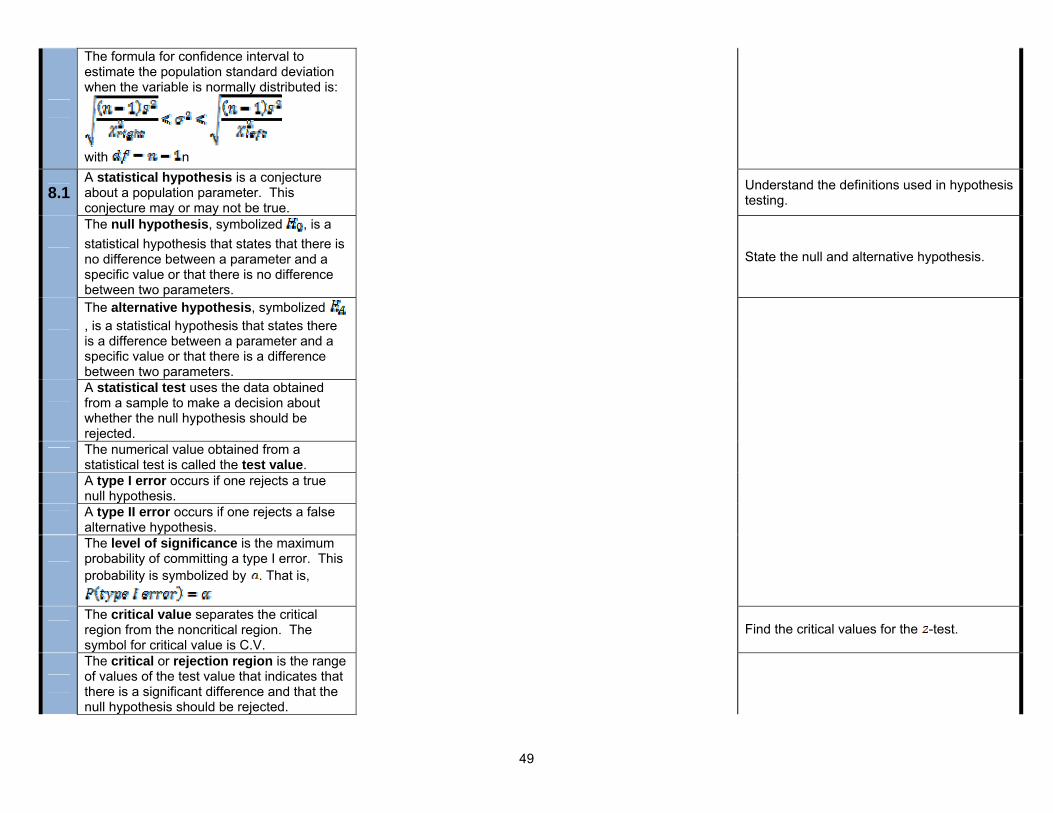
The formula for confidence interval to estimate the population standard deviation when the variable is normally distributed is:
with n
8.1 A statistical hypothesis is a conjecture about a population parameter. This conjecture may or may not be true.
Understand the definitions used in hypothesis testing.
The null hypothesis, symbolized , is a statistical hypothesis that states that there is no difference between a parameter and a specific value or that there is no difference between two parameters.
State the null and alternative hypothesis.
The alternative hypothesis, symbolized , is a statistical hypothesis that states there is a difference between a parameter and a specific value or that there is a difference between two parameters.
A statistical test uses the data obtained from a sample to make a decision about whether the null hypothesis should be rejected.
The numerical value obtained from a statistical test is called the test value.
A type I error occurs if one rejects a true null hypothesis.
A type II error occurs if one rejects a false alternative hypothesis.
The level of significance is the maximum probability of committing a type I error. This probability is symbolized by . That is,
The critical value separates the critical region from the noncritical region. The symbol for critical value is C.V.
Find the critical values for the -test.
The critical or rejection region is the range of values of the test value that indicates that there is a significant difference and that the null hypothesis should be rejected.
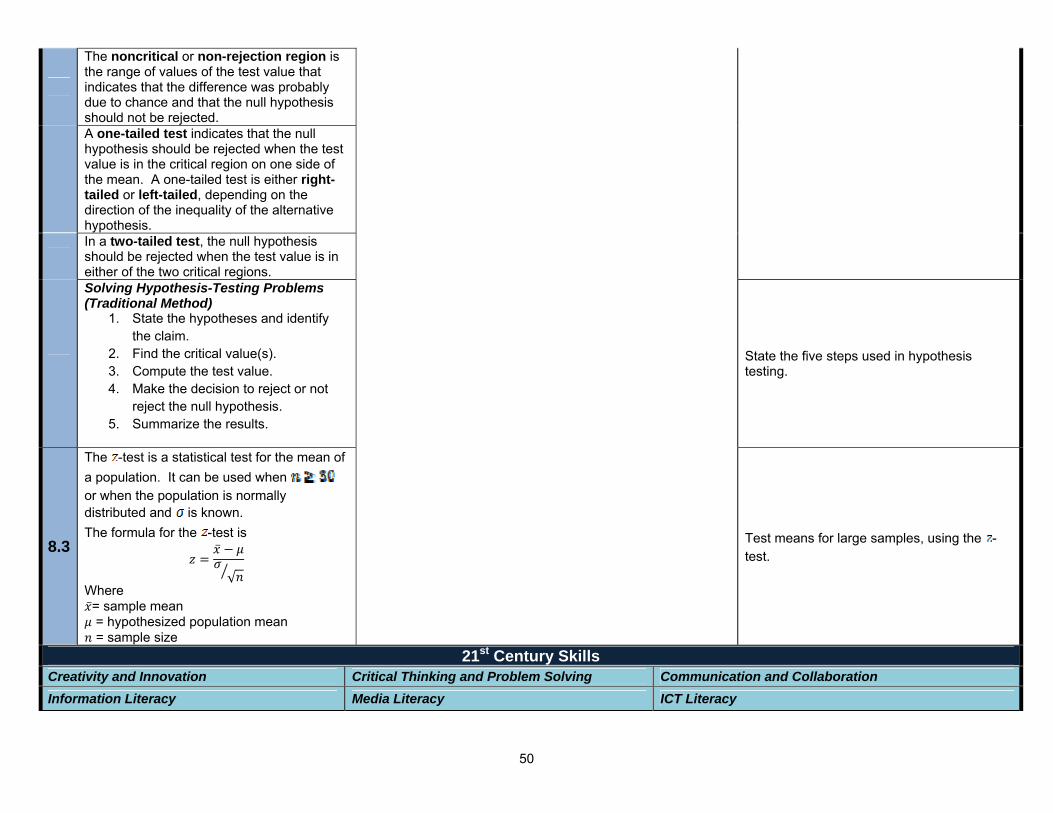
50
The noncritical or non-rejection region is the range of values of the test value that indicates that the difference was probably due to chance and that the null hypothesis should not be rejected.
A one-tailed test indicates that the null hypothesis should be rejected when the test value is in the critical region on one side of the mean. A one-tailed test is either right-tailed or left-tailed, depending on the direction of the inequality of the alternative hypothesis.
In a two-tailed test, the null hypothesis should be rejected when the test value is in either of the two critical regions.
Solving Hypothesis-Testing Problems (Traditional Method)
1. State the hypotheses and identify the claim.
2. Find the critical value(s). 3. Compute the test value. 4. Make the decision to reject or not
reject the null hypothesis. 5. Summarize the results.
State the five steps used in hypothesis testing.
8.3
√
The -test is a statistical test for the mean of a population. It can be used when or when the population is normally distributed and is known. The formula for the -test is
Where = sample mean = hypothesized population mean = sample size
Test means for large samples, using the -test.
21st Century Skills Creativity and Innovation Critical Thinking and Problem Solving Communication and Collaboration
Information Literacy Media Literacy ICT Literacy
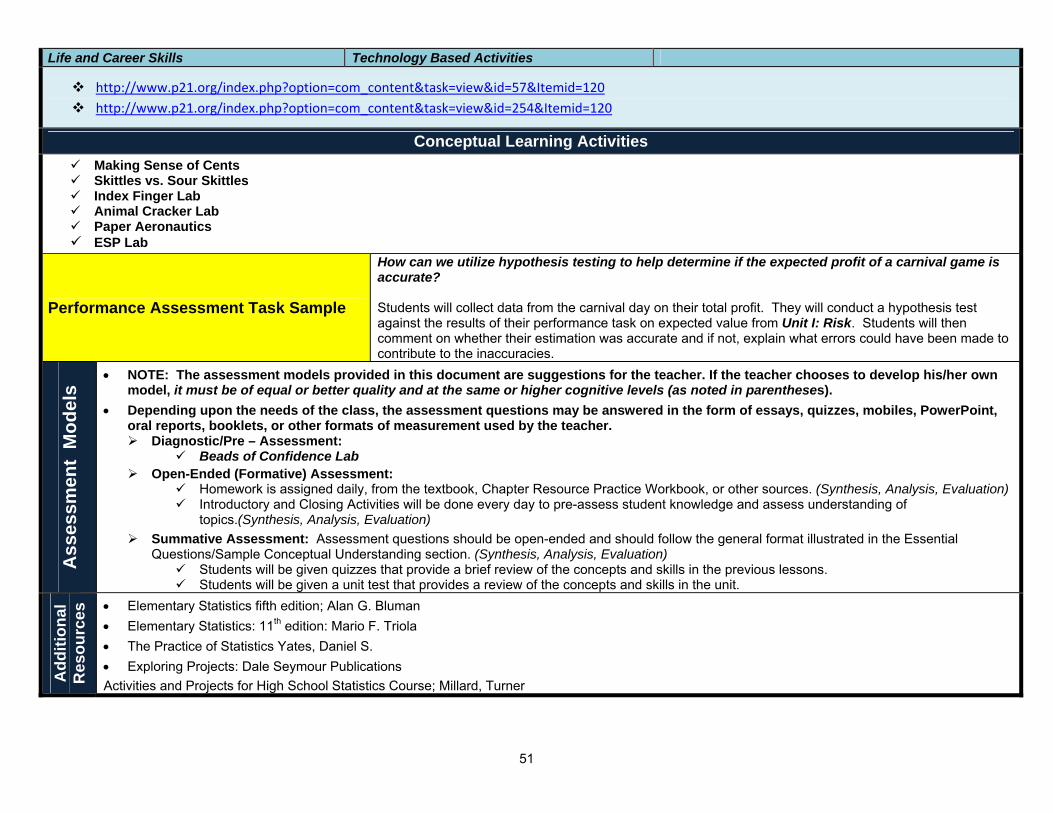
51
Life and Career Skills Technology Based Activities
http://www.p21.org/index.php?option=com_content&task=view&id=57&Itemid=120 http://www.p21.org/index.php?option=com_content&task=view&id=254&Itemid=120
Conceptual Learning Activities
Making Sense of Cents Skittles vs. Sour Skittles Index Finger Lab Animal Cracker Lab Paper Aeronautics ESP Lab
Performance Assessment Task Sample
How can we utilize hypothesis testing to help determine if the expected profit of a carnival game is accurate? Students will collect data from the carnival day on their total profit. They will conduct a hypothesis test against the results of their performance task on expected value from Unit I: Risk. Students will then comment on whether their estimation was accurate and if not, explain what errors could have been made to contribute to the inaccuracies.
Ass
essm
ent
Mod
els
NOTE: The assessment models provided in this document are suggestions for the teacher. If the teacher chooses to develop his/her own model, it must be of equal or better quality and at the same or higher cognitive levels (as noted in parentheses).
Depending upon the needs of the class, the assessment questions may be answered in the form of essays, quizzes, mobiles, PowerPoint, oral reports, booklets, or other formats of measurement used by the teacher. Diagnostic/Pre – Assessment:
Beads of Confidence Lab Open-Ended (Formative) Assessment:
Homework is assigned daily, from the textbook, Chapter Resource Practice Workbook, or other sources. (Synthesis, Analysis, Evaluation) Introductory and Closing Activities will be done every day to pre-assess student knowledge and assess understanding of
topics.(Synthesis, Analysis, Evaluation) Summative Assessment: Assessment questions should be open-ended and should follow the general format illustrated in the Essential
Questions/Sample Conceptual Understanding section. (Synthesis, Analysis, Evaluation) Students will be given quizzes that provide a brief review of the concepts and skills in the previous lessons. Students will be given a unit test that provides a review of the concepts and skills in the unit.
Add
ition
al
Res
ourc
es Elementary Statistics fifth edition; Alan G. Bluman
Elementary Statistics: 11th edition: Mario F. Triola The Practice of Statistics Yates, Daniel S. Exploring Projects: Dale Seymour Publications Activities and Projects for High School Statistics Course; Millard, Turner
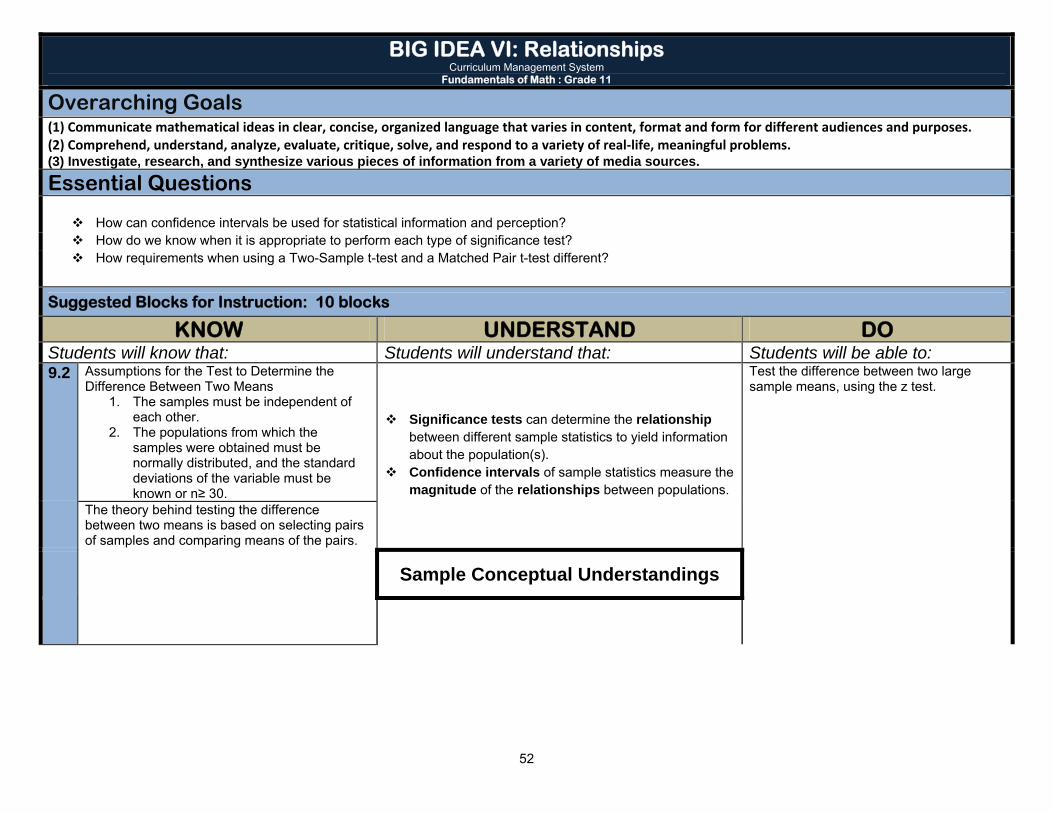
52
BIG IDEA VI: Relationships Curriculum Management System
Fundamentals of Math : Grade 11 Overarching Goals (1) Communicate mathematical ideas in clear, concise, organized language that varies in content, format and form for different audiences and purposes. (2) Comprehend, understand, analyze, evaluate, critique, solve, and respond to a variety of real‐life, meaningful problems. (3) Investigate, research, and synthesize various pieces of information from a variety of media sources. Essential Questions
How can confidence intervals be used for statistical information and perception? How do we know when it is appropriate to perform each type of significance test? How requirements when using a Two-Sample t-test and a Matched Pair t-test different?
Suggested Blocks for Instruction: 10 blocks
KNOW UNDERSTAND DO Students will know that: Students will understand that: Students will be able to: 9.2 Assumptions for the Test to Determine the
Difference Between Two Means 1. The samples must be independent of
each other. 2. The populations from which the
samples were obtained must be normally distributed, and the standard deviations of the variable must be known or n≥ 30.
Significance tests can determine the relationship between different sample statistics to yield information about the population(s).
Confidence intervals of sample statistics measure the magnitude of the relationships between populations.
Test the difference between two large sample means, using the z test.
The theory behind testing the difference between two means is based on selecting pairs of samples and comparing means of the pairs.
Sample Conceptual Understandings
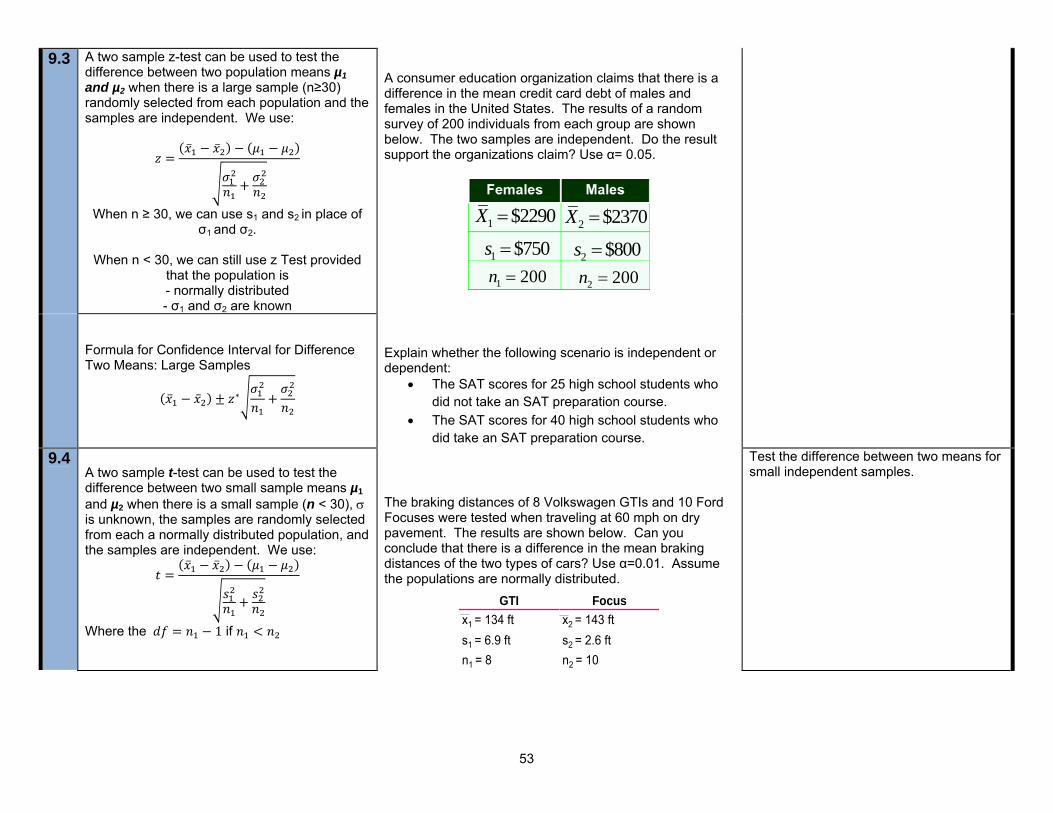
53
9.3
A two sample z-test can be used to test the difference between two population means µ1 and µ2 when there is a large sample (n≥30) randomly selected from each population and the samples are independent. We use:
When n ≥ 30, we can use s1 and s2 in place of σ1
and σ2.
When n < 30, we can still use z Test provided that the population is - normally distributed - σ1 and σ2 are known
A consumer education organization claims that there is a difference in the mean credit card debt of males and females in the United States. The results of a random survey of 200 individuals from each group are shown below. The two samples are independent. Do the result support the organizations claim? Use α= 0.05.
∗
Formula for Confidence Interval for Difference Two Means: Large Samples
Explain whether the following scenario is independent or dependent:
The SAT scores for 25 high school students who did not take an SAT preparation course.
The SAT scores for 40 high school students who did take an SAT preparation course.
9.4
A two sample t-test can be used to test the difference between two small sample means µ1 and µ2 when there is a small sample (n < 30), is unknown, the samples are randomly selected from each a normally distributed population, and the samples are independent. We use:
Where the 1 if
The braking distances of 8 Volkswagen GTIs and 10 Ford Focuses were tested when traveling at 60 mph on dry pavement. The results are shown below. Can you conclude that there is a difference in the mean braking distances of the two types of cars? Use α=0.01. Assume the populations are normally distributed.
Test the difference between two means for small independent samples.
x2 = 143 ftx1 = 134 ft
n2 = 10n1 = 8s2 = 2.6 fts1 = 6.9 ft
FocusGTIx2 = 143 ftx1 = 134 ft
n2 = 10n1 = 8s2 = 2.6 fts1 = 6.9 ft
FocusGTI
1 $2290X 2 $2370X
1 $750s 2 $800s
1 200n 2 200n
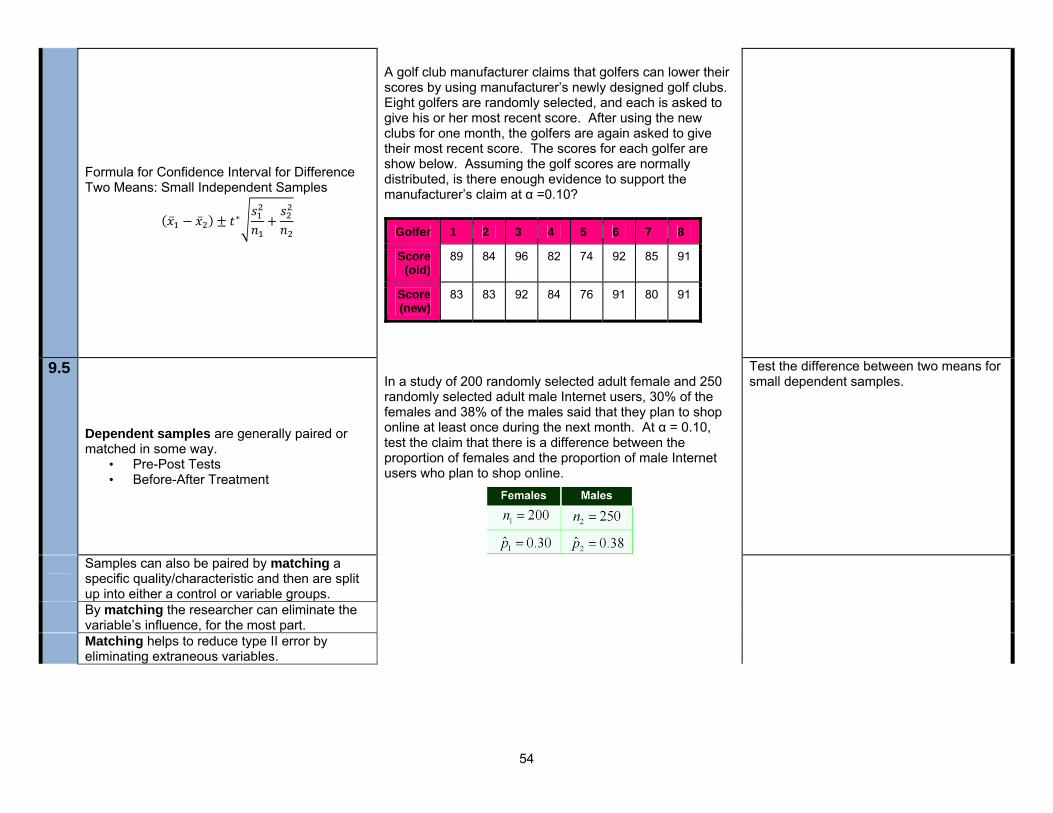
54
∗
Formula for Confidence Interval for Difference Two Means: Small Independent Samples
A golf club manufacturer claims that golfers can lower their scores by using manufacturer’s newly designed golf clubs. Eight golfers are randomly selected, and each is asked to give his or her most recent score. After using the new clubs for one month, the golfers are again asked to give their most recent score. The scores for each golfer are show below. Assuming the golf scores are normally distributed, is there enough evidence to support the manufacturer’s claim at α =0.10?
Golfer 1 2 3 4 5 6 7 8
Score (old)
89 84 96 82 74 92 85 91
Score (new)
83 83 92 84 76 91 80 91
9.5
Dependent samples are generally paired or matched in some way.
• Pre-Post Tests • Before-After Treatment
In a study of 200 randomly selected adult female and 250 randomly selected adult male Internet users, 30% of the females and 38% of the males said that they plan to shop online at least once during the next month. At α = 0.10, test the claim that there is a difference between the proportion of females and the proportion of male Internet users who plan to shop online.
Test the difference between two means for small dependent samples.
Samples can also be paired by matching a specific quality/characteristic and then are split up into either a control or variable groups.
By matching the researcher can eliminate the variable’s influence, for the most part.
Matching helps to reduce type II error by eliminating extraneous variables.
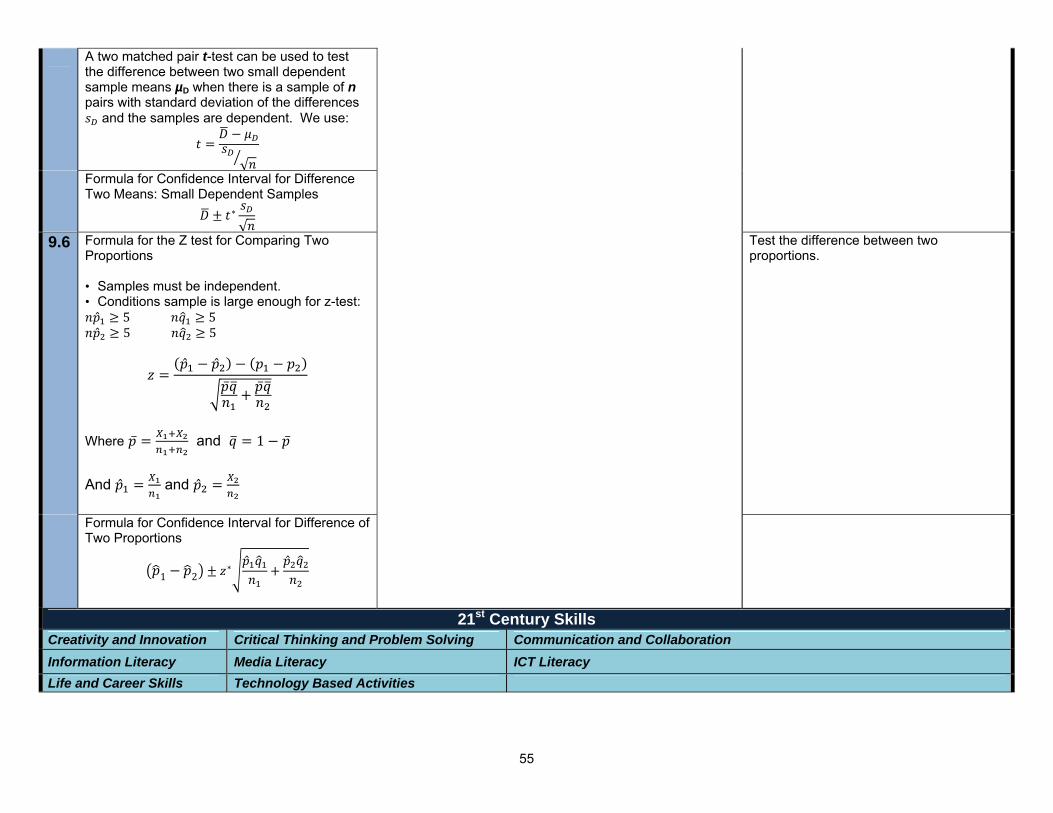
55
√
A two matched pair t-test can be used to test the difference between two small dependent sample means µD when there is a sample of n pairs with standard deviation of the differences
and the samples are dependent. We use:
∗
√
Formula for Confidence Interval for Difference Two Means: Small Dependent Samples
9.6
Formula for the Z test for Comparing Two Proportions • Samples must be independent. • Conditions sample is large enough for z-test: 5 5 5 5
Where and 1 And and
Test the difference between two proportions.
1 2∗
Formula for Confidence Interval for Difference of Two Proportions
21st Century Skills Creativity and Innovation Critical Thinking and Problem Solving Communication and Collaboration
Information Literacy Media Literacy ICT Literacy Life and Career Skills Technology Based Activities
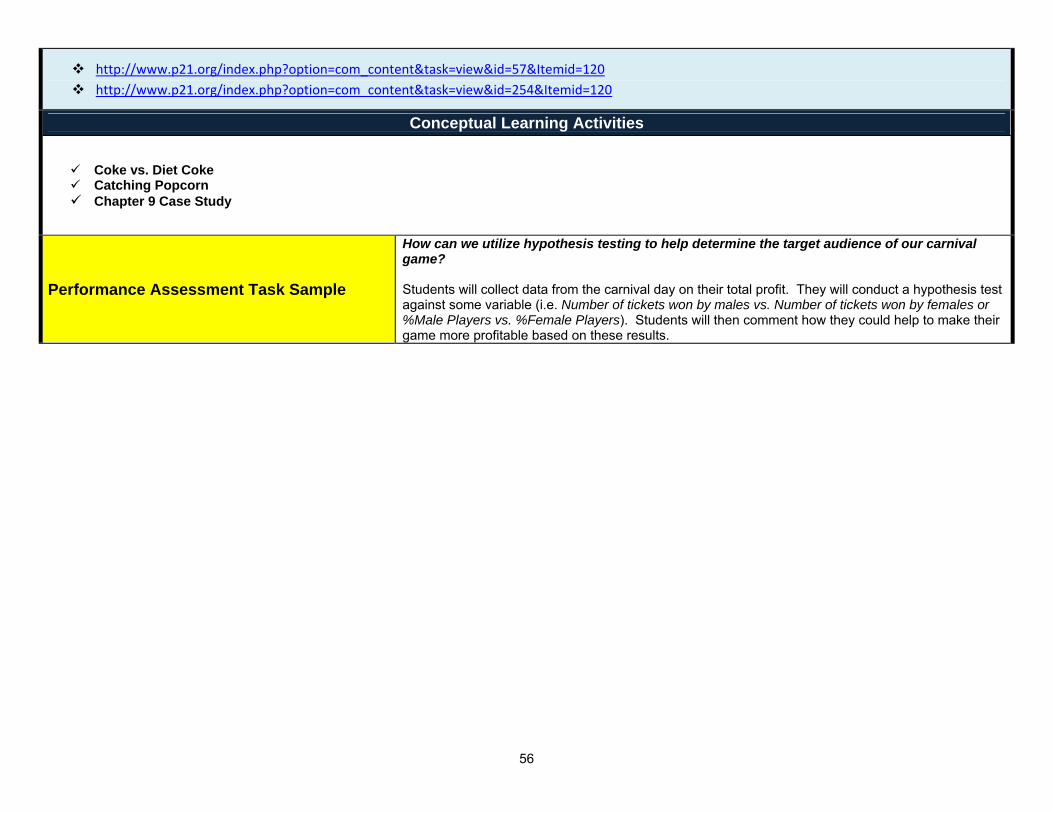
56
http://www.p21.org/index.php?option=com_content&task=view&id=57&Itemid=120 http://www.p21.org/index.php?option=com_content&task=view&id=254&Itemid=120
Conceptual Learning Activities
Coke vs. Diet Coke Catching Popcorn Chapter 9 Case Study
Performance Assessment Task Sample
How can we utilize hypothesis testing to help determine the target audience of our carnival game? Students will collect data from the carnival day on their total profit. They will conduct a hypothesis test against some variable (i.e. Number of tickets won by males vs. Number of tickets won by females or %Male Players vs. %Female Players). Students will then comment how they could help to make their game more profitable based on these results.
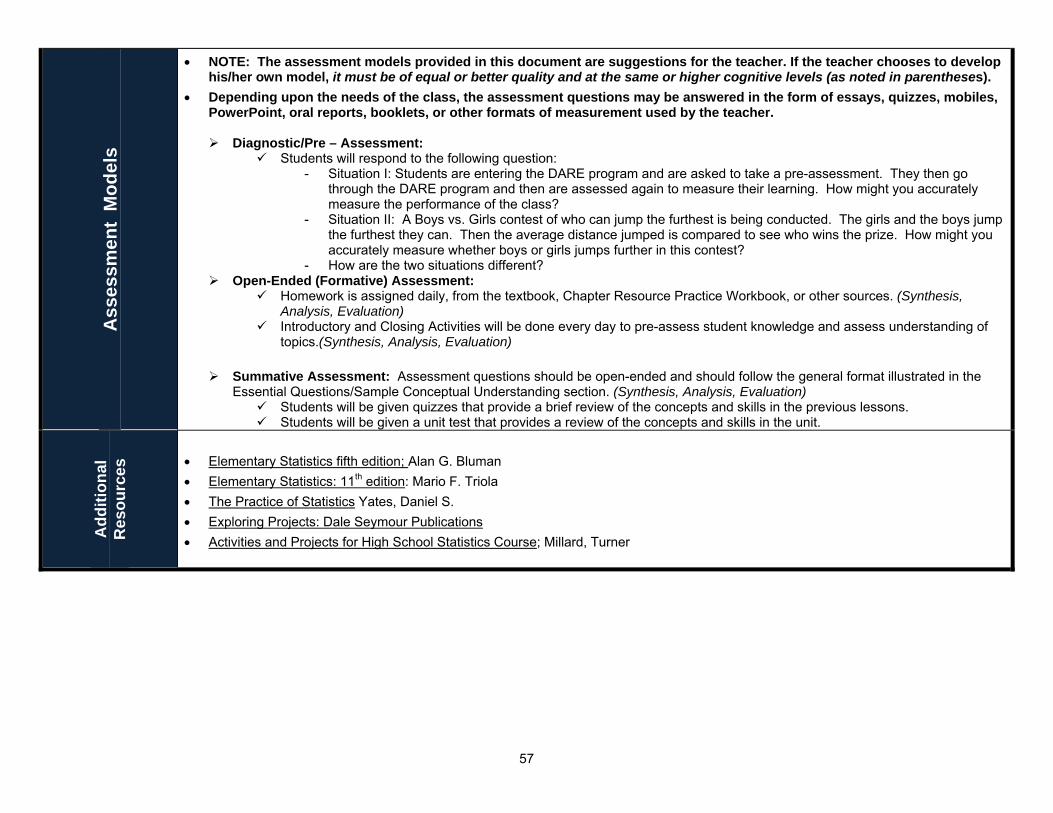
57
Ass
essm
ent
Mod
els
NOTE: The assessment models provided in this document are suggestions for the teacher. If the teacher chooses to develop his/her own model, it must be of equal or better quality and at the same or higher cognitive levels (as noted in parentheses).
Depending upon the needs of the class, the assessment questions may be answered in the form of essays, quizzes, mobiles, PowerPoint, oral reports, booklets, or other formats of measurement used by the teacher.
Diagnostic/Pre – Assessment:
Students will respond to the following question: - Situation I: Students are entering the DARE program and are asked to take a pre-assessment. They then go
through the DARE program and then are assessed again to measure their learning. How might you accurately measure the performance of the class?
- Situation II: A Boys vs. Girls contest of who can jump the furthest is being conducted. The girls and the boys jump the furthest they can. Then the average distance jumped is compared to see who wins the prize. How might you accurately measure whether boys or girls jumps further in this contest?
- How are the two situations different? Open-Ended (Formative) Assessment:
Homework is assigned daily, from the textbook, Chapter Resource Practice Workbook, or other sources. (Synthesis, Analysis, Evaluation)
Introductory and Closing Activities will be done every day to pre-assess student knowledge and assess understanding of topics.(Synthesis, Analysis, Evaluation)
Summative Assessment: Assessment questions should be open-ended and should follow the general format illustrated in the Essential Questions/Sample Conceptual Understanding section. (Synthesis, Analysis, Evaluation)
Students will be given quizzes that provide a brief review of the concepts and skills in the previous lessons. Students will be given a unit test that provides a review of the concepts and skills in the unit.
Add
ition
al
Res
ourc
es Elementary Statistics fifth edition; Alan G. Bluman
Elementary Statistics: 11th edition: Mario F. Triola The Practice of Statistics Yates, Daniel S. Exploring Projects: Dale Seymour Publications Activities and Projects for High School Statistics Course; Millard, Turner
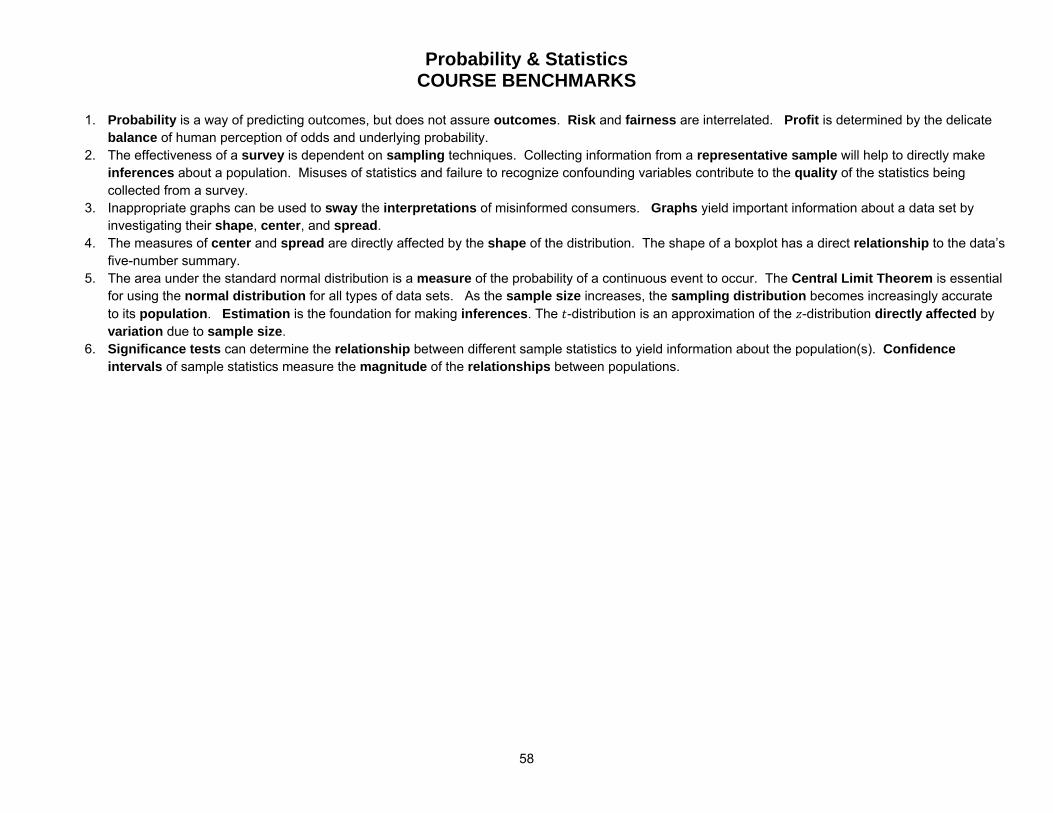
58
Probability & Statistics COURSE BENCHMARKS
1. Probability is a way of predicting outcomes, but does not assure outcomes. Risk and fairness are interrelated. Profit is determined by the delicate
balance of human perception of odds and underlying probability. 2. The effectiveness of a survey is dependent on sampling techniques. Collecting information from a representative sample will help to directly make
inferences about a population. Misuses of statistics and failure to recognize confounding variables contribute to the quality of the statistics being collected from a survey.
3. Inappropriate graphs can be used to sway the interpretations of misinformed consumers. Graphs yield important information about a data set by investigating their shape, center, and spread.
4. The measures of center and spread are directly affected by the shape of the distribution. The shape of a boxplot has a direct relationship to the data’s five-number summary.
5. The area under the standard normal distribution is a measure of the probability of a continuous event to occur. The Central Limit Theorem is essential for using the normal distribution for all types of data sets. As the sample size increases, the sampling distribution becomes increasingly accurate to its population. Estimation is the foundation for making inferences. The -distribution is an approximation of the -distribution directly affected by variation due to sample size.
6. Significance tests can determine the relationship between different sample statistics to yield information about the population(s). Confidence intervals of sample statistics measure the magnitude of the relationships between populations.