Embed Size (px)
Citation preview
Optimum Selection of Circuit BreakerParameters based on Analytical Calculation ofOvercurrent and Overvoltage in Multi-terminal
HVDC GridsYing Song, Student Member, IEEE, Jingfan Sun, Student Member, IEEE, Maryam Saeedifard, Senior
Member, IEEE, Shengchang Ji, Member, IEEE, Lingyu Zhu, Member, IEEE, A. P. Meliopoulos, Fellow, IEEE
Abstract—This paper proposes a time-domain method tocalculate the fault response in Multi-Terminal DC (MTDC)grids and the performance of hybrid DC breaker. The pro-posed method, based on travelling waves, (i) provides asound representation of fault performance by consideringall created travelling waves, (ii) introduces a new approachto estimate the reflection coefficients, and (iii) provides anapproximation of the worst-case fault location. Then, basedon the analytical results, three parameters of the hybridDC circuit breaker, i.e., current limiting reactor, arresterrated voltage, and time delay are optimally selected withrespect to maximum overcurrent, maximum overvoltage,fault clearance time, and energy absorption in arrestersthrough multi-objective optimization. Accuracy and perfor-mance of the proposed method are evaluated and verifiedby time-domain simulation studies in the PSCAD/EMTDCenvironment using frequency-dependent models. The re-sults confirm reasonable accuracy of the proposed faultperformance calculation and represent a further step to-wards optimized design of hybrid DC circuit breakers.
Index Terms—Multi-terminal HVDC systems, DC-sidefault, Travelling wave, Hybrid DC circuit breaker
I. INTRODUCTION
THE point-to-point High Voltage DC (HVDC) transmis-sion is a mature technology with many installations
around the world [1], [2], [3]. Over the past few years, theevolution of power electric converter technology has enabledthe HVDC technology to further enhance reliability and func-tionality and reduce cost and power losses. Concomitantly,significant changes in generation, transmission, and loads suchas integration and tapping renewable energy generation inremote areas, increasing transmission capacity, urbanizationand the need to feed the large cities have emerged [2]. Thesenew trends create the need for Multi-Terminal DC (MTDC)systems, which when embedded in the AC grid, can enhance
This work was funded in part by China Scholarship Council and PowerSystems Engineering Research Center (PSERC) under Project S-76.
Ying Song, Shengchang Ji and Lingyu Zhu are with the Schoolof Electrical Engineering at Xi’an Jiaotong University, Xi’an, 710049,China (e-mails: [email protected]; [email protected];[email protected]).
Jingfan Sun, Maryam Saeedifard and A. P. Meliopoulos are withthe School of Electrical and Computer Engineering at Georgia In-stitute of Technology, Atlanta, GA 30332-0250 USA (e-mails: [email protected]; [email protected]; [email protected]).
stability, reliability, and efficiency of the present power grid[1].
Amid the optimism surrounding the benefits of MTDCgrids, their protection against DC-side faults remains oneof the major technical challenges. While the protection oftwo-terminal HVDC systems can be fulfilled by relying onconverter controls and AC circuit breakers (CBs), properprotection of the MTDC grids necessitates the DC CBs toselectively isolate the faulty DC line/cable without interruptingthe entire system. Among the proposed DC CBs [4], the hybridsolid-state CB [5], [6] is one of the most promising options asits current breaking time is in the order of a few millisecondswhile its conduction losses during normal operation are low[5]. However, incorporating such DC CBs into the MTDC gridadds another level of complexity as the DC short circuit currentincreases with commensurate increase in transient overvoltagestress, current limiting reactor and energy absorption capabilityof arresters. To determine the fault clearing capability andperformance of these DC breakers, there is a need for (i)an accurate method to estimate the maximum overcurrent,transient overvoltage stress and energy absorption, and (ii) anoptimal parameter selection method to size the CB componentsto achieve satisfactory performance.
In calculating the fault response, several approaches havebeen proposed. A three-stage short-circuit current calculationmethod, using the lumped π-section cable model, is reportedin [7], [8]. Although the three-stage method is helpful tounderstand the behavior of the DC system after the fault, it isnot sufficiently accurate within the first few milliseconds whenthe maximum fault current and over voltage occur. Consideringthe travelling wave phenomena, the authors in [9] derivethe time-domain solutions of the fault current contributed byDC capacitors. Based on the response of frequency-domainmodels, fault behavior in multiple MTDC configurations havebeen studied in [10]. However, only the first travelling wave istaken into account in both [9] and [10]. Subsequent reflectedand transmitted waves are important in estimating the maxi-mum transient overvoltage. To this end, detailed and accuratecalculation of subsequent traveling waves is necessary.
Once a quantitative estimation of maximum fault current,overvoltage, clearance time and energy absorption in arrestersis obtained, optimum selection of the CB components can beattained. The authors in [11], [12] investigate the operation of
Converter 2
Converter 5
Converter 4
Line56P
Line16P
Line16N
CB65P
Circuit Breaker, CBijK, iϵ{1...6}, jϵ{1...6}, Kϵ{P,N}
AC System
CB65N CB56N
CB56P
Line26P Line26N
Line56N
Line23N
Line23P
200km
300km200km
200kmLine45P
Line45N
300km
Line34P Line34N300km
Bus 6
Bus 2 Bus 4
Bus 5Converter 1 Bus 1
Converter 3
Bus 3
. . .
CCP EAPNCP
UFD
LCS
Residual
Breaker
Current
Limiting
Reactor
Main
Breakers
Arrester
Lcb
iNCP
iCCP iEAP
(a) (b)
i
j
Line25P
Line25N
200km
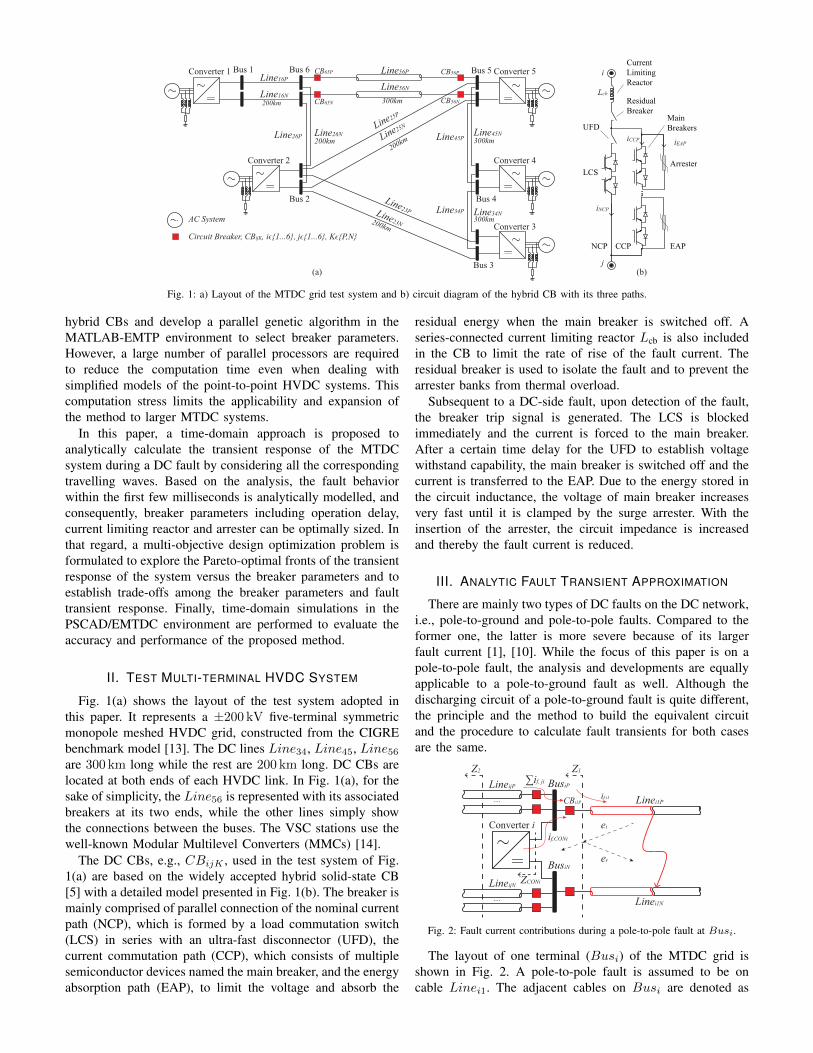
Fig. 1: a) Layout of the MTDC grid test system and b) circuit diagram of the hybrid CB with its three paths.
hybrid CBs and develop a parallel genetic algorithm in theMATLAB-EMTP environment to select breaker parameters.However, a large number of parallel processors are requiredto reduce the computation time even when dealing withsimplified models of the point-to-point HVDC systems. Thiscomputation stress limits the applicability and expansion ofthe method to larger MTDC systems.
In this paper, a time-domain approach is proposed toanalytically calculate the transient response of the MTDCsystem during a DC fault by considering all the correspondingtravelling waves. Based on the analysis, the fault behaviorwithin the first few milliseconds is analytically modelled, andconsequently, breaker parameters including operation delay,current limiting reactor and arrester can be optimally sized. Inthat regard, a multi-objective design optimization problem isformulated to explore the Pareto-optimal fronts of the transientresponse of the system versus the breaker parameters and toestablish trade-offs among the breaker parameters and faulttransient response. Finally, time-domain simulations in thePSCAD/EMTDC environment are performed to evaluate theaccuracy and performance of the proposed method.
II. TEST MULTI-TERMINAL HVDC SYSTEM
Fig. 1(a) shows the layout of the test system adopted inthis paper. It represents a ±200 kV five-terminal symmetricmonopole meshed HVDC grid, constructed from the CIGREbenchmark model [13]. The DC lines Line34, Line45, Line56are 300 km long while the rest are 200 km long. DC CBs arelocated at both ends of each HVDC link. In Fig. 1(a), for thesake of simplicity, the Line56 is represented with its associatedbreakers at its two ends, while the other lines simply showthe connections between the buses. The VSC stations use thewell-known Modular Multilevel Converters (MMCs) [14].
The DC CBs, e.g., CBijK , used in the test system of Fig.1(a) are based on the widely accepted hybrid solid-state CB[5] with a detailed model presented in Fig. 1(b). The breaker ismainly comprised of parallel connection of the nominal currentpath (NCP), which is formed by a load commutation switch(LCS) in series with an ultra-fast disconnector (UFD), thecurrent commutation path (CCP), which consists of multiplesemiconductor devices named the main breaker, and the energyabsorption path (EAP), to limit the voltage and absorb the
residual energy when the main breaker is switched off. Aseries-connected current limiting reactor Lcb is also includedin the CB to limit the rate of rise of the fault current. Theresidual breaker is used to isolate the fault and to prevent thearrester banks from thermal overload.
Subsequent to a DC-side fault, upon detection of the fault,the breaker trip signal is generated. The LCS is blockedimmediately and the current is forced to the main breaker.After a certain time delay for the UFD to establish voltagewithstand capability, the main breaker is switched off and thecurrent is transferred to the EAP. Due to the energy stored inthe circuit inductance, the voltage of main breaker increasesvery fast until it is clamped by the surge arrester. With theinsertion of the arrester, the circuit impedance is increasedand thereby the fault current is reduced.
III. ANALYTIC FAULT TRANSIENT APPROXIMATION
There are mainly two types of DC faults on the DC network,i.e., pole-to-ground and pole-to-pole faults. Compared to theformer one, the latter is more severe because of its largerfault current [1], [10]. While the focus of this paper is on apole-to-pole fault, the analysis and developments are equallyapplicable to a pole-to-ground fault as well. Although thedischarging circuit of a pole-to-ground fault is quite different,the principle and the method to build the equivalent circuitand the procedure to calculate fault transients for both casesare the same.
Converter i
CBi1P
Z1Z2
ZCONi
Linei1P
LineijP
LineijN
Linei1N
BusiP
ei
if,i1
∑if, ji
if,CONi
erBusiN
...
...
Fig. 2: Fault current contributions during a pole-to-pole fault at Busi.
The layout of one terminal (Busi) of the MTDC grid isshown in Fig. 2. A pole-to-pole fault is assumed to be oncable Linei1. The adjacent cables on Busi are denoted as
Lineij , j /∈ {1, i}. The fault current, if,1 is broken downinto two parts, i.e., if,CON and
∑j /∈{1,i} if,j , which are
contributions from converter and adjacent cables, respectively.The incident surge ei is transmitted to Busi and reflectedas er, resulting in a fast voltage drop on the terminal. Thedetailed analysis of this traveling wave phenomenon, whichhas a significant impact on fault transients, is presented asfollows.
A. Frequency-domain Expression of Traveling WavesWhen the positive and negative poles are shorted at a
certain distance from the terminal of the transmission line, thevoltage surge generated at the fault location starts travellingto both ends of the faulty line. For a uniformly distributedlossy transmission line, the relationship of voltage v(z, t) andcurrent i(z, t) at position z from the fault location is describedby telegrapher’s equations. In frequency domain, they yield thesecond-order differential equations expressed by:
d2V (z)
dz2= γ2(s)V (z), (1)
d2I(z)
dz2= γ2(s)I(z), (2)
where γ =√Z(s)Y (s) is the propagation constant of the
transmission line. Z(s) and Y (s) are line series impedanceand shunt admittance, respectively. The solution to (1) and (2)is
V (z) = V +(z) + V −(z) = V +0 e−γz + V −0 e
+γz, (3)
I(z) = I+(z) + I−(z) =V +0
Z0e−γz − V −0
Z0e+γz, (4)
where Z0(s) =√Z(s)/Y (s) is the characteristic impedance
of the transmission line. Equations (3) and (4) are generalexpressions for traveling waves. V +(z) and V −(z) representthe forward and backward waves at point z, respectively.
The fault generated traveling waves include high-frequencycomponents. A reasonable approximation of cable impedanceis Z(s) = L · s + K
√s, where K is the skin effect factor
[15]. The shunt capacitor C is constant and the inductance isassumed constant at high frequencies.
Assuming an initial voltage step V0 at the fault location onan infinite-length cable, the backward wave V − is zero whilethe incident wave can be expressed by [16]:
V +1 (z) =
V0s
exp(−zcs− Kz
2Lcs1/2), (5)
where c = 1/√LC is the propagation speed of the cable [9].
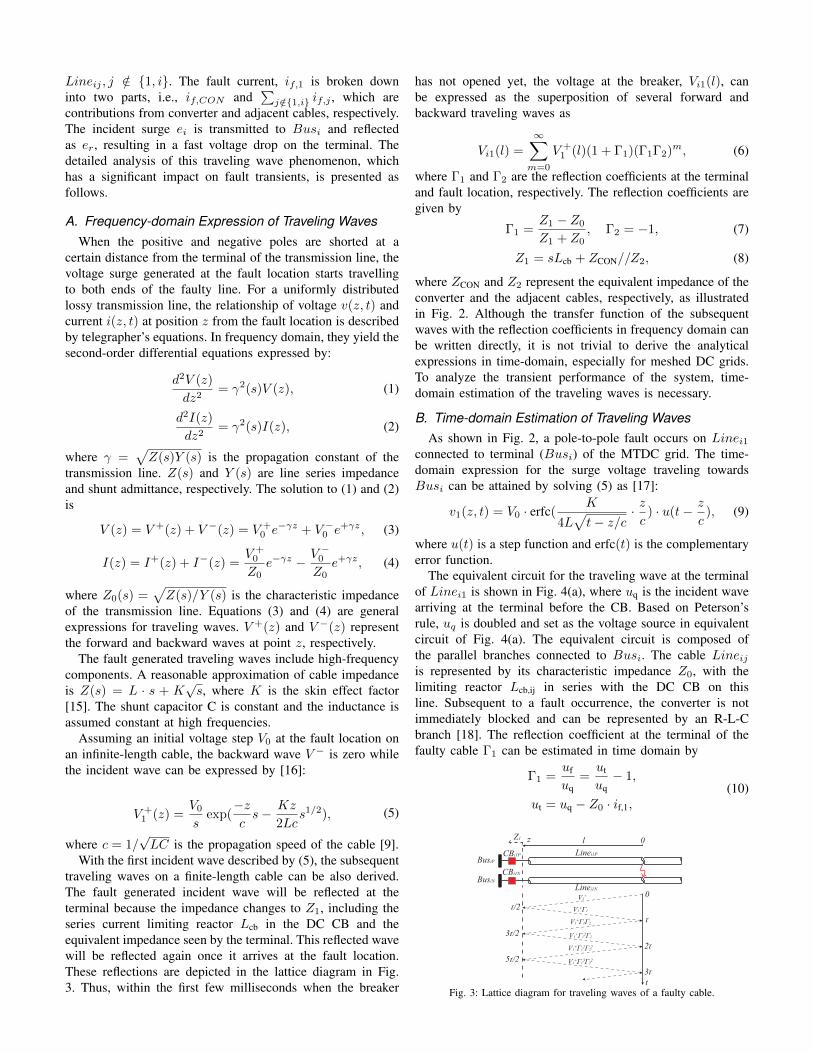
With the first incident wave described by (5), the subsequenttraveling waves on a finite-length cable can be also derived.The fault generated incident wave will be reflected at theterminal because the impedance changes to Z1, including theseries current limiting reactor Lcb in the DC CB and theequivalent impedance seen by the terminal. This reflected wavewill be reflected again once it arrives at the fault location.These reflections are depicted in the lattice diagram in Fig.3. Thus, within the first few milliseconds when the breaker
has not opened yet, the voltage at the breaker, Vi1(l), canbe expressed as the superposition of several forward andbackward traveling waves as
Vi1(l) =
∞∑m=0
V +1 (l)(1 + Γ1)(Γ1Γ2)m, (6)
where Γ1 and Γ2 are the reflection coefficients at the terminaland fault location, respectively. The reflection coefficients aregiven by
Γ1 =Z1 − Z0
Z1 + Z0, Γ2 = −1, (7)
Z1 = sLcb + ZCON//Z2, (8)
where ZCON and Z2 represent the equivalent impedance of theconverter and the adjacent cables, respectively, as illustratedin Fig. 2. Although the transfer function of the subsequentwaves with the reflection coefficients in frequency domain canbe written directly, it is not trivial to derive the analyticalexpressions in time-domain, especially for meshed DC grids.To analyze the transient performance of the system, time-domain estimation of the traveling waves is necessary.
B. Time-domain Estimation of Traveling WavesAs shown in Fig. 2, a pole-to-pole fault occurs on Linei1
connected to terminal (Busi) of the MTDC grid. The time-domain expression for the surge voltage traveling towardsBusi can be attained by solving (5) as [17]:
v1(z, t) = V0 · erfc(K
4L√t− z/c
· zc
) · u(t− z
c), (9)
where u(t) is a step function and erfc(t) is the complementaryerror function.
The equivalent circuit for the traveling wave at the terminalof Linei1 is shown in Fig. 4(a), where uq is the incident wavearriving at the terminal before the CB. Based on Peterson’srule, uq is doubled and set as the voltage source in equivalentcircuit of Fig. 4(a). The equivalent circuit is composed ofthe parallel branches connected to Busi. The cable Lineijis represented by its characteristic impedance Z0, with thelimiting reactor Lcb,ij in series with the DC CB on thisline. Subsequent to a fault occurrence, the converter is notimmediately blocked and can be represented by an R-L-Cbranch [18]. The reflection coefficient at the terminal of thefaulty cable Γ1 can be estimated in time domain by
Γ1 =uf
uq=ut
uq− 1,
ut = uq − Z0 · if,1,(10)
CBi1P
CBi1N
Z1
Linei1P
Linei1N
BusiP
z
t
0
ґ
2ґ
3ґ
ґ/2
3ґ/2
5ґ/2
0l
BusiN
V1+
V1+Г1
V1+Г1Г2
V1+Г1
2Г2
V1+Г1
2Г22
V1+Г1
3Г22
Fig. 3: Lattice diagram for traveling waves of a faulty cable.
where, uq is the first incident voltage arriving at the terminalwith the time-domain expression described in (9), uf is thereflected backward voltage and ut is the refracted voltagetransmitted into the terminal. The fault current if,1 is con-tributed by the converter capacitance and the adjacent cablesdischarge, denoted as if,CON and if,j respectively, yielding
if,1 = if,CON +∑
j /∈{1,i}
if,j = CCONduCCON
dt+
∑j /∈{1,i}
if,j . (11)
The differential equations governing the behavior of the equiv-alent circuit are expressed by
2uq = Z0if,1 + Lcb,i1dif,1dt
+ ubus,
ubus = Z0if,j + Lcb,ijdif,jdt
= LCONdif,CON
dt+RCONif,CON + uCCON ,
(12)
where ubus represents the voltage at the busbar. Therefore, thereflection coefficient can be computed based on the solutionof (12). As shown in Fig. 4(b), due to the increase of if,1, Γ1
decreases over time, which can be fitted as a linear functionof time. As the network remains the same, the approximatereflection coefficient is used for the rest of the waves. Con-sequently, the superposition of all the incident waves at theterminal of the faulty cable yields:
uq =
∞∑m=0
umq =
∞∑m=0
v1(l + 2ml, t)(Γ1Γ2)m. (13)
Upon detection of a DC fault, the converter is blocked.The blocking signal generated by DESAT protection of theconverter switches is faster than any other protective action.In this paper, 1 ms is added to the signal of fault detectionto represent the time delay in real system [19]. At the sametime, the trigger signal for DC breaker is generated and thecurrent starts to commutate to the main breaker. Then, aftera delay, the main breaker opens to clear the DC fault. Basedon the operation of DC breaker, the analysis and calculationare divided into three stages, and based on the state of theconverter, the time interval before the main breaker openscan be subdivided into three stages, of which the equivalentmodel of converter are different. Based on the time-domainestimation of the traveling waves for the pole-to-pole faultat distance l from Busi on Linei1, as shown in Fig. 2, thefollowing transient response of the system during the faultclearance can be calculated by using the equivalent circuitat each stage, of which the maximum fault current and themaximum voltage can be determined.
+
+
_...
if,1if,CON
if, j
2uq
Lcb,ij
LCONiRCONiCCONi
Z0
Lcb,i1 Z0
+
_
ubus
(a)1 1.5 2 2.5 3
(b)
0.2
0.4
0.6
0.8
1
1.2
Time (ms)
Fig. 4: a) Equivalent DC circuit under a pole-to-pole fault; and b) the reflectioncoefficient at the terminal of the faulty cable.
S1
S2
D1
D2
ipbipa ipc
ina inb inc
Larm
Larm
Larm
Larm
Larm
Larm
IDCipbipa ipc
ina inb inc
Larm
Larm
Larm
Larm
Larm
Larm
IDC
(a) (b)
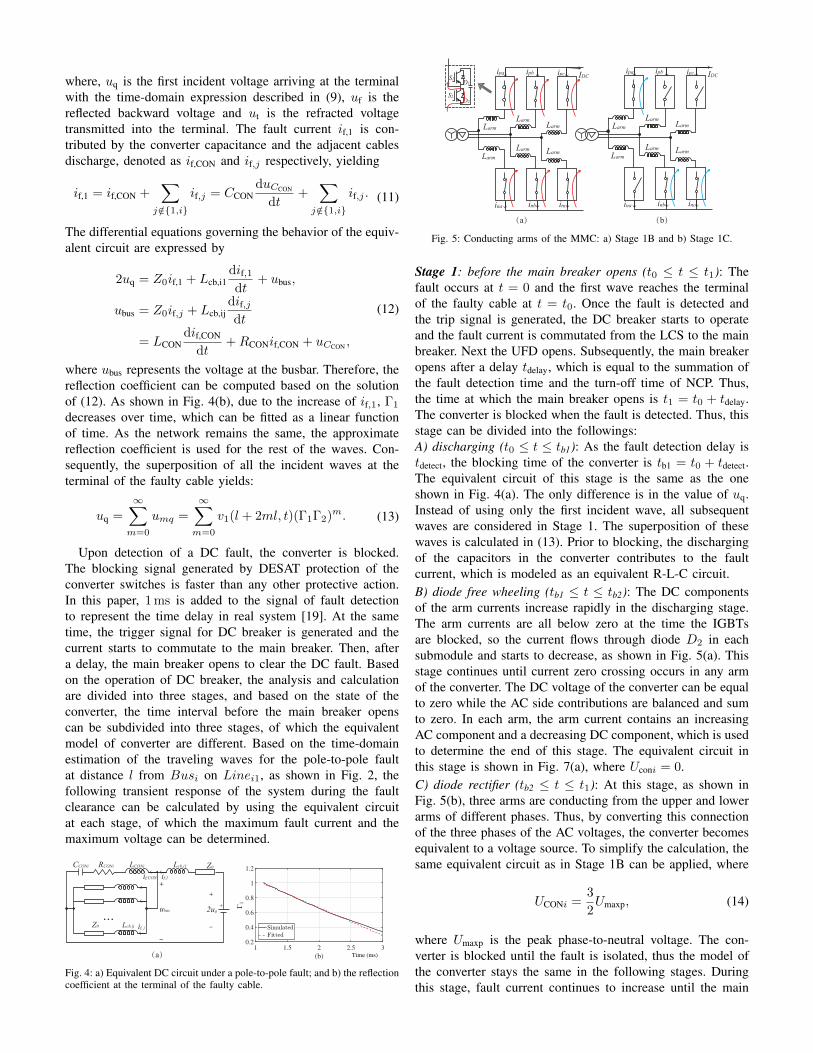
Fig. 5: Conducting arms of the MMC: a) Stage 1B and b) Stage 1C.
Stage 1: before the main breaker opens (t0 ≤ t ≤ t1): Thefault occurs at t = 0 and the first wave reaches the terminalof the faulty cable at t = t0. Once the fault is detected andthe trip signal is generated, the DC breaker starts to operateand the fault current is commutated from the LCS to the mainbreaker. Next the UFD opens. Subsequently, the main breakeropens after a delay tdelay, which is equal to the summation ofthe fault detection time and the turn-off time of NCP. Thus,the time at which the main breaker opens is t1 = t0 + tdelay.The converter is blocked when the fault is detected. Thus, thisstage can be divided into the followings:A) discharging (t0 ≤ t ≤ tb1): As the fault detection delay istdetect, the blocking time of the converter is tb1 = t0 + tdetect.The equivalent circuit of this stage is the same as the oneshown in Fig. 4(a). The only difference is in the value of uq.Instead of using only the first incident wave, all subsequentwaves are considered in Stage 1. The superposition of thesewaves is calculated in (13). Prior to blocking, the dischargingof the capacitors in the converter contributes to the faultcurrent, which is modeled as an equivalent R-L-C circuit.B) diode free wheeling (tb1 ≤ t ≤ tb2): The DC componentsof the arm currents increase rapidly in the discharging stage.The arm currents are all below zero at the time the IGBTsare blocked, so the current flows through diode D2 in eachsubmodule and starts to decrease, as shown in Fig. 5(a). Thisstage continues until current zero crossing occurs in any armof the converter. The DC voltage of the converter can be equalto zero while the AC side contributions are balanced and sumto zero. In each arm, the arm current contains an increasingAC component and a decreasing DC component, which is usedto determine the end of this stage. The equivalent circuit inthis stage is shown in Fig. 7(a), where Uconi = 0.C) diode rectifier (tb2 ≤ t ≤ t1): At this stage, as shown inFig. 5(b), three arms are conducting from the upper and lowerarms of different phases. Thus, by converting this connectionof the three phases of the AC voltages, the converter becomesequivalent to a voltage source. To simplify the calculation, thesame equivalent circuit as in Stage 1B can be applied, where
UCONi =3
2Umaxp, (14)
where Umaxp is the peak phase-to-neutral voltage. The con-verter is blocked until the fault is isolated, thus the model ofthe converter stays the same in the following stages. Duringthis stage, fault current continues to increase until the main
(a) Timetb t! t t" t#tb"
Stage 1(A) 1(B) 1(C) 2 3
(b) Timetb t! t t" t#tb"
Stage 1(A) 1(B) 1(C) 2 3
Fig. 6: The waveforms during DC breaker operation: a) current on each branchof DC CB and b) bus-side voltage of DC CB.
breaker opens at t = t1, so the maximum current Imax can beobtained based on the solution of (11) and (15).
2uq = Z0if,1 + Lcb,i1dif,1dt
+ ubus,
ubus = Z0if,j + Lcb,ijdif,jdt
= LCONdif,CON
dt+RCONif,CON + UCONi.
(15)
The fault current if,1 and bus-side voltage vca during DCbreaker operation in Stage 1 are shown in Fig. 6. As shown,the bus-side voltage of DC breaker drops below zero at t0and the fault current if,1 continues to increase until the mainbreaker opens at t = t1. The increase rate of the fault currentbecomes much lower when the converter is blocked at tb1, asshown in Fig. 6(a).Stage 2: current commutation to the arrester (t1 ≤ t ≤ t2):When the main breaker is switched off at t = t1, the transientvoltage across the main breaker rapidly increases until thearrester starts to conduct and clamps the voltage. The faultcurrent in the main breaker is forced to the arrester and finallyreaches zero at t = t2. As shown in Fig. 6, Stage 2 starts att = t1, i.e., the moment the main breaker opens. The currentif,CCP decreases to zero and if,EAP increases rapidly whenthe voltage across the arrester reaches its rated voltage. Theequivalent model of the DC breaker during Stage 2 is shown inFig. 7(b). The main breaker is equal to an equivalent capacitorCCCP and an equivalent inductance LCCP when the IGBTs areswitched off. The nonlinear V-I characteristics of the arrestercan be expressed as the fitted curve by:
if,EAP = k · uαEAP, (16)
where k and α are the constants of the arrester and the voltageuEAP is equal to the voltage across the main breaker, which is
+
+
_...
if,1if,CON
if, j
2uq
Lcb,ij
LCONiRCONi
Z0
Lcb,i1 Z0
UCONi
+
_
ubus
(a)
+
++
_
_
...
LCCPCCCP
uEAPif,EAP
if,CCP
2uq
Z0
Z0
LCONiRCONi
if,1if,CON
if, j
UCONi
+
_
ubus
(b)
Lcb,i1
Lcb,ij
Fig. 7: Equivalent DC circuits of a pole-to-pole fault: a) Stages 1B and 1C;and b) Stage 2.
charged by its current if,CCP. Hence, the equations governingthe breaker transient behavior are:
if,1 = if,CCP + if,EAP, (17a)
if,CCP = CCCPduCCCP
dt, (17b)
uEAP = LCCPdif,CCP
dt+ uCONi. (17c)
KVL for the circuit of Fig. 7(b) yields
2uq = uEAP + Z0if,1 + Lcb,i1dif,1dt
+ ubus. (18)
The elevation of voltage across the DC breaker also causesover voltage on the bus-side voltage of the breaker, of whichthe maximum voltage Vmax occurs at the time the arrester startsto clamp the voltage, as shown in Fig. 6(b). By solving (16)to (18) in this stage, Vmax can be found from the numericalsolutions of the voltage.Stage 3: fault current down to zero (t2 ≤ t ≤ t3): Afterthe main breaker completely opens at t = t2, the increaseimpedance of the arrester forces the DC fault current torapidly decrease. As shown in Fig. 6, the bus-side voltageof DC breaker is clamped and the current if,EAP decreasesuntil reaches zero at t = t3, which is the end of the breakeroperation. Thus, in Fig. 7(b), the equivalent circuit of the CCPis removed and only the arrester remains connected in theequivalent circuit during Stage 3. The currents and voltagesduring Stage 3 can be computed by the same method in Stage2. The time from t2 to t3 is called the breaking time, tbreaking,of the DC breaker. The operation time of the DC breaker,defined as tclear, is from t0 to t3. Subsequently, the energyabsorbed by the arrester, WEAP, can be computed by
WEAP =
∫ t3
t0
uEAP,iif,EAPdt. (19)
C. Estimation of the Worst-case Fault Location
Based on the aforementioned time-domain analysis, Imax,Vmax, tclear and WEAP can be obtained from the numericalsolutions for the fault at distance l from the terminal, whichare taken as the metrics for optimum selection of the DCbreaker parameters. Since the fault can happen anywhere onthe cable and the distance of the fault location has an impacton Imax, Vmax, tclear and WEAP, it is necessary to indicate thefault location for the worst case scenario with maximum Imaxand Vmax. The worst-case fault location problem has beeninvestigated in [20][21]. However, the relationships betweenfault location and fault metrics have not yet been analyzed.Additionally, the worst-case distances of the transmission linesthat are shorter than the critical distance are not calculated. The
t� ττ/2
V0
0
tdelaytdelay
tdelay
Fig. 8: Voltage at the terminal of the faulty cable with different fault location.
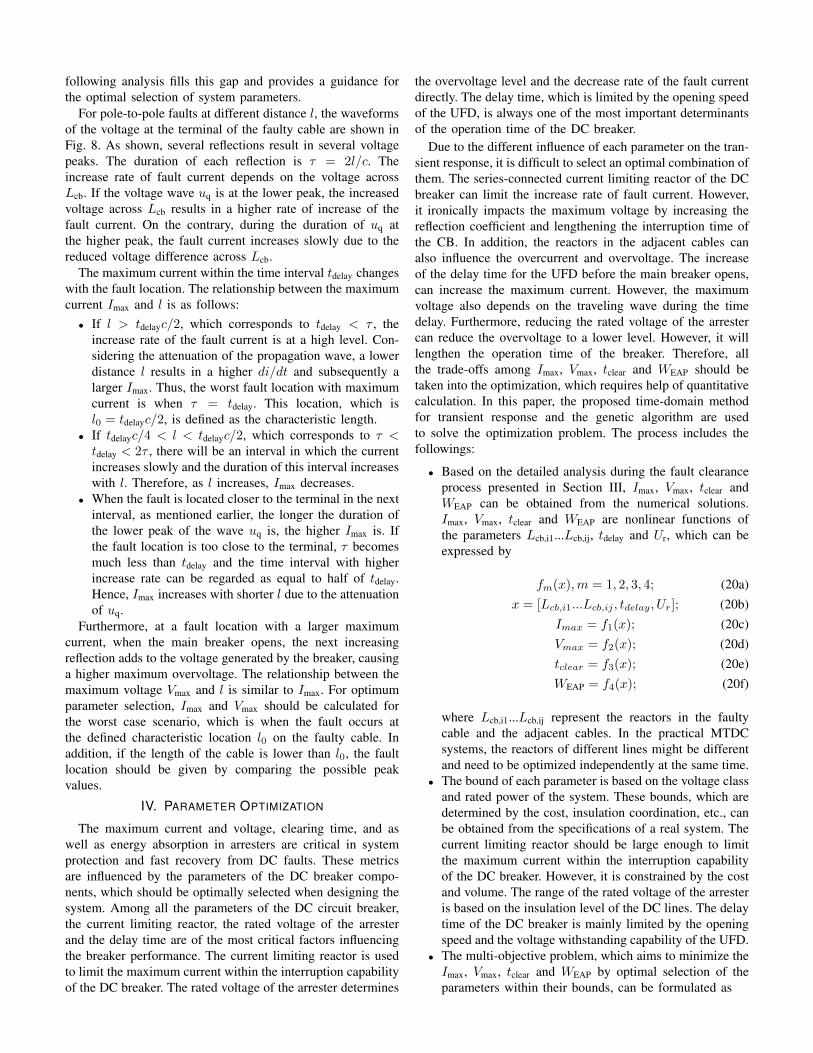
following analysis fills this gap and provides a guidance forthe optimal selection of system parameters.
For pole-to-pole faults at different distance l, the waveformsof the voltage at the terminal of the faulty cable are shown inFig. 8. As shown, several reflections result in several voltagepeaks. The duration of each reflection is τ = 2l/c. Theincrease rate of fault current depends on the voltage acrossLcb. If the voltage wave uq is at the lower peak, the increasedvoltage across Lcb results in a higher rate of increase of thefault current. On the contrary, during the duration of uq atthe higher peak, the fault current increases slowly due to thereduced voltage difference across Lcb.
The maximum current within the time interval tdelay changeswith the fault location. The relationship between the maximumcurrent Imax and l is as follows:• If l > tdelayc/2, which corresponds to tdelay < τ , the
increase rate of the fault current is at a high level. Con-sidering the attenuation of the propagation wave, a lowerdistance l results in a higher di/dt and subsequently alarger Imax. Thus, the worst fault location with maximumcurrent is when τ = tdelay. This location, which isl0 = tdelayc/2, is defined as the characteristic length.
• If tdelayc/4 < l < tdelayc/2, which corresponds to τ <tdelay < 2τ , there will be an interval in which the currentincreases slowly and the duration of this interval increaseswith l. Therefore, as l increases, Imax decreases.
• When the fault is located closer to the terminal in the nextinterval, as mentioned earlier, the longer the duration ofthe lower peak of the wave uq is, the higher Imax is. Ifthe fault location is too close to the terminal, τ becomesmuch less than tdelay and the time interval with higherincrease rate can be regarded as equal to half of tdelay.Hence, Imax increases with shorter l due to the attenuationof uq.
Furthermore, at a fault location with a larger maximumcurrent, when the main breaker opens, the next increasingreflection adds to the voltage generated by the breaker, causinga higher maximum overvoltage. The relationship between themaximum voltage Vmax and l is similar to Imax. For optimumparameter selection, Imax and Vmax should be calculated forthe worst case scenario, which is when the fault occurs atthe defined characteristic location l0 on the faulty cable. Inaddition, if the length of the cable is lower than l0, the faultlocation should be given by comparing the possible peakvalues.
IV. PARAMETER OPTIMIZATION
The maximum current and voltage, clearing time, and aswell as energy absorption in arresters are critical in systemprotection and fast recovery from DC faults. These metricsare influenced by the parameters of the DC breaker compo-nents, which should be optimally selected when designing thesystem. Among all the parameters of the DC circuit breaker,the current limiting reactor, the rated voltage of the arresterand the delay time are of the most critical factors influencingthe breaker performance. The current limiting reactor is usedto limit the maximum current within the interruption capabilityof the DC breaker. The rated voltage of the arrester determines
the overvoltage level and the decrease rate of the fault currentdirectly. The delay time, which is limited by the opening speedof the UFD, is always one of the most important determinantsof the operation time of the DC breaker.
Due to the different influence of each parameter on the tran-sient response, it is difficult to select an optimal combination ofthem. The series-connected current limiting reactor of the DCbreaker can limit the increase rate of fault current. However,it ironically impacts the maximum voltage by increasing thereflection coefficient and lengthening the interruption time ofthe CB. In addition, the reactors in the adjacent cables canalso influence the overcurrent and overvoltage. The increaseof the delay time for the UFD before the main breaker opens,can increase the maximum current. However, the maximumvoltage also depends on the traveling wave during the timedelay. Furthermore, reducing the rated voltage of the arrestercan reduce the overvoltage to a lower level. However, it willlengthen the operation time of the breaker. Therefore, allthe trade-offs among Imax, Vmax, tclear and WEAP should betaken into the optimization, which requires help of quantitativecalculation. In this paper, the proposed time-domain methodfor transient response and the genetic algorithm are usedto solve the optimization problem. The process includes thefollowings:
• Based on the detailed analysis during the fault clearanceprocess presented in Section III, Imax, Vmax, tclear andWEAP can be obtained from the numerical solutions.Imax, Vmax, tclear and WEAP are nonlinear functions ofthe parameters Lcb,i1...Lcb,ij, tdelay and Ur, which can beexpressed by
fm(x),m = 1, 2, 3, 4; (20a)x = [Lcb,i1...Lcb,ij , tdelay, Ur]; (20b)
Imax = f1(x); (20c)Vmax = f2(x); (20d)tclear = f3(x); (20e)WEAP = f4(x); (20f)
where Lcb,i1...Lcb,ij represent the reactors in the faultycable and the adjacent cables. In the practical MTDCsystems, the reactors of different lines might be differentand need to be optimized independently at the same time.
• The bound of each parameter is based on the voltage classand rated power of the system. These bounds, which aredetermined by the cost, insulation coordination, etc., canbe obtained from the specifications of a real system. Thecurrent limiting reactor should be large enough to limitthe maximum current within the interruption capabilityof the DC breaker. However, it is constrained by the costand volume. The range of the rated voltage of the arresteris based on the insulation level of the DC lines. The delaytime of the DC breaker is mainly limited by the openingspeed and the voltage withstanding capability of the UFD.
• The multi-objective problem, which aims to minimize theImax, Vmax, tclear and WEAP by optimal selection of theparameters within their bounds, can be formulated as
0 1 2 3 4 5 6 7 8 9
(a)
-2
0
2
4
Time (ms)
0 1 2 3 4 5 6 7 8 9
(b)
-2
0
2
4
Time (ms)
0 1 2 3 4 5 6 7 8 9
(c)
-1
0
1
2
3
Time (ms)
0 1 2 3 4 5 6 7 8 9
(d)
-400
-200
0
200
400
Time (ms)
0 1 2 3 4 5 6 7 8 9
(e)
-200
0
200
400
600
Time (ms)
0 1 2 3 4 5 6 7 8
(f)
-2
0
2
4
Time (ms)
0 1 2 3 4 5 6 7 8
(g)
-2
0
2
4
Time (ms)
0 1 2 3 4 5 6 7 8
(h)
-200
0
200
400
600
Time (ms)
0 1 2 3 4 5 6 7 8
(i)
0
500
1000
1500
Time (ms)
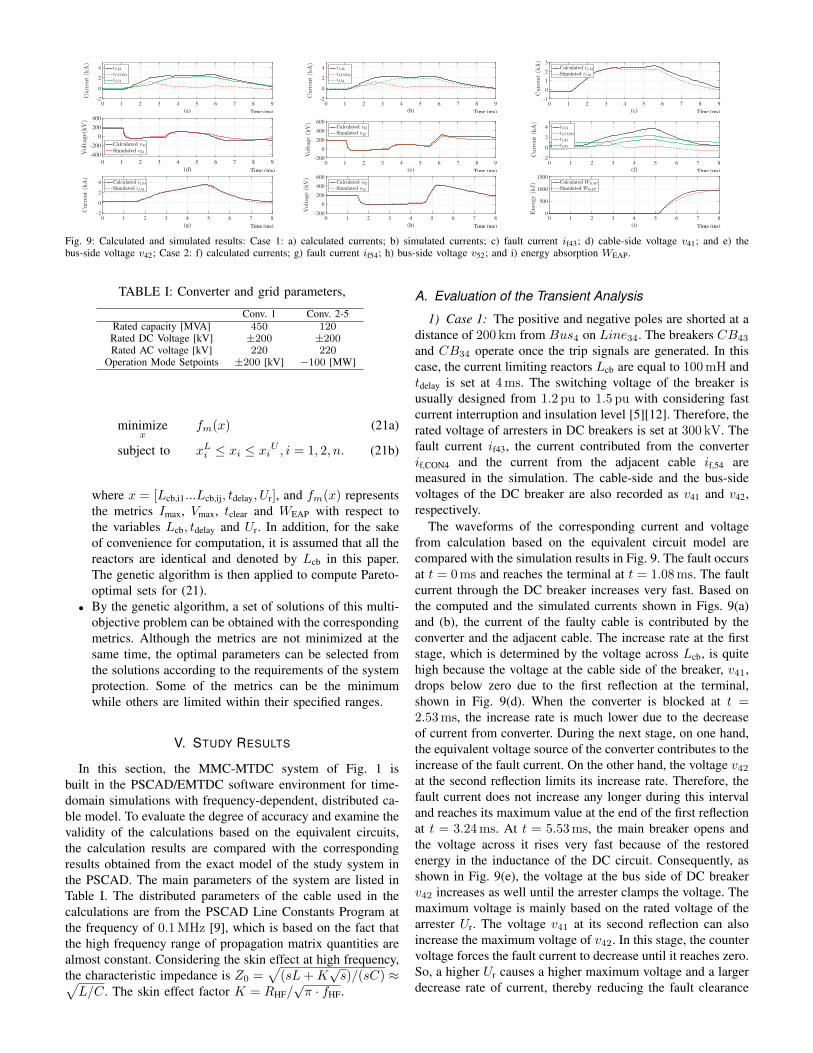
Fig. 9: Calculated and simulated results: Case 1: a) calculated currents; b) simulated currents; c) fault current if43; d) cable-side voltage v41; and e) thebus-side voltage v42; Case 2: f) calculated currents; g) fault current if54; h) bus-side voltage v52; and i) energy absorption WEAP.
TABLE I: Converter and grid parameters,
Conv. 1 Conv. 2-5Rated capacity [MVA] 450 120Rated DC Voltage [kV] ±200 ±200Rated AC voltage [kV] 220 220
Operation Mode Setpoints ±200 [kV] −100 [MW]
minimizex
fm(x) (21a)
subject to xLi ≤ xi ≤ xiU , i = 1, 2, n. (21b)
where x = [Lcb,i1...Lcb,ij, tdelay, Ur], and fm(x) representsthe metrics Imax, Vmax, tclear and WEAP with respect tothe variables Lcb, tdelay and Ur. In addition, for the sakeof convenience for computation, it is assumed that all thereactors are identical and denoted by Lcb in this paper.The genetic algorithm is then applied to compute Pareto-optimal sets for (21).
• By the genetic algorithm, a set of solutions of this multi-objective problem can be obtained with the correspondingmetrics. Although the metrics are not minimized at thesame time, the optimal parameters can be selected fromthe solutions according to the requirements of the systemprotection. Some of the metrics can be the minimumwhile others are limited within their specified ranges.
V. STUDY RESULTS
In this section, the MMC-MTDC system of Fig. 1 isbuilt in the PSCAD/EMTDC software environment for time-domain simulations with frequency-dependent, distributed ca-ble model. To evaluate the degree of accuracy and examine thevalidity of the calculations based on the equivalent circuits,the calculation results are compared with the correspondingresults obtained from the exact model of the study system inthe PSCAD. The main parameters of the system are listed inTable I. The distributed parameters of the cable used in thecalculations are from the PSCAD Line Constants Program atthe frequency of 0.1 MHz [9], which is based on the fact thatthe high frequency range of propagation matrix quantities arealmost constant. Considering the skin effect at high frequency,the characteristic impedance is Z0 =
√(sL+K
√s)/(sC) ≈√
L/C. The skin effect factor K = RHF/√π · fHF.
A. Evaluation of the Transient Analysis
1) Case 1: The positive and negative poles are shorted at adistance of 200 km from Bus4 on Line34. The breakers CB43
and CB34 operate once the trip signals are generated. In thiscase, the current limiting reactors Lcb are equal to 100 mH andtdelay is set at 4 ms. The switching voltage of the breaker isusually designed from 1.2 pu to 1.5 pu with considering fastcurrent interruption and insulation level [5][12]. Therefore, therated voltage of arresters in DC breakers is set at 300 kV. Thefault current if43, the current contributed from the converterif,CON4 and the current from the adjacent cable if,54 aremeasured in the simulation. The cable-side and the bus-sidevoltages of the DC breaker are also recorded as v41 and v42,respectively.
The waveforms of the corresponding current and voltagefrom calculation based on the equivalent circuit model arecompared with the simulation results in Fig. 9. The fault occursat t = 0 ms and reaches the terminal at t = 1.08 ms. The faultcurrent through the DC breaker increases very fast. Based onthe computed and the simulated currents shown in Figs. 9(a)and (b), the current of the faulty cable is contributed by theconverter and the adjacent cable. The increase rate at the firststage, which is determined by the voltage across Lcb, is quitehigh because the voltage at the cable side of the breaker, v41,drops below zero due to the first reflection at the terminal,shown in Fig. 9(d). When the converter is blocked at t =2.53 ms, the increase rate is much lower due to the decreaseof current from converter. During the next stage, on one hand,the equivalent voltage source of the converter contributes to theincrease of the fault current. On the other hand, the voltage v42at the second reflection limits its increase rate. Therefore, thefault current does not increase any longer during this intervaland reaches its maximum value at the end of the first reflectionat t = 3.24 ms. At t = 5.53 ms, the main breaker opens andthe voltage across it rises very fast because of the restoredenergy in the inductance of the DC circuit. Consequently, asshown in Fig. 9(e), the voltage at the bus side of DC breakerv42 increases as well until the arrester clamps the voltage. Themaximum voltage is mainly based on the rated voltage of thearrester Ur. The voltage v41 at its second reflection can alsoincrease the maximum voltage of v42. In this stage, the countervoltage forces the fault current to decrease until it reaches zero.So, a higher Ur causes a higher maximum voltage and a largerdecrease rate of current, thereby reducing the fault clearance
0 100 200 3000
2
4
0 100 200 300200
400
600
0 100 200 300
5
10
0 100 200 3000
2000
4000
2 2.5 3 3.5 40
5
2 2.5 3 3.5 4200
300
400
500
2 2.5 3 3.5 40
5
10
2 2.5 3 3.5 40
1000
2000
200 300 400 500200
400
600
200 300 400 5000
10
20
200 300 400 5000
2000
4000
(a-1) (a-2) (a-3) (a-4)
(b-1)
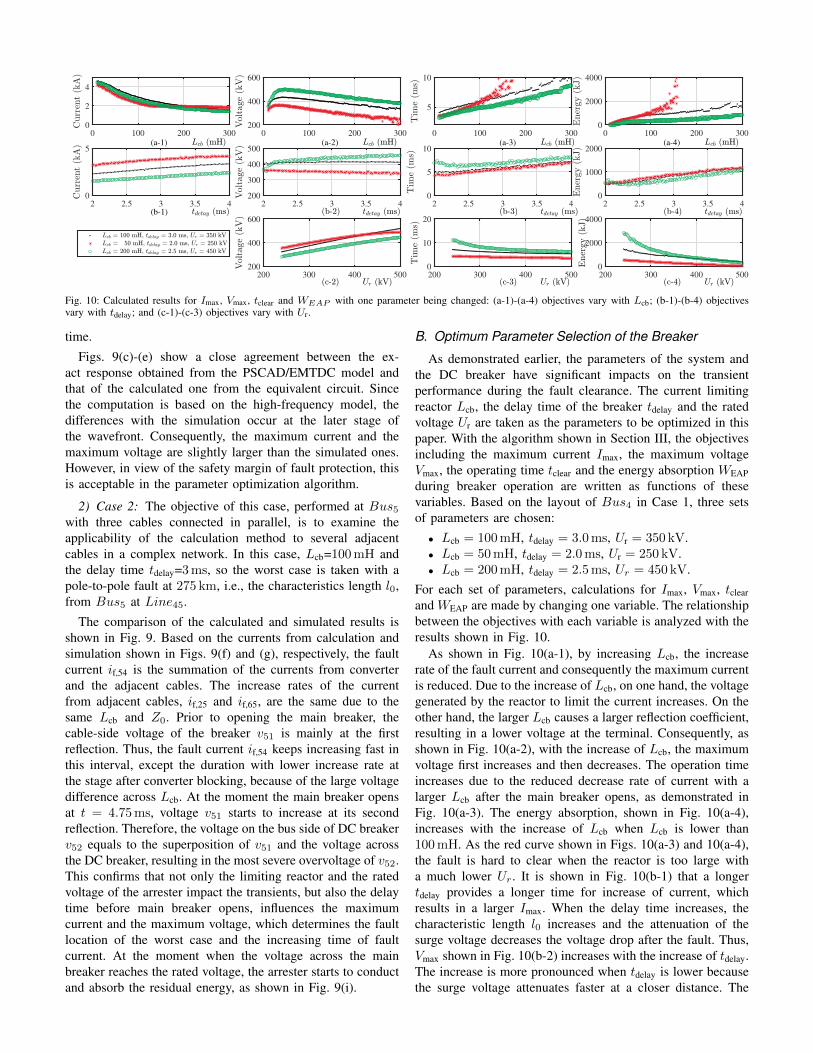
Fig. 10: Calculated results for Imax, Vmax, tclear and WEAP with one parameter being changed: (a-1)-(a-4) objectives vary with Lcb; (b-1)-(b-4) objectivesvary with tdelay; and (c-1)-(c-3) objectives vary with Ur.
time.
Figs. 9(c)-(e) show a close agreement between the ex-act response obtained from the PSCAD/EMTDC model andthat of the calculated one from the equivalent circuit. Sincethe computation is based on the high-frequency model, thedifferences with the simulation occur at the later stage ofthe wavefront. Consequently, the maximum current and themaximum voltage are slightly larger than the simulated ones.However, in view of the safety margin of fault protection, thisis acceptable in the parameter optimization algorithm.
2) Case 2: The objective of this case, performed at Bus5with three cables connected in parallel, is to examine theapplicability of the calculation method to several adjacentcables in a complex network. In this case, Lcb=100 mH andthe delay time tdelay=3 ms, so the worst case is taken with apole-to-pole fault at 275 km, i.e., the characteristics length l0,from Bus5 at Line45.
The comparison of the calculated and simulated results isshown in Fig. 9. Based on the currents from calculation andsimulation shown in Figs. 9(f) and (g), respectively, the faultcurrent if,54 is the summation of the currents from converterand the adjacent cables. The increase rates of the currentfrom adjacent cables, if,25 and if,65, are the same due to thesame Lcb and Z0. Prior to opening the main breaker, thecable-side voltage of the breaker v51 is mainly at the firstreflection. Thus, the fault current if,54 keeps increasing fast inthis interval, except the duration with lower increase rate atthe stage after converter blocking, because of the large voltagedifference across Lcb. At the moment the main breaker opensat t = 4.75 ms, voltage v51 starts to increase at its secondreflection. Therefore, the voltage on the bus side of DC breakerv52 equals to the superposition of v51 and the voltage acrossthe DC breaker, resulting in the most severe overvoltage of v52.This confirms that not only the limiting reactor and the ratedvoltage of the arrester impact the transients, but also the delaytime before main breaker opens, influences the maximumcurrent and the maximum voltage, which determines the faultlocation of the worst case and the increasing time of faultcurrent. At the moment when the voltage across the mainbreaker reaches the rated voltage, the arrester starts to conductand absorb the residual energy, as shown in Fig. 9(i).
B. Optimum Parameter Selection of the Breaker
As demonstrated earlier, the parameters of the system andthe DC breaker have significant impacts on the transientperformance during the fault clearance. The current limitingreactor Lcb, the delay time of the breaker tdelay and the ratedvoltage Ur are taken as the parameters to be optimized in thispaper. With the algorithm shown in Section III, the objectivesincluding the maximum current Imax, the maximum voltageVmax, the operating time tclear and the energy absorption WEAPduring breaker operation are written as functions of thesevariables. Based on the layout of Bus4 in Case 1, three setsof parameters are chosen:• Lcb = 100 mH, tdelay = 3.0 ms, Ur = 350 kV.• Lcb = 50 mH, tdelay = 2.0 ms, Ur = 250 kV.• Lcb = 200 mH, tdelay = 2.5 ms, Ur = 450 kV.
For each set of parameters, calculations for Imax, Vmax, tclearand WEAP are made by changing one variable. The relationshipbetween the objectives with each variable is analyzed with theresults shown in Fig. 10.
As shown in Fig. 10(a-1), by increasing Lcb, the increaserate of the fault current and consequently the maximum currentis reduced. Due to the increase of Lcb, on one hand, the voltagegenerated by the reactor to limit the current increases. On theother hand, the larger Lcb causes a larger reflection coefficient,resulting in a lower voltage at the terminal. Consequently, asshown in Fig. 10(a-2), with the increase of Lcb, the maximumvoltage first increases and then decreases. The operation timeincreases due to the reduced decrease rate of current with alarger Lcb after the main breaker opens, as demonstrated inFig. 10(a-3). The energy absorption, shown in Fig. 10(a-4),increases with the increase of Lcb when Lcb is lower than100 mH. As the red curve shown in Figs. 10(a-3) and 10(a-4),the fault is hard to clear when the reactor is too large witha much lower Ur. It is shown in Fig. 10(b-1) that a longertdelay provides a longer time for increase of current, whichresults in a larger Imax. When the delay time increases, thecharacteristic length l0 increases and the attenuation of thesurge voltage decreases the voltage drop after the fault. Thus,Vmax shown in Fig. 10(b-2) increases with the increase of tdelay.The increase is more pronounced when tdelay is lower becausethe surge voltage attenuates faster at a closer distance. The
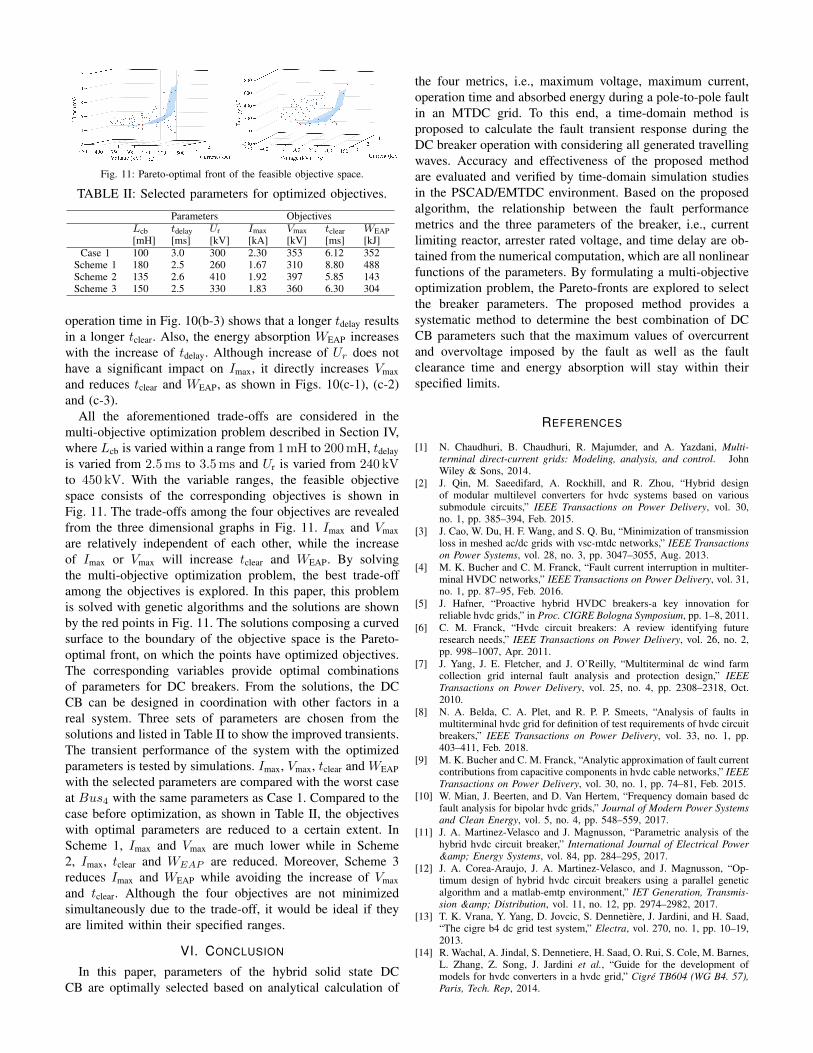
Fig. 11: Pareto-optimal front of the feasible objective space.
TABLE II: Selected parameters for optimized objectives.
Parameters ObjectivesLcb[mH]
tdelay[ms]
Ur[kV]
Imax[kA]
Vmax[kV]
tclear[ms]
WEAP[kJ]
Case 1 100 3.0 300 2.30 353 6.12 352Scheme 1 180 2.5 260 1.67 310 8.80 488Scheme 2 135 2.6 410 1.92 397 5.85 143Scheme 3 150 2.5 330 1.83 360 6.30 304
operation time in Fig. 10(b-3) shows that a longer tdelay resultsin a longer tclear. Also, the energy absorption WEAP increaseswith the increase of tdelay. Although increase of Ur does nothave a significant impact on Imax, it directly increases Vmaxand reduces tclear and WEAP, as shown in Figs. 10(c-1), (c-2)and (c-3).
All the aforementioned trade-offs are considered in themulti-objective optimization problem described in Section IV,where Lcb is varied within a range from 1 mH to 200 mH, tdelayis varied from 2.5 ms to 3.5 ms and Ur is varied from 240 kVto 450 kV. With the variable ranges, the feasible objectivespace consists of the corresponding objectives is shown inFig. 11. The trade-offs among the four objectives are revealedfrom the three dimensional graphs in Fig. 11. Imax and Vmaxare relatively independent of each other, while the increaseof Imax or Vmax will increase tclear and WEAP. By solvingthe multi-objective optimization problem, the best trade-offamong the objectives is explored. In this paper, this problemis solved with genetic algorithms and the solutions are shownby the red points in Fig. 11. The solutions composing a curvedsurface to the boundary of the objective space is the Pareto-optimal front, on which the points have optimized objectives.The corresponding variables provide optimal combinationsof parameters for DC breakers. From the solutions, the DCCB can be designed in coordination with other factors in areal system. Three sets of parameters are chosen from thesolutions and listed in Table II to show the improved transients.The transient performance of the system with the optimizedparameters is tested by simulations. Imax, Vmax, tclear and WEAPwith the selected parameters are compared with the worst caseat Bus4 with the same parameters as Case 1. Compared to thecase before optimization, as shown in Table II, the objectiveswith optimal parameters are reduced to a certain extent. InScheme 1, Imax and Vmax are much lower while in Scheme2, Imax, tclear and WEAP are reduced. Moreover, Scheme 3reduces Imax and WEAP while avoiding the increase of Vmaxand tclear. Although the four objectives are not minimizedsimultaneously due to the trade-off, it would be ideal if theyare limited within their specified ranges.
VI. CONCLUSION
In this paper, parameters of the hybrid solid state DCCB are optimally selected based on analytical calculation of
the four metrics, i.e., maximum voltage, maximum current,operation time and absorbed energy during a pole-to-pole faultin an MTDC grid. To this end, a time-domain method isproposed to calculate the fault transient response during theDC breaker operation with considering all generated travellingwaves. Accuracy and effectiveness of the proposed methodare evaluated and verified by time-domain simulation studiesin the PSCAD/EMTDC environment. Based on the proposedalgorithm, the relationship between the fault performancemetrics and the three parameters of the breaker, i.e., currentlimiting reactor, arrester rated voltage, and time delay are ob-tained from the numerical computation, which are all nonlinearfunctions of the parameters. By formulating a multi-objectiveoptimization problem, the Pareto-fronts are explored to selectthe breaker parameters. The proposed method provides asystematic method to determine the best combination of DCCB parameters such that the maximum values of overcurrentand overvoltage imposed by the fault as well as the faultclearance time and energy absorption will stay within theirspecified limits.
REFERENCES
[1] N. Chaudhuri, B. Chaudhuri, R. Majumder, and A. Yazdani, Multi-terminal direct-current grids: Modeling, analysis, and control. JohnWiley & Sons, 2014.
[2] J. Qin, M. Saeedifard, A. Rockhill, and R. Zhou, “Hybrid designof modular multilevel converters for hvdc systems based on varioussubmodule circuits,” IEEE Transactions on Power Delivery, vol. 30,no. 1, pp. 385–394, Feb. 2015.
[3] J. Cao, W. Du, H. F. Wang, and S. Q. Bu, “Minimization of transmissionloss in meshed ac/dc grids with vsc-mtdc networks,” IEEE Transactionson Power Systems, vol. 28, no. 3, pp. 3047–3055, Aug. 2013.
[4] M. K. Bucher and C. M. Franck, “Fault current interruption in multiter-minal HVDC networks,” IEEE Transactions on Power Delivery, vol. 31,no. 1, pp. 87–95, Feb. 2016.
[5] J. Hafner, “Proactive hybrid HVDC breakers-a key innovation forreliable hvdc grids,” in Proc. CIGRE Bologna Symposium, pp. 1–8, 2011.
[6] C. M. Franck, “Hvdc circuit breakers: A review identifying futureresearch needs,” IEEE Transactions on Power Delivery, vol. 26, no. 2,pp. 998–1007, Apr. 2011.
[7] J. Yang, J. E. Fletcher, and J. O’Reilly, “Multiterminal dc wind farmcollection grid internal fault analysis and protection design,” IEEETransactions on Power Delivery, vol. 25, no. 4, pp. 2308–2318, Oct.2010.
[8] N. A. Belda, C. A. Plet, and R. P. P. Smeets, “Analysis of faults inmultiterminal hvdc grid for definition of test requirements of hvdc circuitbreakers,” IEEE Transactions on Power Delivery, vol. 33, no. 1, pp.403–411, Feb. 2018.
[9] M. K. Bucher and C. M. Franck, “Analytic approximation of fault currentcontributions from capacitive components in hvdc cable networks,” IEEETransactions on Power Delivery, vol. 30, no. 1, pp. 74–81, Feb. 2015.
[10] W. Mian, J. Beerten, and D. Van Hertem, “Frequency domain based dcfault analysis for bipolar hvdc grids,” Journal of Modern Power Systemsand Clean Energy, vol. 5, no. 4, pp. 548–559, 2017.
[11] J. A. Martinez-Velasco and J. Magnusson, “Parametric analysis of thehybrid hvdc circuit breaker,” International Journal of Electrical Power& Energy Systems, vol. 84, pp. 284–295, 2017.
[12] J. A. Corea-Araujo, J. A. Martinez-Velasco, and J. Magnusson, “Op-timum design of hybrid hvdc circuit breakers using a parallel geneticalgorithm and a matlab-emtp environment,” IET Generation, Transmis-sion & Distribution, vol. 11, no. 12, pp. 2974–2982, 2017.
[13] T. K. Vrana, Y. Yang, D. Jovcic, S. Dennetiere, J. Jardini, and H. Saad,“The cigre b4 dc grid test system,” Electra, vol. 270, no. 1, pp. 10–19,2013.
[14] R. Wachal, A. Jindal, S. Dennetiere, H. Saad, O. Rui, S. Cole, M. Barnes,L. Zhang, Z. Song, J. Jardini et al., “Guide for the development ofmodels for hvdc converters in a hvdc grid,” Cigre TB604 (WG B4. 57),Paris, Tech. Rep, 2014.
[15] N. Nahman and D. Holt, “Transient analysis of coaxial cables usingthe skin effect approximation A + Bsqrt{s},” IEEE Transactions onCircuit Theory, vol. 19, no. 5, pp. 443–451, Sep. 1972.
[16] R. L. Wigington and N. S. Nahman, “Transient analysis of coaxial cablesconsidering skin effect,” Proceedings of the IRE, vol. 45, no. 2, pp. 166–174, Feb. 1957.
[17] P. Magnusson, “Transient wavefronts on lossy transmission lines-effectof source resistance,” IEEE Transactions on Circuit Theory, vol. 15,no. 3, pp. 290–292, Sep. 1968.
[18] J. Lyu, X. Cai, and M. Molinas, “Impedance modeling of modularmultilevel converters,” in IECON 2015 - 41st Annual Conference of theIEEE Industrial Electronics Society, pp. 000 180–000 185, Nov. 2015.
[19] O. Cwikowski, A. Wood, A. Miller, M. Barnes, and R. Shuttleworth,“Operating dc circuit breakers with mmc,” IEEE Transactions on PowerDelivery, vol. 33, no. 1, pp. 260–270, Feb. 2018.
[20] J. Sneath and A. D. Rajapakse, “Fault detection and interruption inan earthed hvdc grid using rocov and hybrid dc breakers,” IEEETransactions on Power Delivery, vol. 31, no. 3, pp. 973–981, 2016.
[21] J. Sneath, “Grounded hvdc grid line fault protection using rate ofchange of voltage and hybrid dc breakers,” Master’s thesis, Universityof Manitoba, Oct. 2014.


![Analysis And Optimization Of Process Parameters During ...A.M.Badadhe etal [6] attempt is made to select the combination of optimum cutting parameters which will result in better surface](https://img.pdfslide.us/doc/110x75/5e6fcdd3542a7677d80d3d90/analysis-and-optimization-of-process-parameters-during-ambadadhe-etal-6.jpg)