Embed Size (px)
Citation preview
18 Oilfield Review
Optimizing Production from Reservoir to Process Plant
Alvin BarberMack E. ShippenHouston, Texas, USA
Santanu BaruaMumbai, India
Juan Cruz VelázquezVillahermosa, Tabasco, Mexico
Aaron Marino Garrido HernándezPEMEXReforma, Chiapas, Mexico
Hans Eric KlumpenBaden, Austria
Sanjay Kumar MoitraONGCMumbai, India
Fernando L. MoralesPoza Rica, Veracruz, Mexico
Scott RaphaelBob SauvéCalgary, Alberta, Canada
Jan Richard SagliStatoilHydroTrondheim, Norway
Mike WeberBPHouston, Texas
For help in preparation of this article, thanks to Andrew Howell, Calgary; and Josephine P. Mawutor Ndinyah, Cambridge, Massachusetts, USA.Avocet, ECLIPSE, ECLIPSE Blackoil, Merak Economics Module, Merak Peep, NODAL, Petrel and PIPESIM are marks of Schlumberger. Aspen HYSYS is a mark of AspenTech. idvsolutions is a trademarkof IDV Solutions LLC. Intel 386, Intel Dual CoreItanium 2 and Intel Pentium are marks of Intel Corporation.
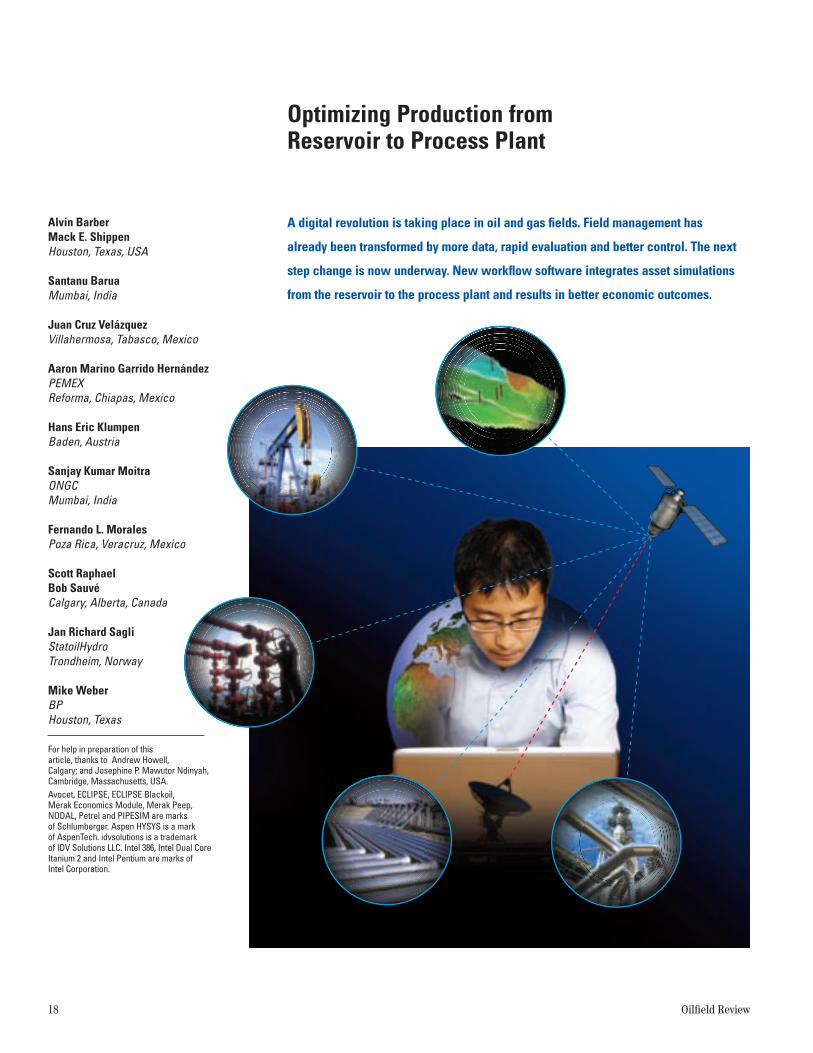
A digital revolution is taking place in oil and gas fields. Field management has
already been transformed by more data, rapid evaluation and better control. The next
step change is now underway. New workflow software integrates asset simulations
from the reservoir to the process plant and results in better economic outcomes.
60906schD4R1.qxp:60906sckD4R1 4/8/08 11:28 AM Page 18
Winter 2007/2008 19
Producing oil and gas is not easy or cheap.Whether production takes place in remoteonshore environments or in deep water, costs arehigh. As increased cost converges with dwindlingsupply, energy producers are seeking to squeezeevery drop from current assets and optimizedesign of new facilities. A key factor in thisefficiency push is the increasing use of intelligentdigital, or so-called “smart,” technology.
Digital technology continues to grow insophistication and now pervades most activitiesin oil and gas fields. Technologies such as remotemeasurement and map-based visualization of keyparameters in producing fields have becomeroutine.1 These technologies first appeared in the1980s, and their application has accelerated inthe past 15 years (above).2 Although severalacronyms have emerged for the marriage ofdigital technology and the oil field, “intelligentfield” is one that captures the essence. Use ofdigital technology by oil and gas producers is not
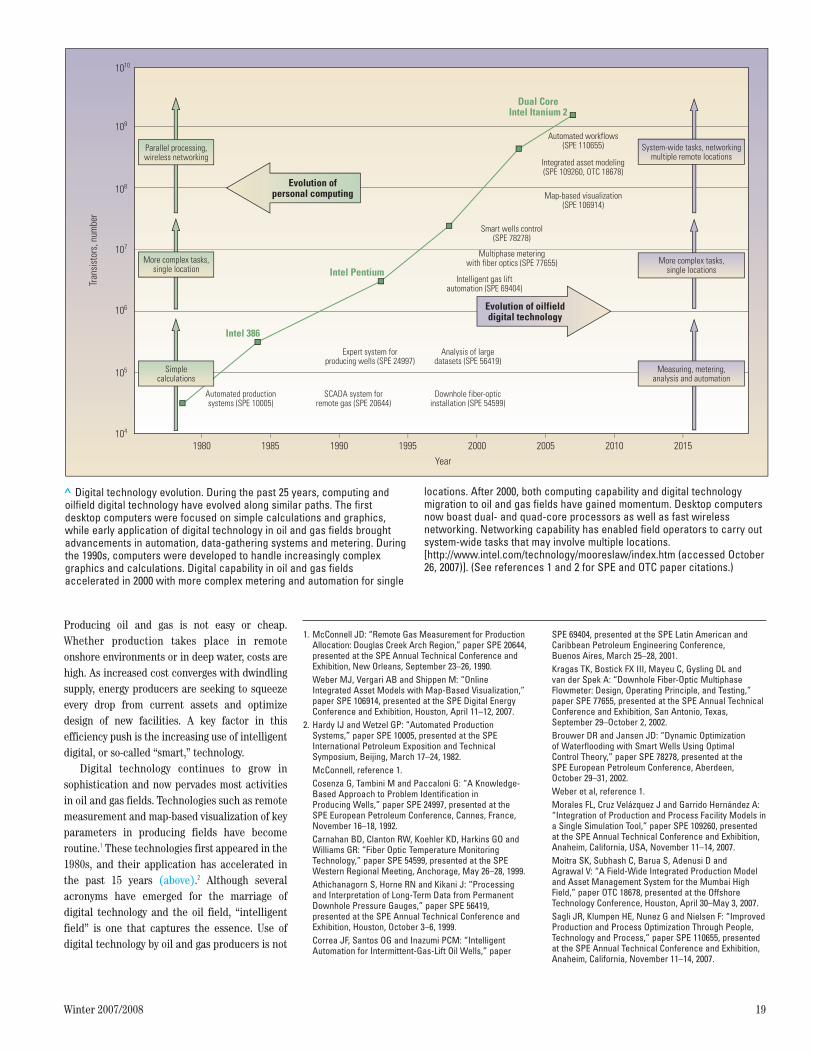
> Digital technology evolution. During the past 25 years, computing andoilfield digital technology have evolved along similar paths. The firstdesktop computers were focused on simple calculations and graphics,while early application of digital technology in oil and gas fields broughtadvancements in automation, data-gathering systems and metering. Duringthe 1990s, computers were developed to handle increasingly complexgraphics and calculations. Digital capability in oil and gas fieldsaccelerated in 2000 with more complex metering and automation for single
locations. After 2000, both computing capability and digital technologymigration to oil and gas fields have gained momentum. Desktop computersnow boast dual- and quad-core processors as well as fast wirelessnetworking. Networking capability has enabled field operators to carry outsystem-wide tasks that may involve multiple locations.[http://www.intel.com/technology/mooreslaw/index.htm (accessed October26, 2007)]. (See references 1 and 2 for SPE and OTC paper citations.)
Tran
sist
ors,
num
ber
1980 1985 1990 1995 2000
Year
2005 2010 2015104
105
106
107
108
109
1010
Intel 386
Intel Pentium
Dual CoreIntel Itanium 2
Automated workflows(SPE 110655)
Map-based visualization(SPE 106914)
Smart wells control(SPE 78278)
Automated productionsystems (SPE 10005)
Evolution ofpersonal computing
Evolution of oilfielddigital technology
SCADA system forremote gas (SPE 20644)
Downhole fiber-opticinstallation (SPE 54599)
Expert system forproducing wells (SPE 24997)
Analysis of largedatasets (SPE 56419)
Multiphase meteringwith fiber optics (SPE 77655)
Intelligent gas liftautomation (SPE 69404)
Integrated asset modeling(SPE 109260, OTC 18678)
More complex tasks,single locations
System-wide tasks, networkingmultiple remote locations
Measuring, metering,analysis and automation
More complex tasks,single location
Parallel processing,wireless networking
Simplecalculations
1. McConnell JD: “Remote Gas Measurement for ProductionAllocation: Douglas Creek Arch Region,” paper SPE 20644,presented at the SPE Annual Technical Conference andExhibition, New Orleans, September 23–26, 1990.Weber MJ, Vergari AB and Shippen M: “OnlineIntegrated Asset Models with Map-Based Visualization,”paper SPE 106914, presented at the SPE Digital EnergyConference and Exhibition, Houston, April 11–12, 2007.
2. Hardy IJ and Wetzel GP: “Automated ProductionSystems,” paper SPE 10005, presented at the SPEInternational Petroleum Exposition and TechnicalSymposium, Beijing, March 17–24, 1982.McConnell, reference 1.Cosenza G, Tambini M and Paccaloni G: “A Knowledge-Based Approach to Problem Identification in Producing Wells,” paper SPE 24997, presented at theSPE European Petroleum Conference, Cannes, France,November 16–18, 1992.Carnahan BD, Clanton RW, Koehler KD, Harkins GO andWilliams GR: “Fiber Optic Temperature MonitoringTechnology,” paper SPE 54599, presented at the SPEWestern Regional Meeting, Anchorage, May 26–28, 1999.Athichanagorn S, Horne RN and Kikani J: “Processingand Interpretation of Long-Term Data from PermanentDownhole Pressure Gauges,” paper SPE 56419,presented at the SPE Annual Technical Conference andExhibition, Houston, October 3–6, 1999.Correa JF, Santos OG and Inazumi PCM: “IntelligentAutomation for Intermittent-Gas-Lift Oil Wells,” paper
SPE 69404, presented at the SPE Latin American andCaribbean Petroleum Engineering Conference, Buenos Aires, March 25–28, 2001.Kragas TK, Bostick FX III, Mayeu C, Gysling DL and van der Spek A: “Downhole Fiber-Optic MultiphaseFlowmeter: Design, Operating Principle, and Testing,”paper SPE 77655, presented at the SPE Annual TechnicalConference and Exhibition, San Antonio, Texas,September 29–October 2, 2002.Brouwer DR and Jansen JD: “Dynamic Optimization of Waterflooding with Smart Wells Using Optimal Control Theory,” paper SPE 78278, presented at the SPE European Petroleum Conference, Aberdeen,October 29–31, 2002.Weber et al, reference 1.Morales FL, Cruz Velázquez J and Garrido Hernández A:“Inte gration of Production and Process Facility Models ina Single Simulation Tool,” paper SPE 109260, presentedat the SPE Annual Technical Conference and Exhibition,Anaheim, California, USA, November 11–14, 2007.Moitra SK, Subhash C, Barua S, Adenusi D andAgrawal V: “A Field-Wide Integrated Production Modeland Asset Management System for the Mumbai HighField,” paper OTC 18678, presented at the OffshoreTechnology Conference, Houston, April 30–May 3, 2007.Sagli JR, Klumpen HE, Nunez G and Nielsen F: “ImprovedProduction and Process Optimization Through People,Technology and Process,” paper SPE 110655, presentedat the SPE Annual Technical Conference and Exhibition,Anaheim, California, November 11–14, 2007.
60906schD4R1.qxp:60906sckD4R1 4/24/08 10:12 AM Page 19
new. What is new and part of the intelligent fieldvision is linking different technologies toaccomplish a system-wide task (see “The BigPicture: Integrated Asset Management,” page 34).
The payoff for implementation of theintelligent field is large. This technology ispredicted to increase world oil recovery by20 billion m3 [125 billion bbl] over the next fiveto ten years.3 Although some components of theintelligent field will take time to fully mature,others are being put into practice now. Anexample of new technology that can produce realbenefits is integrated asset modeling. It linkstraditional tools such as ECLIPSE reservoirsimulation software with other well-knownproduction system models to arrive at an end-to-end solution. Integrated asset modeling can beused to improve production from existing fieldsor during front-end design for improvements tonew fields.
The focus of this article is the application ofintegrated asset modeling—how it works andhow it is being applied to solve production
challenges. Case studies from Mexico, offshoreIndia, the North Sea and the USA illustratevarious aspects of intelligent field application.Before discussing the details of integrated assetmodeling, we examine traditional methods forfield planning.
Traditional Methods In 2006, the oil and gas industry spent about 3% oftotal revenues on information technology—US $2 billion on hardware, software and services.4
This information technology package comprisesindividual simulators for the reservoir, pipingnetwork, process facilities and economics. Thesesimulators have made significant advances inaccuracy and reliability over the years. Complexreservoirs are more easily modeled, multiphaseflow is simulated, and performance of importantequipment such as compressors can be optimized.
Although the simulators work well whenapplied to individual field components, problemsarise when they are applied in a serial manner toperform a full-field analysis. Data are often
passed between individual assets and disciplinesby spreadsheets and interaction effects areabsent (above).5 A change in any one of the fieldcomponents has cascading impacts on upstreamand downstream results, and reflecting thisproperly requires substantial intervention in themodeling steps. In some cases, this interventionmay be impractical, if not impossible.
There are two significant problems withapplying traditional methods to field planning.First, all simulations downstream of the reservoirmodel are static—they represent only one pointin time during the life of the asset. The workinvolved in setting up these models must beredone to analyze any other point in time.Secondly, the traditional method fails to takeinto account the dynamic nature of fielddevelopment planning. For example, theproduction rate of an existing well may changewhen new wells are drilled in the area—undermining the original plan. In addition,events such as compressor changes, orimplementation of various secondary-recovery
20 Oilfield Review
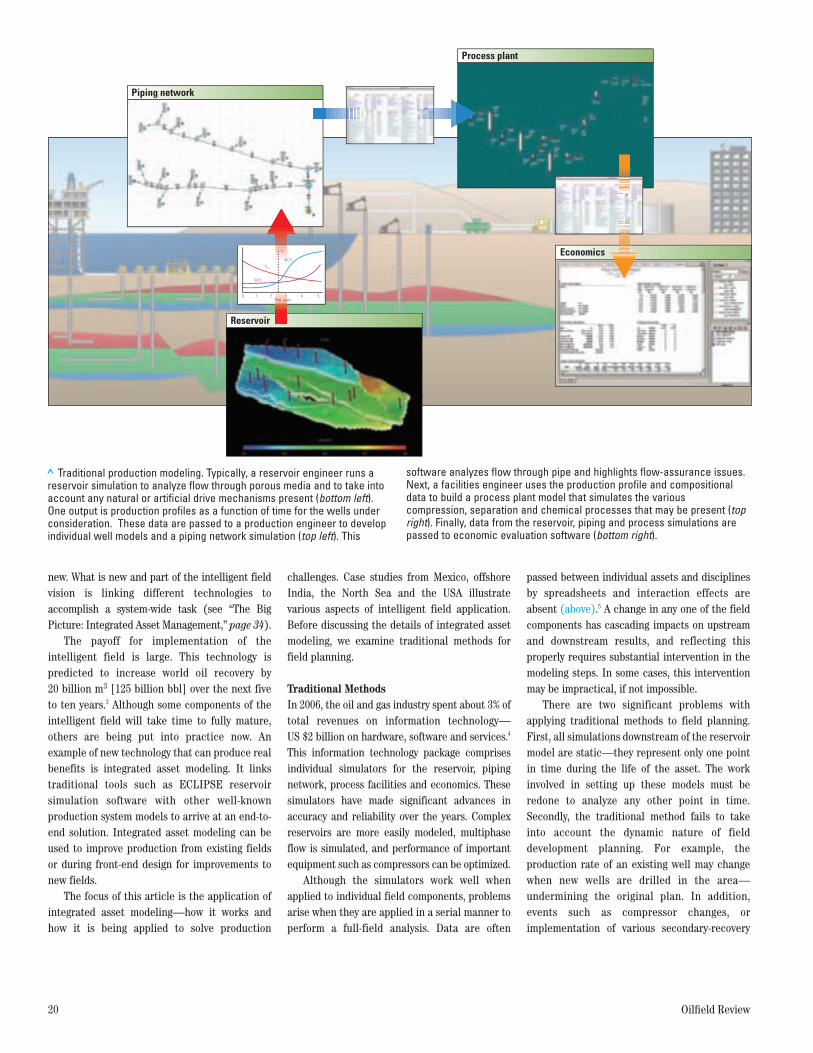
> Traditional production modeling. Typically, a reservoir engineer runs areservoir simulation to analyze flow through porous media and to take intoaccount any natural or artificial drive mechanisms present (bottom left).One output is production profiles as a function of time for the wells underconsideration. These data are passed to a production engineer to developindividual well models and a piping network simulation (top left). This
software analyzes flow through pipe and highlights flow-assurance issues.Next, a facilities engineer uses the production profile and compositionaldata to build a process plant model that simulates the variouscompression, separation and chemical processes that may be present (topright). Finally, data from the reservoir, piping and process simulations arepassed to economic evaluation software (bottom right).
Reservoir
Piping network
Economics
Process plant
0 1 2Time, years
PD
WC%
Pres
GOR
3 4 5
WWWWW
DPDPDPDPPP
33333333TiTiTime yeaTime yeaTime yeaTime yeaTime, yeaTime, yea, y
60906sckD4R1.qxp:60906sckD4R1 2/16/08 12:59 AM Page 20
Winter 2007/2008 21
programs executed later will likely invalidate theinitial data exchanges between simulationmodels. These compromises in traditional full-field analysis can lead to a host of problemsincluding unnecessary drilling and oversized orundersized facilities.
A solution to these deficiencies in full-fieldsimulation is emerging as part of the intelligentfield. There is a shift from historical serialworkflows to real-time dynamic processes thatfully account for feed-forward and feedbackeffects. A key characteristic of the intelligentfield is the ability to extend use of one discipline’sboundary conditions into another disciplineacross the entire field.6 The use of real-timedynamic processing to model the impact ofinterrelated events, both historical and projected,paves the way for a prediction of fieldperformance that adapts to a changing operationsenvironment. This concept is at the heart ofintegrated asset modeling.
A Quiet RevolutionIntegrated asset modeling is an evolutionaryextension of a well-known technique calledNODAL production system analysis. This processhas been used to study complex, interactingsystems such as pipeline networks, electricalcircuits and oil production. The procedureentails selection of a reference point, or node, todivide the system. In an oil- or gas-producingsystem, a node might be in one of severallocations—common points are the bottom of thewell and the wellhead. Components upstream ofthe node are termed the inflow section, whilethose downstream are the outflow section. Forinstance, perforations located upstream of thewellhead node would be part of the inflowsection, while a pipeline to the process plantwould be part of the outflow section.
Regardless of the node’s location, twoboundary conditions must be satisfied. Flow intothe node must equal flow out of the node, andonly one pressure can exist at a node. Pressureand flow-rate curves are generated for nodeinflow and node outflow. The intersection of thecurves defines the solution to the problem byyielding a flow rate and a pressure that satisfyboth inflow and outflow constraints.7
Extension of NODAL analysis from single wellsto more complex systems is not new. In 1971, apioneering proposal demonstrated how reservoirand surface models could be linked to arrive at asolution for a gas field-gathering system, and otherproposals have followed.8 What is new anddifferent is the arrival of commercial software thatlinks separate models for reservoirs, piping,process facilities and produc tion economics toachieve an optimized solution. These offerings arenot multiple simulators encased in a singlepackage but rather are computational frameworksthat link simulators across assets, computingenvironments and locations.
The connection framework approach to assetmodeling is illustrated by the Avocet IntegratedAsset Modeler production software. Thisintegration software provides an end-to-endasset solution that links the reservoir (ECLIPSEreservoir simulation software), well and surfaceinfrastructure (PIPESIM production systemanalysis software) and process facilities (HYSYSprocess simulation software) into a singleproduction-management environment.9 In addi -
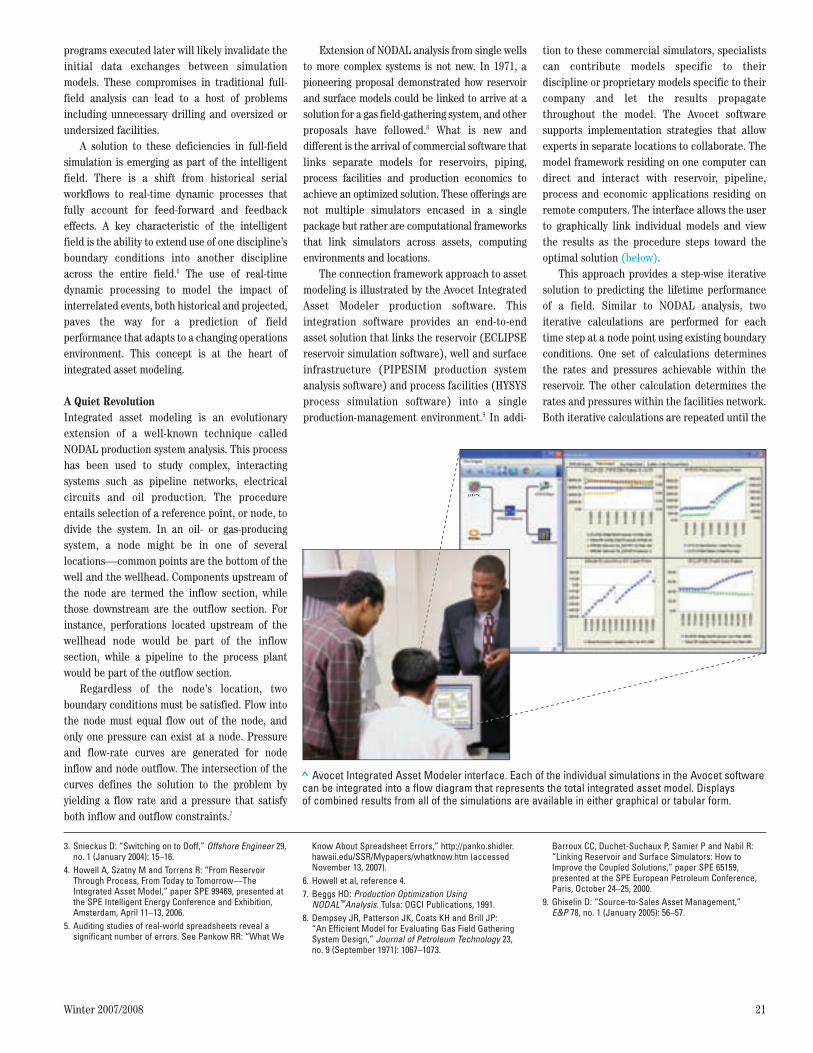
tion to these commercial simulators, specialistscan contribute models specific to theirdiscipline or proprietary models specific to theircompany and let the results propagatethroughout the model. The Avocet softwaresupports implemen tation strategies that allowexperts in separate locations to collaborate. Themodel framework residing on one computer candirect and interact with reservoir, pipeline,process and economic applications residing onremote computers. The interface allows the userto graphically link individual models and viewthe results as the procedure steps toward theoptimal solution (below).
This approach provides a step-wise iterativesolution to predicting the lifetime performanceof a field. Similar to NODAL analysis, twoiterative calculations are performed for eachtime step at a node point using existing boundaryconditions. One set of calculations determinesthe rates and pressures achievable within thereservoir. The other calculation determines therates and pressures within the facilities network.Both iterative calculations are repeated until the
3. Snieckus D: “Switching on to Doff,” Offshore Engineer 29,no. 1 (January 2004): 15–16.
4. Howell A, Szatny M and Torrens R: “From ReservoirThrough Process, From Today to Tomorrow—TheIntegrated Asset Model,” paper SPE 99469, presented atthe SPE Intelligent Energy Conference and Exhibition,Amsterdam, April 11–13, 2006.
5. Auditing studies of real-world spreadsheets reveal asignificant number of errors. See Pankow RR: “What We
Barroux CC, Duchet-Suchaux P, Samier P and Nabil R:“Linking Reservoir and Surface Simulators: How toImprove the Coupled Solutions,” paper SPE 65159,presented at the SPE European Petroleum Conference,Paris, October 24–25, 2000.
9. Ghiselin D: “Source-to-Sales Asset Management,” E&P 78, no. 1 (January 2005): 56–57.
Know About Spreadsheet Errors,” http://panko.shidler.hawaii.edu/SSR/Mypapers/whatknow.htm (accessedNovember 13, 2007).
6. Howell et al, reference 4.7. Beggs HD: Production Optimization Using
NODAL™Analysis. Tulsa: OGCI Publications, 1991.8. Dempsey JR, Patterson JK, Coats KH and Brill JP:
“An Efficient Model for Evaluating Gas Field GatheringSystem Design,” Journal of Petroleum Technology 23,no. 9 (September 1971): 1067–1073.
> Avocet Integrated Asset Modeler interface. Each of the individual simulations in the Avocet softwarecan be integrated into a flow diagram that represents the total integrated asset model. Displays of combined results from all of the simulations are available in either graphical or tabular form.
60906sckD4R1.qxp:60906sckD4R1 2/16/08 12:59 AM Page 21
flow rates and pressures match throughout thecoupled system (left). The asset simulator thentakes another time step and repeats theprocedure, alternating in this way until thedesired field life is reached. At each time step,system constraints are propagated upstream anddownstream between the models and theirrespective simulators. Although Avocet softwaredevelops solutions using this general approach,the final combination of simulators will dependon the complexity and nature of the problemunder consideration.
The most rigorous location for coupling at anode point is at the bottom of a well, and, formost systems, coupling at the bottom will alsorequire the most computing time.10 As thecoupling point moves to the wellhead and intothe other parts of the network, computationaltime generally decreases. Bottomhole couplingmay not be prac tical or possible for analysis ofhighly complex fields, and the coupling pointmay need to be moved toward the surface.
In addition to coupling location, choice ofcompositional constraints will also affect thesimulator’s computing time and convergence. Forreservoirs where the effects of fluid compositionon flow characteristics are not critical, a three-component model known as the ECLIPSEBlackoil finite-difference simulation may beappropriate. This model assumes the reservoirhas oil, gas and water in a three-phase system. Afour-component system can also be consideredfor modeling a reservoir when injected fluids aremiscible with reservoir hydrocarbons.
For complex hydrocarbon systems, explicitcompositional simula tion is also available.Explicit compositional simulation may be theright option when an equation of state isrequired to describe reservoir fluid behaviorchanges with depth. This model may be the bestchoice for systems involving condensates,volatile crude oils, heavy oils, gas injection andsecondary recovery. There is enough flexibility inthe simulations to allow multiple reservoirs withdifferent component models to be connected to asurface network (left). All of these choices plusother constraints will determine how the Avocetsoftware is set up to solve a given problem.
Once the model has been properly configured,it offers a clear path for end-to-end field optimi -zation. Feed-forward and feedback effects arehandled by driving the model to a convergedsolution.11 Open architecture eliminates software-version issues, while the ability to communicatewith remote computers enables cross-disciplinarycollaboration and optimal use of computinghardware.12 All these factors taken together allow
22 Oilfield Review
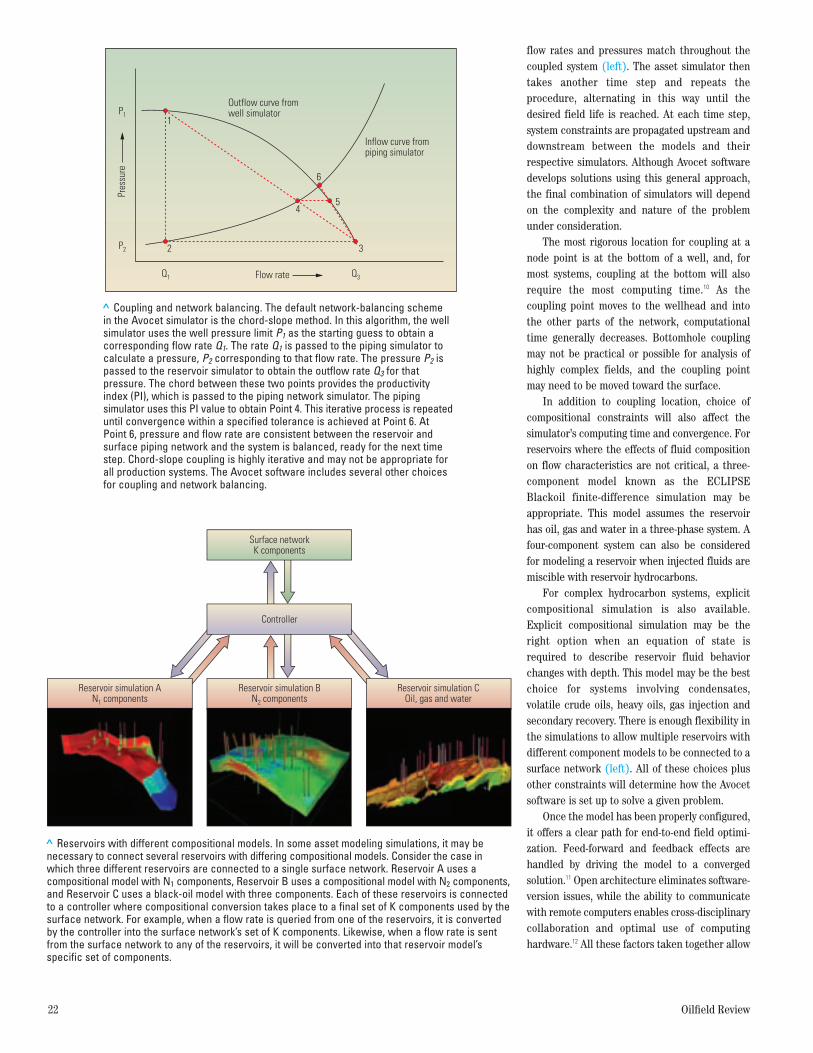
> Coupling and network balancing. The default network-balancing scheme in the Avocet simulator is the chord-slope method. In this algorithm, the wellsimulator uses the well pressure limit P1 as the starting guess to obtain acorresponding flow rate Q1. The rate Q1 is passed to the piping simulator tocalculate a pressure, P2 corresponding to that flow rate. The pressure P2 ispassed to the reservoir simulator to obtain the outflow rate Q3 for thatpressure. The chord between these two points provides the productivityindex (PI), which is passed to the piping network simulator. The pipingsimulator uses this PI value to obtain Point 4. This iterative process is repeateduntil convergence within a specified tolerance is achieved at Point 6. AtPoint 6, pressure and flow rate are consistent between the reservoir andsurface piping network and the system is balanced, ready for the next timestep. Chord-slope coupling is highly iterative and may not be appropriate forall production systems. The Avocet software includes several other choicesfor coupling and network balancing.
P1
Q1
1
2 3
45
Inflow curve frompiping simulator
Outflow curve fromwell simulator
6
Q3
P2
Pres
sure
Flow rate
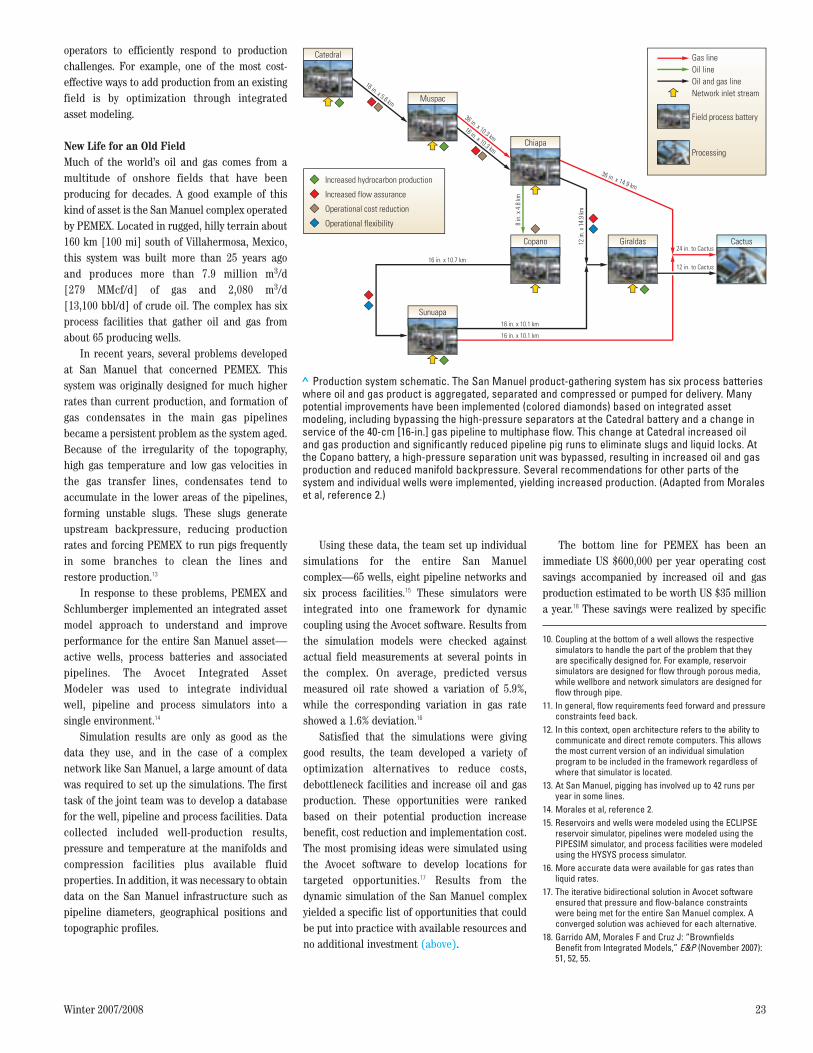
> Reservoirs with different compositional models. In some asset modeling simulations, it may benecessary to connect several reservoirs with differing compositional models. Consider the case inwhich three different reservoirs are connected to a single surface network. Reservoir A uses acompositional model with N1 components, Reservoir B uses a compositional model with N2 components,and Reservoir C uses a black-oil model with three components. Each of these reservoirs is connectedto a controller where compositional conversion takes place to a final set of K components used by thesurface network. For example, when a flow rate is queried from one of the reservoirs, it is convertedby the controller into the surface network’s set of K components. Likewise, when a flow rate is sentfrom the surface network to any of the reservoirs, it will be converted into that reservoir model’sspecific set of components.
Reservoir simulation AN1 components
Reservoir simulation BN2 components
Controller
Surface networkK components
Reservoir simulation COil, gas and water
60906sckD4R1.qxp:60906sckD4R1 2/16/08 12:59 AM Page 22
Winter 2007/2008 23
operators to efficiently respond to productionchallenges. For example, one of the most cost-effective ways to add production from an existingfield is by optimization through integrated asset modeling.
New Life for an Old FieldMuch of the world’s oil and gas comes from amultitude of onshore fields that have beenproducing for decades. A good example of thiskind of asset is the San Manuel complex operatedby PEMEX. Located in rugged, hilly terrain about160 km [100 mi] south of Villahermosa, Mexico,this system was built more than 25 years ago and produces more than 7.9 million m3/d[279 MMcf/d] of gas and 2,080 m3/d[13,100 bbl/d] of crude oil. The complex has sixprocess facilities that gather oil and gas fromabout 65 producing wells.
In recent years, several problems developedat San Manuel that concerned PEMEX. Thissystem was originally designed for much higherrates than current production, and formation ofgas condensates in the main gas pipelinesbecame a persistent problem as the system aged.Because of the irregularity of the topography,high gas temperature and low gas velocities inthe gas transfer lines, condensates tend toaccumulate in the lower areas of the pipelines,forming unstable slugs. These slugs generateupstream backpressure, reducing productionrates and forcing PEMEX to run pigs frequentlyin some branches to clean the lines and restore production.13
In response to these problems, PEMEX andSchlumberger implemented an integrated assetmodel approach to understand and improveperformance for the entire San Manuel asset—active wells, process batteries and associatedpipelines. The Avocet Integrated Asset Modeler was used to integrate individual well, pipeline and process simulators into asingle environment.14
Simulation results are only as good as thedata they use, and in the case of a complexnetwork like San Manuel, a large amount of datawas required to set up the simulations. The firsttask of the joint team was to develop a databasefor the well, pipeline and process facilities. Datacollected included well-production results,pressure and temperature at the manifolds andcompression facilities plus available fluidproperties. In addition, it was necessary to obtaindata on the San Manuel infrastructure such aspipeline diameters, geographical positions andtopographic profiles.
Using these data, the team set up individualsimulations for the entire San Manuelcomplex—65 wells, eight pipeline networks andsix process facilities.15 These simulators wereintegrated into one framework for dynamiccoupling using the Avocet software. Results fromthe simulation models were checked againstactual field measurements at several points inthe complex. On average, predicted versusmeasured oil rate showed a variation of 5.9%,while the corresponding variation in gas rateshowed a 1.6% deviation.16
Satisfied that the simulations were givinggood results, the team developed a variety ofoptimization alternatives to reduce costs,debottleneck facilities and increase oil and gasproduction. These opportunities were rankedbased on their potential production increasebenefit, cost reduction and implementation cost.The most promising ideas were simulated usingthe Avocet software to develop locations fortargeted opportunities.17 Results from thedynamic simulation of the San Manuel complexyielded a specific list of opportunities that couldbe put into practice with available resources andno additional investment (above).
The bottom line for PEMEX has been animmediate US $600,000 per year operating costsavings accompanied by increased oil and gasproduction estimated to be worth US $35 milliona year.18 These savings were realized by specific
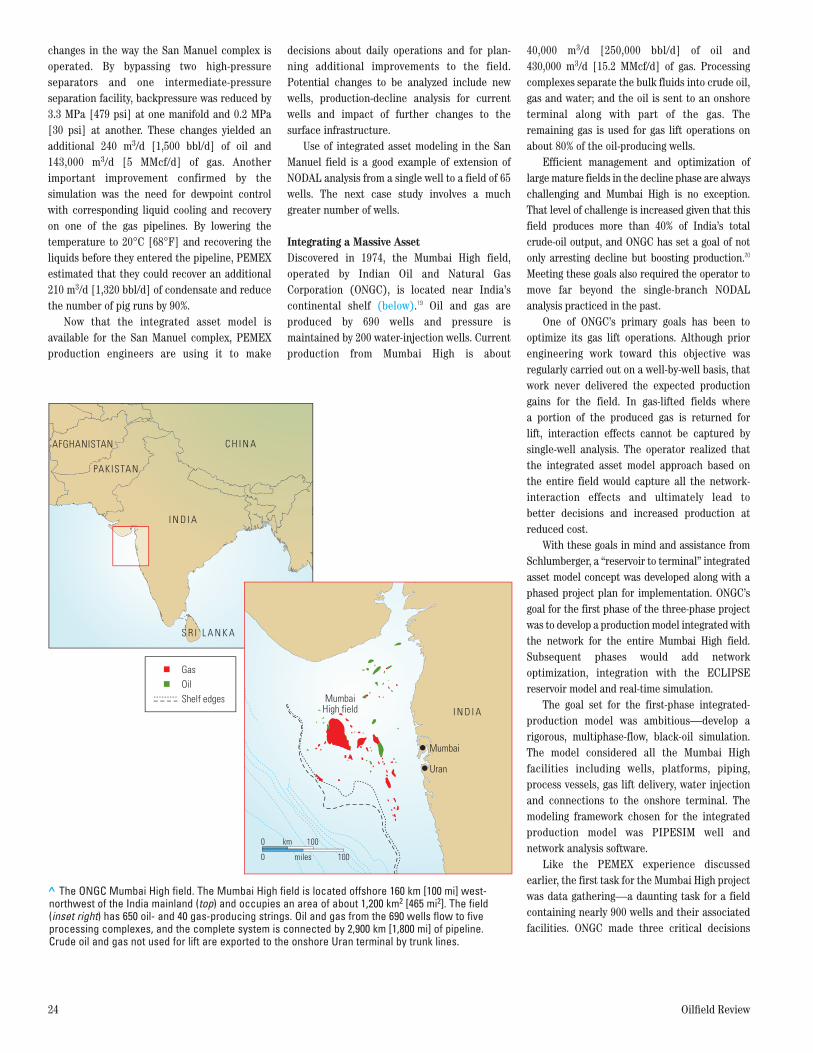
> Production system schematic. The San Manuel product-gathering system has six process batterieswhere oil and gas product is aggregated, separated and compressed or pumped for delivery. Manypotential improvements have been implemented (colored diamonds) based on integrated assetmodeling, including bypassing the high-pressure separators at the Catedral battery and a change inservice of the 40-cm [16-in.] gas pipeline to multiphase flow. This change at Catedral increased oiland gas production and significantly reduced pipeline pig runs to eliminate slugs and liquid locks. Atthe Copano battery, a high-pressure separation unit was bypassed, resulting in increased oil and gasproduction and reduced manifold backpressure. Several recommendations for other parts of thesystem and individual wells were implemented, yielding increased production. (Adapted from Moraleset al, reference 2.)
Catedral
Chiapa
Copano
Muspac
Giraldas Cactus
Sunuapa
Gas lineOil lineOil and gas lineNetwork inlet stream
Field process battery
Processing
16 in. x 5.6 km
36 in. x 10.3 km16 in. x 10.3 km
36 in. x 14.9 km
24 in. to Cactus
12 in. to Cactus16 in. x 10.7 km
16 in. x 10.1 km
16 in. x 10.1 km
12 in
. x 1
4.9
km
8 in
. x 4
.8 k
m
Increased hydrocarbon production
Increased flow assurance
Operational cost reduction
Operational flexibility
10. Coupling at the bottom of a well allows the respectivesimulators to handle the part of the problem that theyare specifically designed for. For example, reservoirsimulators are designed for flow through porous media,while wellbore and network simulators are designed forflow through pipe.
11. In general, flow requirements feed forward and pressureconstraints feed back.
12. In this context, open architecture refers to the ability tocommunicate and direct remote computers. This allowsthe most current version of an individual simulationprogram to be included in the framework regardless ofwhere that simulator is located.
13. At San Manuel, pigging has involved up to 42 runs peryear in some lines.
14. Morales et al, reference 2.15. Reservoirs and wells were modeled using the ECLIPSE
reservoir simulator, pipelines were modeled using thePIPESIM simulator, and process facilities were modeledusing the HYSYS process simulator.
16. More accurate data were available for gas rates thanliquid rates.
17. The iterative bidirectional solution in Avocet softwareensured that pressure and flow-balance constraintswere being met for the entire San Manuel complex. Aconverged solution was achieved for each alternative.
18. Garrido AM, Morales F and Cruz J: “Brownfields Benefit from Integrated Models,” E&P (November 2007):51, 52, 55.
60906sckD4R1.qxp:60906sckD4R1 2/16/08 12:59 AM Page 23
changes in the way the San Manuel complex isoperated. By bypassing two high-pressureseparators and one intermediate-pressureseparation facility, backpressure was reduced by3.3 MPa [479 psi] at one manifold and 0.2 MPa[30 psi] at another. These changes yielded anadditional 240 m3/d [1,500 bbl/d] of oil and143,000 m3/d [5 MMcf/d] of gas. Anotherimportant improvement confirmed by thesimulation was the need for dewpoint controlwith corresponding liquid cooling and recoveryon one of the gas pipelines. By lowering thetemperature to 20°C [68°F] and recovering theliquids before they entered the pipeline, PEMEXestimated that they could recover an additional210 m3/d [1,320 bbl/d] of condensate and reducethe number of pig runs by 90%.
Now that the integrated asset model isavailable for the San Manuel complex, PEMEXproduction engineers are using it to make
decisions about daily operations and for plan -ning additional improvements to the field.Potential changes to be analyzed include newwells, production-decline analysis for currentwells and impact of further changes to thesurface infrastructure.
Use of integrated asset modeling in the SanManuel field is a good example of extension ofNODAL analysis from a single well to a field of 65wells. The next case study involves a muchgreater number of wells.
Integrating a Massive AssetDiscovered in 1974, the Mumbai High field,operated by Indian Oil and Natural GasCorporation (ONGC), is located near India’scontinental shelf (below).19 Oil and gas areproduced by 690 wells and pressure ismaintained by 200 water-injection wells. Currentproduction from Mumbai High is about
40,000 m3/d [250,000 bbl/d] of oil and430,000 m3/d [15.2 MMcf/d] of gas. Processingcomplexes separate the bulk fluids into crude oil,gas and water; and the oil is sent to an onshoreterminal along with part of the gas. Theremaining gas is used for gas lift operations onabout 80% of the oil-producing wells.
Efficient management and optimization oflarge mature fields in the decline phase are alwayschallenging and Mumbai High is no exception.That level of challenge is increased given that thisfield produces more than 40% of India’s totalcrude-oil output, and ONGC has set a goal of notonly arresting decline but boosting production.20
Meeting these goals also required the operator tomove far beyond the single-branch NODALanalysis practiced in the past.
One of ONGC’s primary goals has been tooptimize its gas lift operations. Although priorengineering work toward this objective wasregularly carried out on a well-by-well basis, thatwork never delivered the expected productiongains for the field. In gas-lifted fields where a portion of the produced gas is returned for lift, interaction effects cannot be captured bysingle-well analysis. The operator realized thatthe integrated asset model approach based onthe entire field would capture all the network-interaction effects and ultimately lead to better decisions and increased production atreduced cost.
With these goals in mind and assistance fromSchlumberger, a “reservoir to terminal” inte gratedasset model concept was developed along with aphased project plan for implementation. ONGC’sgoal for the first phase of the three-phase projectwas to develop a production model integrated withthe network for the entire Mumbai High field.Subsequent phases would add networkoptimization, integration with the ECLIPSEreservoir model and real-time simulation.
The goal set for the first-phase integrated-production model was ambitious—develop arigorous, multiphase-flow, black-oil simulation.The model considered all the Mumbai Highfacilities including wells, platforms, piping,process vessels, gas lift delivery, water injectionand connections to the onshore terminal. Themodeling framework chosen for the integratedproduction model was PIPESIM well andnetwork analysis software.
Like the PEMEX experience discussedearlier, the first task for the Mumbai High projectwas data gathering—a daunting task for a fieldcontaining nearly 900 wells and their associatedfacilities. ONGC made three critical decisions
24 Oilfield Review
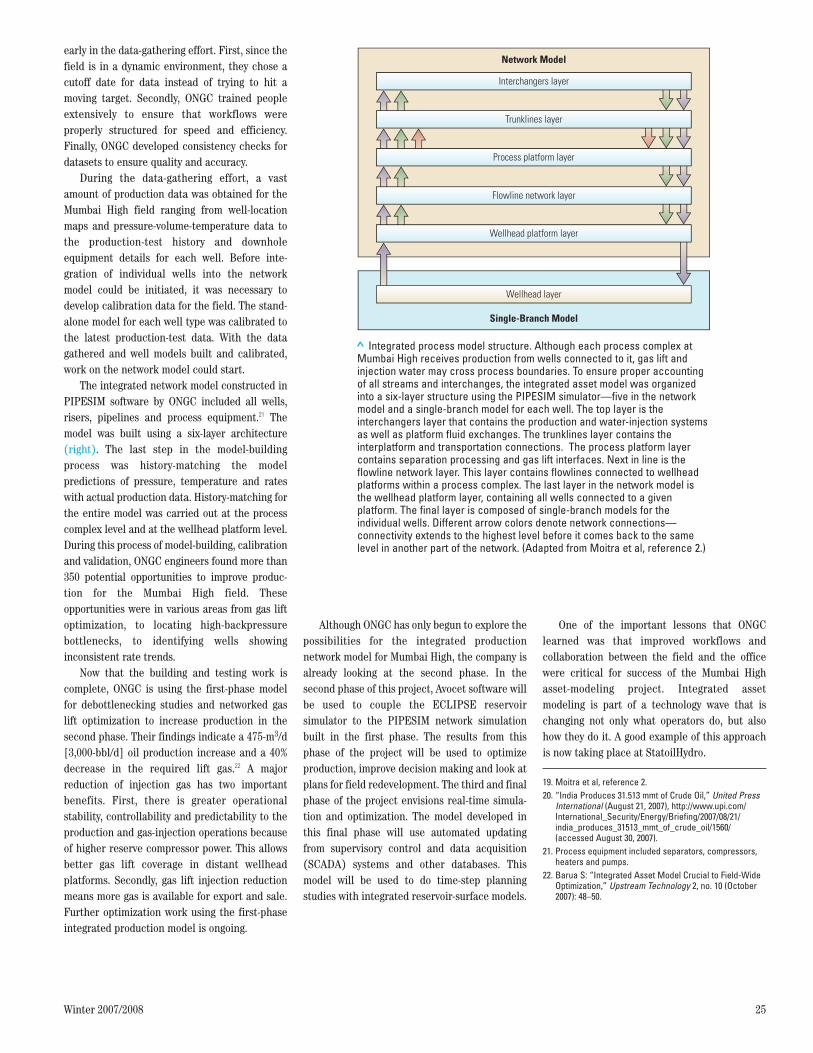
> The ONGC Mumbai High field. The Mumbai High field is located offshore 160 km [100 mi] west-northwest of the India mainland (top) and occupies an area of about 1,200 km2 [465 mi2]. The field(inset right) has 650 oil- and 40 gas-producing strings. Oil and gas from the 690 wells flow to fiveprocessing complexes, and the complete system is connected by 2,900 km [1,800 mi] of pipeline.Crude oil and gas not used for lift are exported to the onshore Uran terminal by trunk lines.
AFGHANISTAN C H I N A
PAKISTAN
I N D I A
S R I L A N K A
Mumbai
Uran
I N D I AMumbai
High field
GasOilShelf edges
0 100km
0 100miles
60906sckD4R1.qxp:60906sckD4R1 2/16/08 12:59 AM Page 24
Winter 2007/2008 25
early in the data-gathering effort. First, since thefield is in a dynamic environment, they chose acutoff date for data instead of trying to hit amoving target. Secondly, ONGC trained peopleextensively to ensure that workflows wereproperly structured for speed and efficiency.Finally, ONGC developed consistency checks fordatasets to ensure quality and accuracy.
During the data-gathering effort, a vastamount of production data was obtained for theMumbai High field ranging from well-locationmaps and pressure-volume-temperature data tothe production-test history and downholeequipment details for each well. Before inte -gration of individual wells into the networkmodel could be initiated, it was necessary todevelop calibration data for the field. The stand-alone model for each well type was calibrated tothe latest production-test data. With the datagathered and well models built and calibrated,work on the network model could start.
The integrated network model constructed inPIPESIM software by ONGC included all wells,risers, pipelines and process equipment.21 Themodel was built using a six-layer architecture(right). The last step in the model-buildingprocess was history-matching the modelpredictions of pressure, temperature and rateswith actual production data. History-matching forthe entire model was carried out at the processcomplex level and at the wellhead platform level.During this process of model-building, calibrationand validation, ONGC engineers found more than350 potential opportunities to improve produc -tion for the Mumbai High field. Theseopportunities were in various areas from gas liftoptimization, to locating high-backpressurebottlenecks, to identifying wells showinginconsistent rate trends.
Now that the building and testing work iscomplete, ONGC is using the first-phase modelfor debottlenecking studies and networked gaslift optimization to increase production in thesecond phase. Their findings indicate a 475-m3/d[3,000-bbl/d] oil production increase and a 40%decrease in the required lift gas.22 A majorreduction of injection gas has two importantbenefits. First, there is greater operationalstability, controllability and predictability to theproduction and gas-injection operations becauseof higher reserve compressor power. This allowsbetter gas lift coverage in distant wellheadplatforms. Secondly, gas lift injection reductionmeans more gas is available for export and sale.Further optimization work using the first-phaseintegrated production model is ongoing.
Although ONGC has only begun to explore thepossibilities for the integrated productionnetwork model for Mumbai High, the company isalready looking at the second phase. In thesecond phase of this project, Avocet software willbe used to couple the ECLIPSE reservoirsimulator to the PIPESIM network simulationbuilt in the first phase. The results from thisphase of the project will be used to optimizeproduction, improve decision making and look atplans for field redevelopment. The third and finalphase of the project envisions real-time simula -tion and optimization. The model developed inthis final phase will use automated updatingfrom supervisory control and data acquisition(SCADA) systems and other databases. Thismodel will be used to do time-step planningstudies with integrated reservoir-surface models.
One of the important lessons that ONGClearned was that improved workflows andcollaboration between the field and the officewere critical for success of the Mumbai Highasset-modeling project. Integrated assetmodeling is part of a technology wave that ischanging not only what operators do, but alsohow they do it. A good example of this approachis now taking place at StatoilHydro.
19. Moitra et al, reference 2.20. “India Produces 31.513 mmt of Crude Oil,” United Press
International (August 21, 2007), http://www.upi.com/International_Security/Energy/Briefing/2007/08/21/india_produces_31513_mmt_of_crude_oil/1560/(accessed August 30, 2007).
21. Process equipment included separators, compressors,heaters and pumps.
22. Barua S: “Integrated Asset Model Crucial to Field-WideOptimization,” Upstream Technology 2, no. 10 (October2007): 48–50.
> Integrated process model structure. Although each process complex atMumbai High receives production from wells connected to it, gas lift andinjection water may cross process boundaries. To ensure proper accountingof all streams and interchanges, the integrated asset model was organizedinto a six-layer structure using the PIPESIM simulator—five in the networkmodel and a single-branch model for each well. The top layer is theinterchangers layer that contains the production and water-injection systemsas well as platform fluid exchanges. The trunklines layer contains theinterplatform and transportation connections. The process platform layercontains separation processing and gas lift interfaces. Next in line is theflowline network layer. This layer contains flowlines connected to wellheadplatforms within a process complex. The last layer in the network model isthe wellhead platform layer, containing all wells connected to a givenplatform. The final layer is composed of single-branch models for theindividual wells. Different arrow colors denote network connections—connectivity extends to the highest level before it comes back to the samelevel in another part of the network. (Adapted from Moitra et al, reference 2.)
Interchangers layer
Network Model
Trunklines layer
Process platform layer
Flowline network layer
Single-Branch Model
Wellhead platform layer
Wellhead layer
60906sckD4R1.qxp:60906sckD4R1 2/16/08 12:59 AM Page 25
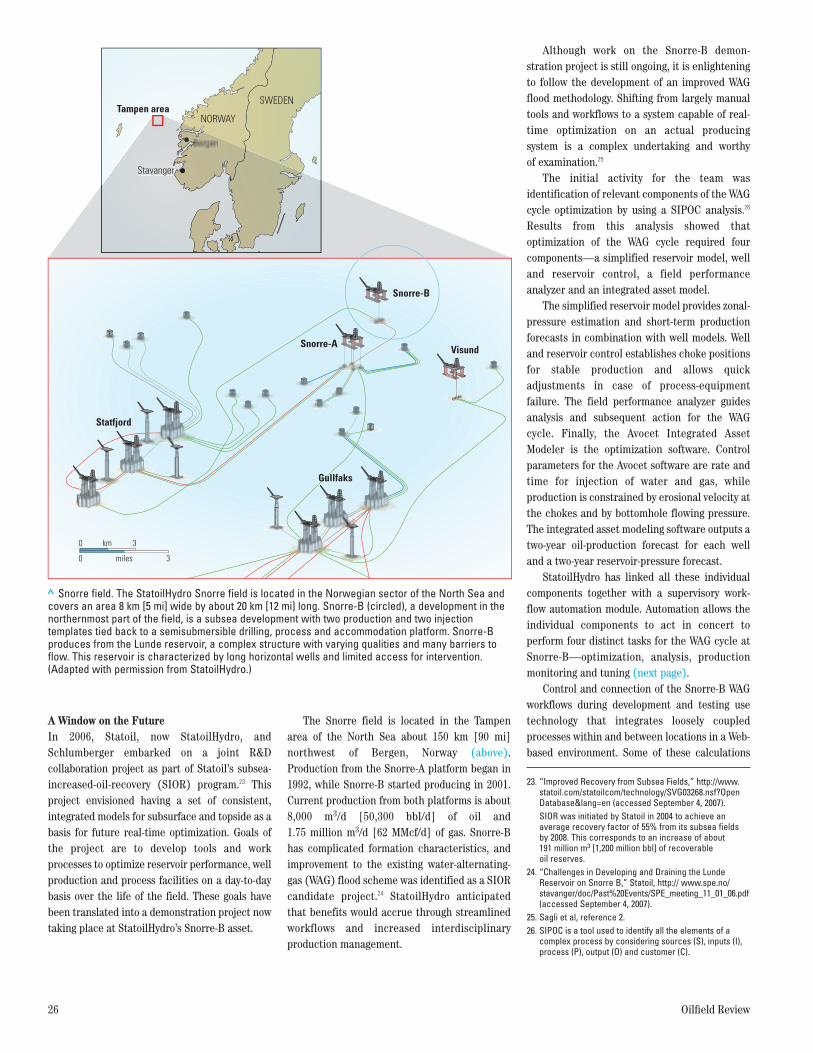
A Window on the FutureIn 2006, Statoil, now StatoilHydro, andSchlumberger embarked on a joint R&Dcollaboration project as part of Statoil’s subsea-increased-oil-recovery (SIOR) program.23 Thisproject envisioned having a set of consistent,integrated models for subsurface and topside as abasis for future real-time optimi zation. Goals ofthe project are to develop tools and workprocesses to optimize reservoir performance, wellproduction and process facilities on a day-to-daybasis over the life of the field. These goals havebeen translated into a demonstration project nowtaking place at StatoilHydro’s Snorre-B asset.
The Snorre field is located in the Tampenarea of the North Sea about 150 km [90 mi]north west of Bergen, Norway (above).Production from the Snorre-A platform began in1992, while Snorre-B started producing in 2001.Current production from both platforms is about8,000 m3/d [50,300 bbl/d] of oil and 1.75 million m3/d [62 MMcf/d] of gas. Snorre-Bhas complicated formation characteristics, andimprovement to the existing water-alternating-gas (WAG) flood scheme was identified as a SIORcandidate project.24 StatoilHydro anticipatedthat benefits would accrue through streamlinedworkflows and increased interdisciplinaryproduction management.
Although work on the Snorre-B demon -stration project is still ongoing, it is enlighteningto follow the development of an improved WAGflood methodology. Shifting from largely manualtools and workflows to a system capable of real-time optimization on an actual producing system is a complex undertaking and worthy of examination.25
The initial activity for the team wasidentification of relevant components of the WAGcycle optimization by using a SIPOC analysis.26
Results from this analysis showed thatoptimization of the WAG cycle required fourcomponents—a simplified reservoir model, welland reservoir control, a field performanceanalyzer and an integrated asset model.
The simplified reservoir model provides zonal-pressure estimation and short-term productionforecasts in combination with well models. Welland reservoir control establishes choke positionsfor stable production and allows quickadjustments in case of process-equipmentfailure. The field performance analyzer guidesanalysis and subsequent action for the WAGcycle. Finally, the Avocet Integrated AssetModeler is the optimization software. Controlparameters for the Avocet software are rate andtime for injection of water and gas, whileproduction is constrained by erosional velocity atthe chokes and by bottomhole flowing pressure.The integrated asset modeling software outputs atwo-year oil-production forecast for each welland a two-year reservoir-pressure forecast.
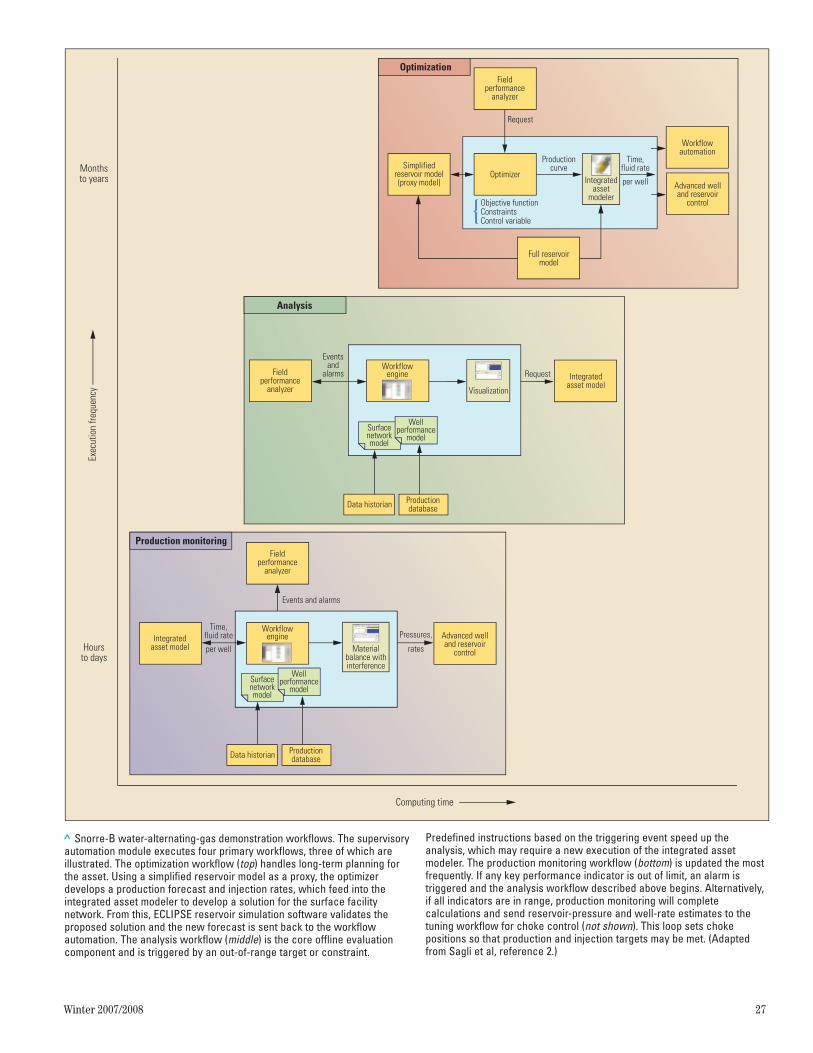
StatoilHydro has linked all these individualcomponents together with a supervisory work -flow automation module. Automation allows theindividual components to act in concert toperform four distinct tasks for the WAG cycle atSnorre-B—optimization, analysis, productionmonitoring and tuning (next page).
Control and connection of the Snorre-B WAGworkflows during development and testing usetechnology that integrates loosely coupledprocesses within and between locations in a Web-based environment. Some of these calculations
26 Oilfield Review
> Snorre field. The StatoilHydro Snorre field is located in the Norwegian sector of the North Sea andcovers an area 8 km [5 mi] wide by about 20 km [12 mi] long. Snorre-B (circled), a development in thenorthernmost part of the field, is a subsea development with two production and two injectiontemplates tied back to a semisubmersible drilling, process and accommodation platform. Snorre-Bproduces from the Lunde reservoir, a complex structure with varying qualities and many barriers toflow. This reservoir is characterized by long horizontal wells and limited access for intervention.(Adapted with permission from StatoilHydro.)
Stavanger
Tampen areaNORWAY
SWEDEN
Stavanger
Snorre-A
Snorre-B
Visund
Gullfaks
Statfjord
0 3km
0 3miles
23. “Improved Recovery from Subsea Fields,” http://www.statoil.com/statoilcom/technology/SVG03268.nsf?OpenDatabase&lang=en (accessed September 4, 2007).SIOR was initiated by Statoil in 2004 to achieve anaverage recovery factor of 55% from its subsea fields by 2008. This corresponds to an increase of about191 million m3 [1,200 million bbl] of recoverable oil reserves.
24. “Challenges in Developing and Draining the LundeReservoir on Snorre B,” Statoil, http:// www.spe.no/stavanger/doc/Past%20Events/SPE_meeting_11_01_06.pdf(accessed September 4, 2007).
25. Sagli et al, reference 2.26. SIPOC is a tool used to identify all the elements of a
complex process by considering sources (S), inputs (I),process (P), output (O) and customer (C).
60906sckD4R1.qxp:60906sckD4R1 2/16/08 12:59 AM Page 26
Winter 2007/2008 27
> Snorre-B water-alternating-gas demonstration workflows. The supervisoryautomation module executes four primary workflows, three of which areillustrated. The optimization workflow (top) handles long-term planning forthe asset. Using a simplified reservoir model as a proxy, the optimizerdevelops a production forecast and injection rates, which feed into theintegrated asset modeler to develop a solution for the surface facilitynetwork. From this, ECLIPSE reservoir simulation software validates theproposed solution and the new forecast is sent back to the workflowautomation. The analysis workflow (middle) is the core offline evaluationcomponent and is triggered by an out-of-range target or constraint.
Predefined instructions based on the triggering event speed up theanalysis, which may require a new execution of the integrated assetmodeler. The production monitoring workflow (bottom) is updated the mostfrequently. If any key performance indicator is out of limit, an alarm istriggered and the analysis workflow described above begins. Alternatively,if all indicators are in range, production monitoring will completecalculations and send reservoir-pressure and well-rate estimates to thetuning workflow for choke control (not shown). This loop sets chokepositions so that production and injection targets may be met. (Adaptedfrom Sagli et al, reference 2.)
Request Integratedasset model
Workflowengine
Visualization
Fieldperformance
analyzer
Eventsand
alarms
Data historian Productiondatabase
Surfacenetworkmodel
Wellperformance
model
Materialbalance withinterference
Data historian Productiondatabase
Surfacenetworkmodel
Wellperformance
model
Fieldperformance
analyzer
Events and alarms
Time,fluid rate
per well
Pressures,
rates
Advanced welland reservoir
control
Integratedasset model
Workflowengine
Production monitoring
Monthsto years
Exec
utio
n fre
quen
cy
Computing time
Hoursto days
Analysis
Fieldperformance
analyzer
Optimizer
Production curve
Request
Workflowautomation
Advanced welland reservoir
control
Simplifiedreservoir model(proxy model)
Objective functionConstraintsControl variable
Integratedasset
modeler
Full reservoirmodel
Optimization
Time,fluid rate
per well
60906sckD4R1.qxp:60906sckD4R1 2/22/08 7:16 PM Page 27
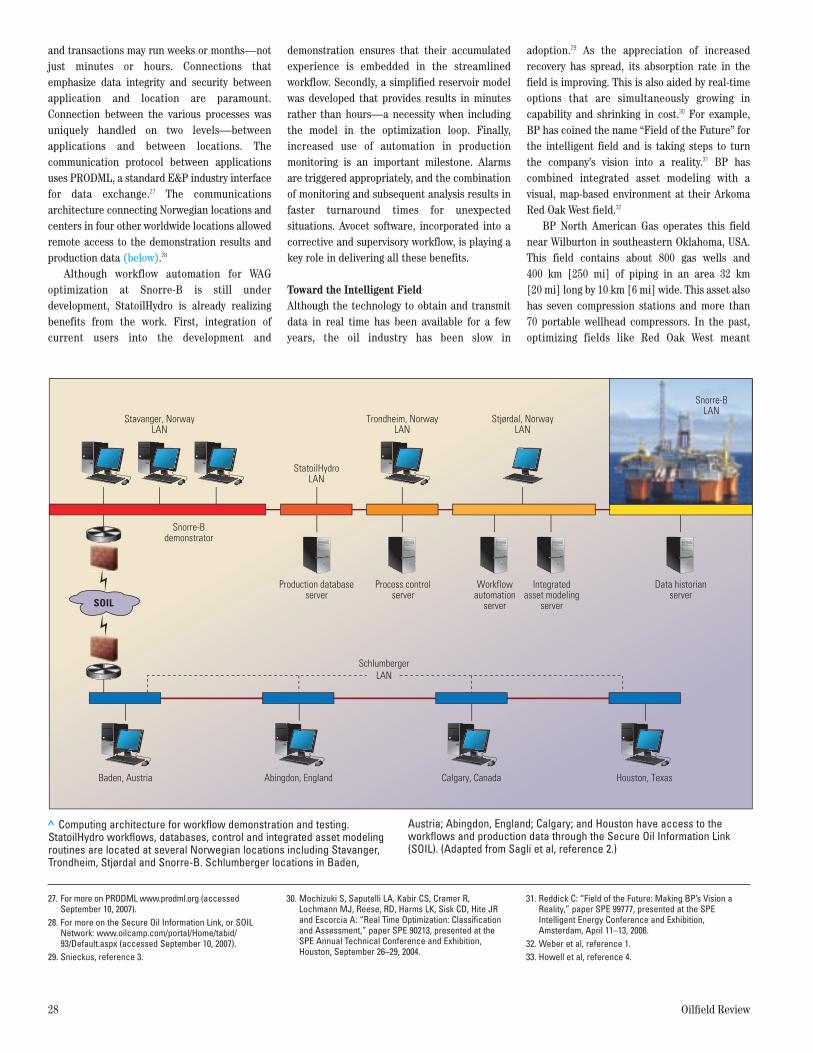
and transactions may run weeks or months—notjust minutes or hours. Connections thatemphasize data integrity and security betweenapplication and location are paramount.Connection between the various processes wasuniquely handled on two levels—betweenapplications and between locations. Thecommunication protocol between applicationsuses PRODML, a standard E&P industry interfacefor data exchange.27 The communicationsarchitecture connecting Norwegian locations andcenters in four other worldwide locations allowedremote access to the demonstration results andproduction data (below).28
Although workflow automation for WAGoptimization at Snorre-B is still underdevelopment, StatoilHydro is already realizingbenefits from the work. First, integration ofcurrent users into the development and
demonstration ensures that their accumulatedexperience is embedded in the streamlinedworkflow. Secondly, a simplified reservoir modelwas developed that provides results in minutesrather than hours—a necessity when includingthe model in the optimization loop. Finally,increased use of automation in productionmonitoring is an important milestone. Alarmsare triggered appropriately, and the combinationof monitoring and subsequent analysis results infaster turnaround times for unexpectedsituations. Avocet software, incorporated into acorrective and supervisory workflow, is playing akey role in delivering all these benefits.
Toward the Intelligent FieldAlthough the technology to obtain and transmitdata in real time has been available for a fewyears, the oil industry has been slow in
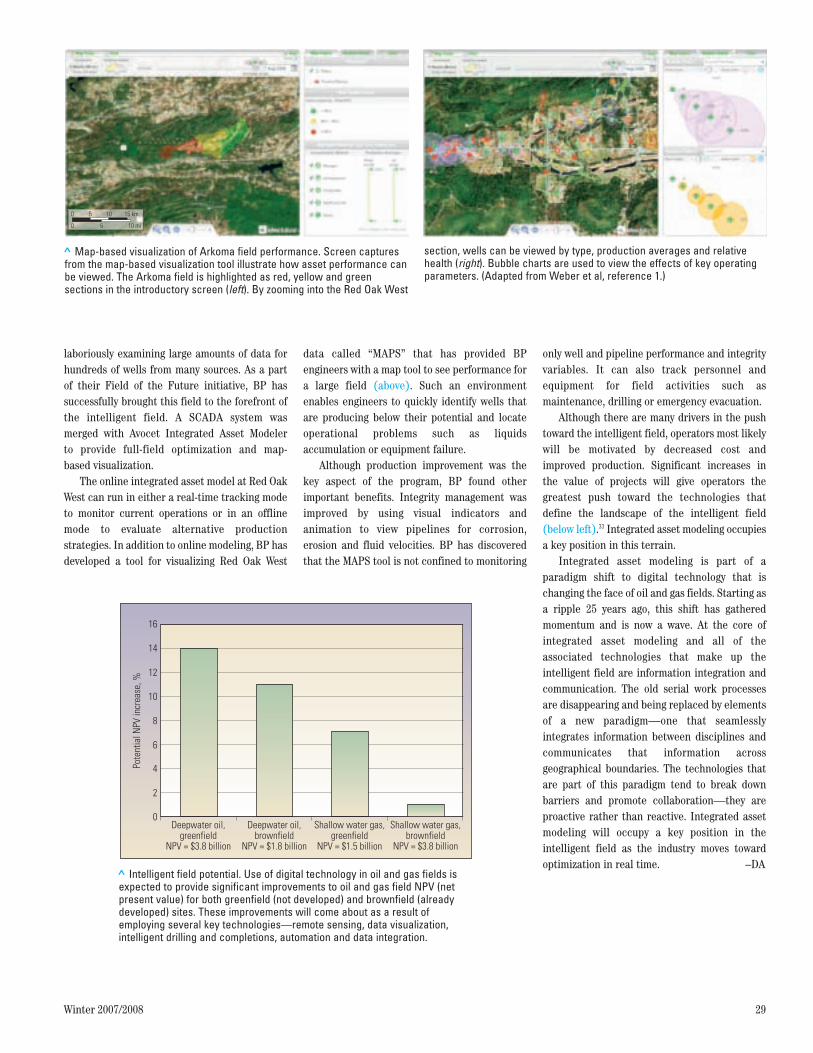
adoption.29 As the appreciation of increasedrecovery has spread, its absorption rate in thefield is improving. This is also aided by real-timeoptions that are simultaneously growing incapability and shrinking in cost.30 For example,BP has coined the name “Field of the Future” forthe intelligent field and is taking steps to turnthe company’s vision into a reality.31 BP hascombined integrated asset modeling with avisual, map-based environment at their ArkomaRed Oak West field.32
BP North American Gas operates this fieldnear Wilburton in southeastern Oklahoma, USA.This field contains about 800 gas wells and400 km [250 mi] of piping in an area 32 km[20 mi] long by 10 km [6 mi] wide. This asset alsohas seven compression stations and more than70 portable wellhead compressors. In the past,optimizing fields like Red Oak West meant
28 Oilfield Review
27. For more on PRODML www.prodml.org (accessedSeptember 10, 2007).
28. For more on the Secure Oil Information Link, or SOILNetwork: www.oilcamp.com/portal/Home/tabid/93/Default.aspx (accessed September 10, 2007).
29. Snieckus, reference 3.
30. Mochizuki S, Saputelli LA, Kabir CS, Cramer R,Lochmann MJ, Reese, RD, Harms LK, Sisk CD, Hite JRand Escorcia A: “Real Time Optimization: Classificationand Assessment,” paper SPE 90213, presented at theSPE Annual Technical Conference and Exhibition,Houston, September 26–29, 2004.
31. Reddick C: “Field of the Future: Making BP’s Vision aReality,” paper SPE 99777, presented at the SPEIntelligent Energy Conference and Exhibition,Amsterdam, April 11–13, 2006.
32. Weber et al, reference 1.33. Howell et al, reference 4.
> Computing architecture for workflow demonstration and testing.StatoilHydro workflows, databases, control and integrated asset modelingroutines are located at several Norwegian locations including Stavanger,Trondheim, Stjørdal and Snorre-B. Schlumberger locations in Baden,
Austria; Abingdon, England; Calgary; and Houston have access to theworkflows and production data through the Secure Oil Information Link(SOIL). (Adapted from Sagli et al, reference 2.)
Stavanger, NorwayLAN
Snorre-Bdemonstrator
Trondheim, NorwayLAN
Baden, Austria Abingdon, England Calgary, Canada Houston, Texas
SchlumbergerLAN
Stjørdal, NorwayLAN
Snorre-BLAN
StatoilHydroLAN
Production databaseserver
Process controlserver
Workflowautomation
server
Integratedasset modeling
server
Data historianserver
SOIL
60906sckD4R1.qxp:60906sckD4R1 2/16/08 12:59 AM Page 28
Winter 2007/2008 29
laboriously examining large amounts of data forhundreds of wells from many sources. As a part of their Field of the Future initiative, BP hassuccessfully brought this field to the forefront ofthe intelligent field. A SCADA system wasmerged with Avocet Integrated Asset Modeler to provide full-field optimization and map-based visualization.
The online integrated asset model at Red OakWest can run in either a real-time tracking modeto monitor current operations or in an offlinemode to evaluate alternative productionstrategies. In addition to online modeling, BP hasdeveloped a tool for visualizing Red Oak West
data called “MAPS” that has provided BPengineers with a map tool to see performance fora large field (above). Such an environmentenables engineers to quickly identify wells thatare producing below their potential and locateoperational problems such as liquidsaccumulation or equipment failure.
Although production improvement was thekey aspect of the program, BP found otherimportant benefits. Integrity management wasimproved by using visual indicators andanimation to view pipelines for corrosion,erosion and fluid velocities. BP has discoveredthat the MAPS tool is not confined to monitoring
only well and pipeline performance and integrityvariables. It can also track personnel andequipment for field activities such asmaintenance, drilling or emergency evacuation.
Although there are many drivers in the pushtoward the intelligent field, operators most likelywill be motivated by decreased cost andimproved production. Significant increases inthe value of projects will give operators thegreatest push toward the technologies thatdefine the landscape of the intelligent field(below left).33 Integrated asset modeling occupiesa key position in this terrain.
Integrated asset modeling is part of aparadigm shift to digital technology that ischanging the face of oil and gas fields. Starting asa ripple 25 years ago, this shift has gatheredmomentum and is now a wave. At the core ofintegrated asset modeling and all of theassociated technologies that make up theintelligent field are information integration andcommunication. The old serial work processesare disappearing and being replaced by elementsof a new paradigm—one that seamlesslyintegrates information between disciplines andcommunicates that information acrossgeographical boundaries. The technologies thatare part of this paradigm tend to break downbarriers and promote collaboration—they areproactive rather than reactive. Integrated assetmodeling will occupy a key position in theintelligent field as the industry moves towardoptimization in real time. –DA
> Map-based visualization of Arkoma field performance. Screen capturesfrom the map-based visualization tool illustrate how asset performance canbe viewed. The Arkoma field is highlighted as red, yellow and greensections in the introductory screen (left). By zooming into the Red Oak West
section, wells can be viewed by type, production averages and relativehealth (right). Bubble charts are used to view the effects of key operatingparameters. (Adapted from Weber et al, reference 1.)
0
0 5 10 15 km
5 10 mi
> Intelligent field potential. Use of digital technology in oil and gas fields isexpected to provide significant improvements to oil and gas field NPV (netpresent value) for both greenfield (not developed) and brownfield (alreadydeveloped) sites. These improvements will come about as a result ofemploying several key technologies—remote sensing, data visualization,intelligent drilling and completions, automation and data integration.
16
12
14
10
6
8
Pote
ntia
l NPV
incr
ease
, %
Deepwater oil,greenfield
NPV = $3.8 billion
Deepwater oil,brownfield
NPV = $1.8 billion
Shallow water gas,greenfield
NPV = $1.5 billion
Shallow water gas,brownfield
NPV = $3.8 billion
2
4
0
60906sckD4R1.qxp:60906sckD4R1 2/16/08 12:59 AM Page 29