Embed Size (px)
Citation preview

Optimizing Interaction Force for Global Anomaly Detection in Crowded Scenes
R. Raghavendra1 Alessio Del Bue1 Marco Cristani 1,2 Vittorio Murino 1,2
Istituto Italiano di Tecnologia (IIT), Italy1
Dipartimento di Informatica, University of Verona, Italy2
Abstract
This paper presents a novel method for global anomaly
detection in crowded scenes. The proposed method intro-
duces the Particle Swarm Optimization (PSO) method as a
robust algorithm for optimizing the interaction force com-
puted using the Social Force Model (SFM). The main ob-
jective of the proposed method is to drift the population of
particles towards the areas of the main image motion. Such
displacement is driven by the PSO fitness function aimed at
minimizing the interaction force, so as to model the most
diffused and typical crowd behavior. Experiments are ex-
tensively conducted on public available datasets, namely,
UMN and PETS 2009, and also on a challenging dataset
of videos taken from Internet. The experimental results re-
vealed that the proposed scheme outperforms all the avail-
able state-of-the-art algorithms for global anomaly detec-
tion.
1. Introduction
Crowd analysis has become a popular topic in computer
vision applications that involves the analysis of human be-
havior from a surveillance context. This is because conven-
tional methods designed for surveillance applications fail
drastically for the following reasons: (1) overlapping be-
tween individual subjects; (2) random variations in the den-
sity of people over time; (3) low resolution videos with tem-
poral variations of the scene background.
The main objective of crowd behavior analysis involves
not only the modeling of people mass dynamics but also to
detect or even predict possible abnormal behaviors in the
scene. In particular for surveillance scenarios, this task is
of paramount importance since early detection, or even pre-
diction, may reduce the possible dangerous consequences
of a threatening event, or may alert a human operator for
inspecting more carefully the ongoing situation.
Anomaly detection in crowded scenes can be classified
into two types, namely [6]: (1) local abnormal event, indi-
cating that behavior of a local image area is different from
that of its neighbors in spatio-temporal terms; (2) global ab-
normal event, corresponding to an anomaly of the whole
scene. In this work, we address the latter issue, by con-
sidering its application to more realistic scenario than the
standard acted scenes in the available public datasets, such
as detecting anomalies in prison scenes.
Several works have been proposed for global anomaly
detection in crowded scenes [11, 13, 14, 10], where the ma-
jority are based on particle advection schemes. In this case,
a rectangular grid of particles is typically placed on each
frame and advected using the underlying motion. These
schemes are quite useful since they do not need the seg-
mentation, detection or tracking of individuals that are very
challenging tasks in crowd scenes. The first work using par-
ticle advection schemes for crowd behavior analysis was in-
troduced in [13]. Here, the particle flow is computed by
moving a grid of particles using the fourth-order Runge-
Kutta-Fehlberg algorithm [9] along with the bilinear inter-
polation of the optical flow field. This method is further ex-
tended in [14] using chaotic invariants capable of analyzing
both coherent and incoherent scenes. In [10], streaklines are
introduced and integrated with a particle advection scheme
capable of incorporating the spatial change in the particle
flow. In [11] the social force model (SFM) [7] is exploited
to detect abnormal events. After the superposition of a fixed
grid of particles on each frame, the SFM is used to esti-
mate the interaction force under the belief that it can por-
tray significant information to describe (abnormal) crowd
behavior. So, after estimating the so-called force flow, a
bag of words method [3] and a Latent Dirichlet Allocation
(LDA) [4] are employed to discriminate between normal
and abnormal frames, while localizing the abnormal areas
as those showing the highest force magnitude. In addition
to the above mentioned particle advection schemes, there
also exist a few model-based approaches facing the same
problem. In [12], 3D bricks are extracted and used as a de-
scriptor to represent the scene, and followed by a dynamic
programming algorithm aimed at detecting the anomaly. In
[6], a sparse reconstruction cost is proposed to detect the
presence of anomalies in crowded scenes. Here, the normal

dictionary to measure the abnormality of the test sample is
constructed using local spatio-temporal patches. Further, to
reduce the size of the dictionary, a new selection method is
proposed based on sparsity consistency constraints.
In this paper, we propose a new scheme for global
anomaly detection by performing particle advection us-
ing Partical Swarm Optimization (PSO) and Social Force
Model (SFM). The proposed process starts from random
positioned particles over each frame, assuming that the in-
teraction force (obtained using SFM) is discriminant for
characterizing crowd behavior. However, unlike previous
algorithms, this force is not straightforwardly utilized in a
classification framework to detect the anomalies [11], but it
is further processed to augment its discriminant properties.
After the force flow estimation, we apply a minimization
process aimed at optimizing the position of the particles at
each frame, so that particles converge naturally towards the
significant moving areas in the scene, and in particular to-
wards the parts which likely show a higher magnitude of
interaction force. Then, we estimate the evolution of the
interaction force frame by frame in order to identify the oc-
currence of the global anomaly in a crowded scenario.
There are several characteristic features which differen-
tiate our approach with respect to other related works in the
literature [11, 13, 14, 10]. First, particles are spread ran-
domly over the image and can move in a continuous way
according to an optimization criterion. Second, we use PSO
[8] for particle advection which considers not only the in-
dividual particle motion, but also the global motion of the
particles as a whole, i.e. it “simulates” in some way social
interactions among the particles. In addition, this model
has proved to outperform the other approaches considered
the state of the art for global anomaly detection when tested
on a set of public video datasets and of real videos retrieved
in the Internet.
The rest of the paper is organized as follows. Section
2 discusses the proposed algorithm by first introducing the
basic notions of PSO and SFM. Section 3 presents the re-
sults on public available databases as well as on a set of
real videos taken from Internet. Finally, Section 4 draws
the conclusions and sketches future work.
2. The proposed algorithm
Figure 1 shows the various stages followed in the design
of the proposed framework for global anomaly detection.
The proposed scheme consists of two main components: (1)
particle advection using PSO-SFM, and (2) global anomaly
detection.
2.1. Particle advection using PSOSFM
This section describes our proposed particle advection
using PSO-SFM. In earlier attempts [11, 13], the particle
advection is carried out by placing a rectangular grid of
particles over each video frame. Then, the velocity for
each particle is calculated using fourth-order Runge-Kutta-
Fehlberg algorithm [9] along with the bilinear interpolation
of the optical flow field. In general, a drawback of this
approach is that it assumes that a crowd follows a fluid-
dynamical model which is too restrictive when modeling
masses of people. The elements of the crowd may also
move with unpredictable trajectories that will result in an
unstructured flow. Moreover, the use of a rectangular grid
for particles is a coarse approximation with respect to the
continuous evolution of the social force. To overcome these
drawbacks, we propose a novel particle advection using
PSO aiming at modeling the crowd behavior. Before pre-
senting the detailed description about our proposed scheme,
we first provide brief introduction on PSO and SFM in the
following subsections.
Particle Swarm Optimization Particle Swarm Opti-
mization is a stochastic, iterative, population-based opti-
mization technique aimed at finding a solution to an op-
timization problem in a search space [8]. The main ob-
jective of PSO is to optimize a given criterion function
called fitness function f . PSO is initialized with a pop-
ulation, namely a swarm, of N-dimensional particles dis-
tributed randomly over the search space: each particle is so
considered as a point in this N-dimensional space and the
optimization process manages to move the particles accord-
ing to the evaluation of the fitness function in an iterative
way. More specifically, at each iteration, each particle is
updated according to best values called pbesti that is de-
pending on the i− th particle and gbest that is independent
from the specific particle i.e. gbest is valid for the whole
swarm. The pbesti value represents the best position as-
sociated with the best (i.e., minimum or maximum) fitness
value of particle i obtained at each iteration, and having fit-
ness value f(pbesti). The gbest value represents the best
position among all the particles in the swarm, i.e. the po-
sition of the particle assuming the minimum or maximum
value when evaluated by the fitness function. The rate of
the position change (velocity) for the particle i is called vi,
which is updated according to the following equations [8]:
vnewi = IW · vold
i + C1 · rand1 · (pbesti − xoldi )
+C2 · rand2 · (gbest − xoldi ); (1)
xnewi = xold
i + vnewi , (2)
where IW is the inertia weight, whose value should be tuned
to provide a good balance between global and local explo-
rations, and it may result in fewer iterations on average for
finding near optimal soluction. The scalar values C1 and
C2 are acceleration parameters used to drive each particle
towards pbesti and gbest. Low values of C1 and C2 allow

Particle Advection Global Anomaly Detection
VideoParticle
Advection --
PSOSFM
Change in Magnitude of
Interaction Force
Moving
Average
Filtering
Threshold
Particle Advection
Using PSO-SFMGlobal Anomaly Detection
Normal
Anomaly
Figure 1. Proposed framework for global anomaly detection
the particles to roam far from target regions, while high val-
ues result in abrupt movements towards the target regions.
rand1 and rand2 are random numbers between 0 and 1.
Finally, xoldi and xnew
i are the current and updated particle
positions, respectively, and the same applies for the devia-
tion voldi and vnew
i .
Social Force Model The SFM [7] provides a mathemat-
ical formalization to describe the movement of each indi-
vidual in a crowd on the basis of its interaction with the
environment and other obstacles. The SFM can be written
as:
mi
dWi
dt= mi
(
Wpi − Wi
τi
)
+ Fint, (3)
where mi denotes the mass of the individual, Wi indicates
its actual velocity which varies given the presence of obsta-
cles in the scene, τi is a relaxing parameter, Fint indicates
the interaction force experienced by the individual which is
defined as the sum of attraction and repulsive forces, and
Wpi is the desired velocity of the individual.
PSO and SFM constitute the basic elements used to de-
velop our model for crowd behavior analysis which will be
described in the following section.
2.2. Our approach
First, given a video sequence, the PSO begins with a ran-
dom initialization of the particles in the first frame. From
such initial stage, we obtain a first guess of pbesti for each
particle i and the global gbest. The particles are defined by
their 2-D value corresponding to the pixel coordinates in the
frames. At each iteration, the pbesti value is updated only
if the present position of the particle is better than the previ-
ous position according to fitness function evaluated on the
model interaction force. Finally, the gbest is updated with
the position obtained from the best pbesti after reaching the
maximum number of iterations or if the desired fitness value
is achieved. We then use the final particle positions as the
initial guess in the next frame and the same iterative process
is repeated until the end of the video sequence. Therefore,
the movement of the particles is updated according to the
fitness function which drives the particle towards the areas
of minimum interaction force.
Fitness function The fitness function aims at capturing
the best interaction force exhibited by each movement in
the crowded scene. Each particle is evaluated according to
its interaction force calculated using SFM and optical flow
[5]. The Optical Flow (OF) is actually a suitable candidate
to substitute the pedestrian velocities in the SFM model.
In order to use the OF jointly with SFM, we first define
the intensity of the optical flow computed at a given position
in the image for the particle i as:
Wi = Oavg(xnewi ), (4)
where Oavg(xnewi ) indicates the average OF at the particle
coordinates xnewi . The average is computed over L previous
frames. Then, the desired velocity of the particle Wpi is
defined as:
Wpi = O(xnew
i ), (5)
where O(xnewi ) represents the OF intensity of the particle
i, whose coordinates are estimated using equation (1). In
fact, this OF value is an average value computed in a small
spatial neighborhood to avoid numerical instabilities of the
OF. Finally, we calculate the interaction force Fint using
equation 3 as follows:
Fint(xnewi ) = mi ·
dWi
dt−
mi
τi
(W pi − Wi) , (6)
where the velocity derivative is approximated as the differ-
ence of the OF at the current frame t and t − 1, that isdWi
dt= [O(xnew
i )|t − O(xnewi )|t−1]. As observed from
equation (3), the interaction force allows an individual to
change its movement from the desired path to the actual

one. This process is in some way mimicked by the parti-
cles which are driven by the OF towards the image areas of
larger motion. In this way, the more regular the pedestri-
ans’ motion, the less the interaction force, since the people
motion flow varies smoothly. So, in a normal crowded sce-
nario the interaction force is expected to stabilize at a certain
(low) value complying the typical motion flow of the mass
of people. It is then reasonable to define a fitness function
aimed at minimizing the interaction force, and moving par-
ticles towards these sinks of small interaction force, thereby
allowing particles to simulate a “normal” situation of the
crowd.
Algorithm 1: Particle Advection using SFM-PSO
Input: Oavg and O // Average optical flow and opti-
cal flow computed for the whole set of video frames
Initialization: {vi}k
i=1, {xi}
k
i=1// Initial particle ve-
locity and position and k is the number of particles.
pbesti // Initial local best position
gbest // Initial global best position
for Frame = 1 : No. of Frames do
while Iter ≤ maxiter and Fint(gbest) <
BestF it do
for i = 1 : k do
Calculate Fint using Equation (6)
if Fint(xnewi ) < Fint(pbesti) then
pbesti = xnewi
end if
end for // Particles loop
Set gbest = argmini {pbesti}Estimate new positions for particles using equa-
tion (1) and (2)
end while
Output: Optimized interaction forces and
new particles’ positions.
end for // Frames loop
Hence, we can write our fitness function as:
FitX = mini
{Fint (xnewi )} (7)
where, xi denotes the i − th particle. The proposed PSO-
SFM scheme is summarized in Algorithm 1 where maxiter
indicates the maximum number of iterations employed and
BestF it indicates the desired fitness value which is set to
0 in our case.
As an example, Figure 2 (a) - (d) shows the computed
interaction force with the proposed particle advection using
PSO-SFM for both normal (Figure 2 (a)-(b)) and anomaly
video frames (Figure 2 (c)-(d)). In the figures, we map
on the image plane the magnitude of the interaction forces
assigned to every particle. As observed in Figure 2, the
presence of the high magnitude interaction force over time
Normal
(a)(a)
(b)
Abnormal
(c)(c)
(d)
Figure 2. Illustration of the proposed scheme. (a) input nor-
mal frame. (b) Interaction force corresponding to (a). (c) Input
anomaly frame. (d) Interaction force corresponding to (c).
can provide useful information about the existence of an
anomaly. Thus, in this case, we expect the particles to have
high magnitude interaction force overall.
2.3. Global anomaly detection
Our framework allows to formulate the detection of
global anomalies as the detection of the changes in the in-
teraction force magnitude. This process is valid with the
proposed particle advection scheme since the presence of
global abnormality can be distinguished by the presence of
high magnitude of the interaction force assumed by the par-
ticles (see Figure 2). Since all the available test videos con-
tains a certain amount of frames in which normal behavior
is assumed, we take advantage of this information in the
comparison process, like all the other previous algorithms
[11]. In practice, we carry out the following steps to decide
whether a given frame contains an anomaly or not:
1. First, compute the sum of the interaction forces of a
reference frame Fr. This reference frame(s) represents
a normal behavior scene in the given video sequence.
Actually, all the public datasets considered have an ini-
tial (variable, but at least one frame) set of frames rep-
resenting a normal behavior which can be used for ref-
erence. Thus, we obtain Fr as follows:
Fr =k
∑
i=1
Fint(xnewi )|r (8)
2. Compute the sum of interaction forces corresponding
to all particles in the current frame Ft as:
Ft =k
∑
i=1
Fint(xnewi )|t (9)

3. Compute the change in the magnitude force at each
frame t as:
Ct = |Ft − Fr| (10)
4. Repeat steps 2 - 3 for all frames to obtain the profile
(values of Ct for all the video frames) corresponding
to the change of the force magnitude.
5000
0 100 200 300 400 500 6000
500
1000
1500
2000
2500
3000
3500
4000
4500
5000
Number of frames
Pr
(P
rofile
)
(a)(a)
2500
0 100 200 300 400 500 6000
500
1000
1500
2000
2500
Number of frames
SP
(S
mo
oth
en
pro
file
)
(b)(b)
Figure 3. Profile (a) Before Smoothing (b) After Smoothing
As an example, Figure 3(a) shows the profile obtained
from a sequence of the UMN dataset after following
the above mentioned steps 1 - 4.
5. Finally, we use the moving average filter to smooth out
the short term fluctuations that are present in the ob-
tained profile at the previous step, so to get a smoothed
profile Cst (see Figure 3(b)). Each frame is then classi-
fied as either normal or abnormal according to a thresh-
old as follows:
Lt =
{
Abnormal if Cst > th
Normal otherwise
where Cst represents the smoothed profile, th repre-
sents a threshold value, and Lt holds the final detection
result of the given video sequence.
3. Experiments and discussion
To validate the performance of the proposed approach
for global anomaly detection, we conducted an exten-
sive set of experiments on four different datasets such
as UMN [2], PETS 2009 [1], UCF [11], and prison riot
dataset (collected from the web).
In the following experiments, all the video frames are
resized to a fixed width of 200 × 200 pixels. For the
particle advection scheme, the particle density (i.e., the
number of particles) is kept constant at 25% of num-
ber of pixels, and number of iterations is fixed to 100.
To detect the changes of the interaction force magni-
tude, we use the first frame as the reference frame.
This is because, in all the following datasets, the ini-
tial (roughly) 40% of the video frames represents the
normal behavior which is then followed by the abnor-
mal behavioral frames. Finally, the performance is val-
idated by plotting the ROC curves obtained over all
possible values of the threshold th.
3.1. UMN Dataset
The UMN dataset consists of eleven video sequences
acquired in three different crowded scenarios including
both indoor and outdoor scenes. All these sequences
exhibit a escape panic scenario and hence, they start
with the normal behavior frames followed by the ab-
normal activity. Figure 4 illustrates the results of the
proposed scheme obtained on the UMN dataset. Fig-
ure 4(a) shows the normal and abnormal crowd be-
havior frames from the dataset, and Figure 4(b) indi-
cates the corresponding interaction force obtained us-
ing the proposed PSO-SFM based particle advection.
From this figure, it can be observed that the presence
of high magnitude of the majority of the particles in-
teraction force is an evidence that an abnormal frame
has occurred. Figure 4(c) shows the detection results
of the normal and abnormal frames from the dataset
using step 5 of the proposed global anomaly detection
algorithm. Figure 5 shows the detection results ob-
Normal
(a)
(b)
(c)
N
Abnormal
(a)
(b)
(c)
A
Figure 4. Computed Force Flow obtained on example sequence.
(a) Input frame. (b) Force field. (c) Detection (N indicates Normal
and A indicates Abnormal frame)
tained on two different sequences of the UMN dataset
showing that at abnormal frames always correspond a
higher magnitude of interaction force in the particles.
Figure 6 and 7 show the performance of the pro-
posed scheme on three different scenes of UMN and
of the whole dataset, respectively. The quantitative re-
sults shown in Table 1 indicate the best performance
of the proposed scheme over available state-of-the-art
methods.

(a)
(b(b
(c
(d
(a)
(b)
N
N
A
(b)
(c)
(d)
N
A
Figure 5. Results of the proposed scheme on other sequences of
the UMN dataset. (a) Normal behavior in scene 2 with its cor-
responding interaction force and detection.(b) Abnormal behavior
in scene 2 with its corresponding interaction force and detection.
(c) Normal behavior in scene 3 with its corresponding interaction
force and detection. (d) Abnormal behavior in scene 3 with its
corresponding interaction force and detection.
Figure 6. ROC Curves of abnormal behavior detection on different
scenes in UMN dataset
3.2. Prison Riot Dataset
In order to evaluate the proposed method on real ap-
plications, we collected a real video set from websites
such as YouTube and ThoughtEquity.com. The col-
lected video dataset comprises of 7 sequences that rep-
resent riots in prisons that are captured with different
angles, resolutions, background and include abnormal-
ity like fighting with each other, clashing, etc.. All
the collected sequences start with the normal behavior
which is then followed by a sequence of abnormal be-
havioral frames. Figure 8 shows the interaction force
obtained on the frames from this dataset. Figure 9 il-
Figure 7. ROC performance on UMN dataset
Table 1. Performance of proposed scheme on UMN dataset
Method Area Under ROC
Optical Flow [11] 0.84Social Force [11] 0.96
Chaotic Invariants [14] 0.99NN [6] 0.93
Sparse Reconstruction (Scene 1) [6] 0.995Sparse Reconstruction (Scene 2) [6] 0.975Sparse Reconstruction (Scene 3) [6] 0.964
Sparse Reconstruction (Full Dataset) [6] 0.978Proposed Scheme (Scene 1) 0.9961Proposed Scheme (Scene 2) 0.9932Proposed Scheme (Scene 3) 0.9991
Proposed Scheme (Full Dataset) 0.9961
Table 2. Performance of the proposed scheme on the Prison dataset
Method Area Under ROC
Optical Flow 0.5801Proposed Scheme (Full Dataset) 0.8903
lustrates the performance of the proposed method on
some frames of the different sequences in this dataset.
The ROC curves in Figure 10 demonstrates that the
proposed method outperforms optical flow methods in
distinguishing the abnormal sequences from the nor-
mal ones. The quantitative results of this comparison
are reported in Table 2.
3.3. Results on PETS 2009 Dataset
This section describes the result obtained on PETS
2009 ’S3’ dataset. This dataset is different from the
other dataset used in this paper, in the sense that abnor-
mality begins smoothly and this makes the detection
more challenging because of the gradual transaction

(a)
(b)
(c)
(d)
N
N
A
N
A
Figure 8. Results of the proposed scheme on the prison dataset.
(a) Normal behavior frame and its corresponding interaction force
and detection result on sequence 1. (b) Abnormal behavior frame
and its corresponding interaction force and detection result on se-
quence 1. (c) Normal behavior frame and its corresponding in-
teraction force and detection result on sequence 2. (d) Abnormal
behavior frame and its corresponding interaction force and detec-
tion result on sequence 2.
Figure 9. ROC curve of abnormal behavior detection in the differ-
ent sequences of the Prison dataset
Table 3. Performance of proposed scheme on PETS 2009 dataset
Method Area Under ROC
Optical Flow Scene 1 0.8834Proposed Scheme Scene 1 0.9414
Optical Flow Scene 2 0.9801Proposed Scheme Scene 2 0.9914
from normal to abnormal activity. Figure 11 shows the
interaction force estimated using the proposed scheme
on PETS 2009 and Figure 12 shows the corresponding
Figure 10. ROC curves showing the comparison of proposed
scheme over optical flow method on the Prison dataset
(a)
(b)(b)
(c)
(d)
A
N
N
A
N
Figure 11. Samples frames from PETS 2009 dataset. (a) Input
frame from S3 (14-16). (b) The corresponding interaction force.
(c) Input frames from S3 (14-33. (d) The corresponding interac-
tion force.
Figure 12. The ROC curves of abnormal behavior detection in the
PETS 2009 database.
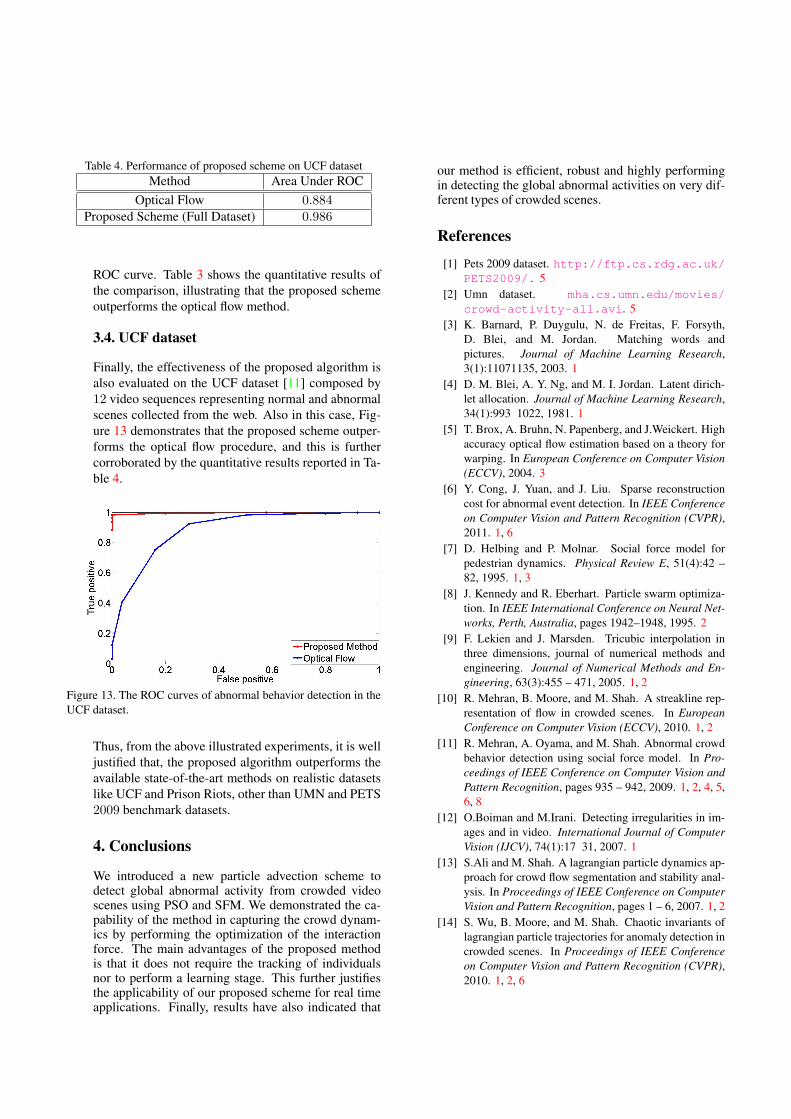
Table 4. Performance of proposed scheme on UCF dataset
Method Area Under ROC
Optical Flow 0.884Proposed Scheme (Full Dataset) 0.986
ROC curve. Table 3 shows the quantitative results of
the comparison, illustrating that the proposed scheme
outperforms the optical flow method.
3.4. UCF dataset
Finally, the effectiveness of the proposed algorithm is
also evaluated on the UCF dataset [11] composed by
12 video sequences representing normal and abnormal
scenes collected from the web. Also in this case, Fig-
ure 13 demonstrates that the proposed scheme outper-
forms the optical flow procedure, and this is further
corroborated by the quantitative results reported in Ta-
ble 4.
Figure 13. The ROC curves of abnormal behavior detection in the
UCF dataset.
Thus, from the above illustrated experiments, it is well
justified that, the proposed algorithm outperforms the
available state-of-the-art methods on realistic datasets
like UCF and Prison Riots, other than UMN and PETS
2009 benchmark datasets.
4. Conclusions
We introduced a new particle advection scheme todetect global abnormal activity from crowded videoscenes using PSO and SFM. We demonstrated the ca-pability of the method in capturing the crowd dynam-ics by performing the optimization of the interactionforce. The main advantages of the proposed methodis that it does not require the tracking of individualsnor to perform a learning stage. This further justifiesthe applicability of our proposed scheme for real timeapplications. Finally, results have also indicated that
our method is efficient, robust and highly performingin detecting the global abnormal activities on very dif-ferent types of crowded scenes.
References
[1] Pets 2009 dataset. http://ftp.cs.rdg.ac.uk/
PETS2009/. 5
[2] Umn dataset. mha.cs.umn.edu/movies/
crowd-activity-all.avi. 5
[3] K. Barnard, P. Duygulu, N. de Freitas, F. Forsyth,
D. Blei, and M. Jordan. Matching words and
pictures. Journal of Machine Learning Research,
3(1):11071135, 2003. 1
[4] D. M. Blei, A. Y. Ng, and M. I. Jordan. Latent dirich-
let allocation. Journal of Machine Learning Research,
34(1):993 1022, 1981. 1
[5] T. Brox, A. Bruhn, N. Papenberg, and J.Weickert. High
accuracy optical flow estimation based on a theory for
warping. In European Conference on Computer Vision
(ECCV), 2004. 3
[6] Y. Cong, J. Yuan, and J. Liu. Sparse reconstruction
cost for abnormal event detection. In IEEE Conference
on Computer Vision and Pattern Recognition (CVPR),
2011. 1, 6
[7] D. Helbing and P. Molnar. Social force model for
pedestrian dynamics. Physical Review E, 51(4):42 –
82, 1995. 1, 3
[8] J. Kennedy and R. Eberhart. Particle swarm optimiza-
tion. In IEEE International Conference on Neural Net-
works, Perth, Australia, pages 1942–1948, 1995. 2
[9] F. Lekien and J. Marsden. Tricubic interpolation in
three dimensions, journal of numerical methods and
engineering. Journal of Numerical Methods and En-
gineering, 63(3):455 – 471, 2005. 1, 2
[10] R. Mehran, B. Moore, and M. Shah. A streakline rep-
resentation of flow in crowded scenes. In European
Conference on Computer Vision (ECCV), 2010. 1, 2
[11] R. Mehran, A. Oyama, and M. Shah. Abnormal crowd
behavior detection using social force model. In Pro-
ceedings of IEEE Conference on Computer Vision and
Pattern Recognition, pages 935 – 942, 2009. 1, 2, 4, 5,
6, 8
[12] O.Boiman and M.Irani. Detecting irregularities in im-
ages and in video. International Journal of Computer
Vision (IJCV), 74(1):17 31, 2007. 1
[13] S.Ali and M. Shah. A lagrangian particle dynamics ap-
proach for crowd flow segmentation and stability anal-
ysis. In Proceedings of IEEE Conference on Computer
Vision and Pattern Recognition, pages 1 – 6, 2007. 1, 2
[14] S. Wu, B. Moore, and M. Shah. Chaotic invariants of
lagrangian particle trajectories for anomaly detection in
crowded scenes. In Proceedings of IEEE Conference
on Computer Vision and Pattern Recognition (CVPR),
2010. 1, 2, 6


![Anomaly Detection: Principles, Benchmarking, Explanation ...web.engr.oregonstate.edu/~tgd/...anomaly-detection... · Towards a Theory of Anomaly Detection [Siddiqui, et al.; UAI 2016]](https://img.pdfslide.us/doc/110x75/5fd8992320a65f059c333c6d/anomaly-detection-principles-benchmarking-explanation-webengr-tgdanomaly-detection.jpg)


![Deep Anomaly Detection - AiFrenzAI Friends]Deep Anomaly... · Deep Anomaly Detection Kang, Min-Guk Mingukkang1994@gmail.com Jan. 16, 2019 1/47](https://img.pdfslide.us/doc/110x75/5fb2a9a0b51b275c5a47b39a/deep-anomaly-detection-aifrenz-ai-friendsdeep-anomaly-deep-anomaly-detection.jpg)